william blair growth stock conference -...
TRANSCRIPT

WILLIAM BLAIRGROWTH STOCK CONFERENCE
June 14, 2017

Statements made in this presentation which are not statements of historical fact are forward-looking statements and are
subject to the safe harbor provisions created by the Private Securities Litigation Reform Act of 1995. Actual results may
differ from those expressed or implied in the company’s forward-looking statements. Zebra may elect to update forward-
looking statements but expressly disclaims any obligation to do so, even if the company’s estimates change. These
forward-looking statements are based on current expectations, forecasts and assumptions and are subject to the risks and
uncertainties inherent in Zebra’s industry, market conditions, general domestic and international economic conditions, and
other factors. These factors include customer acceptance of Zebra’s hardware and software products and competitors’
product offerings, and the potential effects of technological changes. The continued uncertainty over future global economic
conditions, the availability of credit, and capital markets volatility may have adverse effects on Zebra, its suppliers and its
customers. In addition, a disruption in our ability to obtain products from vendors as a result of supply chain constraints,
natural disasters or other circumstances could restrict sales and negatively affect customer relationships. Profits and
profitability will be affected by Zebra’s ability to control manufacturing and operating costs. Because of Zebra’s debt, interest
rates and financial market conditions will also have an impact on results. Foreign exchange rates will have an effect on
financial results because of the large percentage of our international sales. The outcome of litigation in which Zebra may be
involved is another factor. The success of integrating acquisitions could also affect profitability, reported results and the
company’s competitive position in it industry. These and other factors could have an adverse effect on Zebra’s sales, gross
profit margins and results of operations. Descriptions of the risks, uncertainties and other factors that could affect the
company’s future operations and results can be found in Zebra’s filings with the Securities and Exchange Commission. In
particular, please refer to Zebra’s latest filing of its Forms 10-K and 10-Q. This presentation includes certain non-GAAP
financial measures and we refer to the reconciliations to the comparable GAAP financial measures and related information.2
Safe Harbor Statement

3
Zebra: Compelling Investment Opportunity
Capitalizing on secular trends and technology transitions in growing markets
45+ years of technology innovation & expertise; enabling the more intelligent enterprise
Leader in Mobile Computing, Barcode Printing, Data Capture and RFID
Globally diverse partner & customer base, serving key industries
Attractive earnings expansion through sales growth, margin enhancement, and debt
reduction

45+ Years of Innovation
8First All-touch
Android
Inventory
SolutionFirst Rugged
Enterprise
Digital
Assistant
First Rugged
RFID Handheld
and First
Enterprise Digital
Assistant (EDA)
Initial Public
OfferingFounded as Data Specialties by
Ed Kaplan and Gary Cless
First Handheld Laser
Barcode Scanner
First Barcode
Printer
First Laser-Scannable
Two-dimensional Barcode
First Wearable
ComputerFirst Mobile RFID
Printing Solutions
First Smart
Environment for
Thermal Printers
First IoT Platform
for Enterprise
Applications
(Zatar)First Android-
based
Enterprise
Wearable
Computer
Only Migration Path to
Modem OS for Legacy
Windows Applications
1969 1982 1986 1991 1997 2004 2008 2013 2015 2016
4
Rebranded the company
as Zebra TechnologiesMotorola Solutions’ Enterprise
Business
Successful M&A Profitable growth Prudent deployment of capital

Global Market Leadership
5
MOBILE COMPUTING#1 SCANNING#1 RFID READERS#1
DESKTOP PRINTING#1 TABLETOP PRINTING#1 MOBILE PRINTING#1

6
Industry Leader Serving Enterprises Globally
Latin America North
America
EMEA
Asia
Pacific
Retail &
Ecommerce
Transportation &
Logistics
Manufacturing
Healthcare
Other Legacy Zebra
Solutions
Enterprise
Solutions
Sales By Geography Sales By Vertical Market Sales By Segment
$3.6BGlobal Sales
~6,500 Employees
Worldwide
~4,600US & Int’l Patents
Issued and Pending
~10,000 Channel Partners
Worldwide
~95%of the Fortune 500
served

7
Attractive Performance Post-Acquisition(1)
FY 2015 FY 2016FY 2017
Outlook(4)
Organic Net Sales Growth(2,3)
7.5% 0.4%Low- to mid-
single digit
Adjusted EBITDA Margin 16.2% 17.5% 18 – 19%
1. Refer to the appendix of this presentation for reconciliations of GAAP to non-GAAP financial results
2. Organic Net Sales Growth is calculated by translating, for certain currencies, the current period results at the currency exchange rates used in the comparable prior
year period, rather than the exchange rates in effect during the current period. In addition, we exclude the impact of the company’s foreign currency hedging
program in both the current and prior year periods.
3. The Company sold the wireless LAN business in October 2016. We are excluding the impact of the net sales of this business in the FY 2016 period when
computing organic net sales growth. FY 2015 growth uses estimated historical 2014 Enterprise sales and includes wireless LAN sales.
4. Outlook as of May 9, 2017 earnings announcement

8
Debt Reduction is Top Priority
$3.01B
$2.65B$2.57B
100
120
140
160
180
200
220
240
260
1.3
1.5
1.7
1.9
2.1
2.3
2.5
2.7
2.9
3.1
YE15
$192M
4.8x
YE16
$156M
4.1x
1Q17
$180M
3.8x
YE17
Financed October 2014 Enterprise acquisition with $3.25B of debt
Net-Debt-to-Adjusted EBITDA
Goal: ~3X
Cash & Cash Equivalents

9
Strategic Focus Post-Integration
Extend leadership and outpace the competition
Advance Enterprise Asset Intelligence solutions
Enhance financial strength and flexibility

10
CLOUD
Our Unique Value Proposition: Enterprise Asset Intelligence
MOBILITY
INTERNET OF THINGS
MEGATRENDS

11
Enabling the Intelligent Enterprise; Solving Unmet Needs
Simplify Operations and
Comply with Regulations
Empower Mobile Workers
Enhance Customer/Patient
Experience
Track Inventory / Supply ChainLocationing
RETAIL/
E-COMMERCET&L MANUFACTURINGHEALTHCARE
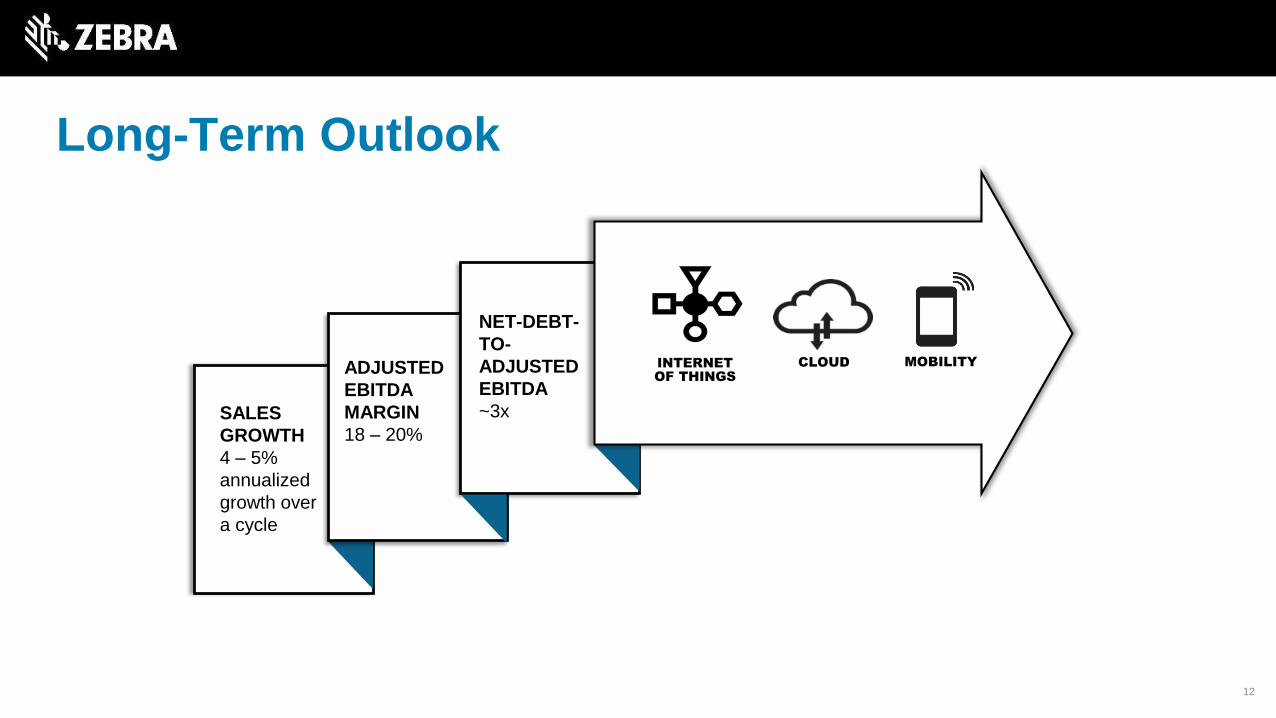
Long-Term Outlook
SALES
GROWTH
4 – 5%
annualized
growth over
a cycle
INTERNET
OF THINGS
CLOUD MOBILITYADJUSTED
EBITDA
MARGIN
18 – 20%
NET-DEBT-
TO-
ADJUSTED
EBITDA
~3x
12

13
Targeting 4-5% Annualized Sales Growth Over a Cycle
Core Markets
~$9B
3-4% Industry Growth
Adjacencies &
Solutions
$15B+ MarketsMobile Computing,
Scanning, Printing,
Services
Extending our leadership position
in core markets
Evolving the portfolio into solutions
Exploiting opportunities in
underpenetrated, faster-growing
adjacencies
$24B+

14
Zebra: Compelling Investment Opportunity
Capitalizing on secular trends and technology transitions in growing markets
45+ years of technology innovation & expertise; enabling the more intelligent enterprise
Leader in Mobile Computing, Barcode Printing, Data Capture and RFID
Globally diverse partner & customer base, serving key industries
Attractive earnings expansion through sales growth, margin enhancement, and debt
reduction

15
QUESTIONS?


APPENDIX
17

18
GAAP to Non-GAAP Reconciliation
ORGANIC NET SALES GROWTH
Twelve Months Ended
December 31, 2016
Reported Net sales decline (2.1) %
Adjustments:
Purchase accounting adjustments (0.2) %
Impact of wireless LAN Net sales (1) 1.4 %
Impact of foreign currency translation (2) 1.3 %
Organic Net sales growth 0.4 %
(1) The company sold the wireless LAN business in October 2016. We are excluding the impact of the net sales of this business in both the current and
prior year periods when computing organic net sales growth.
(2) Operating results reported in U.S. dollars are affected by foreign currency exchange rate fluctuations. We use the term “constant currency” to
represent certain results that have been adjusted to exclude the estimated impact of exchange rate fluctuations for certain foreign currencies.
Foreign currency impact represents the difference in results that are attributable to fluctuations in the currency exchange rates used to convert the results
for businesses where the functional currency is not the U.S. dollar. This impact is calculated by translating, for certain currencies, the current period
results at the currency exchange rates used in the comparable prior year period, rather than the exchange rates in effect during the current period. In addition, we exclude the impact of the company’s foreign currency hedging program in both the current and prior year periods.

19
GAAP to Non-GAAP Reconciliation
Twelve Months Ended
December 31,
2016
December 31,
2015
Net income (loss) (137)$ (158)$
Depreciation 75 69
Amortization of intangible assets 229 251
Total Other expense 209 217
Income tax expense (benefit) 8 (22)
EBITDA (Non-GAAP) 384 357
Adjustments to Net sales
Purchase accounting adjustments 10 16
Total adjustments to Net sales 10 16
Adjustments to Cost of sales
Purchase accounting adjustments — 4
Share-based compensation 2 3
Total adjustments to Cost of sales 2 7
Adjustments to Operating expenses
Acquisition and integration costs 125 145
Impairment of goodwill and other intangibles 62 —
Share-based compensation 26 30
Exit and restructuring costs 19 40
Total adjustments to Operating expenses 232 215
Total adjustments to EBITDA 244 238
Adjusted EBITDA (Non-GAAP) 628$ 595$
Net income (loss) % Net sales -3.8% -4.3%
Adjusted EBITDA % of Non-GAAP Sales 17.5% 16.2%
EBITDA