will ballard and elizabeth bales - sas customer...
TRANSCRIPT

One Report, Many Languages: Using SAS® Visual Analytics to Localize Your Reports Will Ballard and Elizabeth Bales
Technical Paper


One Report, Many Languages:
Using SAS® Visual Analytics to Localize Your Reports Will Ballard and Elizabeth Bales, SAS Institute Inc.
ABSTRACT Use SAS to communicate with your colleagues and customers anywhere in the world, even if you do not speak the same language! In today’s global economy, most of us can no longer assume that everyone in our company has an office in the same building, works in the same country, or speaks the same language. Although it is vital to quickly analyze and report on large amounts of data, we must present our reports in a way that our users can understand. Starting in SAS® Visual Analytics 7.1, new features give you the power to generate reports quickly and translate them easily so that your users can comprehend the results. This paper describes how SAS® Visual Analytics Designer delivers the Power to Know® in the language preferred by the report user! INTRODUCTION Suppose you arrive at work tomorrow and find that your employer has just acquired another company. Your manager calls you in and says, “We need to send the reports that we create with SAS Visual Analytics to the executive team in our new remote office every Monday so that they can plan their strategy for the week.” Success for this transition depends on you. This is easy enough if the newly acquired company happens to be on the other side of town, but what if that company is on the other side of the world? What if people in that country speak a language that you are not familiar with? How can you clearly communicate the data from your reports so that your new colleagues can make successful decisions and be productive? This paper introduces you to features in SAS Visual Analytics 7.1 and later that enable you to localize (translate) the labels, tooltips, and other descriptive text that are parts of your reports. You will learn how to use SAS Visual Analytics Designer (the designer) to export localizable text from your report so that you can apply one or more translations. You will see how the designer lets you translate your report into a new language without removing the text from the application. For simplicity, this document refers to a user’s browser and to the SAS Visual Analytics Viewer (the viewer). However, mobile devices receive the same benefit from a localized report. Reports created in the designer can also be displayed in the SAS® Office Analytics desktop and collaboration applications. Using SAS Office Analytics 7.1, a localized report displays the text in the language that matches the Microsoft Office language setting. For more information about using SAS Visual Analytics in SAS Office Analytics, see the SAS Global Forum 2014 paper, “Share Your SAS® Visual Analytics Reports with SAS® Office Analytics.” Join us on this journey to make your reports dynamically speak the languages of your entire audience! THE OLD WAY: MANY LANGUAGES, MANY REPORTS Previous versions of SAS Visual Analytics stored labels and other identifying text in a single language. To translate a report into another language, you had to copy the entire report, translate all of the text, and save a new report using a different name. You had to repeat this process for every language in which you wanted your report to display. Every time your report changed, even for a small change, you had to update every copy of the report with the change. Although displaying your original report in a browser in a different language might enable you to see some numbers and dates formatted differently, labels and other text continued to display in the original language. To see labels and text in different languages, you had to create totally separate reports. Here is an example of a simple graph created in English by the designer and displayed by the viewer using an English browser. Notice that both the user interface text (File, Help, and Sign Out) and the author’s content text (Student Height, Name, and Height) appear in English.
1

Figure 1. The Original Report in English In previous versions of SAS Visual Analytics, if we open this report in a browser with a French locale setting, the user interface text appears in French (Fichier, Aide, and Se déconnecter), but the author’s content text appears in English (Student Height, Name, and Height). Figure 2. The Report in French with the Original English Text
2

THE NEW WAY: ALL YOU NEED IS ONE REPORT! Reports created in SAS Visual Analytics 7.1 and later can be taught to speak multiple languages. Once you apply localizations to a report, changing the language of your browser dynamically changes the language of your report. Let’s get started! First, create and save a report in the designer. After saving the report, select File Localize Report. A dialog box displays the original text with indexing that identifies the location of each text string in the report. It also provides the human translator with useful context information. For the previous report, the Localize Report Text dialog box appears. Figure 3. The Localize Report Text Dialog Box The first line contains the locale identifier, which is specified by an ISO 639 two-letter language code. If a localization is created for a specific country or region, the language code is followed by an underscore and an ISO 3166 two-letter country code. For example, to specify the locale identifier for French, use the language code fr. To specify French for Canada, use fr_CA. Neither the locale nor the region identifier is case sensitive. The remaining lines in the dialog box provide the report author’s original strings. To import a French translation into the report, save the contents to a file and translate the text strings. Then, select File Localize Report to open the Localize Report Text dialog box. Click Apply. If you do not want to use a translation file, modify the contents of the Localize Report Text dialog box itself, and then click Apply to import the French translation. Or, you can copy and paste the Localize Report Text dialog box contents directly into an editor. All report text is encoded as Unicode characters using the UTF-8 format. If you export the localizable text to an editor, make sure that your editor is capable of saving the data in the UTF-8 format. There are three icons near the top left of the dialog box.
Load from File loads the contents of a file into the dialog box. Save to File saves the contents of the dialog box to a file. Copy copies the contents of the dialog box to the clipboard so that you can paste into an editor.
There is no limit to the number of translations that you can add to a report. If you plan to localize the report into several languages, you can save the original text to a file, and then make a copy for each translation. See the “Best Practices” section of this paper for suggested naming conventions for localized
3

files. To import multiple translations into the report, load a translated file into the dialog box, and click Apply to import that language. Repeat this process for each language. Note: When you apply a translation, your report is immediately updated and saved. The 7.1, 7.2, and
7.3 releases do not provide an undo feature. Here is the dialog box with a French translation of the previous report: Figure 4. The Localize Report Text Dialog Box—French � The first string, fr, indicates that this is a French translation. � The translator did not translate the next two strings: Section 1 and Bar Chart 1. � The next string, Ce graphique a été créé en anglais, provides a graph description that
appears in the viewer when the user requests additional information. � The final three strings provide a graph title, Taille des Étudiants, a label for the X axis,
Étudiant, and a label for the Y axis, Taille. Each string is preceded by an internal index (e.g., ve23 ) and some context information (e.g.,
Graph.description) that tells the translator how the string is being used in the report. To view the report in French, click Apply to import the French translation into the report. Then, open the report in a browser with the locale set for French. Now, both the user interface text and the author’s content text appear in French.
4

Figure 5. The Entire Report in French HOW SAS VISUAL ANALYTICS IDENTIFIES THE BEST LOCALE When a report has been localized, SAS Visual Analytics makes the best effort to match the user’s locale. For example, suppose you create a report in English, and then provide a generic German translation and a translation in the Austrian variant of German. The next figure shows the following: � A user in Great Britain who requests EN or EN_GB receives EN. � A Japanese user who requests JA receives EN (the original language) because no version of
Japanese has been provided. � A German user who requests DE or DE_DE receives DE. � A Swiss user who requests DE_CH receives DE because the Swiss variant has not been provided. � An Austrian user who requests DE_AU receives it. If he or she had requested DE rather than DE_AU,
he or she would have received DE. Figure 6. Match the User’s Locale
5
THE FORMAT OF THE TRANSLATED TEXT All report text is encoded as UTF-8. If you export text from the designer into a file, be sure to use an editor that is capable of saving translated results as UTF-8. ADVANCED FEATURES EDITING A LOCALIZED REPORT IN THE ORIGINAL LANGUAGE Any changes you want to make to the text of a localized report should be made using the designer with the locale set to the original language. Note that changes cannot be made to the text in the original language using the Localize Report Text dialog box. If you add new text to a localized report, it is displayed in the original language in all locales. Translations of existing text are unaffected. If you remove text, the remainder of the translated text is unaffected. If you modify existing text, the localized report updates the text in the original language, but previous translations of the text that you modified remain unaffected. To retranslate a localized report that you have modified, display your report in the original language, select FileLocalize Report to export the text, save the text to a file, and send it out for retranslation. EXPORTING A TRANSLATION Starting in Release 7.1, the designer can export the translated strings for a localization that you have already provided. For example, after importing a translation, you might want to correct some of the text or you might want to add a country-specific translation to allow for regional differences. For example, if the French version of your report will be used in Canada as well as in France, you might want to create a localization containing terminology more familiar to your Canadian users. To export localized text from your report, set the browser language to match the localization that you want to export. Open the report in the designer and select FileLocalize Report. The translated strings are displayed in the Localize Report Text dialog box. You can edit the strings directly in the dialog box, and then click Apply to save the changes. Or, you can copy the localized text to a file, make changes, and re-import the localization. Applying or importing localizations overwrites localizations that are already in place. At the same time, the screen updates to reflect the new localizations. THE FORMAT OF THE LINES IN THE LOCALIZE REPORT TEXT DIALOG BOX The lines in the Localize Report Text dialog box have a specific format. It is essential that the translator follow this format. Improperly formed strings will be ignored or misinterpreted. The first line in a translation file contains the locale identifier. The remaining lines have one of the following forms:
aaa.bbb.ccc = value
aaa.bbb_xxx.ccc = value
aaa.bbb_xxx_yyy.ccc = value
aaa.bbb_xxx_yyy zzz.ccc = value aaa provides an internal reference to a visual element in the report. Although this has no real value to the translator, it enables SAS Visual Analytics to associate the translation with the correct report element. bbb specifies the type of the view element (Table, Graph, DataItem, etc.). xxx, xxx_yyy, and xxx_ yyy zzz provide some context information to tell the translator how the string is being used in the report. ccc indicates how the text is associated with the visual element (label, description, toolTip, etc.).
6
value represents the actual text. Note that the equal sign is preceded and followed by a single space. The space following the equal sign is not part of the value. A translation line with just one space after the equal sign denotes a null string, whereas a translation line with two spaces after the equal sign specifies a translation that consists of a single space. As a simple example, consider the following
line: ve3.Table.title = Sales This translation line informs the translator that the report contains a table whose title is “Sales” and whose internal index is ve3. The following line provides a more interesting example:
bi6.DataItem_CLASS_Height.label = Height This translation line informs the translator that the CLASS data set contains a data item whose default name is “Height.” When you see the word “Height” following the equal sign, you know that the author has chosen not to replace the default data item name, but the string is available for translation. Knowing that the word “Height” occurs in the context of the CLASS data set lets the translator know that the data provides the heights of people rather than, say, buildings. Indeed, in French, the former value translates as “Taille,” but the latter value translates as “Hauteur.” This illustrates the value of context. Keep the following rule in mind: The only portion of a line the translator should modify is the value following the equal sign. LIMITATIONS OF LOCALIZATION IN SAS VISUAL ANALYTICS RELEASES 7.1, 7.2, and 7.3 You can localize almost all of the text that appears in a report. Exceptions include the following: � The name of the report. � The names of reference lines associated with a graph. � Some of the text in reports that have been exported from SAS Visual Analytics Explorer (the
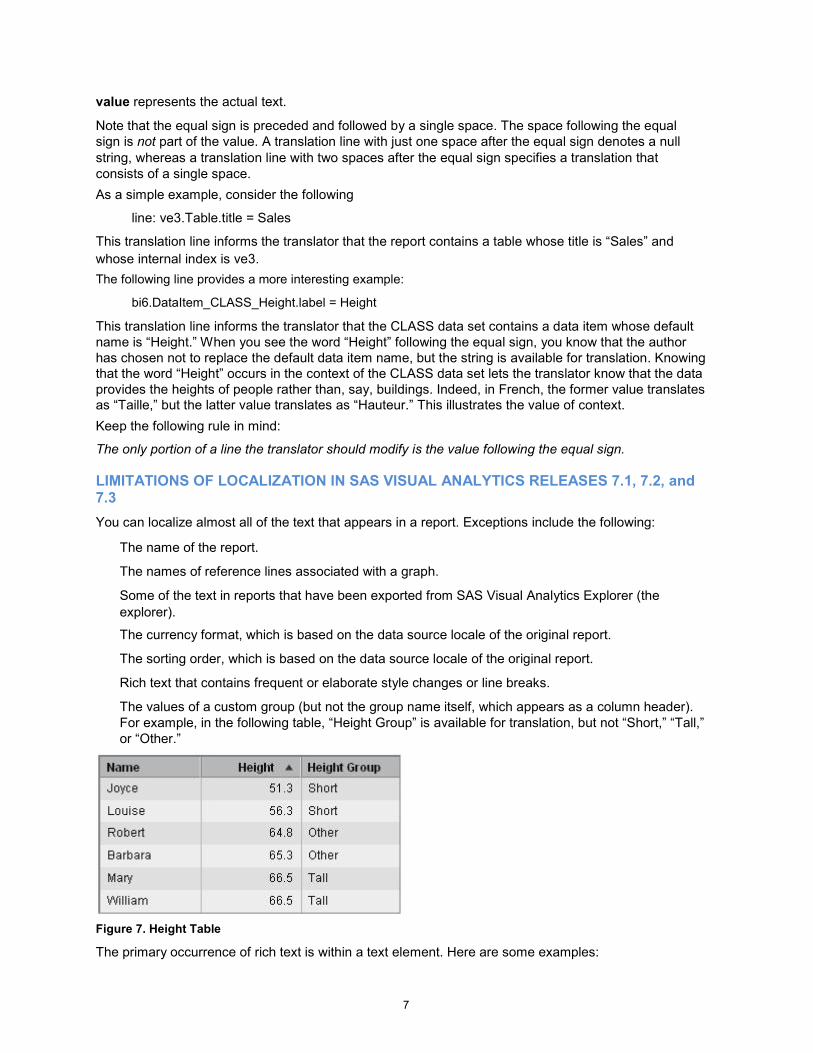
explorer). � The currency format, which is based on the data source locale of the original report. � The sorting order, which is based on the data source locale of the original report. � Rich text that contains frequent or elaborate style changes or line breaks. � The values of a custom group (but not the group name itself, which appears as a column header).
For example, in the following table, “Height Group” is available for translation, but not “Short,” “Tall,” or “Other.”
Figure 7. Height Table The primary occurrence of rich text is within a text element. Here are some examples:
7

This is rich text because only some words are bold.
This is rich text because it involves changes in color.
This is rich text because bold underlined italics are not used throughout.
This is an extreme example of rich text. It contains four styles. The primary difficulty in translating rich text is due to the differences in word order among languages. For this reason, keep in mind the following: Exercise caution when using rich text capabilities in a report that you intend to localize. Suppose that after entering the English sentence, “I will do it tomorrow,” you want to emphasize “tomorrow” by underlining it.
I will do it tomorrow. This might be represented in the Localize Report Text dialog box as the following:
ve4.Text.P 1 Span 1.* = I will do it
ve4.Text.P 1 Span 2.* = tomorrow
ve4.Text.P 1 Span 3.* = . Note: The internal representation of the report associates a style with each span, but releases 7.1,
7.2, and 7.3 of SAS Visual Analytics do not surface these styles for translation. The example can be translated into French, preserving the
underlining. Je vais le faire demain.
ve4.Text.P 1 Span 1.* = Je vais le faire
ve4.Text.P 1 Span 2.* = demain
ve4.Text.P 1 Span 3.* = . This example can also be translated into German, again preserving the
underlining. Ich werde es morgen tun.
ve4.Text.P 1 Span 1.* = Ich werde
es ve4.Text.P 1 Span 2.* = morgen
ve4.Text.P 1 Span 3.* = tun. These translations are possible because each sentence consists of three subtexts that occur in the same order, although the German translation requires replacing a punctuation mark (a period) with the word “tun” as well as a punctuation mark (a period). Consider the following more elaborate (and therefore problematic) example of rich
text: I will not do it tomorrow. This might be represented in the Localize Report Text dialog box as follows:
ve4.Text.P 1 Span 1.* = I will
ve4.Text.P 1 Span 2.* = not
ve4.Text.P 1 Span 3.* = do it
ve4.Text.P 1 Span 4.* = tomorrow
ve4.Text.P 1 Span 5.* = . 8

Because of the differences in word order, all attempts to translate this to German and to preserve style changes fail. For example, consider the following attempt to translate the text:
ve4.Text.P 1 Span 1.* = Ich
werde ve4.Text.P 1 Span 2.* =
nicht ve4.Text.P 1 Span 3.* = es
ve4.Text.P 1 Span 4.* = morgen
ve4.Text.P 1 Span 5.* = tun. This translation preserves the styles, but it produces an ungrammatical
sentence. Ich werde nicht es morgen tun. The following translation corrects the grammar:
ve4.Text.P 1 Span 1.* = Ich werde es
ve4.Text.P 1 Span 2.* = morgen
ve4.Text.P 1 Span 3.* =
ve4.Text.P 1 Span 4.* = nicht
ve4.Text.P 1 Span 5.* = tun. Unfortunately, this translation produces a grammatical sentence with improperly placed styles.
Ich werde es morgen nicht tun. And, further attempts will fail. BEST PRACTICES Here are some best practices to follow when creating reports that will be localized: � Complete the report in its original language before beginning to localize. � Create localizations either directly in the designer’s Localize Report Text dialog box or using an editor
capable of saving files encoded as UTF-8. � If it becomes necessary to edit a report that has been localized, always edit the text in the original
language. � If you need to edit a translation, follow the guidelines in the “Advanced Features” section. � When entering rich text, avoid complex mixing of styles. � A useful convention for naming translation files, especially when a report contains more than two
languages, is to include the ISO 639 two-letter language code as a suffix to the filename. To further distinguish a localization for a country or region, you can include the ISO 3166 two-letter country code. For example, for a report named “MyReport,” you can save the text in the original language to a file that you name as follows:
MyReport .xml Following the naming convention, the Russian translation file would be named as
follows: MyReport_ru.txt
The French Canadian translation file would be named as follows:
MyReport_fr_CA.txt 9

REFERENCES ISO 639 Language Codes. Available at http://www.iso.org/iso/language_codes.htm
ISO 3155 Country Codes. Available at http://www.iso.org/iso/country_codes.htm Bailey, David, I-Kong Fu, and Anand Chitale. 2014. “Share Your SAS® Visual Analytics Reports with SAS® Office Analytics.” Proceedings of the SAS Global Forum 2014 Conference, Cary, NC: SAS Institute, Inc. Available at http://support.sas.com/resources/papers/proceedings14/SAS274-2014.pdf. TERMINOLOGY locale
a setting that reflects the language, local conventions, and culture for a geographic region. Local conventions can include specific formatting rules for paper sizes, dates, times, and numbers, and a currency symbol for the country or region. Some examples of locale values are French_Canada, Portuguese_Brazil, and Chinese_Singapore.
localization the process of adapting software for a particular geo-cultural region (locale). Translation of the user interface, system messages, and documentation is a large part of the localization process. Short form: L10N
localize to adapt software and to translate the user interface, system messages, and documentation for a particular geo-cultural region (locale).
Unicode a computing industry standard for the consistent encoding, representation, and handling of text expressed in most of the world's writing systems. Unicode includes more than 110,000 characters and covers dozens of scripts. It has standards for character properties such as uppercase and lowercase, for rendering a bidirectional script, and for a number of related items.
UTF-8 an encoding that represents each Unicode character with 1 to 4 bytes. It is backward-compatible with ASCII.
10

SAS Institute Inc. World Headquarters +1 919 677 8000 To contact your local SAS office, please visit: www.sas.com/offices
SAS and all other SAS Institute Inc. product or service names are registered trademarks or trademarks of SAS Institute Inc. in the USA and other countries. ® indicates USA registration. Other brand and product names are trademarks of their respective companies. Copyright © 2015, SAS Institute Inc. All rights reserved. 10/2015