wilhelmsson, mats sept 29 11
DESCRIPTION
Real Estate Market in Sweden Mats Wilhelmsson Center for Banking and Finance Royal Institute of Technology 1 180 200 120 130 140 150 160 100 60 80 90 20 40 80 0 Source: Statistic Sweden (SCB) and NasdaqOMX Valueguard-KTH House Price Index 2 350 400 450 100 150 200 50 0 Source: ECB and SCB 3 100 20 40 60 80 10 12 8 0 2 4 6 0 Source: SCB 4 • Income and property tax • Construction • Income • Interest rate 5 1,600,000 1,800,000 % 10% 12% 14% 0% 2% 4% 6% 8% 3 0 6 0 0 1 2 4 5 7 1 2 3 4 5 6 7 8 9 6TRANSCRIPT

Global Interdependence Center
Real Estate Market in Sweden
Mats Wilhelmsson Center for Banking and Finance
Royal Institute of Technology
1
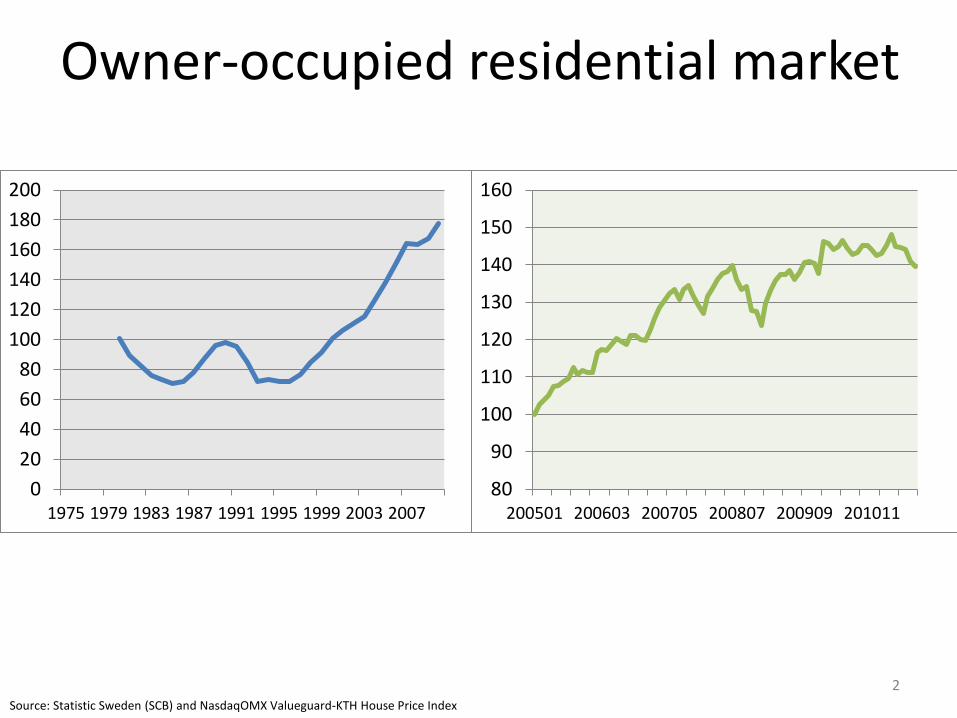
Owner-occupied residential market
0
20
40
60
80
100
120
140
160
180
200
1975 1979 1983 1987 1991 1995 1999 2003 2007
Source: Statistic Sweden (SCB) and NasdaqOMX Valueguard-KTH House Price Index
2
80
90
100
110
120
130
140
150
160
200501 200603 200705 200807 200909 201011
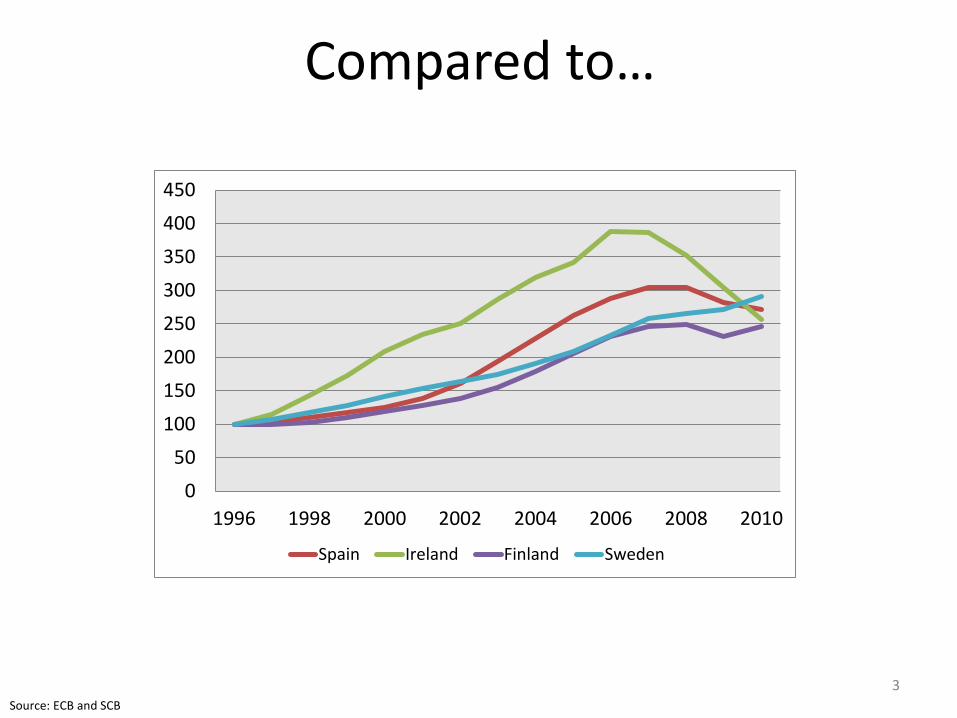
Compared to…
0
50
100
150
200
250
300
350
400
450
1996 1998 2000 2002 2004 2006 2008 2010
Spain Ireland Finland Sweden
Source: ECB and SCB
3

On the one hand … on the other hand
0
20
40
60
80
100
120
140
160
180
Household debt, per cent of disposable income
0
2
4
6
8
10
12
Household interest payments, per cent of disposable income
Source: SCB
4

Why did not prices decline in 2007/2008?
• Interest rate
• Employment/unemployment
• Income
• Income and property tax
• Construction
5
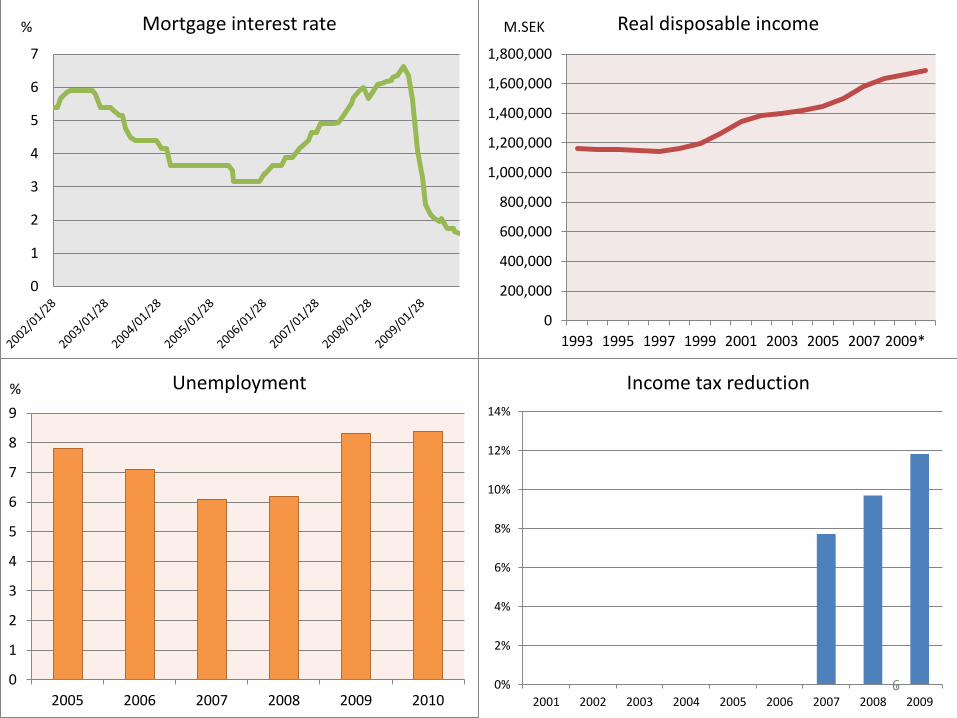
0
1
2
3
4
5
6
7
Mortgage interest rate
0
200,000
400,000
600,000
800,000
1,000,000
1,200,000
1,400,000
1,600,000
1,800,000
1993 1995 1997 1999 2001 2003 2005 2007 2009*
Real disposable income
0
1
2
3
4
5
6
7
8
9
2005 2006 2007 2008 2009 2010
Unemployment %
% M.SEK
6 0%
2%
4%
6%
8%
10%
12%
14%
2001 2002 2003 2004 2005 2006 2007 2008 2009
Income tax reduction
0
5000
10000
15000
20000
New apartments (moving average)
7
-0.5%
0.0%
0.5%
1.0%
1.5%
1990 1994 1998 2002 2006
Difference between population growth and new apartments.
0
200000
400000
600000
800000
1000000
1200000
1400000
1600000Building permits
Residential MA Office MA

Sweden at risk?
• The Riksbank’s inquiry (April, 2011) – “the high Swedish housing prices can largely be explained by
what are usually called fundamental factors – that is to say that there are natural economic explanations for the price increases that have taken place”
• IMF (September, 2011)
– No overvaluation – A significant net wealth buffer – Direct and life-long personal liability – Developed social security system – No buy-to-let market – Low construction
8

Commercial Real Estate Market
9
0
2
4
6
8
10
12
1980 1986 1992 1998 2004 2010
Cap rate-office Cap rate-residential
Source: Fastighetsvärlden
0
20000
40000
60000
80000
2000 2004 2008
Price-office Price-residential

At Risk?
10
0
10
20
30
40
50
60
Financial solidity (2010)

Indirect investments in real estate
11
0
100
200
300
400
500
600
700
800
-30
-20
-10
0
10
20
30
40
Index
Relative strength - OMX30
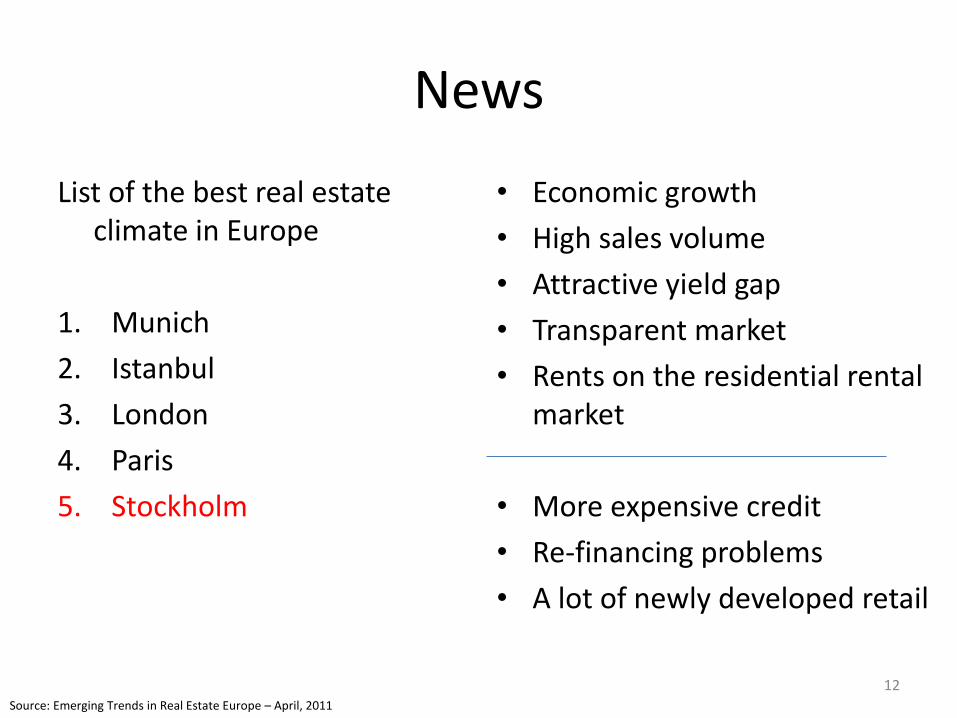
News
List of the best real estate climate in Europe
1. Munich
2. Istanbul
3. London
4. Paris
5. Stockholm
• Economic growth
• High sales volume
• Attractive yield gap
• Transparent market
• Rents on the residential rental market
• More expensive credit
• Re-financing problems
• A lot of newly developed retail
12 Source: Emerging Trends in Real Estate Europe – April, 2011

Thank you!
13