wifi site survey report example - acrylic heatmaps software
TRANSCRIPT
CLIENT:
ACRYLIC WIFI
PROJECT:
AUDITORIUM HOTEL - INTERNAL WI-FI SURVEY EXAMPLE
DATE:
17/4/2015
auditorium - Acrylic Wi-Fi HeatMaps - Site survey v2.0 - 2015 2
Content 1. Wireless network survey information ............................................................................................. 6
2. Summary of detected networks ...................................................................................................... 7
3. Station Inventory ........................................................................................................................... 10
4. Detected Networks ....................................................................................................................... 14
5. Access Points ................................................................................................................................. 16
6. Location Survey: Second floor ....................................................................................................... 24
6.1. Location information .............................................................................................................. 24
6.2. Survey Route .......................................................................................................................... 25
6.3. Physical AP's Position ............................................................................................................. 26
6.4. Details Grid ............................................................................................................................. 28
6.5. Network Survey: HOTEL_AUDITORIUM ................................................................................. 30
6.5.1. AP-based Information ..................................................................................................... 30
6.5.2. Signal Strength ................................................................................................................ 31
6.5.3. Signal Strength by Access Point....................................................................................... 32
6.5.4. Number of Detected Access Points ................................................................................. 34
6.5.5. Access Point Coverage .................................................................................................... 35
6.5.6. Channel-based Information ............................................................................................ 37
6.5.7. Channel Coverage ........................................................................................................... 38
6.5.8. Channel Overlap .............................................................................................................. 39
6.5.9. Signal Strength by Channel ............................................................................................. 40
6.5.10. Signal-to-Noise Ratio ..................................................................................................... 41
6.5.11. Signal-to-Noise Ratio by AP ........................................................................................... 42
6.5.12. Data Transfer Rate ........................................................................................................ 44
6.5.13. Data Transfer Rate by AP .............................................................................................. 45
6.5.14. Device Density .............................................................................................................. 47
6.5.15. Packet Loss .................................................................................................................... 48
7. Location Survey: Ground floor ...................................................................................................... 49
7.1. Location information .............................................................................................................. 49
7.2. Survey Route .......................................................................................................................... 50
7.3. Physical AP's Position ............................................................................................................. 51
auditorium - Acrylic Wi-Fi HeatMaps - Site survey v2.0 - 2015 3
7.4. Details Grid ............................................................................................................................. 52
7.5. Network Survey: HOTEL_AUDITORIUM ................................................................................. 60
7.5.1. AP-based Information ..................................................................................................... 60
7.5.2. Signal Strength ................................................................................................................ 62
7.5.3. Signal Strength by Access Point....................................................................................... 63
7.5.4. Number of Detected Access Points ................................................................................. 69
7.5.5. Access Point Coverage .................................................................................................... 70
7.5.6. Channel-based Information ............................................................................................ 72
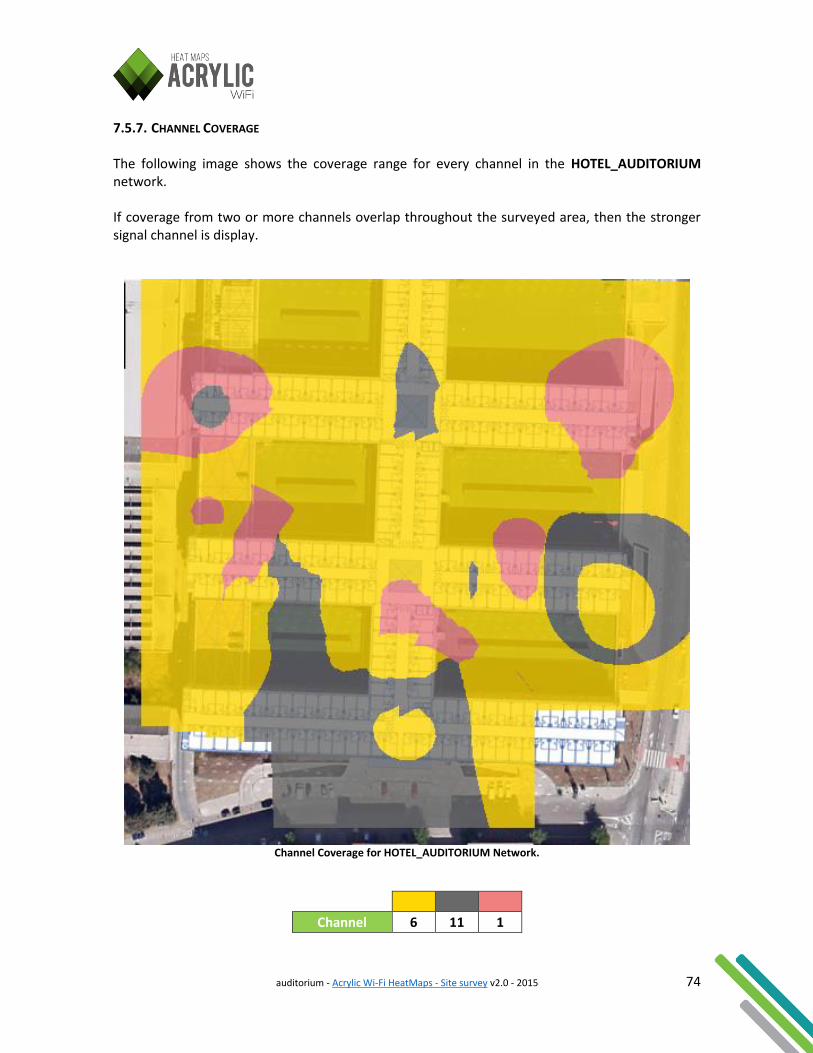
7.5.7. Channel Coverage ........................................................................................................... 74
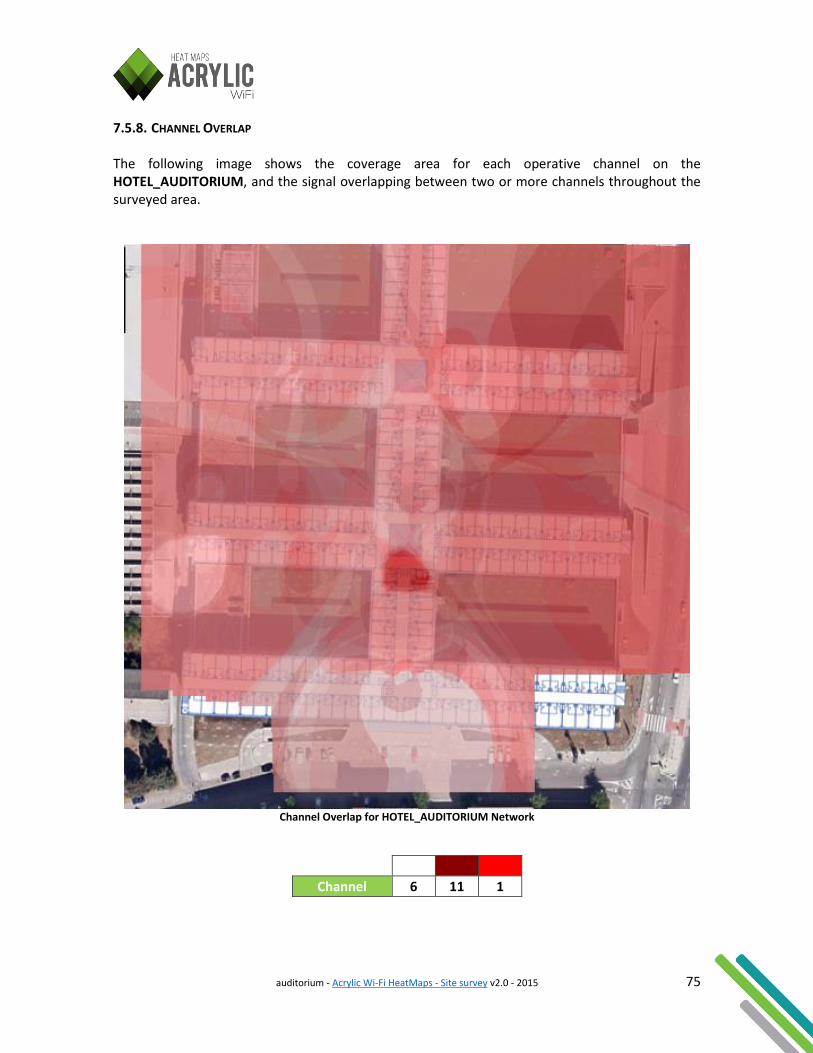
7.5.8. Channel Overlap .............................................................................................................. 75
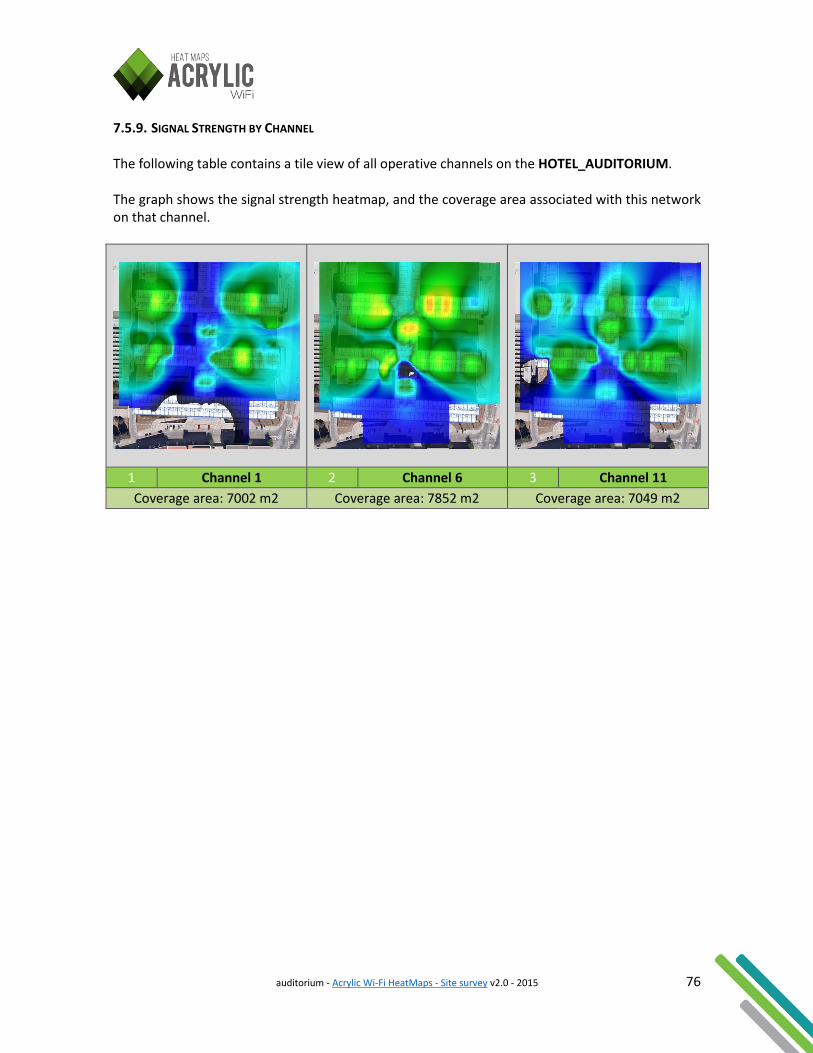
7.5.9. Signal Strength by Channel ............................................................................................. 76
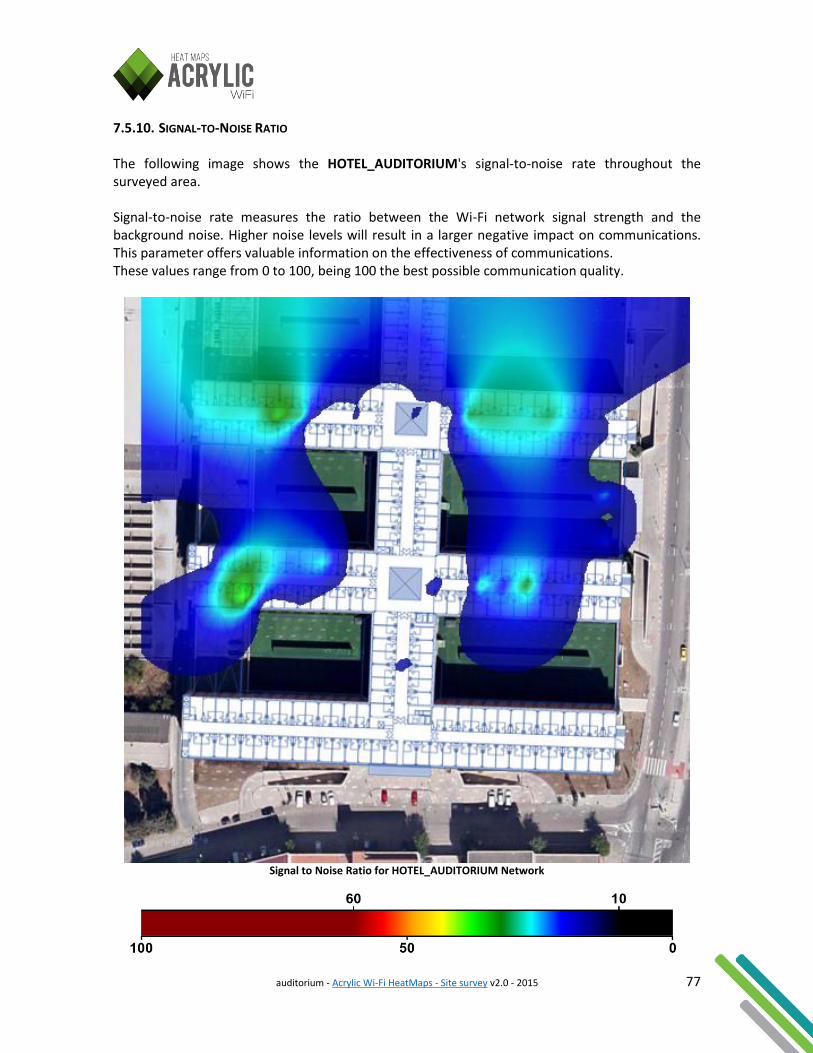
7.5.10. Signal-to-Noise Ratio ..................................................................................................... 77
7.5.11. Signal-to-Noise Ratio by AP ........................................................................................... 78
7.5.12. Data Transfer Rate ........................................................................................................ 83
7.5.13. Data Transfer Rate by AP .............................................................................................. 84
7.5.14. Device Density .............................................................................................................. 89
7.5.15. Device Density by AP ..................................................................................................... 90
7.5.16. Packet Loss .................................................................................................................... 95
7.5.17. Packet Loss by AP .......................................................................................................... 96
8. Location Survey: First floor.......................................................................................................... 101
8.1. Location information ............................................................................................................ 101
8.2. Survey Route ........................................................................................................................ 102
8.3. Physical AP's Position ........................................................................................................... 103
8.4. Details Grid ........................................................................................................................... 105
8.5. Network Survey: HOTEL_AUDITORIUM ............................................................................... 113
8.5.1. AP-based Information ................................................................................................... 113
8.5.2. Signal Strength .............................................................................................................. 115
8.5.3. Signal Strength by Access Point..................................................................................... 116
8.5.4. Number of Detected Access Points ............................................................................... 122
8.5.5. Access Point Coverage .................................................................................................. 123
8.5.6. Channel-based Information .......................................................................................... 125
auditorium - Acrylic Wi-Fi HeatMaps - Site survey v2.0 - 2015 4
8.5.7. Channel Coverage ......................................................................................................... 127
8.5.8. Channel Overlap ............................................................................................................ 128
8.5.9. Signal Strength by Channel ........................................................................................... 129
8.5.10. Signal-to-Noise Ratio ................................................................................................... 130
8.5.11. Signal-to-Noise Ratio by AP ......................................................................................... 131
8.5.12. Data Transfer Rate ...................................................................................................... 136
8.5.13. Data Transfer Rate by AP ............................................................................................ 137
8.5.14. Device Density ............................................................................................................ 142
8.5.15. Device Density by AP ................................................................................................... 143
8.5.16. Packet Loss .................................................................................................................. 148
8.5.17. Packet Loss by AP ........................................................................................................ 149
9. Location Survey: Third floor ........................................................................................................ 154
9.1. Location information ............................................................................................................ 154
9.2. Survey Route ........................................................................................................................ 155
9.3. Physical AP's Position ........................................................................................................... 156
9.4. Details Grid ........................................................................................................................... 157
9.5. Network Survey: HOTEL_AUDITORIUM ............................................................................... 160
9.5.1. AP-based Information ................................................................................................... 160
9.5.2. Signal Strength .............................................................................................................. 161
9.5.3. Signal Strength by Access Point..................................................................................... 162
9.5.4. Number of Detected Access Points ............................................................................... 164
9.5.5. Access Point Coverage .................................................................................................. 165
9.5.6. Channel-based Information .......................................................................................... 167
9.5.7. Channel Coverage ......................................................................................................... 168
9.5.8. Channel Overlap ............................................................................................................ 169
9.5.9. Signal Strength by Channel ........................................................................................... 170
9.5.10. Signal-to-Noise Ratio ................................................................................................... 171
9.5.11. Signal-to-Noise Ratio by AP ......................................................................................... 172
9.5.12. Data Transfer Rate ...................................................................................................... 174
9.5.13. Data Transfer Rate by AP ............................................................................................ 175
9.5.14. Device Density ............................................................................................................ 177
auditorium - Acrylic Wi-Fi HeatMaps - Site survey v2.0 - 2015 5
9.5.15. Device Density by AP ................................................................................................... 178
9.5.16. Packet Loss .................................................................................................................. 180
9.5.17. Packet Loss by AP ........................................................................................................ 181
10. WIFI SITE SURVEY SOFTWARE ................................................................................................... 183
auditorium - Acrylic Wi-Fi HeatMaps - Site survey v2.0 - 2015 6
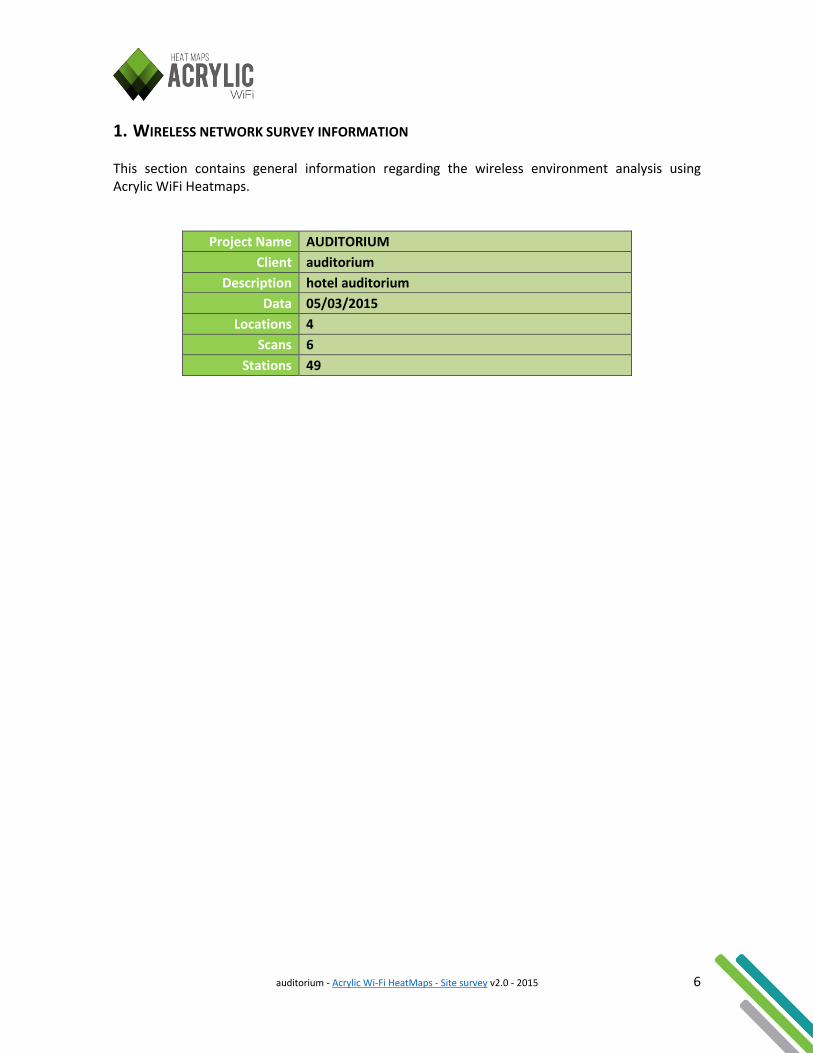
1. WIRELESS NETWORK SURVEY INFORMATION This section contains general information regarding the wireless environment analysis using Acrylic WiFi Heatmaps.
Project Name AUDITORIUM
Client auditorium
Description hotel auditorium
Data 05/03/2015
Locations 4
Scans 6
Stations 49
auditorium - Acrylic Wi-Fi HeatMaps - Site survey v2.0 - 2015 7
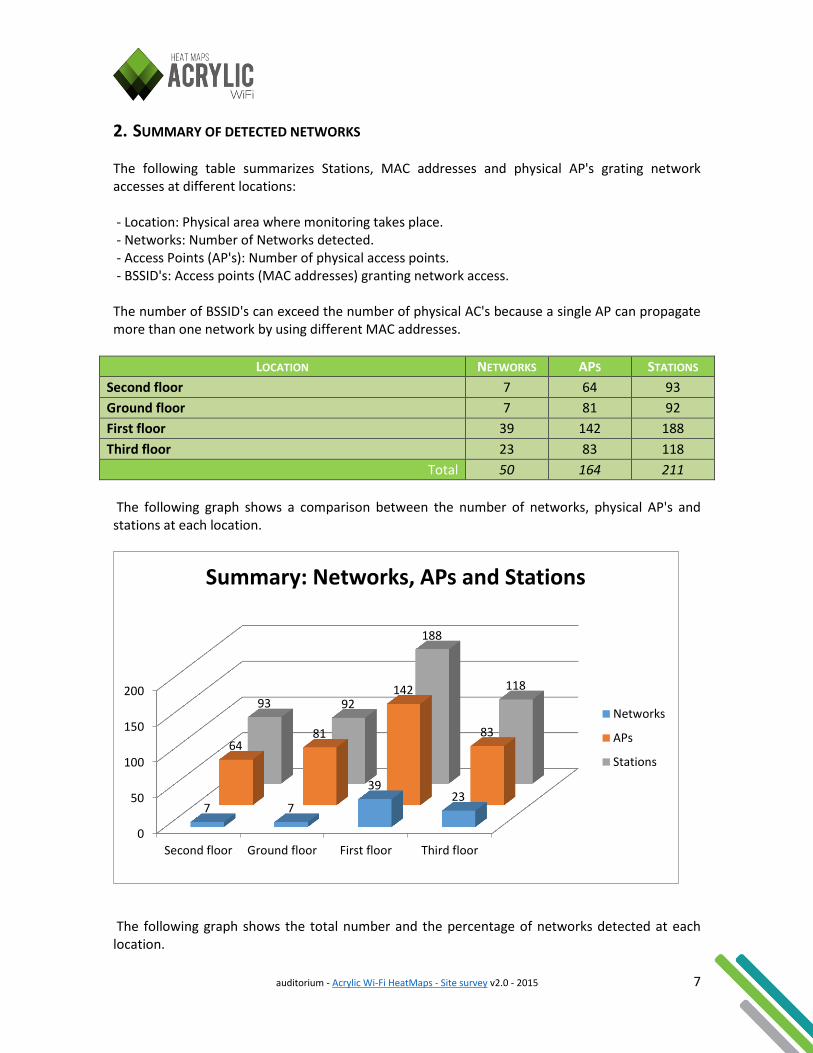
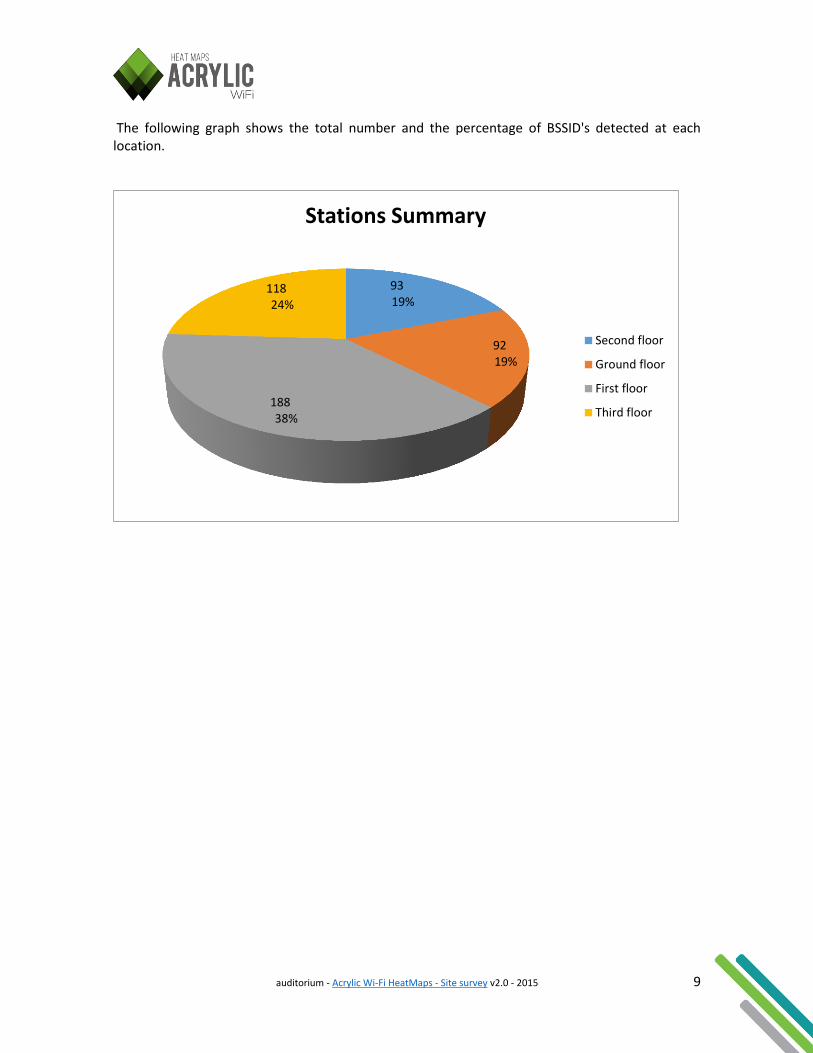
2. SUMMARY OF DETECTED NETWORKS The following table summarizes Stations, MAC addresses and physical AP's grating network accesses at different locations: - Location: Physical area where monitoring takes place. - Networks: Number of Networks detected. - Access Points (AP's): Number of physical access points. - BSSID's: Access points (MAC addresses) granting network access. The number of BSSID's can exceed the number of physical AC's because a single AP can propagate more than one network by using different MAC addresses.
LOCATION NETWORKS APS STATIONS
Second floor 7 64 93
Ground floor 7 81 92
First floor 39 142 188
Third floor 23 83 118
Total 50 164 211
The following graph shows a comparison between the number of networks, physical AP's and stations at each location.
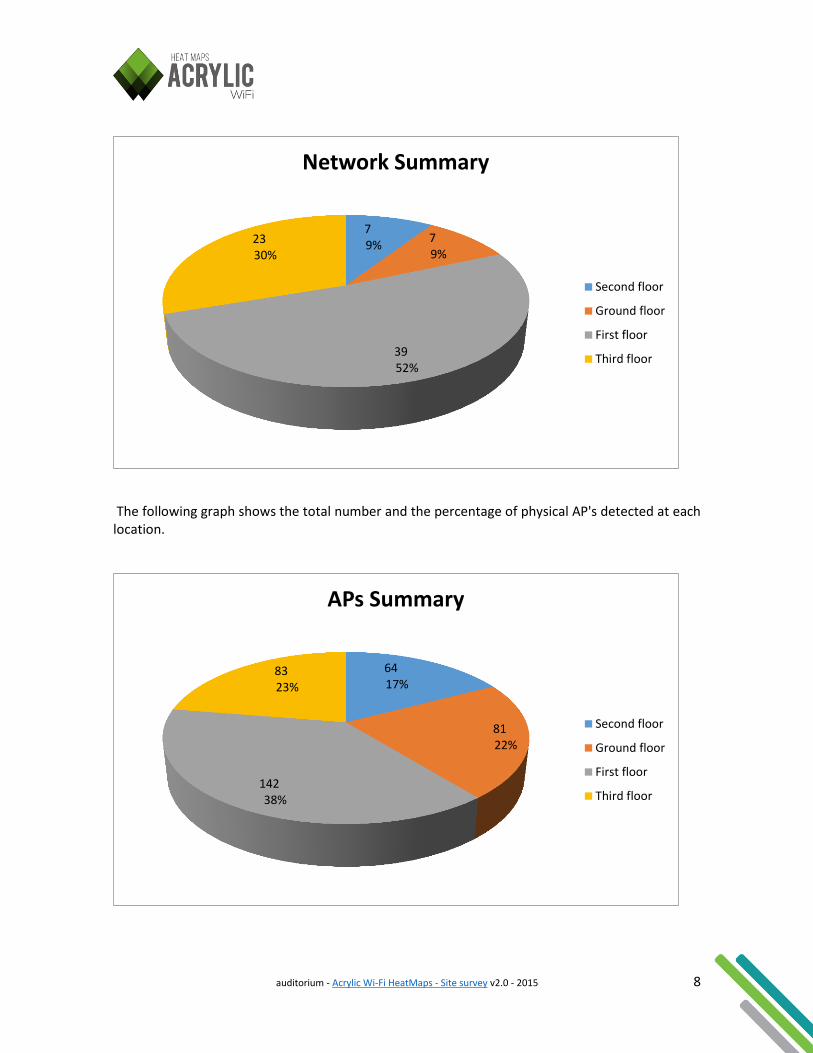
The following graph shows the total number and the percentage of networks detected at each location.
0
50
100
150
200
Second floor Ground floor First floor Third floor
7 7
39 23
64 81
142
83
93 92
188
118
Summary: Networks, APs and Stations
Networks
APs
Stations
auditorium - Acrylic Wi-Fi HeatMaps - Site survey v2.0 - 2015 8
The following graph shows the total number and the percentage of physical AP's detected at each location.
7 9%
7 9%
39 52%
23 30%
Network Summary
Second floor
Ground floor
First floor
Third floor
64 17%
81 22%
142 38%
83 23%
APs Summary
Second floor
Ground floor
First floor
Third floor
auditorium - Acrylic Wi-Fi HeatMaps - Site survey v2.0 - 2015 9
The following graph shows the total number and the percentage of BSSID's detected at each location.
93 19%
92 19%
188 38%
118 24%
Stations Summary
Second floor
Ground floor
First floor
Third floor
auditorium - Acrylic Wi-Fi HeatMaps - Site survey v2.0 - 2015 10
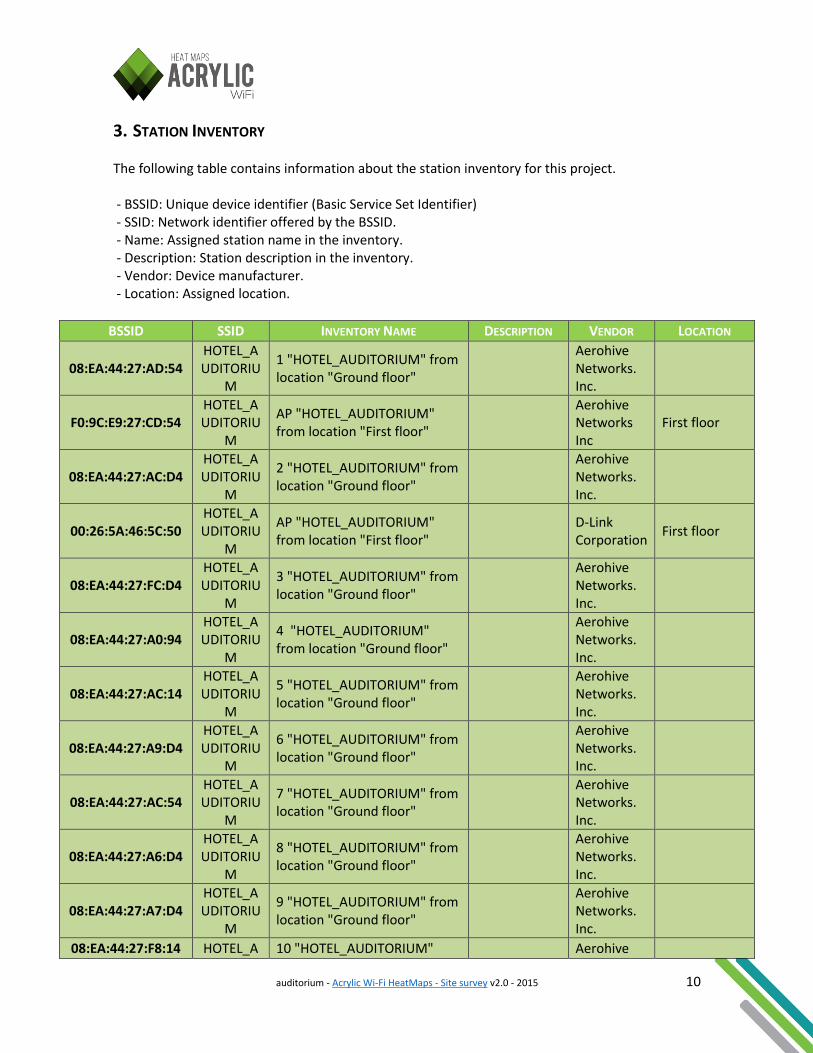
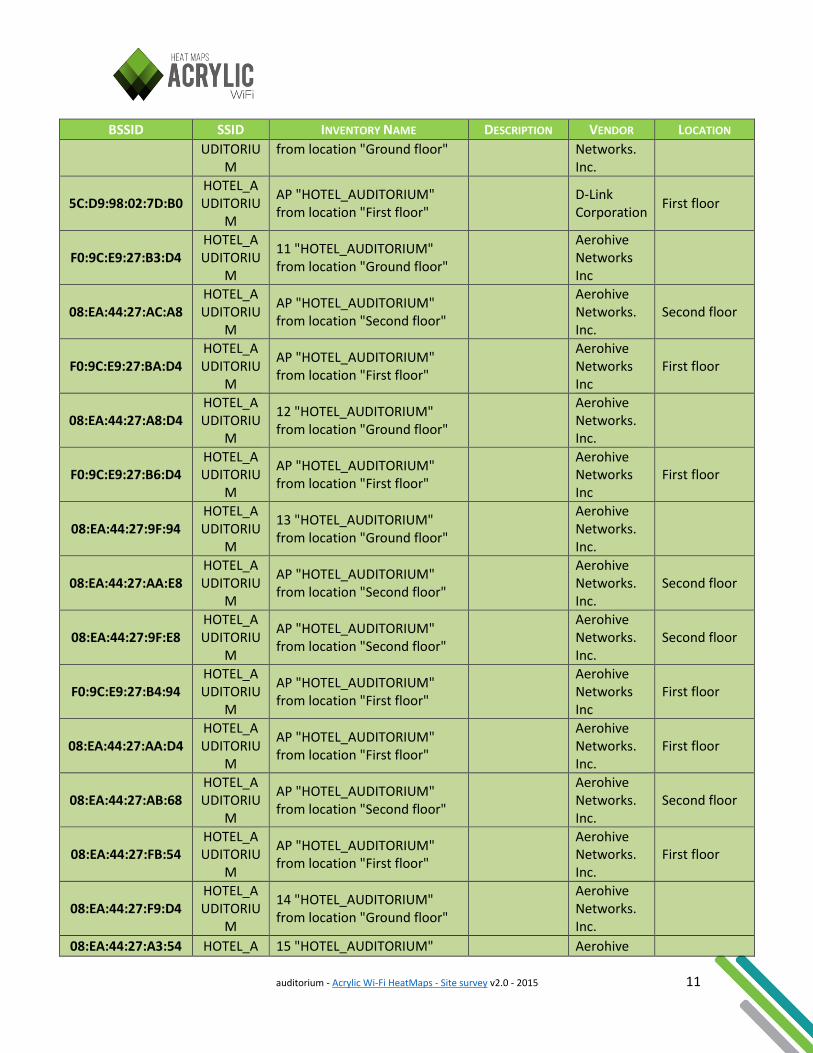
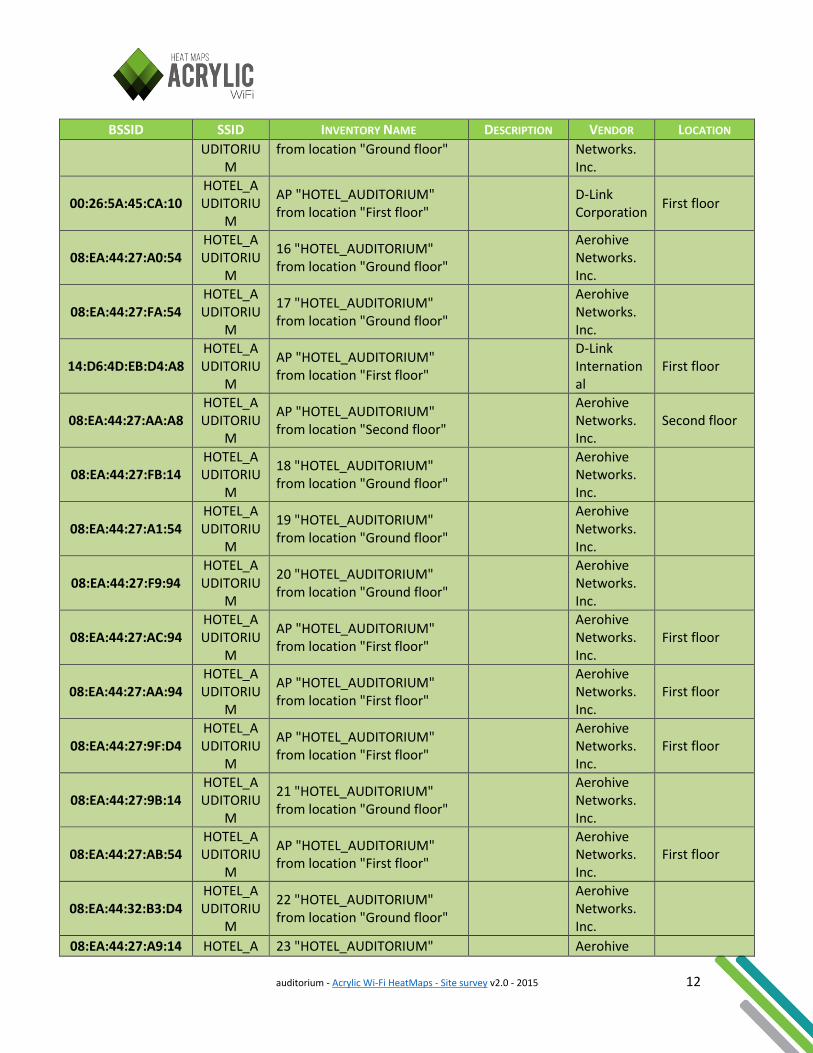
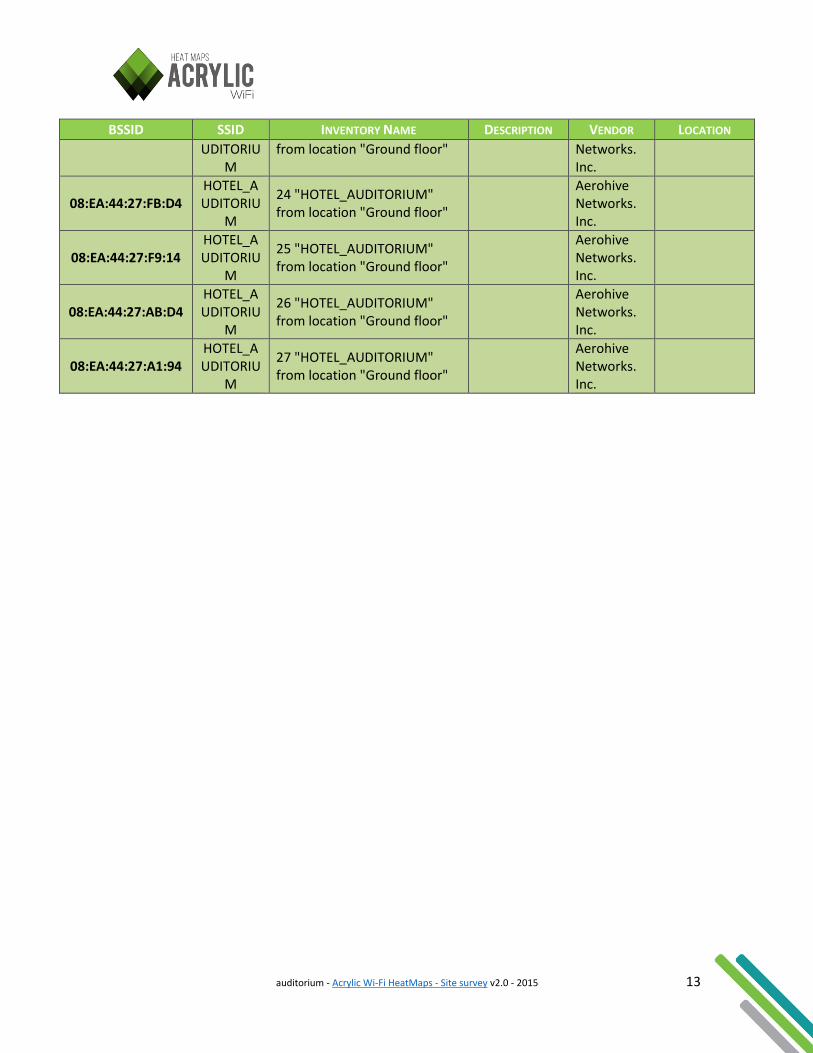
3. STATION INVENTORY The following table contains information about the station inventory for this project. - BSSID: Unique device identifier (Basic Service Set Identifier) - SSID: Network identifier offered by the BSSID. - Name: Assigned station name in the inventory. - Description: Station description in the inventory. - Vendor: Device manufacturer. - Location: Assigned location.
BSSID SSID INVENTORY NAME DESCRIPTION VENDOR LOCATION
08:EA:44:27:AD:54 HOTEL_AUDITORIU
M
1 "HOTEL_AUDITORIUM" from location "Ground floor"
Aerohive Networks. Inc.
F0:9C:E9:27:CD:54 HOTEL_AUDITORIU
M
AP "HOTEL_AUDITORIUM" from location "First floor"
Aerohive Networks Inc
First floor
08:EA:44:27:AC:D4 HOTEL_AUDITORIU
M
2 "HOTEL_AUDITORIUM" from location "Ground floor"
Aerohive Networks. Inc.
00:26:5A:46:5C:50 HOTEL_AUDITORIU
M
AP "HOTEL_AUDITORIUM" from location "First floor"
D-Link Corporation
First floor
08:EA:44:27:FC:D4 HOTEL_AUDITORIU
M
3 "HOTEL_AUDITORIUM" from location "Ground floor"
Aerohive Networks. Inc.
08:EA:44:27:A0:94 HOTEL_AUDITORIU
M
4 "HOTEL_AUDITORIUM" from location "Ground floor"
Aerohive Networks. Inc.
08:EA:44:27:AC:14 HOTEL_AUDITORIU
M
5 "HOTEL_AUDITORIUM" from location "Ground floor"
Aerohive Networks. Inc.
08:EA:44:27:A9:D4 HOTEL_AUDITORIU
M
6 "HOTEL_AUDITORIUM" from location "Ground floor"
Aerohive Networks. Inc.
08:EA:44:27:AC:54 HOTEL_AUDITORIU
M
7 "HOTEL_AUDITORIUM" from location "Ground floor"
Aerohive Networks. Inc.
08:EA:44:27:A6:D4 HOTEL_AUDITORIU
M
8 "HOTEL_AUDITORIUM" from location "Ground floor"
Aerohive Networks. Inc.
08:EA:44:27:A7:D4 HOTEL_AUDITORIU
M
9 "HOTEL_AUDITORIUM" from location "Ground floor"
Aerohive Networks. Inc.
08:EA:44:27:F8:14 HOTEL_A 10 "HOTEL_AUDITORIUM" Aerohive
auditorium - Acrylic Wi-Fi HeatMaps - Site survey v2.0 - 2015 11
BSSID SSID INVENTORY NAME DESCRIPTION VENDOR LOCATION
UDITORIUM
from location "Ground floor" Networks. Inc.
5C:D9:98:02:7D:B0 HOTEL_AUDITORIU
M
AP "HOTEL_AUDITORIUM" from location "First floor"
D-Link Corporation
First floor
F0:9C:E9:27:B3:D4 HOTEL_AUDITORIU
M
11 "HOTEL_AUDITORIUM" from location "Ground floor"
Aerohive Networks Inc
08:EA:44:27:AC:A8 HOTEL_AUDITORIU
M
AP "HOTEL_AUDITORIUM" from location "Second floor"
Aerohive Networks. Inc.
Second floor
F0:9C:E9:27:BA:D4 HOTEL_AUDITORIU
M
AP "HOTEL_AUDITORIUM" from location "First floor"
Aerohive Networks Inc
First floor
08:EA:44:27:A8:D4 HOTEL_AUDITORIU
M
12 "HOTEL_AUDITORIUM" from location "Ground floor"
Aerohive Networks. Inc.
F0:9C:E9:27:B6:D4 HOTEL_AUDITORIU
M
AP "HOTEL_AUDITORIUM" from location "First floor"
Aerohive Networks Inc
First floor
08:EA:44:27:9F:94 HOTEL_AUDITORIU
M
13 "HOTEL_AUDITORIUM" from location "Ground floor"
Aerohive Networks. Inc.
08:EA:44:27:AA:E8 HOTEL_AUDITORIU
M
AP "HOTEL_AUDITORIUM" from location "Second floor"
Aerohive Networks. Inc.
Second floor
08:EA:44:27:9F:E8 HOTEL_AUDITORIU
M
AP "HOTEL_AUDITORIUM" from location "Second floor"
Aerohive Networks. Inc.
Second floor
F0:9C:E9:27:B4:94 HOTEL_AUDITORIU
M
AP "HOTEL_AUDITORIUM" from location "First floor"
Aerohive Networks Inc
First floor
08:EA:44:27:AA:D4 HOTEL_AUDITORIU
M
AP "HOTEL_AUDITORIUM" from location "First floor"
Aerohive Networks. Inc.
First floor
08:EA:44:27:AB:68 HOTEL_AUDITORIU
M
AP "HOTEL_AUDITORIUM" from location "Second floor"
Aerohive Networks. Inc.
Second floor
08:EA:44:27:FB:54 HOTEL_AUDITORIU
M
AP "HOTEL_AUDITORIUM" from location "First floor"
Aerohive Networks. Inc.
First floor
08:EA:44:27:F9:D4 HOTEL_AUDITORIU
M
14 "HOTEL_AUDITORIUM" from location "Ground floor"
Aerohive Networks. Inc.
08:EA:44:27:A3:54 HOTEL_A 15 "HOTEL_AUDITORIUM" Aerohive
auditorium - Acrylic Wi-Fi HeatMaps - Site survey v2.0 - 2015 12
BSSID SSID INVENTORY NAME DESCRIPTION VENDOR LOCATION
UDITORIUM
from location "Ground floor" Networks. Inc.
00:26:5A:45:CA:10 HOTEL_AUDITORIU
M
AP "HOTEL_AUDITORIUM" from location "First floor"
D-Link Corporation
First floor
08:EA:44:27:A0:54 HOTEL_AUDITORIU
M
16 "HOTEL_AUDITORIUM" from location "Ground floor"
Aerohive Networks. Inc.
08:EA:44:27:FA:54 HOTEL_AUDITORIU
M
17 "HOTEL_AUDITORIUM" from location "Ground floor"
Aerohive Networks. Inc.
14:D6:4D:EB:D4:A8 HOTEL_AUDITORIU
M
AP "HOTEL_AUDITORIUM" from location "First floor"
D-Link International
First floor
08:EA:44:27:AA:A8 HOTEL_AUDITORIU
M
AP "HOTEL_AUDITORIUM" from location "Second floor"
Aerohive Networks. Inc.
Second floor
08:EA:44:27:FB:14 HOTEL_AUDITORIU
M
18 "HOTEL_AUDITORIUM" from location "Ground floor"
Aerohive Networks. Inc.
08:EA:44:27:A1:54 HOTEL_AUDITORIU
M
19 "HOTEL_AUDITORIUM" from location "Ground floor"
Aerohive Networks. Inc.
08:EA:44:27:F9:94 HOTEL_AUDITORIU
M
20 "HOTEL_AUDITORIUM" from location "Ground floor"
Aerohive Networks. Inc.
08:EA:44:27:AC:94 HOTEL_AUDITORIU
M
AP "HOTEL_AUDITORIUM" from location "First floor"
Aerohive Networks. Inc.
First floor
08:EA:44:27:AA:94 HOTEL_AUDITORIU
M
AP "HOTEL_AUDITORIUM" from location "First floor"
Aerohive Networks. Inc.
First floor
08:EA:44:27:9F:D4 HOTEL_AUDITORIU
M
AP "HOTEL_AUDITORIUM" from location "First floor"
Aerohive Networks. Inc.
First floor
08:EA:44:27:9B:14 HOTEL_AUDITORIU
M
21 "HOTEL_AUDITORIUM" from location "Ground floor"
Aerohive Networks. Inc.
08:EA:44:27:AB:54 HOTEL_AUDITORIU
M
AP "HOTEL_AUDITORIUM" from location "First floor"
Aerohive Networks. Inc.
First floor
08:EA:44:32:B3:D4 HOTEL_AUDITORIU
M
22 "HOTEL_AUDITORIUM" from location "Ground floor"
Aerohive Networks. Inc.
08:EA:44:27:A9:14 HOTEL_A 23 "HOTEL_AUDITORIUM" Aerohive
auditorium - Acrylic Wi-Fi HeatMaps - Site survey v2.0 - 2015 13
BSSID SSID INVENTORY NAME DESCRIPTION VENDOR LOCATION
UDITORIUM
from location "Ground floor" Networks. Inc.
08:EA:44:27:FB:D4 HOTEL_AUDITORIU
M
24 "HOTEL_AUDITORIUM" from location "Ground floor"
Aerohive Networks. Inc.
08:EA:44:27:F9:14 HOTEL_AUDITORIU
M
25 "HOTEL_AUDITORIUM" from location "Ground floor"
Aerohive Networks. Inc.
08:EA:44:27:AB:D4 HOTEL_AUDITORIU
M
26 "HOTEL_AUDITORIUM" from location "Ground floor"
Aerohive Networks. Inc.
08:EA:44:27:A1:94 HOTEL_AUDITORIU
M
27 "HOTEL_AUDITORIUM" from location "Ground floor"
Aerohive Networks. Inc.
auditorium - Acrylic Wi-Fi HeatMaps - Site survey v2.0 - 2015 14
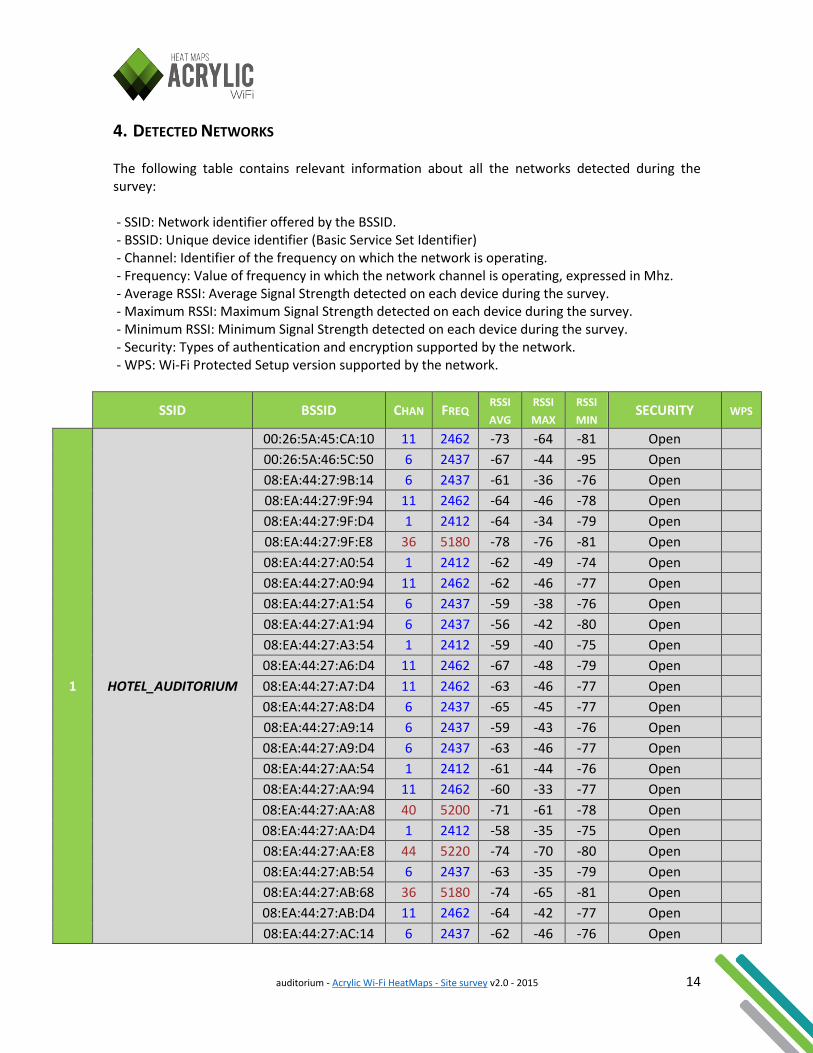
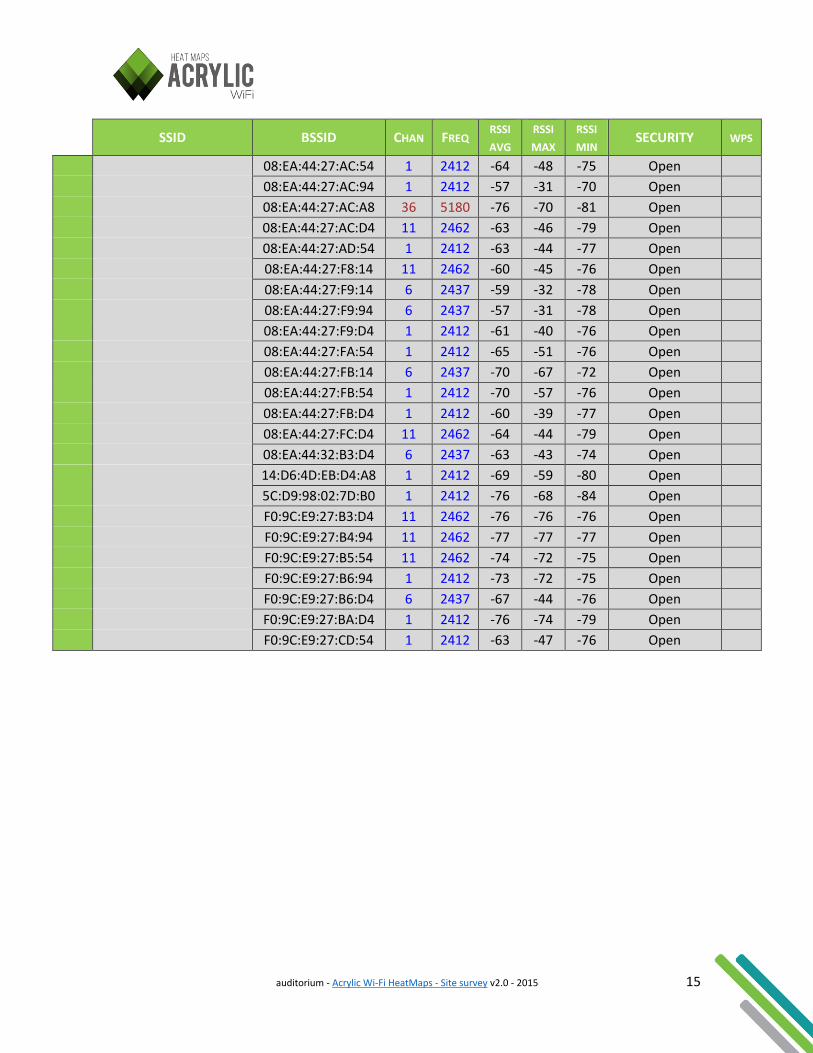
4. DETECTED NETWORKS The following table contains relevant information about all the networks detected during the survey: - SSID: Network identifier offered by the BSSID. - BSSID: Unique device identifier (Basic Service Set Identifier) - Channel: Identifier of the frequency on which the network is operating. - Frequency: Value of frequency in which the network channel is operating, expressed in Mhz. - Average RSSI: Average Signal Strength detected on each device during the survey. - Maximum RSSI: Maximum Signal Strength detected on each device during the survey. - Minimum RSSI: Minimum Signal Strength detected on each device during the survey. - Security: Types of authentication and encryption supported by the network. - WPS: Wi-Fi Protected Setup version supported by the network.
SSID BSSID CHAN FREQ
RSSI
AVG RSSI
MAX RSSI
MIN SECURITY WPS
1 HOTEL_AUDITORIUM
00:26:5A:45:CA:10 11 2462 -73 -64 -81 Open
00:26:5A:46:5C:50 6 2437 -67 -44 -95 Open
08:EA:44:27:9B:14 6 2437 -61 -36 -76 Open
08:EA:44:27:9F:94 11 2462 -64 -46 -78 Open
08:EA:44:27:9F:D4 1 2412 -64 -34 -79 Open
08:EA:44:27:9F:E8 36 5180 -78 -76 -81 Open
08:EA:44:27:A0:54 1 2412 -62 -49 -74 Open
08:EA:44:27:A0:94 11 2462 -62 -46 -77 Open
08:EA:44:27:A1:54 6 2437 -59 -38 -76 Open
08:EA:44:27:A1:94 6 2437 -56 -42 -80 Open
08:EA:44:27:A3:54 1 2412 -59 -40 -75 Open
08:EA:44:27:A6:D4 11 2462 -67 -48 -79 Open
08:EA:44:27:A7:D4 11 2462 -63 -46 -77 Open
08:EA:44:27:A8:D4 6 2437 -65 -45 -77 Open
08:EA:44:27:A9:14 6 2437 -59 -43 -76 Open
08:EA:44:27:A9:D4 6 2437 -63 -46 -77 Open
08:EA:44:27:AA:54 1 2412 -61 -44 -76 Open
08:EA:44:27:AA:94 11 2462 -60 -33 -77 Open
08:EA:44:27:AA:A8 40 5200 -71 -61 -78 Open
08:EA:44:27:AA:D4 1 2412 -58 -35 -75 Open
08:EA:44:27:AA:E8 44 5220 -74 -70 -80 Open
08:EA:44:27:AB:54 6 2437 -63 -35 -79 Open
08:EA:44:27:AB:68 36 5180 -74 -65 -81 Open
08:EA:44:27:AB:D4 11 2462 -64 -42 -77 Open
08:EA:44:27:AC:14 6 2437 -62 -46 -76 Open
auditorium - Acrylic Wi-Fi HeatMaps - Site survey v2.0 - 2015 15
SSID BSSID CHAN FREQ
RSSI
AVG RSSI
MAX RSSI
MIN SECURITY WPS
08:EA:44:27:AC:54 1 2412 -64 -48 -75 Open
08:EA:44:27:AC:94 1 2412 -57 -31 -70 Open
08:EA:44:27:AC:A8 36 5180 -76 -70 -81 Open
08:EA:44:27:AC:D4 11 2462 -63 -46 -79 Open
08:EA:44:27:AD:54 1 2412 -63 -44 -77 Open
08:EA:44:27:F8:14 11 2462 -60 -45 -76 Open
08:EA:44:27:F9:14 6 2437 -59 -32 -78 Open
08:EA:44:27:F9:94 6 2437 -57 -31 -78 Open
08:EA:44:27:F9:D4 1 2412 -61 -40 -76 Open
08:EA:44:27:FA:54 1 2412 -65 -51 -76 Open
08:EA:44:27:FB:14 6 2437 -70 -67 -72 Open
08:EA:44:27:FB:54 1 2412 -70 -57 -76 Open
08:EA:44:27:FB:D4 1 2412 -60 -39 -77 Open
08:EA:44:27:FC:D4 11 2462 -64 -44 -79 Open
08:EA:44:32:B3:D4 6 2437 -63 -43 -74 Open
14:D6:4D:EB:D4:A8 1 2412 -69 -59 -80 Open
5C:D9:98:02:7D:B0 1 2412 -76 -68 -84 Open
F0:9C:E9:27:B3:D4 11 2462 -76 -76 -76 Open
F0:9C:E9:27:B4:94 11 2462 -77 -77 -77 Open
F0:9C:E9:27:B5:54 11 2462 -74 -72 -75 Open
F0:9C:E9:27:B6:94 1 2412 -73 -72 -75 Open
F0:9C:E9:27:B6:D4 6 2437 -67 -44 -76 Open
F0:9C:E9:27:BA:D4 1 2412 -76 -74 -79 Open
F0:9C:E9:27:CD:54 1 2412 -63 -47 -76 Open
auditorium - Acrylic Wi-Fi HeatMaps - Site survey v2.0 - 2015 16
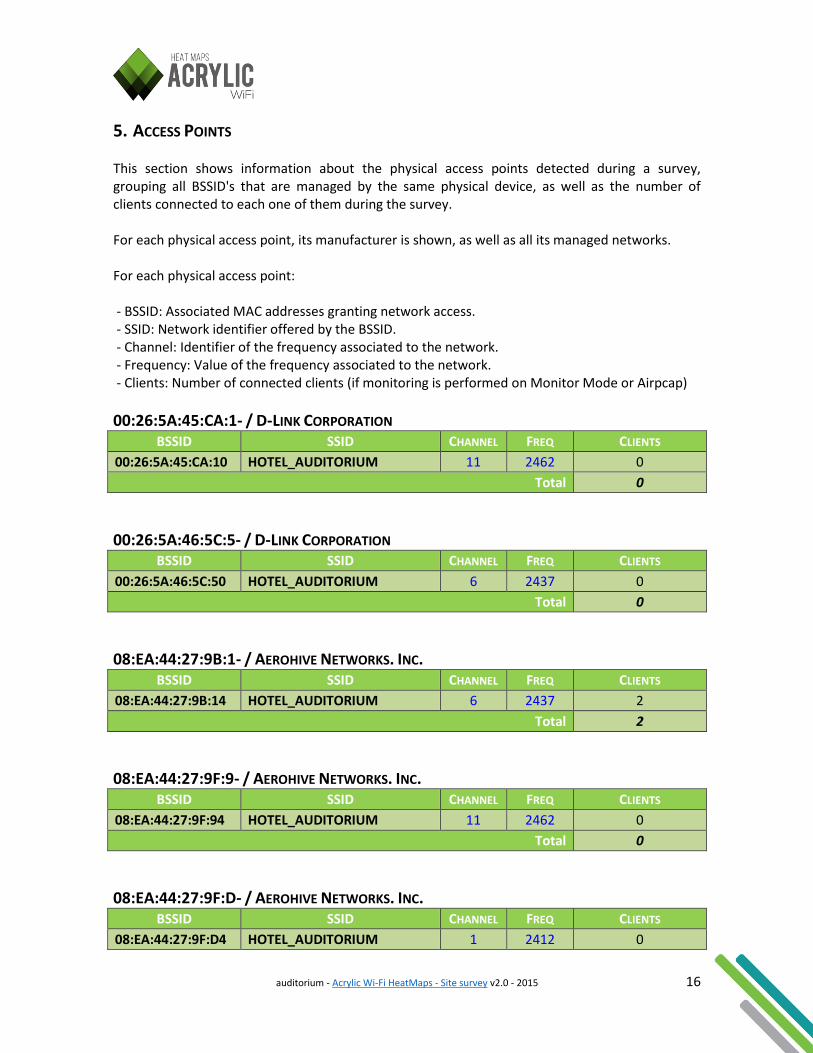
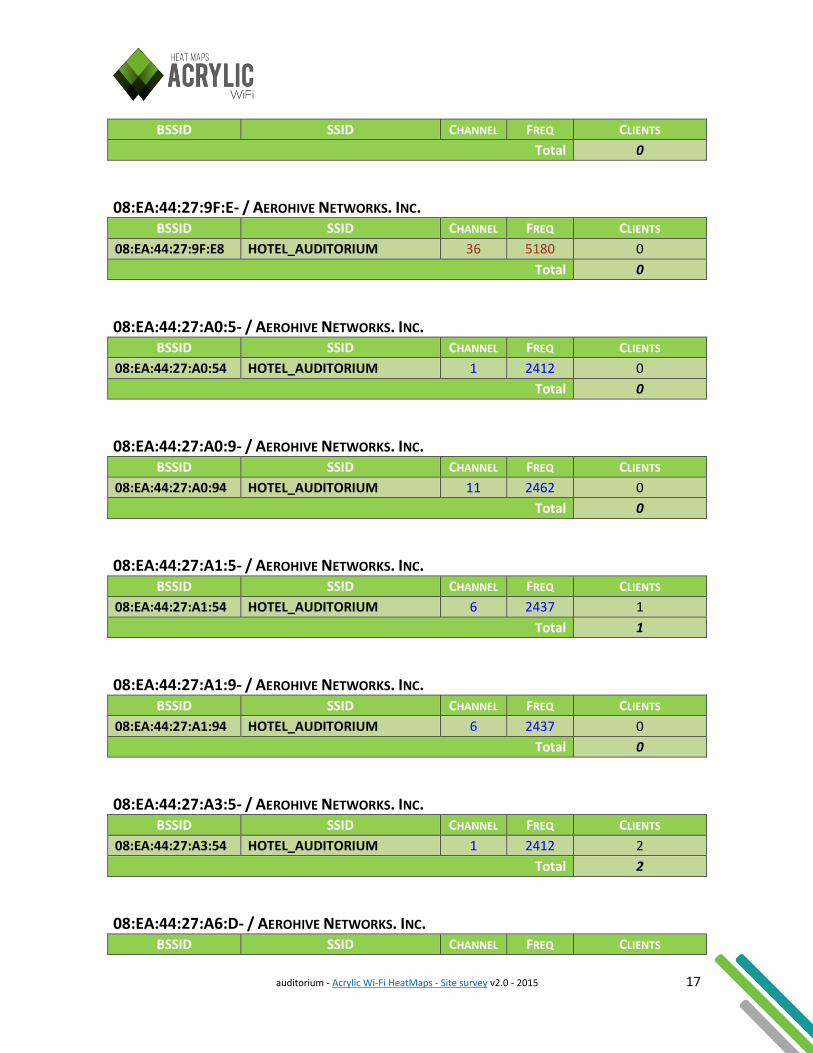
5. ACCESS POINTS This section shows information about the physical access points detected during a survey, grouping all BSSID's that are managed by the same physical device, as well as the number of clients connected to each one of them during the survey. For each physical access point, its manufacturer is shown, as well as all its managed networks. For each physical access point: - BSSID: Associated MAC addresses granting network access. - SSID: Network identifier offered by the BSSID. - Channel: Identifier of the frequency associated to the network. - Frequency: Value of the frequency associated to the network. - Clients: Number of connected clients (if monitoring is performed on Monitor Mode or Airpcap)
00:26:5A:45:CA:1- / D-LINK CORPORATION
BSSID SSID CHANNEL FREQ CLIENTS
00:26:5A:45:CA:10 HOTEL_AUDITORIUM 11 2462 0
Total 0
00:26:5A:46:5C:5- / D-LINK CORPORATION
BSSID SSID CHANNEL FREQ CLIENTS
00:26:5A:46:5C:50 HOTEL_AUDITORIUM 6 2437 0
Total 0
08:EA:44:27:9B:1- / AEROHIVE NETWORKS. INC. BSSID SSID CHANNEL FREQ CLIENTS
08:EA:44:27:9B:14 HOTEL_AUDITORIUM 6 2437 2
Total 2
08:EA:44:27:9F:9- / AEROHIVE NETWORKS. INC. BSSID SSID CHANNEL FREQ CLIENTS
08:EA:44:27:9F:94 HOTEL_AUDITORIUM 11 2462 0
Total 0
08:EA:44:27:9F:D- / AEROHIVE NETWORKS. INC. BSSID SSID CHANNEL FREQ CLIENTS
08:EA:44:27:9F:D4 HOTEL_AUDITORIUM 1 2412 0
auditorium - Acrylic Wi-Fi HeatMaps - Site survey v2.0 - 2015 17
BSSID SSID CHANNEL FREQ CLIENTS
Total 0
08:EA:44:27:9F:E- / AEROHIVE NETWORKS. INC. BSSID SSID CHANNEL FREQ CLIENTS
08:EA:44:27:9F:E8 HOTEL_AUDITORIUM 36 5180 0
Total 0
08:EA:44:27:A0:5- / AEROHIVE NETWORKS. INC. BSSID SSID CHANNEL FREQ CLIENTS
08:EA:44:27:A0:54 HOTEL_AUDITORIUM 1 2412 0
Total 0
08:EA:44:27:A0:9- / AEROHIVE NETWORKS. INC. BSSID SSID CHANNEL FREQ CLIENTS
08:EA:44:27:A0:94 HOTEL_AUDITORIUM 11 2462 0
Total 0
08:EA:44:27:A1:5- / AEROHIVE NETWORKS. INC. BSSID SSID CHANNEL FREQ CLIENTS
08:EA:44:27:A1:54 HOTEL_AUDITORIUM 6 2437 1
Total 1
08:EA:44:27:A1:9- / AEROHIVE NETWORKS. INC. BSSID SSID CHANNEL FREQ CLIENTS
08:EA:44:27:A1:94 HOTEL_AUDITORIUM 6 2437 0
Total 0
08:EA:44:27:A3:5- / AEROHIVE NETWORKS. INC. BSSID SSID CHANNEL FREQ CLIENTS
08:EA:44:27:A3:54 HOTEL_AUDITORIUM 1 2412 2
Total 2
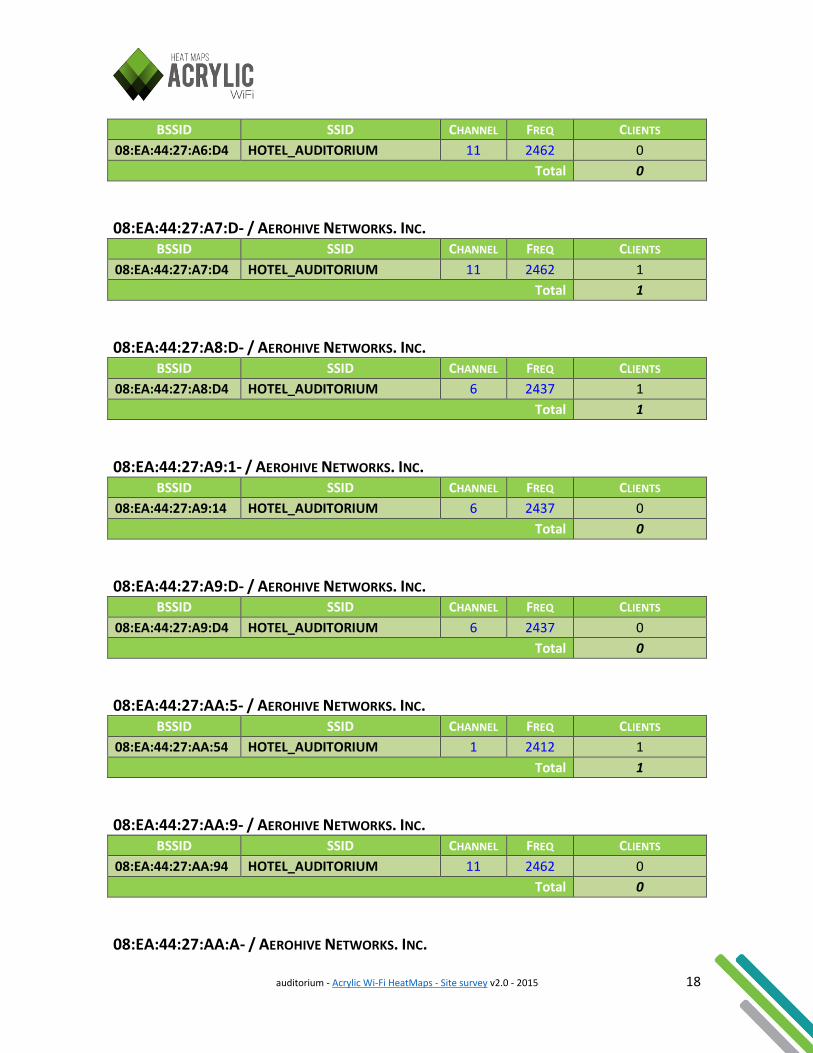
08:EA:44:27:A6:D- / AEROHIVE NETWORKS. INC. BSSID SSID CHANNEL FREQ CLIENTS
auditorium - Acrylic Wi-Fi HeatMaps - Site survey v2.0 - 2015 18
BSSID SSID CHANNEL FREQ CLIENTS
08:EA:44:27:A6:D4 HOTEL_AUDITORIUM 11 2462 0
Total 0
08:EA:44:27:A7:D- / AEROHIVE NETWORKS. INC. BSSID SSID CHANNEL FREQ CLIENTS
08:EA:44:27:A7:D4 HOTEL_AUDITORIUM 11 2462 1
Total 1
08:EA:44:27:A8:D- / AEROHIVE NETWORKS. INC. BSSID SSID CHANNEL FREQ CLIENTS
08:EA:44:27:A8:D4 HOTEL_AUDITORIUM 6 2437 1
Total 1
08:EA:44:27:A9:1- / AEROHIVE NETWORKS. INC. BSSID SSID CHANNEL FREQ CLIENTS
08:EA:44:27:A9:14 HOTEL_AUDITORIUM 6 2437 0
Total 0
08:EA:44:27:A9:D- / AEROHIVE NETWORKS. INC. BSSID SSID CHANNEL FREQ CLIENTS
08:EA:44:27:A9:D4 HOTEL_AUDITORIUM 6 2437 0
Total 0
08:EA:44:27:AA:5- / AEROHIVE NETWORKS. INC. BSSID SSID CHANNEL FREQ CLIENTS
08:EA:44:27:AA:54 HOTEL_AUDITORIUM 1 2412 1
Total 1
08:EA:44:27:AA:9- / AEROHIVE NETWORKS. INC. BSSID SSID CHANNEL FREQ CLIENTS
08:EA:44:27:AA:94 HOTEL_AUDITORIUM 11 2462 0
Total 0
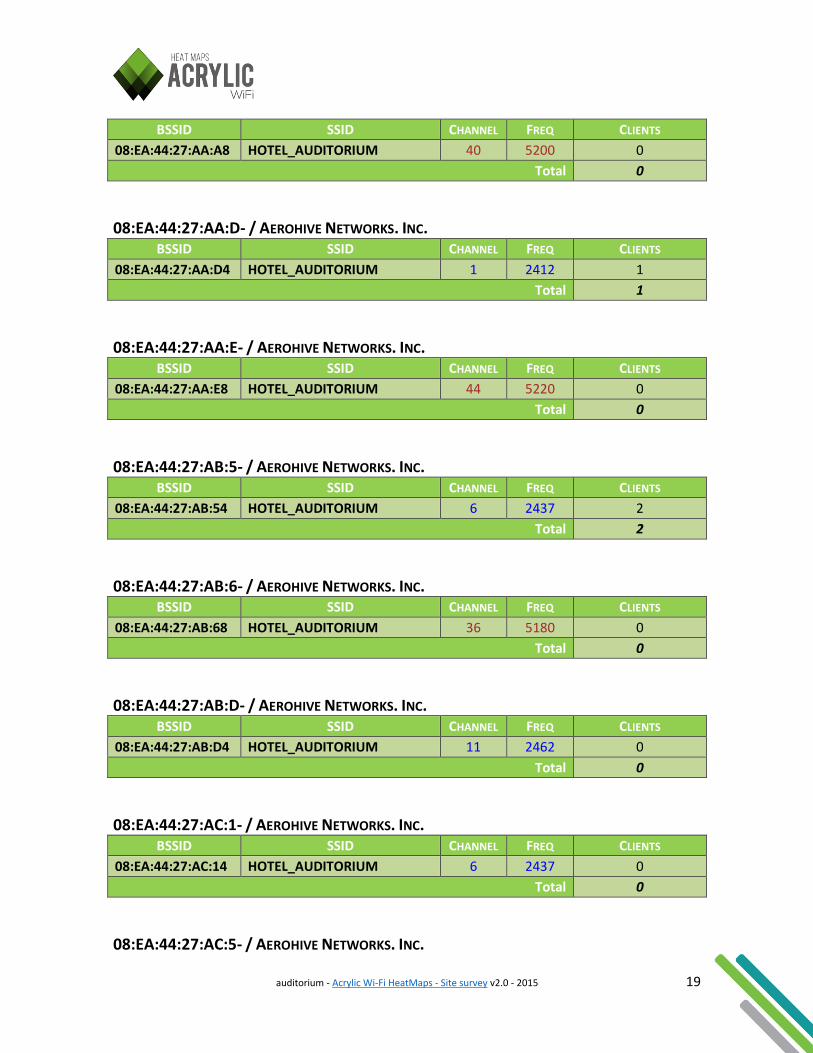
08:EA:44:27:AA:A- / AEROHIVE NETWORKS. INC.
auditorium - Acrylic Wi-Fi HeatMaps - Site survey v2.0 - 2015 19
BSSID SSID CHANNEL FREQ CLIENTS
08:EA:44:27:AA:A8 HOTEL_AUDITORIUM 40 5200 0
Total 0
08:EA:44:27:AA:D- / AEROHIVE NETWORKS. INC. BSSID SSID CHANNEL FREQ CLIENTS
08:EA:44:27:AA:D4 HOTEL_AUDITORIUM 1 2412 1
Total 1
08:EA:44:27:AA:E- / AEROHIVE NETWORKS. INC. BSSID SSID CHANNEL FREQ CLIENTS
08:EA:44:27:AA:E8 HOTEL_AUDITORIUM 44 5220 0
Total 0
08:EA:44:27:AB:5- / AEROHIVE NETWORKS. INC. BSSID SSID CHANNEL FREQ CLIENTS
08:EA:44:27:AB:54 HOTEL_AUDITORIUM 6 2437 2
Total 2
08:EA:44:27:AB:6- / AEROHIVE NETWORKS. INC. BSSID SSID CHANNEL FREQ CLIENTS
08:EA:44:27:AB:68 HOTEL_AUDITORIUM 36 5180 0
Total 0
08:EA:44:27:AB:D- / AEROHIVE NETWORKS. INC. BSSID SSID CHANNEL FREQ CLIENTS
08:EA:44:27:AB:D4 HOTEL_AUDITORIUM 11 2462 0
Total 0
08:EA:44:27:AC:1- / AEROHIVE NETWORKS. INC. BSSID SSID CHANNEL FREQ CLIENTS
08:EA:44:27:AC:14 HOTEL_AUDITORIUM 6 2437 0
Total 0
08:EA:44:27:AC:5- / AEROHIVE NETWORKS. INC.

auditorium - Acrylic Wi-Fi HeatMaps - Site survey v2.0 - 2015 20
BSSID SSID CHANNEL FREQ CLIENTS
08:EA:44:27:AC:54 HOTEL_AUDITORIUM 1 2412 0
Total 0
08:EA:44:27:AC:9- / AEROHIVE NETWORKS. INC. BSSID SSID CHANNEL FREQ CLIENTS
08:EA:44:27:AC:94 HOTEL_AUDITORIUM 1 2412 1
Total 1
08:EA:44:27:AC:A- / AEROHIVE NETWORKS. INC. BSSID SSID CHANNEL FREQ CLIENTS
08:EA:44:27:AC:A8 HOTEL_AUDITORIUM 36 5180 0
Total 0
08:EA:44:27:AC:D- / AEROHIVE NETWORKS. INC. BSSID SSID CHANNEL FREQ CLIENTS
08:EA:44:27:AC:D4 HOTEL_AUDITORIUM 11 2462 0
Total 0
08:EA:44:27:AD:5- / AEROHIVE NETWORKS. INC. BSSID SSID CHANNEL FREQ CLIENTS
08:EA:44:27:AD:54 HOTEL_AUDITORIUM 1 2412 0
Total 0
08:EA:44:27:F8:1- / AEROHIVE NETWORKS. INC. BSSID SSID CHANNEL FREQ CLIENTS
08:EA:44:27:F8:14 HOTEL_AUDITORIUM 11 2462 0
Total 0
08:EA:44:27:F9:1- / AEROHIVE NETWORKS. INC. BSSID SSID CHANNEL FREQ CLIENTS
08:EA:44:27:F9:14 HOTEL_AUDITORIUM 6 2437 2
Total 2
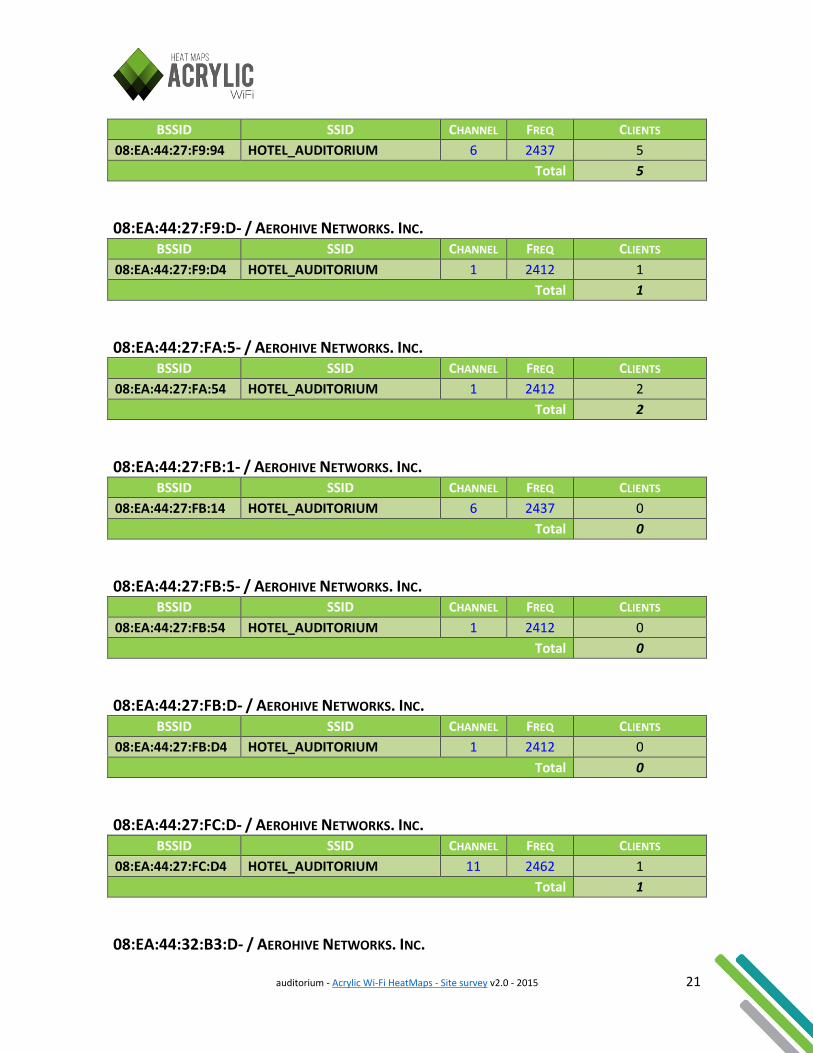
08:EA:44:27:F9:9- / AEROHIVE NETWORKS. INC.
auditorium - Acrylic Wi-Fi HeatMaps - Site survey v2.0 - 2015 21
BSSID SSID CHANNEL FREQ CLIENTS
08:EA:44:27:F9:94 HOTEL_AUDITORIUM 6 2437 5
Total 5
08:EA:44:27:F9:D- / AEROHIVE NETWORKS. INC. BSSID SSID CHANNEL FREQ CLIENTS
08:EA:44:27:F9:D4 HOTEL_AUDITORIUM 1 2412 1
Total 1
08:EA:44:27:FA:5- / AEROHIVE NETWORKS. INC. BSSID SSID CHANNEL FREQ CLIENTS
08:EA:44:27:FA:54 HOTEL_AUDITORIUM 1 2412 2
Total 2
08:EA:44:27:FB:1- / AEROHIVE NETWORKS. INC. BSSID SSID CHANNEL FREQ CLIENTS
08:EA:44:27:FB:14 HOTEL_AUDITORIUM 6 2437 0
Total 0
08:EA:44:27:FB:5- / AEROHIVE NETWORKS. INC. BSSID SSID CHANNEL FREQ CLIENTS
08:EA:44:27:FB:54 HOTEL_AUDITORIUM 1 2412 0
Total 0
08:EA:44:27:FB:D- / AEROHIVE NETWORKS. INC. BSSID SSID CHANNEL FREQ CLIENTS
08:EA:44:27:FB:D4 HOTEL_AUDITORIUM 1 2412 0
Total 0
08:EA:44:27:FC:D- / AEROHIVE NETWORKS. INC. BSSID SSID CHANNEL FREQ CLIENTS
08:EA:44:27:FC:D4 HOTEL_AUDITORIUM 11 2462 1
Total 1
08:EA:44:32:B3:D- / AEROHIVE NETWORKS. INC.
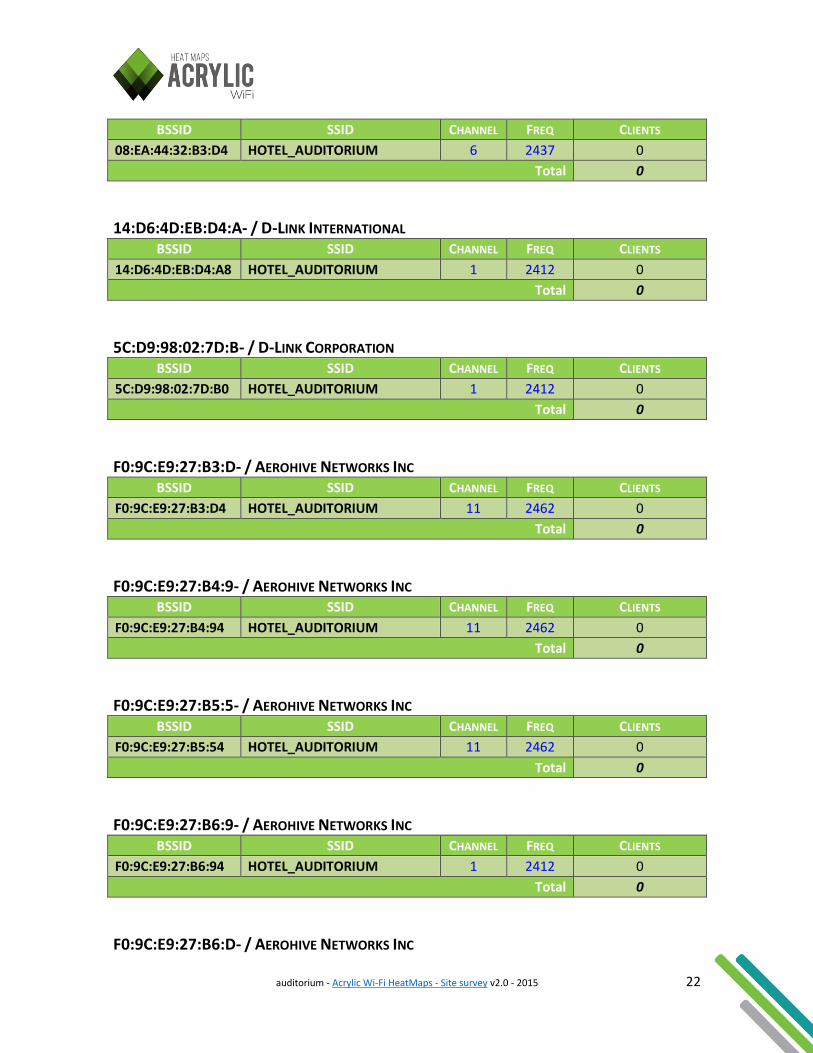
auditorium - Acrylic Wi-Fi HeatMaps - Site survey v2.0 - 2015 22
BSSID SSID CHANNEL FREQ CLIENTS
08:EA:44:32:B3:D4 HOTEL_AUDITORIUM 6 2437 0
Total 0
14:D6:4D:EB:D4:A- / D-LINK INTERNATIONAL
BSSID SSID CHANNEL FREQ CLIENTS
14:D6:4D:EB:D4:A8 HOTEL_AUDITORIUM 1 2412 0
Total 0
5C:D9:98:02:7D:B- / D-LINK CORPORATION
BSSID SSID CHANNEL FREQ CLIENTS
5C:D9:98:02:7D:B0 HOTEL_AUDITORIUM 1 2412 0
Total 0
F0:9C:E9:27:B3:D- / AEROHIVE NETWORKS INC
BSSID SSID CHANNEL FREQ CLIENTS
F0:9C:E9:27:B3:D4 HOTEL_AUDITORIUM 11 2462 0
Total 0
F0:9C:E9:27:B4:9- / AEROHIVE NETWORKS INC
BSSID SSID CHANNEL FREQ CLIENTS
F0:9C:E9:27:B4:94 HOTEL_AUDITORIUM 11 2462 0
Total 0
F0:9C:E9:27:B5:5- / AEROHIVE NETWORKS INC
BSSID SSID CHANNEL FREQ CLIENTS
F0:9C:E9:27:B5:54 HOTEL_AUDITORIUM 11 2462 0
Total 0
F0:9C:E9:27:B6:9- / AEROHIVE NETWORKS INC
BSSID SSID CHANNEL FREQ CLIENTS
F0:9C:E9:27:B6:94 HOTEL_AUDITORIUM 1 2412 0
Total 0
F0:9C:E9:27:B6:D- / AEROHIVE NETWORKS INC
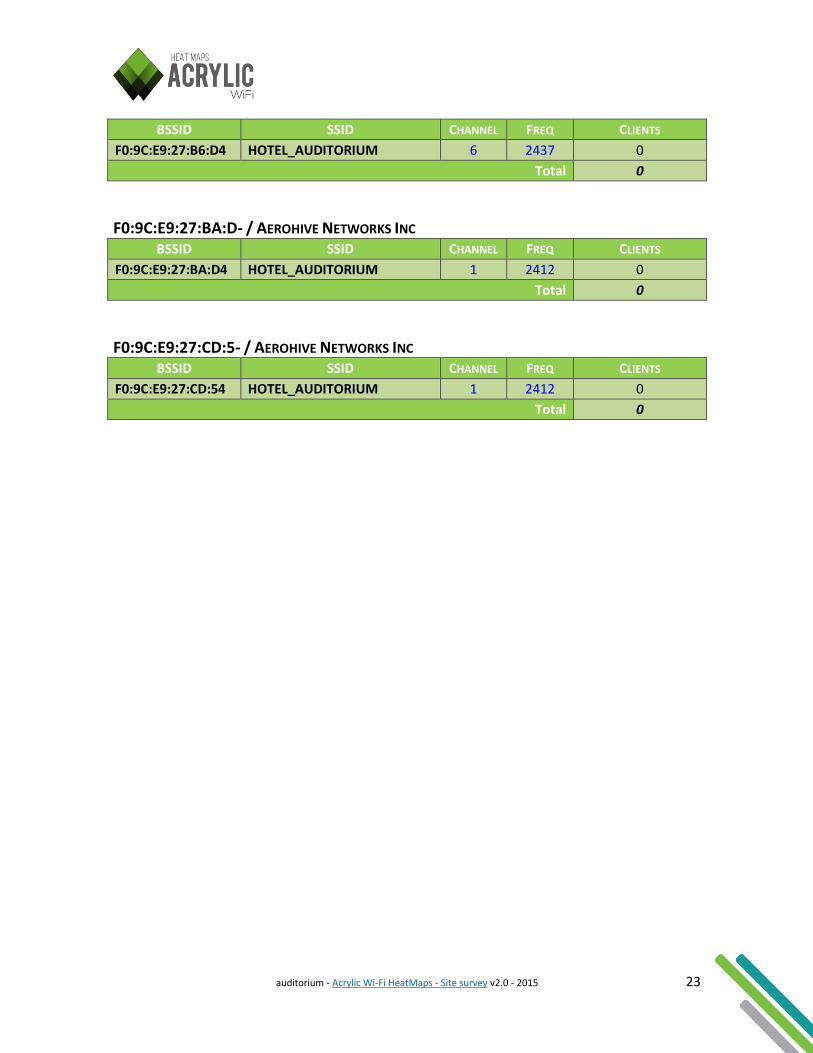
auditorium - Acrylic Wi-Fi HeatMaps - Site survey v2.0 - 2015 23
BSSID SSID CHANNEL FREQ CLIENTS
F0:9C:E9:27:B6:D4 HOTEL_AUDITORIUM 6 2437 0
Total 0
F0:9C:E9:27:BA:D- / AEROHIVE NETWORKS INC
BSSID SSID CHANNEL FREQ CLIENTS
F0:9C:E9:27:BA:D4 HOTEL_AUDITORIUM 1 2412 0
Total 0
F0:9C:E9:27:CD:5- / AEROHIVE NETWORKS INC
BSSID SSID CHANNEL FREQ CLIENTS
F0:9C:E9:27:CD:54 HOTEL_AUDITORIUM 1 2412 0
Total 0

auditorium - Acrylic Wi-Fi HeatMaps - Site survey v2.0 - 2015 24
6. LOCATION SURVEY: SECOND FLOOR 6.1. LOCATION INFORMATION Short data related to the Second floor Location
Location Name Second floor
Scans 1
Stations 5
Blueprint for the location Second floor
auditorium - Acrylic Wi-Fi HeatMaps - Site survey v2.0 - 2015 25
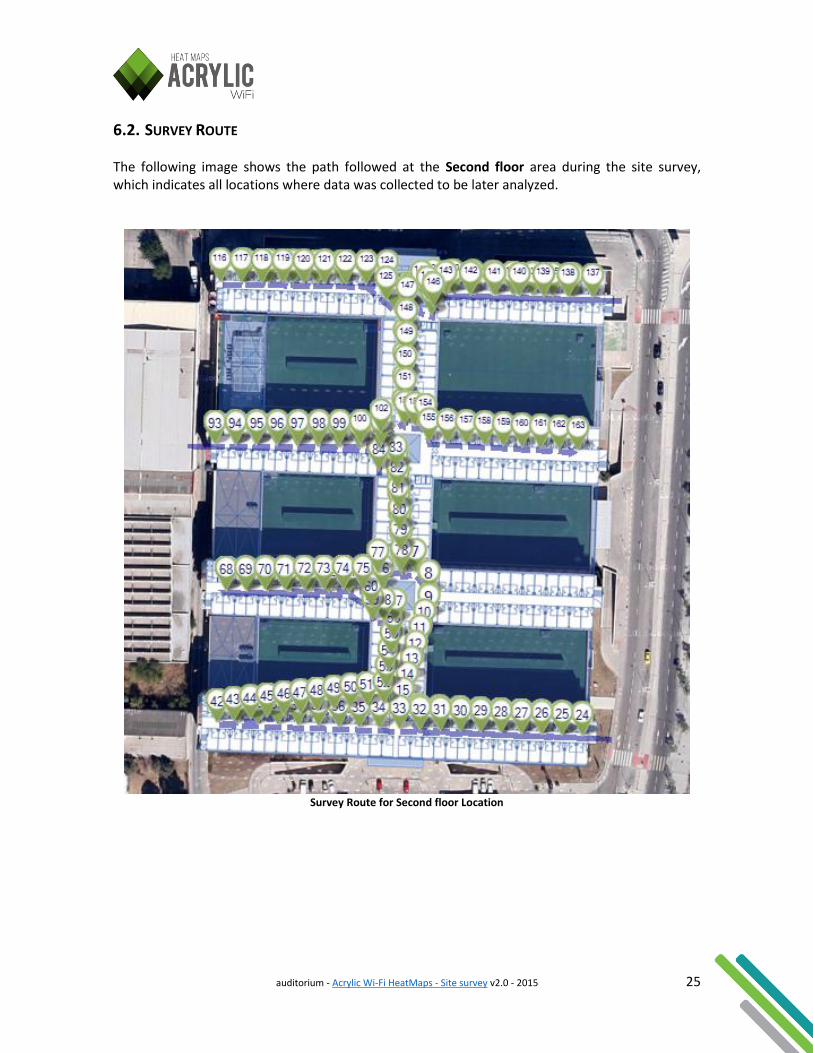
6.2. SURVEY ROUTE The following image shows the path followed at the Second floor area during the site survey, which indicates all locations where data was collected to be later analyzed.
Survey Route for Second floor Location
auditorium - Acrylic Wi-Fi HeatMaps - Site survey v2.0 - 2015 26
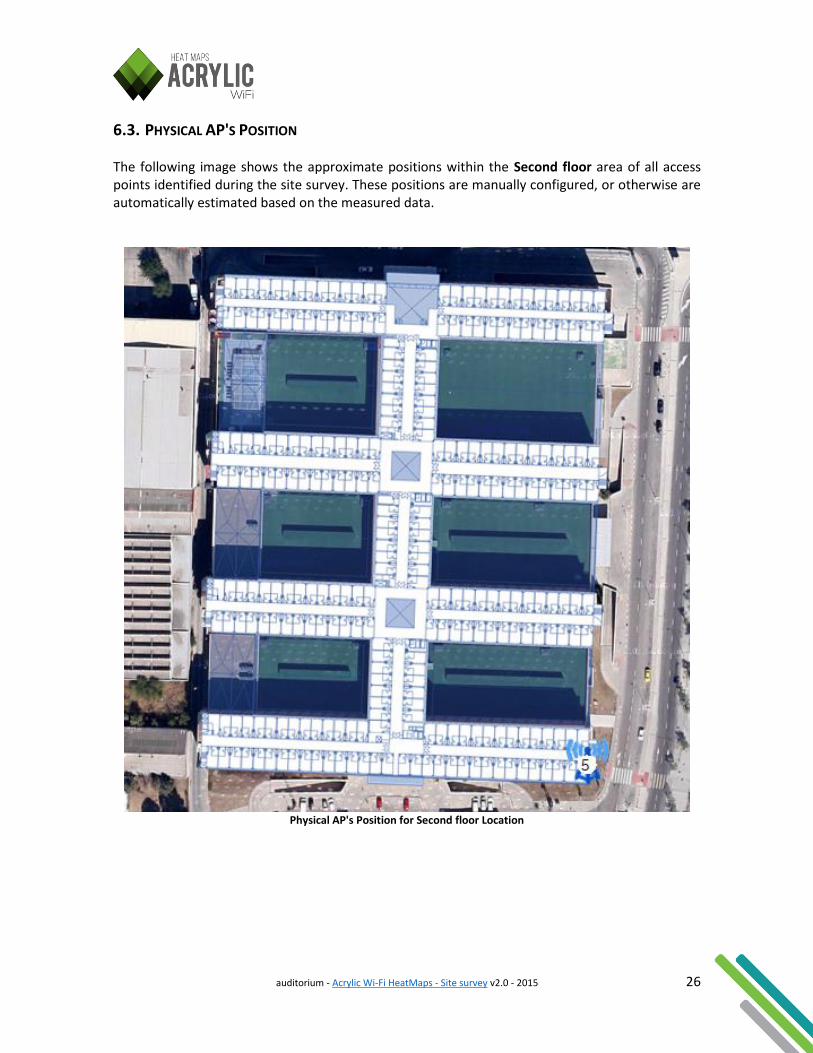
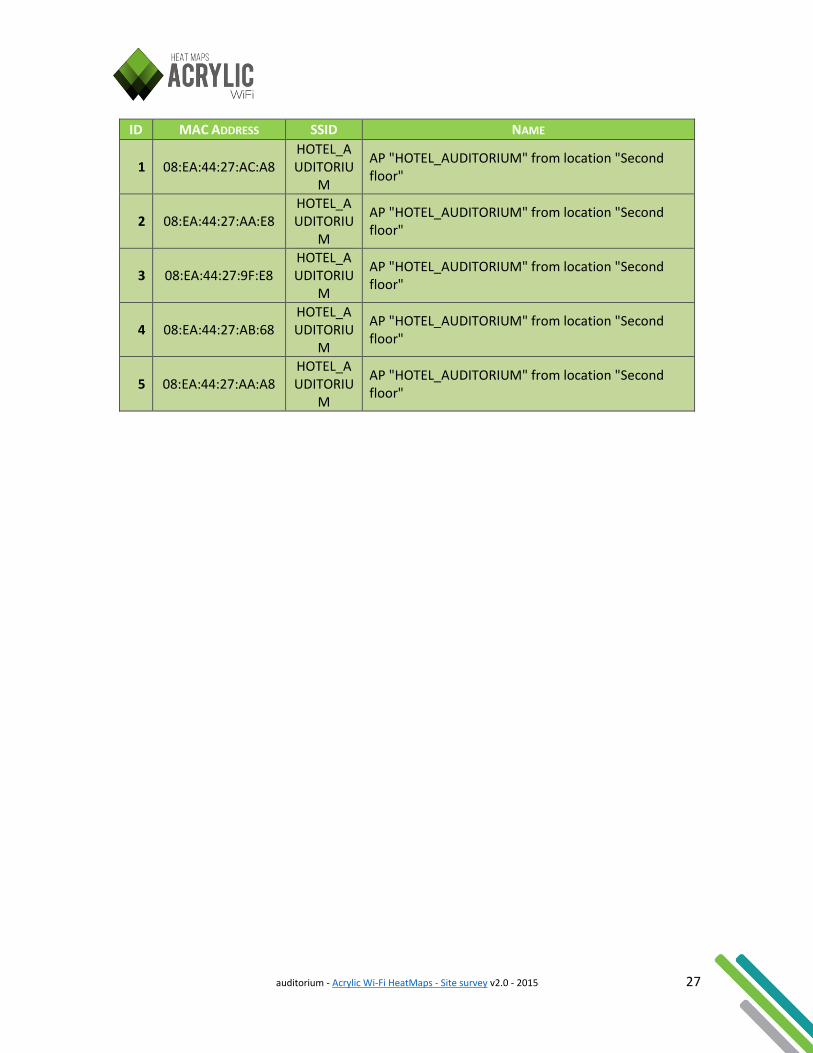
6.3. PHYSICAL AP'S POSITION The following image shows the approximate positions within the Second floor area of all access points identified during the site survey. These positions are manually configured, or otherwise are automatically estimated based on the measured data.
Physical AP's Position for Second floor Location
auditorium - Acrylic Wi-Fi HeatMaps - Site survey v2.0 - 2015 27
ID MAC ADDRESS SSID NAME
1 08:EA:44:27:AC:A8 HOTEL_AUDITORIU
M
AP "HOTEL_AUDITORIUM" from location "Second floor"
2 08:EA:44:27:AA:E8 HOTEL_AUDITORIU
M
AP "HOTEL_AUDITORIUM" from location "Second floor"
3 08:EA:44:27:9F:E8 HOTEL_AUDITORIU
M
AP "HOTEL_AUDITORIUM" from location "Second floor"
4 08:EA:44:27:AB:68 HOTEL_AUDITORIU
M
AP "HOTEL_AUDITORIUM" from location "Second floor"
5 08:EA:44:27:AA:A8 HOTEL_AUDITORIU
M
AP "HOTEL_AUDITORIUM" from location "Second floor"
auditorium - Acrylic Wi-Fi HeatMaps - Site survey v2.0 - 2015 28
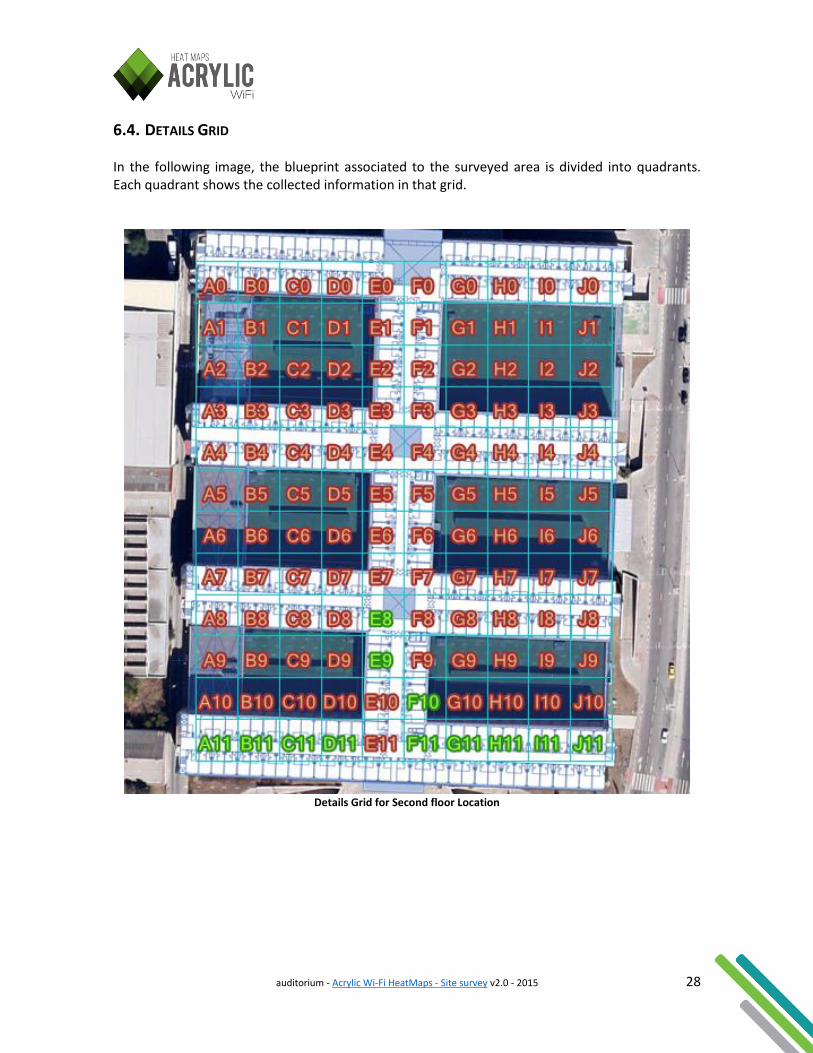
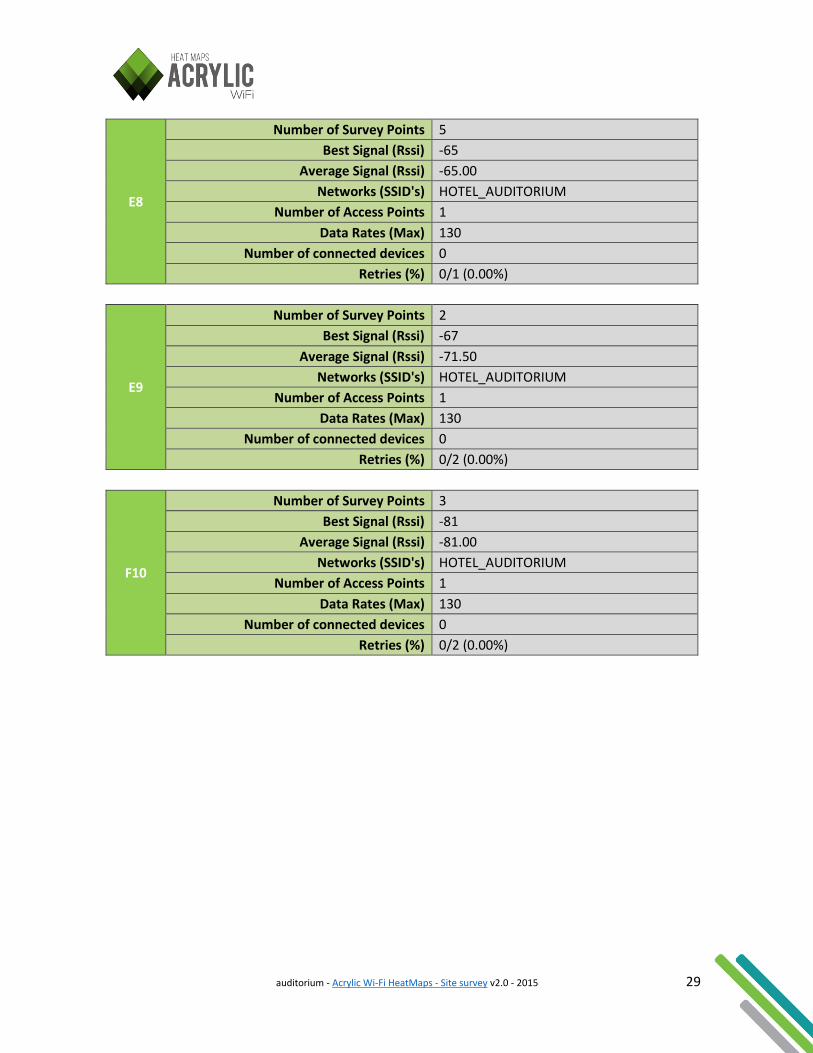
6.4. DETAILS GRID In the following image, the blueprint associated to the surveyed area is divided into quadrants. Each quadrant shows the collected information in that grid.
Details Grid for Second floor Location
auditorium - Acrylic Wi-Fi HeatMaps - Site survey v2.0 - 2015 29
E8
Number of Survey Points 5
Best Signal (Rssi) -65
Average Signal (Rssi) -65.00
Networks (SSID's) HOTEL_AUDITORIUM
Number of Access Points 1
Data Rates (Max) 130
Number of connected devices 0
Retries (%) 0/1 (0.00%)
E9
Number of Survey Points 2
Best Signal (Rssi) -67
Average Signal (Rssi) -71.50
Networks (SSID's) HOTEL_AUDITORIUM
Number of Access Points 1
Data Rates (Max) 130
Number of connected devices 0
Retries (%) 0/2 (0.00%)
F10
Number of Survey Points 3
Best Signal (Rssi) -81
Average Signal (Rssi) -81.00
Networks (SSID's) HOTEL_AUDITORIUM
Number of Access Points 1
Data Rates (Max) 130
Number of connected devices 0
Retries (%) 0/2 (0.00%)
auditorium - Acrylic Wi-Fi HeatMaps - Site survey v2.0 - 2015 30
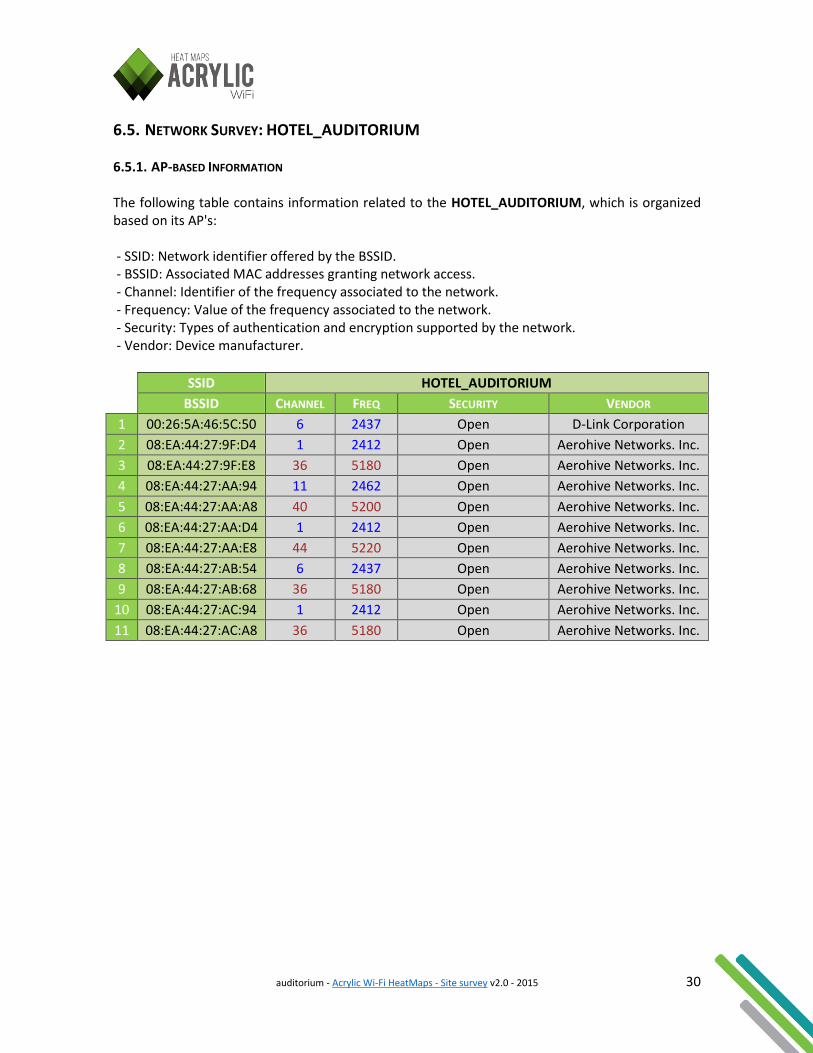
6.5. NETWORK SURVEY: HOTEL_AUDITORIUM 6.5.1. AP-BASED INFORMATION The following table contains information related to the HOTEL_AUDITORIUM, which is organized based on its AP's: - SSID: Network identifier offered by the BSSID. - BSSID: Associated MAC addresses granting network access. - Channel: Identifier of the frequency associated to the network. - Frequency: Value of the frequency associated to the network. - Security: Types of authentication and encryption supported by the network. - Vendor: Device manufacturer.
SSID HOTEL_AUDITORIUM
BSSID CHANNEL FREQ SECURITY VENDOR
1 00:26:5A:46:5C:50 6 2437 Open D-Link Corporation
2 08:EA:44:27:9F:D4 1 2412 Open Aerohive Networks. Inc.
3 08:EA:44:27:9F:E8 36 5180 Open Aerohive Networks. Inc.
4 08:EA:44:27:AA:94 11 2462 Open Aerohive Networks. Inc.
5 08:EA:44:27:AA:A8 40 5200 Open Aerohive Networks. Inc.
6 08:EA:44:27:AA:D4 1 2412 Open Aerohive Networks. Inc.
7 08:EA:44:27:AA:E8 44 5220 Open Aerohive Networks. Inc.
8 08:EA:44:27:AB:54 6 2437 Open Aerohive Networks. Inc.
9 08:EA:44:27:AB:68 36 5180 Open Aerohive Networks. Inc.
10 08:EA:44:27:AC:94 1 2412 Open Aerohive Networks. Inc.
11 08:EA:44:27:AC:A8 36 5180 Open Aerohive Networks. Inc.
auditorium - Acrylic Wi-Fi HeatMaps - Site survey v2.0 - 2015 31
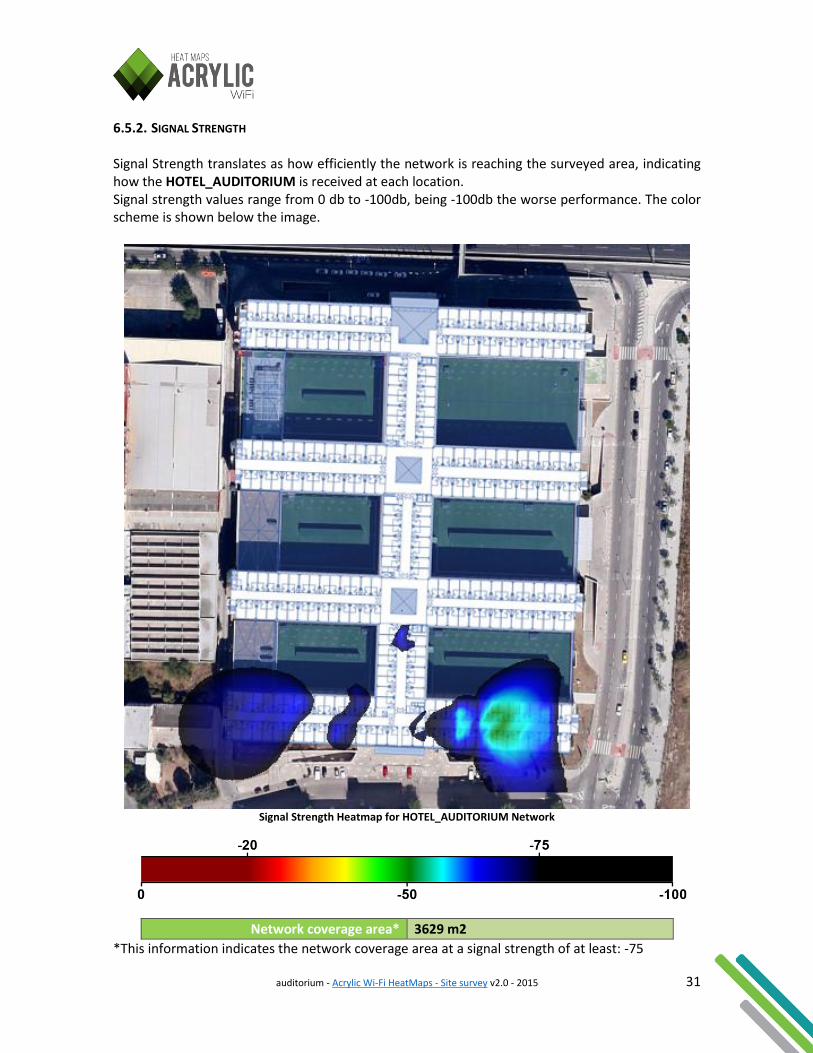
6.5.2. SIGNAL STRENGTH Signal Strength translates as how efficiently the network is reaching the surveyed area, indicating how the HOTEL_AUDITORIUM is received at each location. Signal strength values range from 0 db to -100db, being -100db the worse performance. The color scheme is shown below the image.
Signal Strength Heatmap for HOTEL_AUDITORIUM Network
Network coverage area* 3629 m2
*This information indicates the network coverage area at a signal strength of at least: -75
auditorium - Acrylic Wi-Fi HeatMaps - Site survey v2.0 - 2015 32
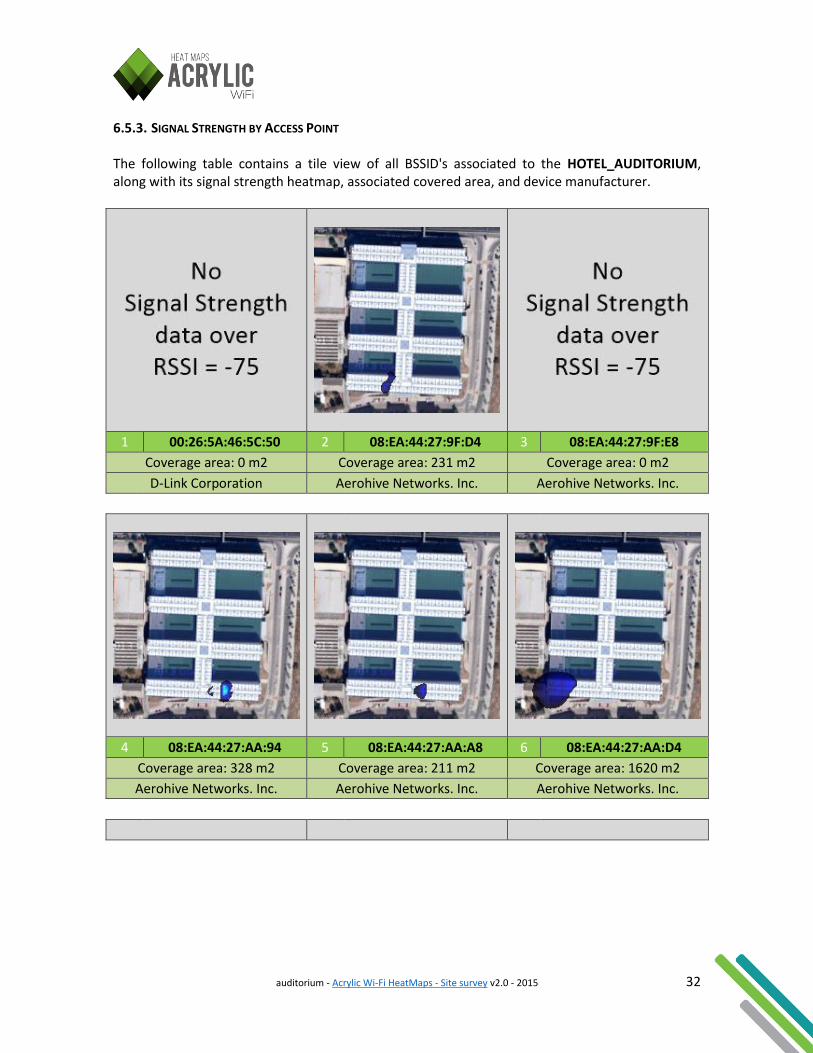
6.5.3. SIGNAL STRENGTH BY ACCESS POINT The following table contains a tile view of all BSSID's associated to the HOTEL_AUDITORIUM, along with its signal strength heatmap, associated covered area, and device manufacturer.
1 00:26:5A:46:5C:50 2 08:EA:44:27:9F:D4 3 08:EA:44:27:9F:E8
Coverage area: 0 m2 Coverage area: 231 m2 Coverage area: 0 m2
D-Link Corporation Aerohive Networks. Inc. Aerohive Networks. Inc.
4 08:EA:44:27:AA:94 5 08:EA:44:27:AA:A8 6 08:EA:44:27:AA:D4
Coverage area: 328 m2 Coverage area: 211 m2 Coverage area: 1620 m2
Aerohive Networks. Inc. Aerohive Networks. Inc. Aerohive Networks. Inc.
auditorium - Acrylic Wi-Fi HeatMaps - Site survey v2.0 - 2015 33
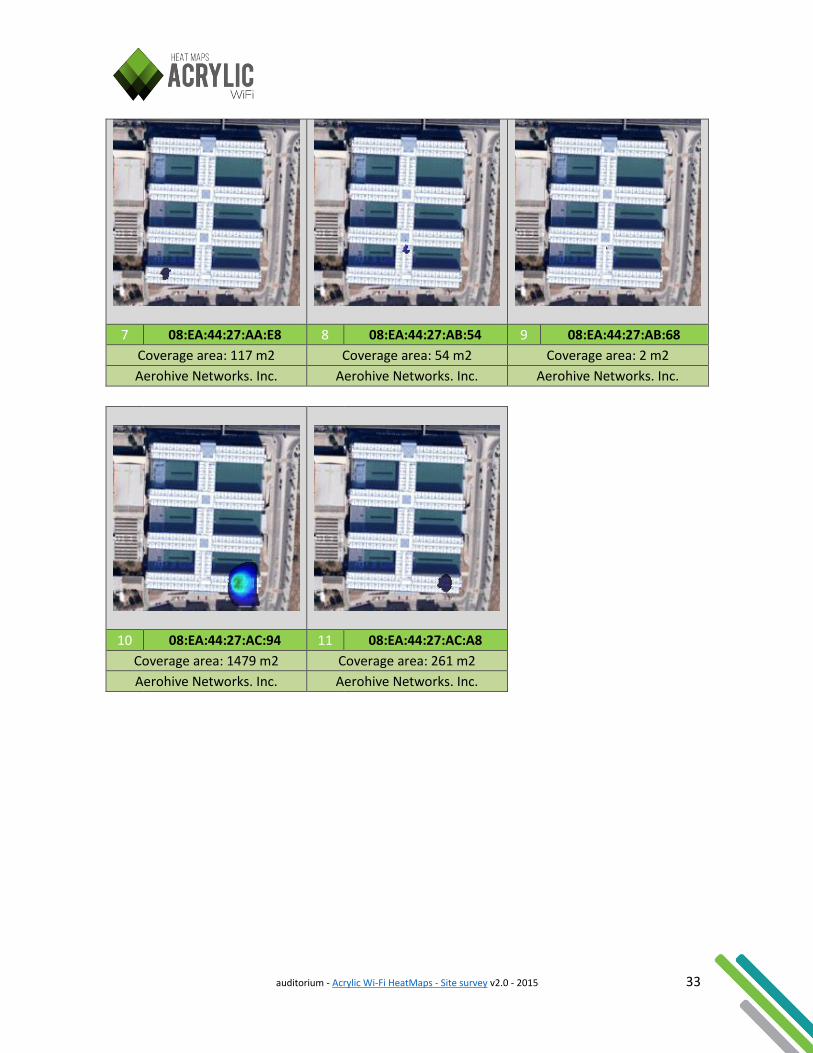
7 08:EA:44:27:AA:E8 8 08:EA:44:27:AB:54 9 08:EA:44:27:AB:68
Coverage area: 117 m2 Coverage area: 54 m2 Coverage area: 2 m2
Aerohive Networks. Inc. Aerohive Networks. Inc. Aerohive Networks. Inc.
10 08:EA:44:27:AC:94 11 08:EA:44:27:AC:A8
Coverage area: 1479 m2 Coverage area: 261 m2
Aerohive Networks. Inc. Aerohive Networks. Inc.
auditorium - Acrylic Wi-Fi HeatMaps - Site survey v2.0 - 2015 34
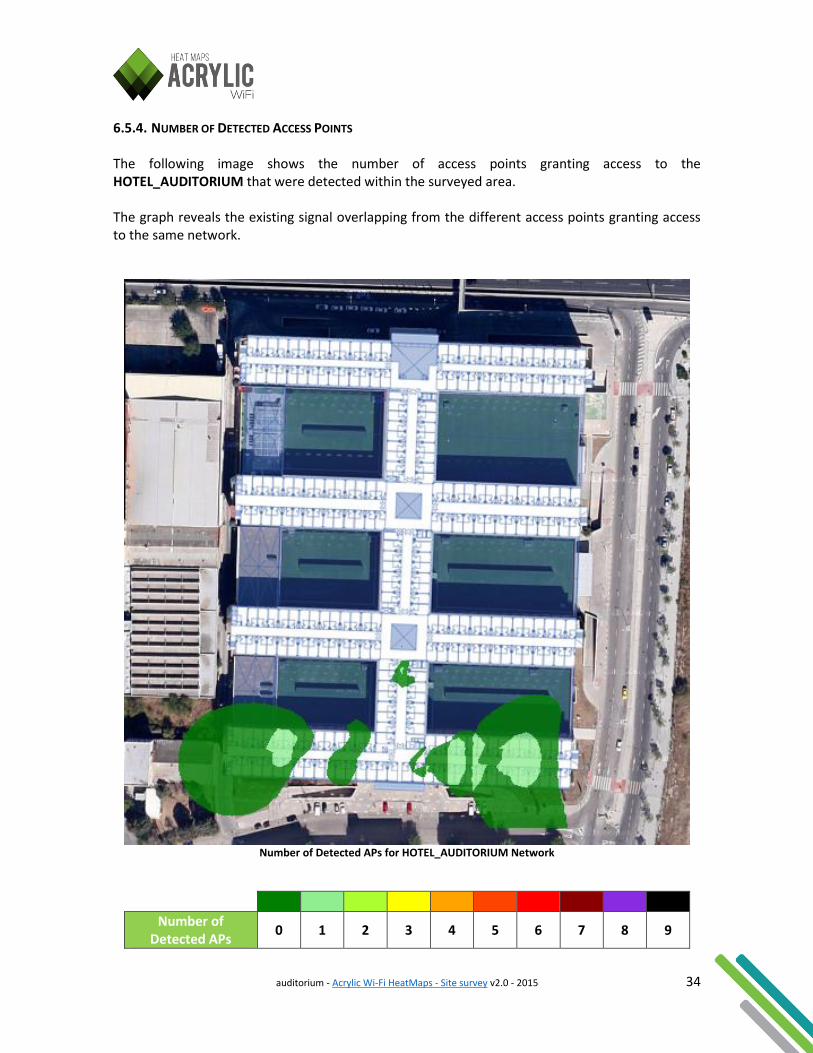
6.5.4. NUMBER OF DETECTED ACCESS POINTS The following image shows the number of access points granting access to the HOTEL_AUDITORIUM that were detected within the surveyed area. The graph reveals the existing signal overlapping from the different access points granting access to the same network.
Number of Detected APs for HOTEL_AUDITORIUM Network
Number of Detected APs
0 1 2 3 4 5 6 7 8 9
auditorium - Acrylic Wi-Fi HeatMaps - Site survey v2.0 - 2015 35
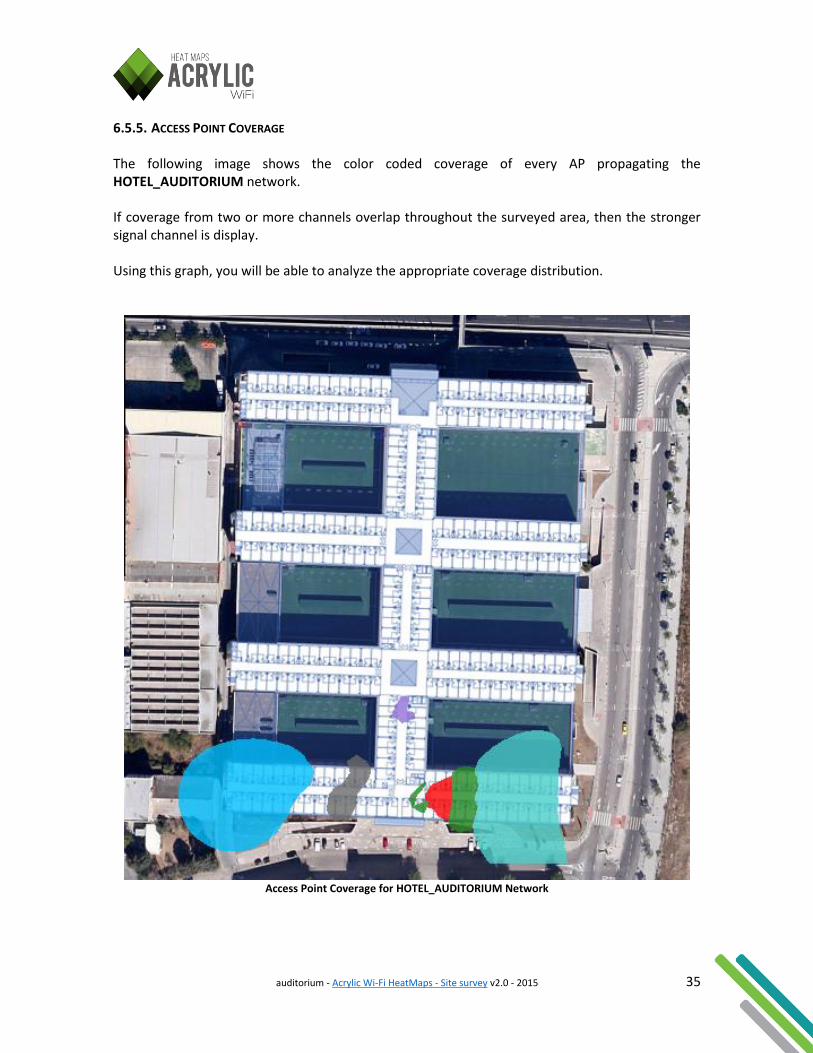
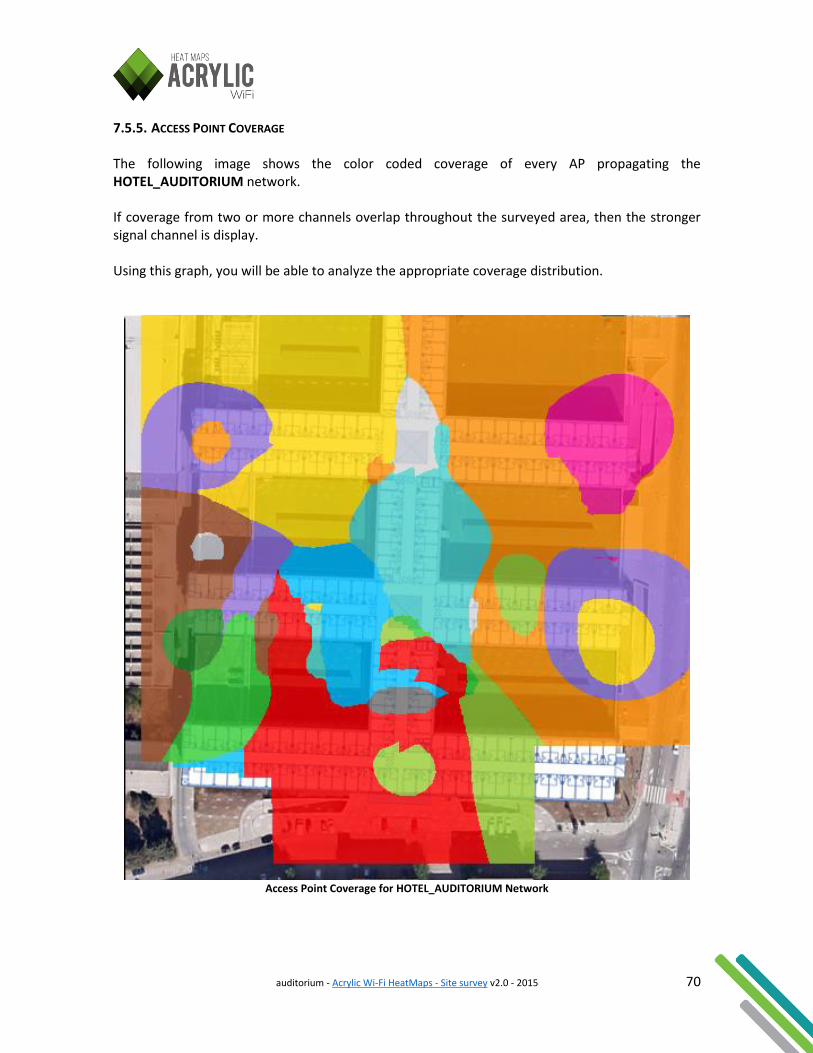
6.5.5. ACCESS POINT COVERAGE The following image shows the color coded coverage of every AP propagating the HOTEL_AUDITORIUM network. If coverage from two or more channels overlap throughout the surveyed area, then the stronger signal channel is display. Using this graph, you will be able to analyze the appropriate coverage distribution.
Access Point Coverage for HOTEL_AUDITORIUM Network
auditorium - Acrylic Wi-Fi HeatMaps - Site survey v2.0 - 2015 36
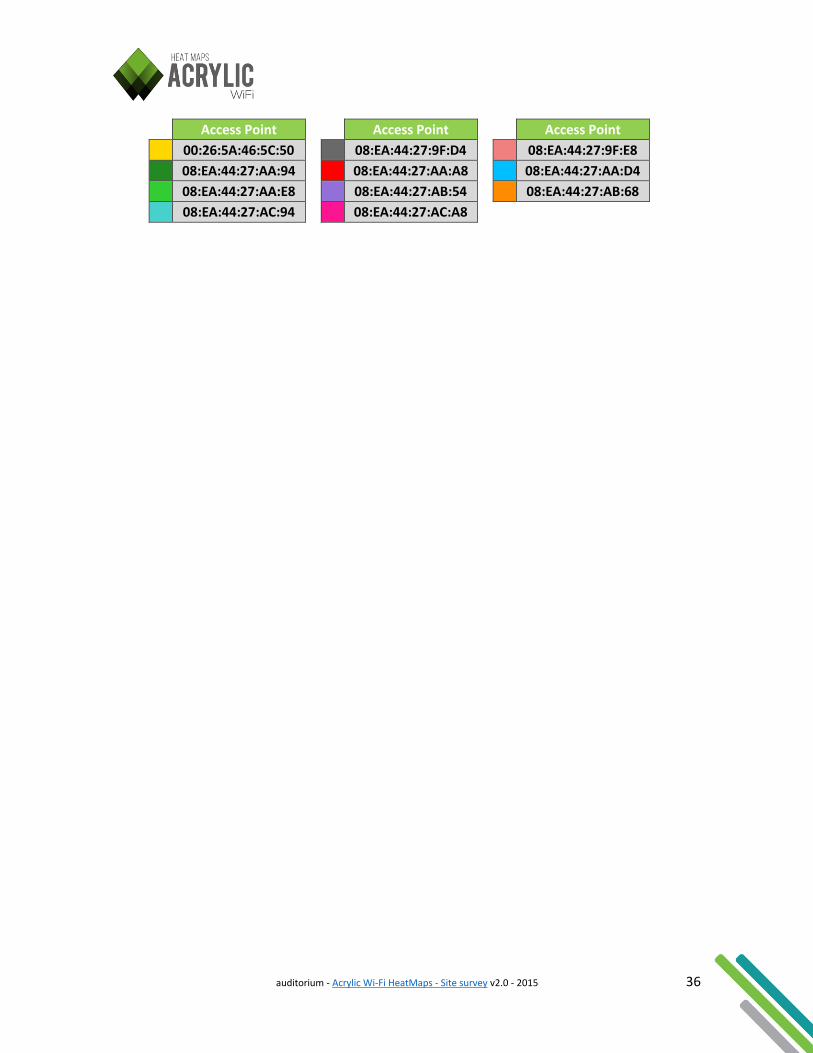
Access Point Access Point Access Point
00:26:5A:46:5C:50 08:EA:44:27:9F:D4 08:EA:44:27:9F:E8
08:EA:44:27:AA:94 08:EA:44:27:AA:A8 08:EA:44:27:AA:D4
08:EA:44:27:AA:E8 08:EA:44:27:AB:54 08:EA:44:27:AB:68
08:EA:44:27:AC:94 08:EA:44:27:AC:A8
auditorium - Acrylic Wi-Fi HeatMaps - Site survey v2.0 - 2015 37
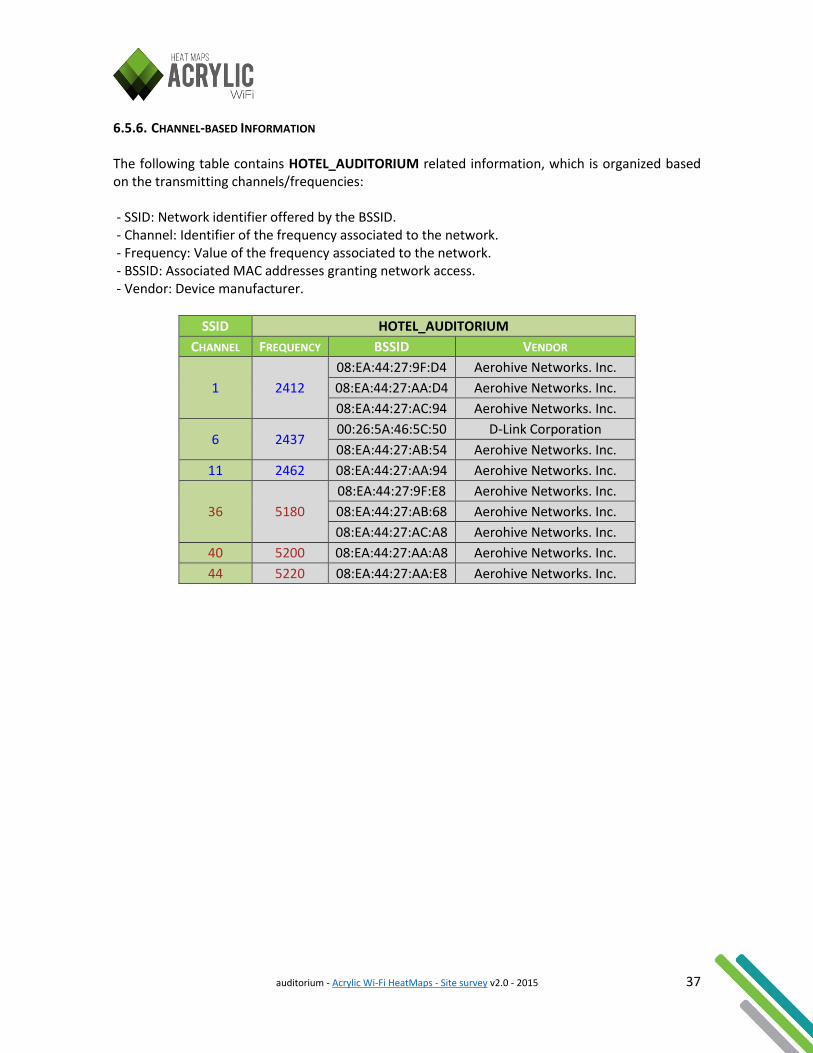
6.5.6. CHANNEL-BASED INFORMATION The following table contains HOTEL_AUDITORIUM related information, which is organized based on the transmitting channels/frequencies: - SSID: Network identifier offered by the BSSID. - Channel: Identifier of the frequency associated to the network. - Frequency: Value of the frequency associated to the network. - BSSID: Associated MAC addresses granting network access. - Vendor: Device manufacturer.
SSID HOTEL_AUDITORIUM
CHANNEL FREQUENCY BSSID VENDOR
1 2412
08:EA:44:27:9F:D4 Aerohive Networks. Inc.
08:EA:44:27:AA:D4 Aerohive Networks. Inc.
08:EA:44:27:AC:94 Aerohive Networks. Inc.
6 2437 00:26:5A:46:5C:50 D-Link Corporation
08:EA:44:27:AB:54 Aerohive Networks. Inc.
11 2462 08:EA:44:27:AA:94 Aerohive Networks. Inc.
36 5180
08:EA:44:27:9F:E8 Aerohive Networks. Inc.
08:EA:44:27:AB:68 Aerohive Networks. Inc.
08:EA:44:27:AC:A8 Aerohive Networks. Inc.
40 5200 08:EA:44:27:AA:A8 Aerohive Networks. Inc.
44 5220 08:EA:44:27:AA:E8 Aerohive Networks. Inc.
auditorium - Acrylic Wi-Fi HeatMaps - Site survey v2.0 - 2015 38
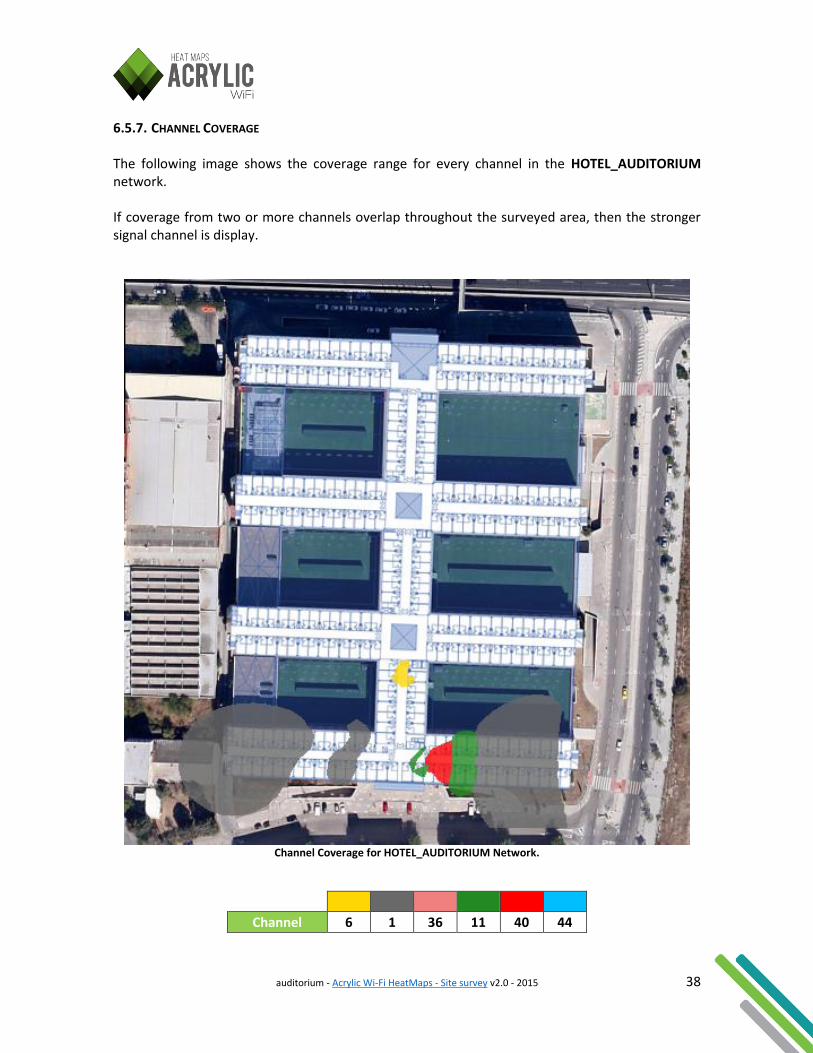
6.5.7. CHANNEL COVERAGE The following image shows the coverage range for every channel in the HOTEL_AUDITORIUM network. If coverage from two or more channels overlap throughout the surveyed area, then the stronger signal channel is display.
Channel Coverage for HOTEL_AUDITORIUM Network.
Channel 6 1 36 11 40 44
auditorium - Acrylic Wi-Fi HeatMaps - Site survey v2.0 - 2015 39
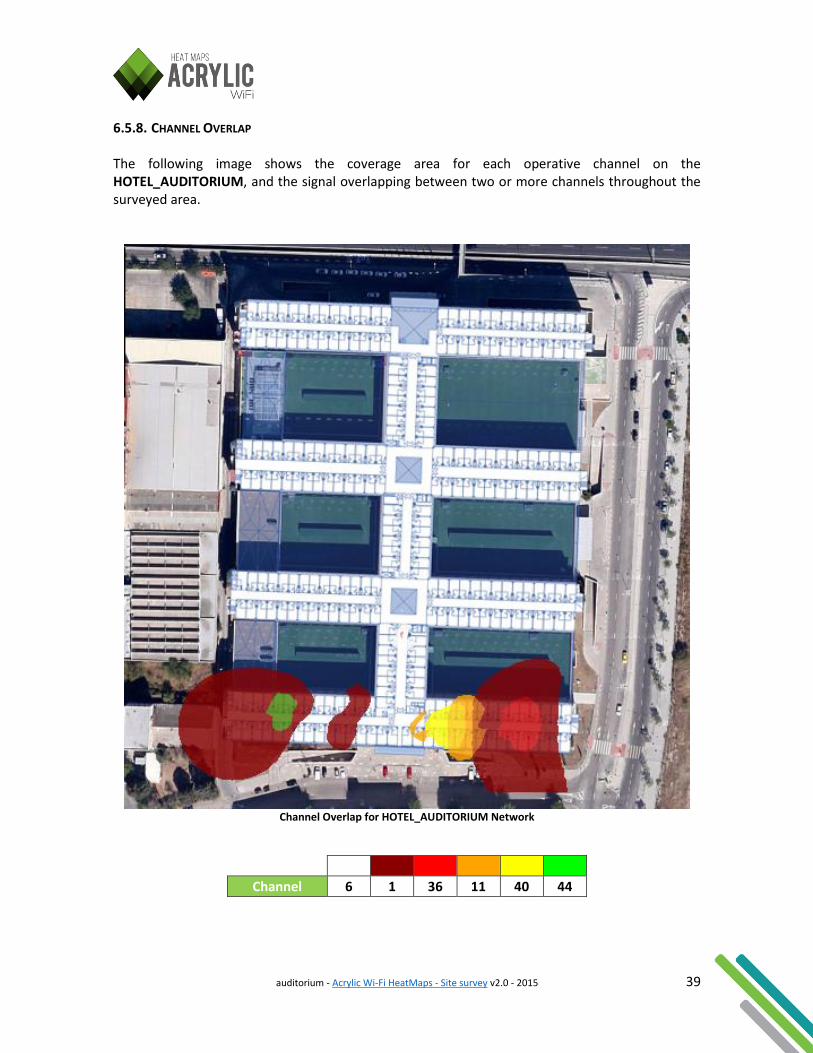
6.5.8. CHANNEL OVERLAP The following image shows the coverage area for each operative channel on the HOTEL_AUDITORIUM, and the signal overlapping between two or more channels throughout the surveyed area.
Channel Overlap for HOTEL_AUDITORIUM Network
Channel 6 1 36 11 40 44
auditorium - Acrylic Wi-Fi HeatMaps - Site survey v2.0 - 2015 40
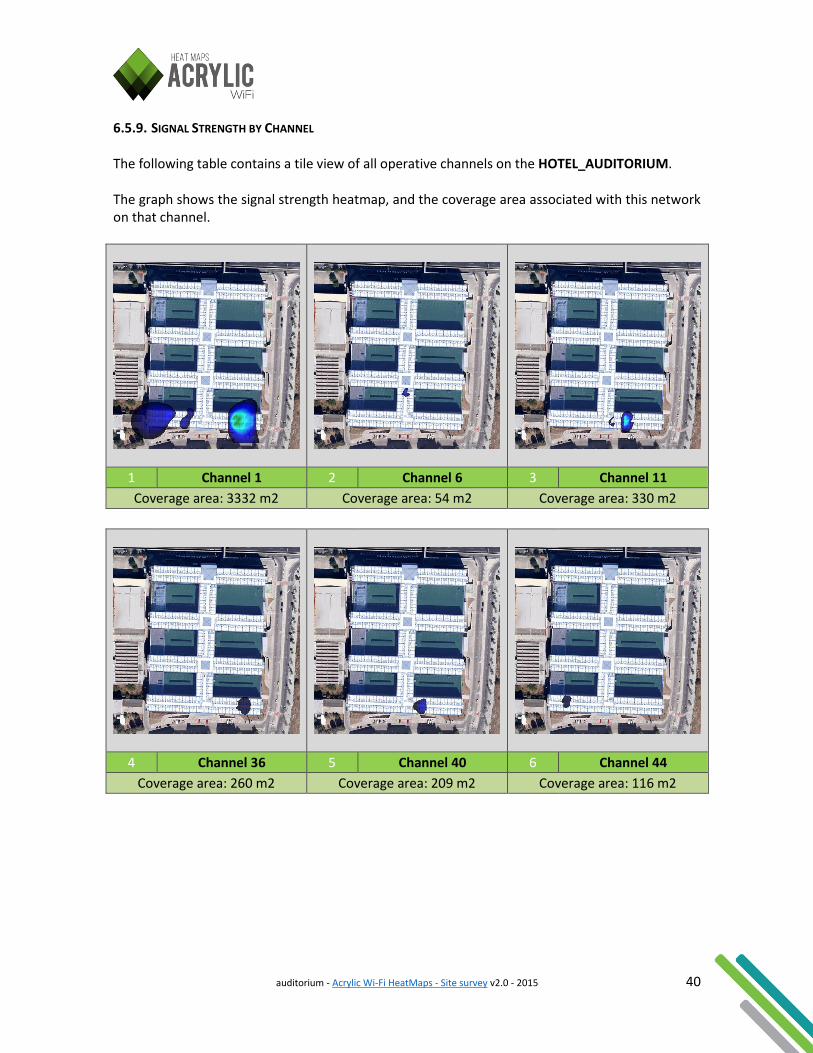
6.5.9. SIGNAL STRENGTH BY CHANNEL The following table contains a tile view of all operative channels on the HOTEL_AUDITORIUM. The graph shows the signal strength heatmap, and the coverage area associated with this network on that channel.
1 Channel 1 2 Channel 6 3 Channel 11
Coverage area: 3332 m2 Coverage area: 54 m2 Coverage area: 330 m2
4 Channel 36 5 Channel 40 6 Channel 44
Coverage area: 260 m2 Coverage area: 209 m2 Coverage area: 116 m2
auditorium - Acrylic Wi-Fi HeatMaps - Site survey v2.0 - 2015 41
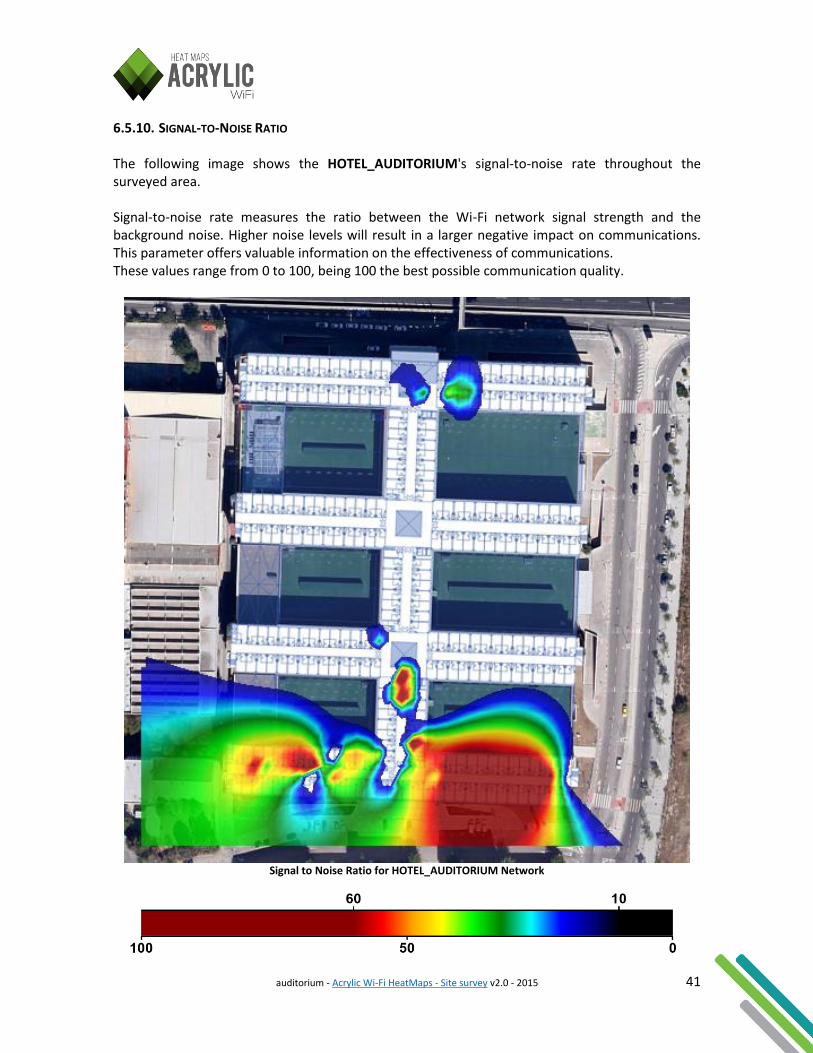
6.5.10. SIGNAL-TO-NOISE RATIO The following image shows the HOTEL_AUDITORIUM's signal-to-noise rate throughout the surveyed area. Signal-to-noise rate measures the ratio between the Wi-Fi network signal strength and the background noise. Higher noise levels will result in a larger negative impact on communications. This parameter offers valuable information on the effectiveness of communications. These values range from 0 to 100, being 100 the best possible communication quality.
Signal to Noise Ratio for HOTEL_AUDITORIUM Network
auditorium - Acrylic Wi-Fi HeatMaps - Site survey v2.0 - 2015 42
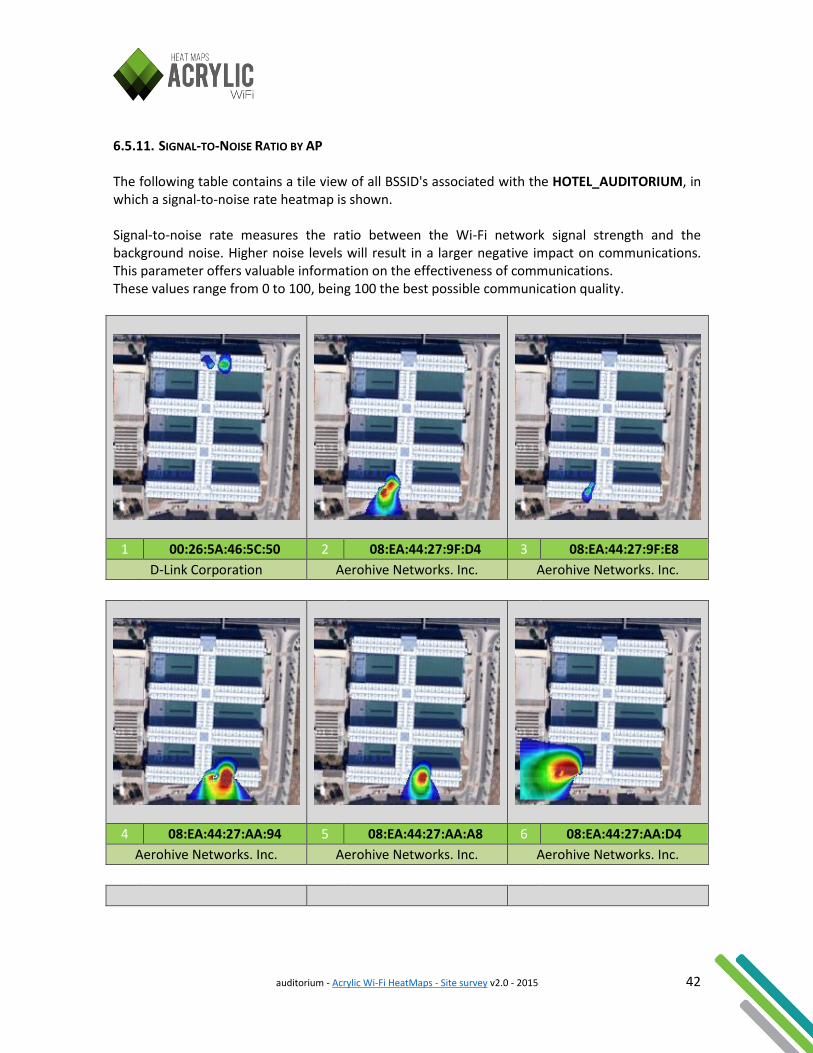
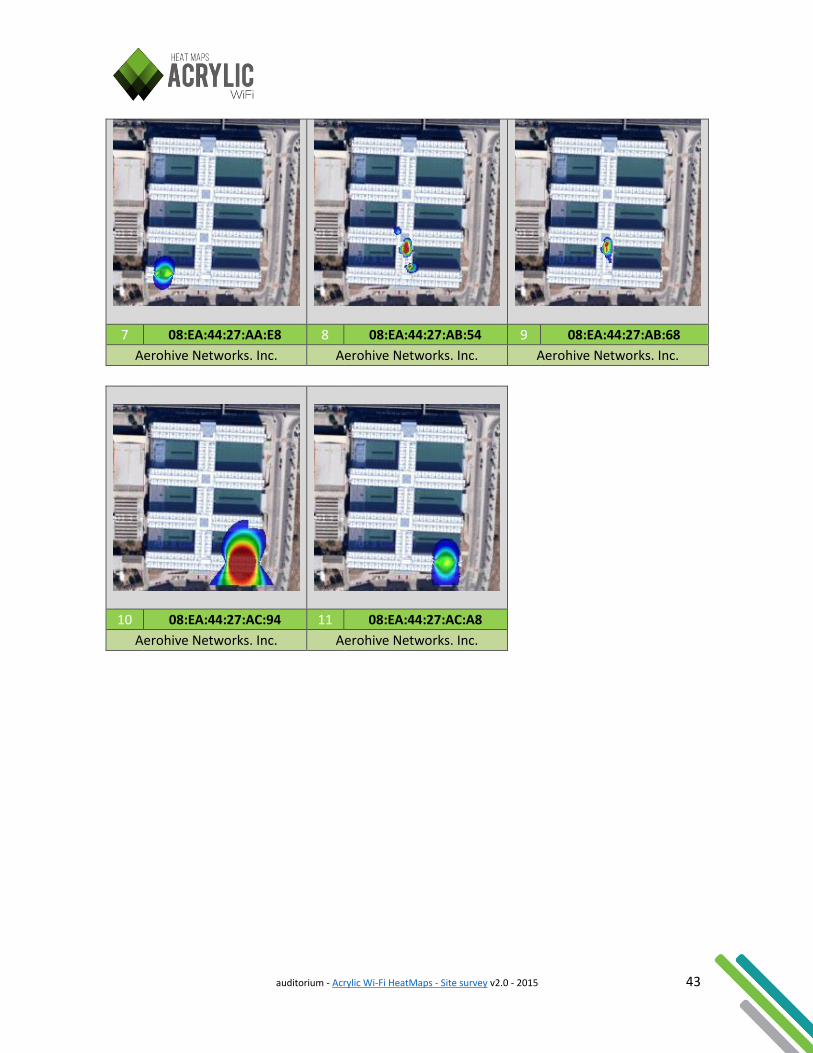
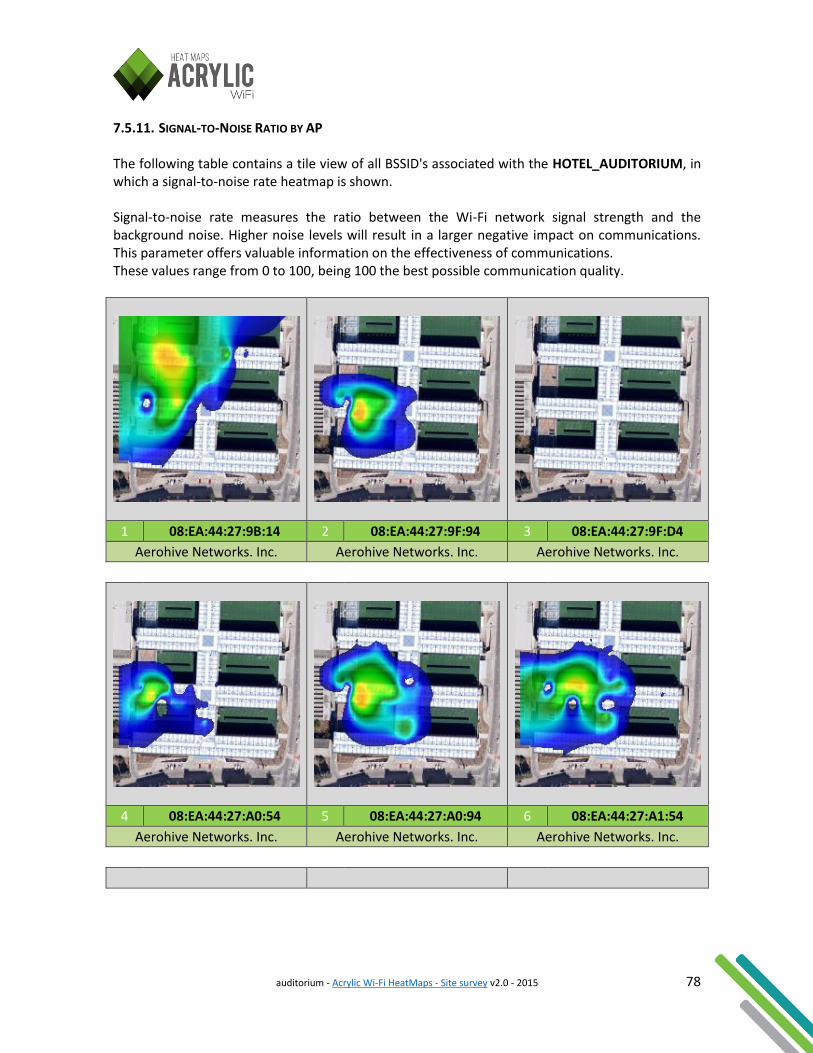
6.5.11. SIGNAL-TO-NOISE RATIO BY AP The following table contains a tile view of all BSSID's associated with the HOTEL_AUDITORIUM, in which a signal-to-noise rate heatmap is shown. Signal-to-noise rate measures the ratio between the Wi-Fi network signal strength and the background noise. Higher noise levels will result in a larger negative impact on communications. This parameter offers valuable information on the effectiveness of communications. These values range from 0 to 100, being 100 the best possible communication quality.
1 00:26:5A:46:5C:50 2 08:EA:44:27:9F:D4 3 08:EA:44:27:9F:E8
D-Link Corporation Aerohive Networks. Inc. Aerohive Networks. Inc.
4 08:EA:44:27:AA:94 5 08:EA:44:27:AA:A8 6 08:EA:44:27:AA:D4
Aerohive Networks. Inc. Aerohive Networks. Inc. Aerohive Networks. Inc.
auditorium - Acrylic Wi-Fi HeatMaps - Site survey v2.0 - 2015 43
7 08:EA:44:27:AA:E8 8 08:EA:44:27:AB:54 9 08:EA:44:27:AB:68
Aerohive Networks. Inc. Aerohive Networks. Inc. Aerohive Networks. Inc.
10 08:EA:44:27:AC:94 11 08:EA:44:27:AC:A8
Aerohive Networks. Inc. Aerohive Networks. Inc.
auditorium - Acrylic Wi-Fi HeatMaps - Site survey v2.0 - 2015 44
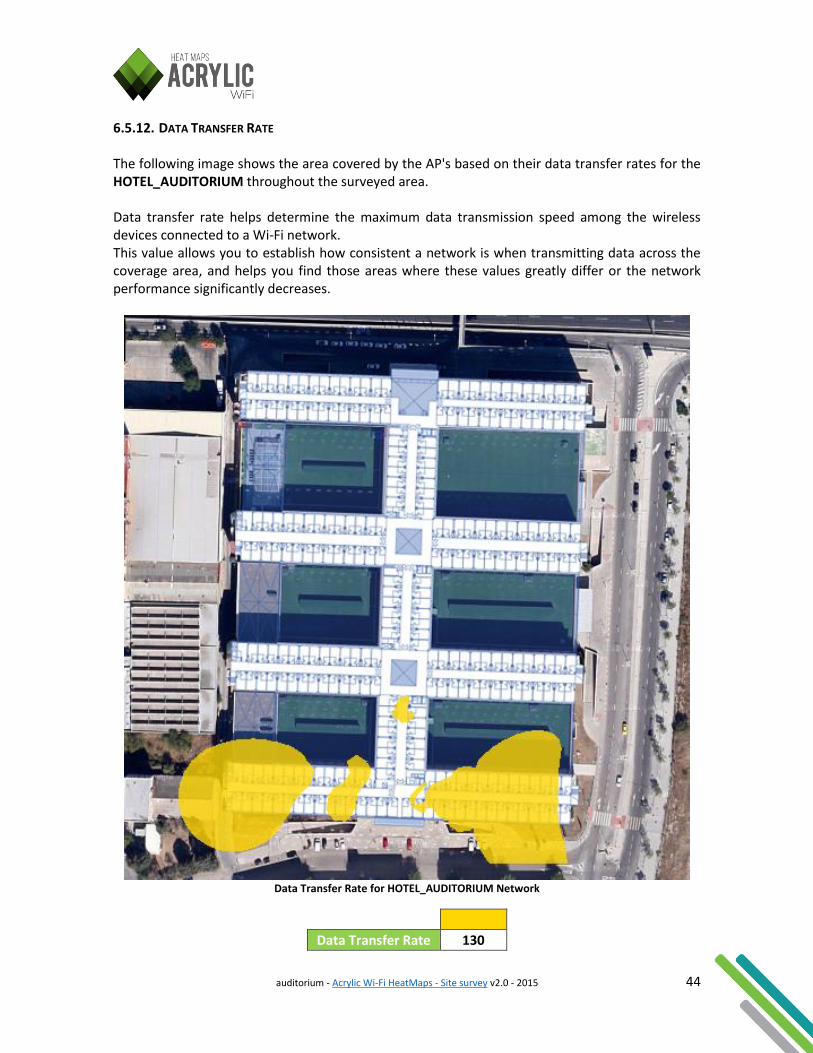
6.5.12. DATA TRANSFER RATE The following image shows the area covered by the AP's based on their data transfer rates for the HOTEL_AUDITORIUM throughout the surveyed area. Data transfer rate helps determine the maximum data transmission speed among the wireless devices connected to a Wi-Fi network. This value allows you to establish how consistent a network is when transmitting data across the coverage area, and helps you find those areas where these values greatly differ or the network performance significantly decreases.
Data Transfer Rate for HOTEL_AUDITORIUM Network
Data Transfer Rate 130
auditorium - Acrylic Wi-Fi HeatMaps - Site survey v2.0 - 2015 45
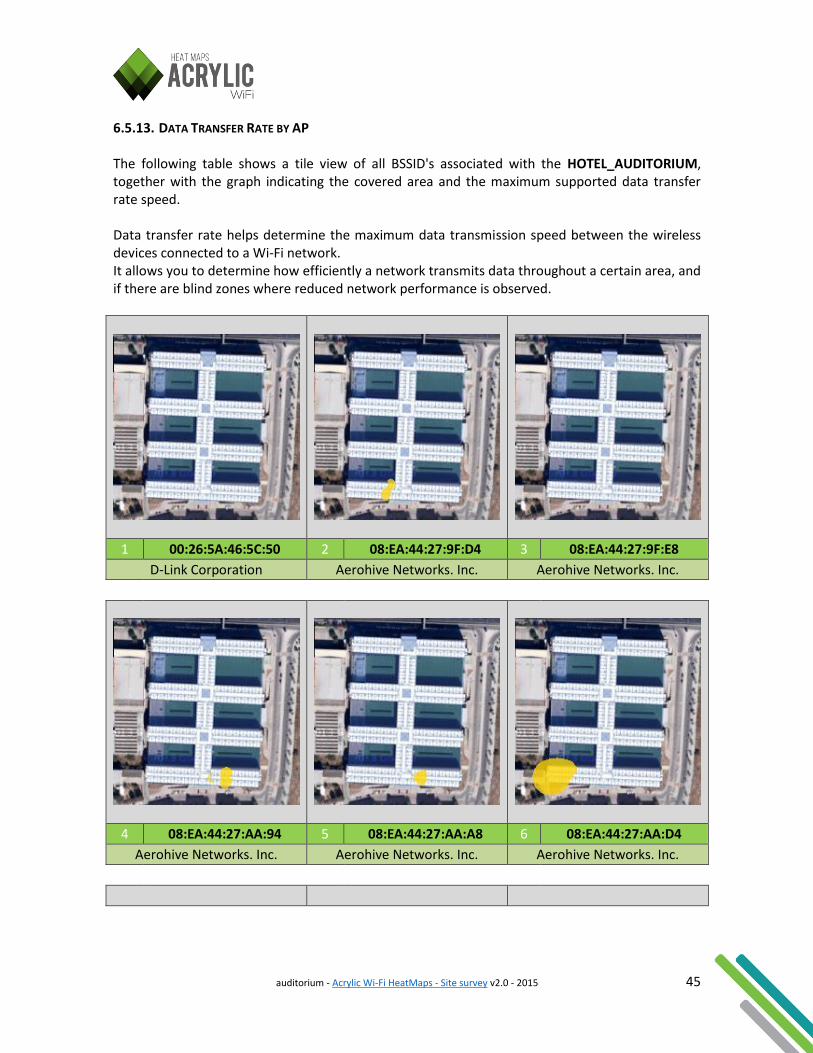
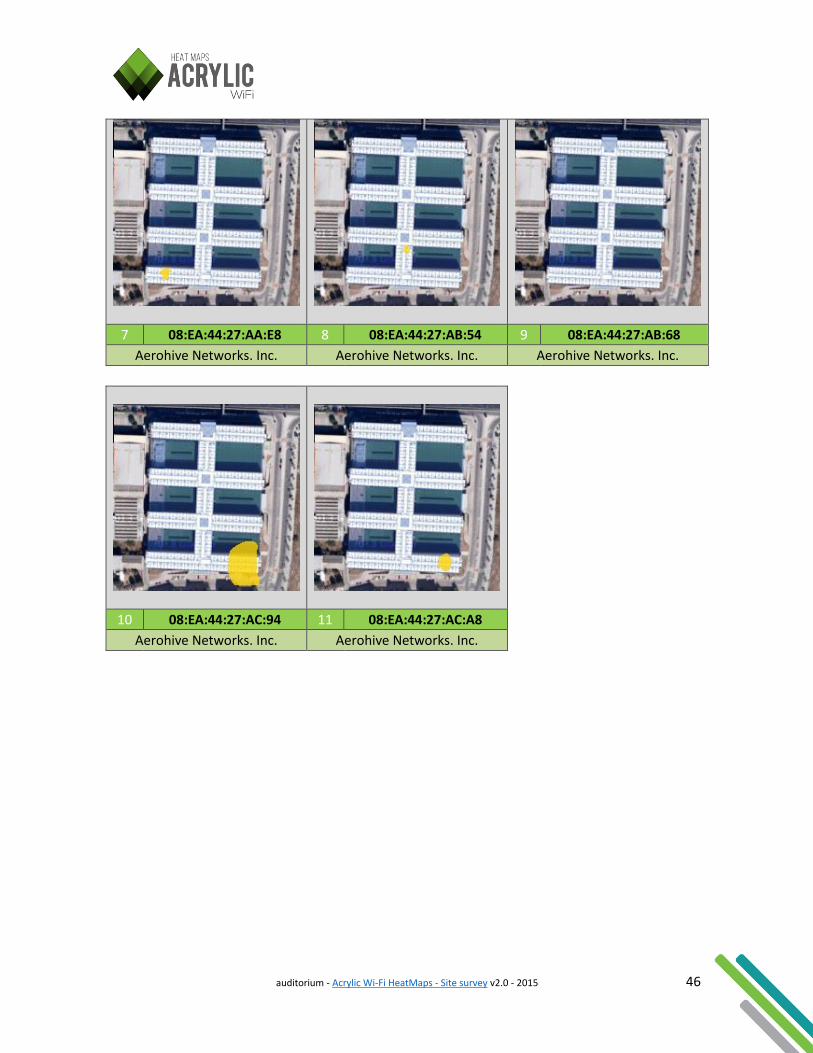
6.5.13. DATA TRANSFER RATE BY AP The following table shows a tile view of all BSSID's associated with the HOTEL_AUDITORIUM, together with the graph indicating the covered area and the maximum supported data transfer rate speed. Data transfer rate helps determine the maximum data transmission speed between the wireless devices connected to a Wi-Fi network. It allows you to determine how efficiently a network transmits data throughout a certain area, and if there are blind zones where reduced network performance is observed.
1 00:26:5A:46:5C:50 2 08:EA:44:27:9F:D4 3 08:EA:44:27:9F:E8
D-Link Corporation Aerohive Networks. Inc. Aerohive Networks. Inc.
4 08:EA:44:27:AA:94 5 08:EA:44:27:AA:A8 6 08:EA:44:27:AA:D4
Aerohive Networks. Inc. Aerohive Networks. Inc. Aerohive Networks. Inc.
auditorium - Acrylic Wi-Fi HeatMaps - Site survey v2.0 - 2015 46
7 08:EA:44:27:AA:E8 8 08:EA:44:27:AB:54 9 08:EA:44:27:AB:68
Aerohive Networks. Inc. Aerohive Networks. Inc. Aerohive Networks. Inc.
10 08:EA:44:27:AC:94 11 08:EA:44:27:AC:A8
Aerohive Networks. Inc. Aerohive Networks. Inc.
auditorium - Acrylic Wi-Fi HeatMaps - Site survey v2.0 - 2015 47
6.5.14. DEVICE DENSITY The following image shows a heatmap revealing the distribution of all client devices connected to the AP's propagating the HOTEL_AUDITORIUM network. Device density allows you to spot which zones have the higher number of client devices connected to the network by showing its saturation. It provides useful information to allow for an even AP distribution according to actual usage. The graph can't be generated due to the absence of the required data.
auditorium - Acrylic Wi-Fi HeatMaps - Site survey v2.0 - 2015 48
6.5.15. PACKET LOSS The following image shows the HOTEL_AUDITORIUM's packet loss zones. When a packet doesn't reach its destination, either because the client device is no longer within the coverage range, or because there is interference, then it is forwarded. Packet forwarding negatively impacts the network performance. The graph can't be generated due to the absence of the required data.
auditorium - Acrylic Wi-Fi HeatMaps - Site survey v2.0 - 2015 49
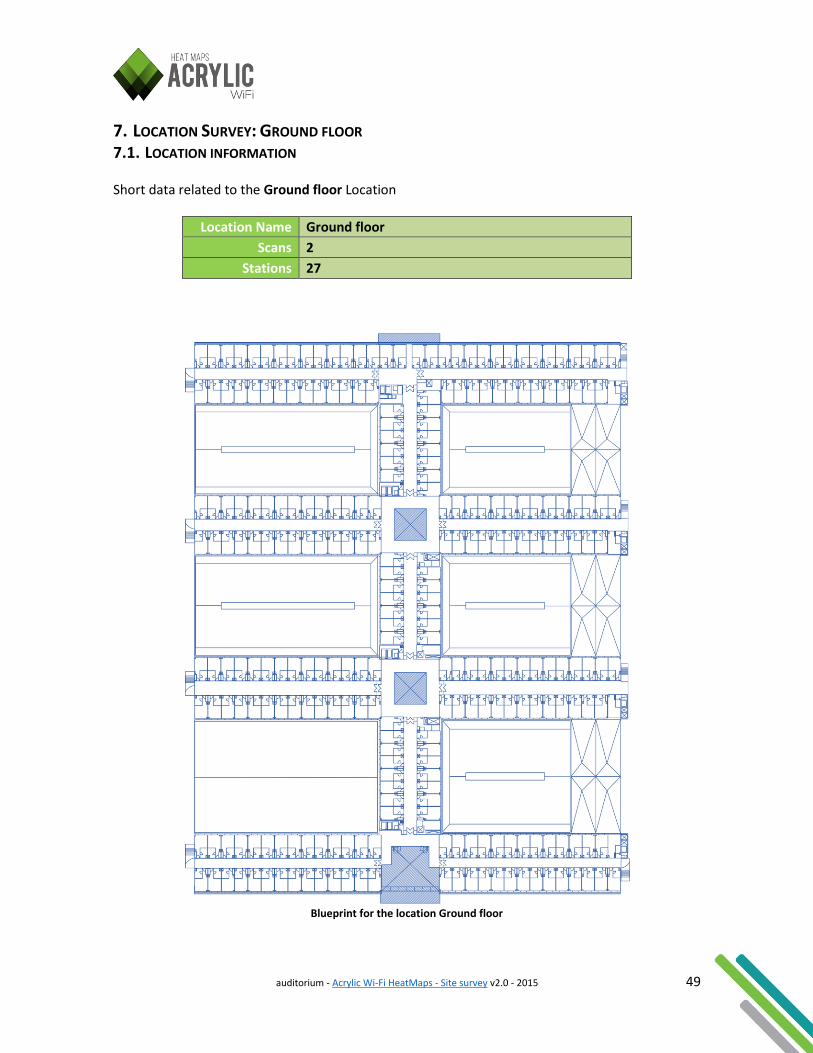
7. LOCATION SURVEY: GROUND FLOOR 7.1. LOCATION INFORMATION Short data related to the Ground floor Location
Location Name Ground floor
Scans 2
Stations 27
Blueprint for the location Ground floor
auditorium - Acrylic Wi-Fi HeatMaps - Site survey v2.0 - 2015 50
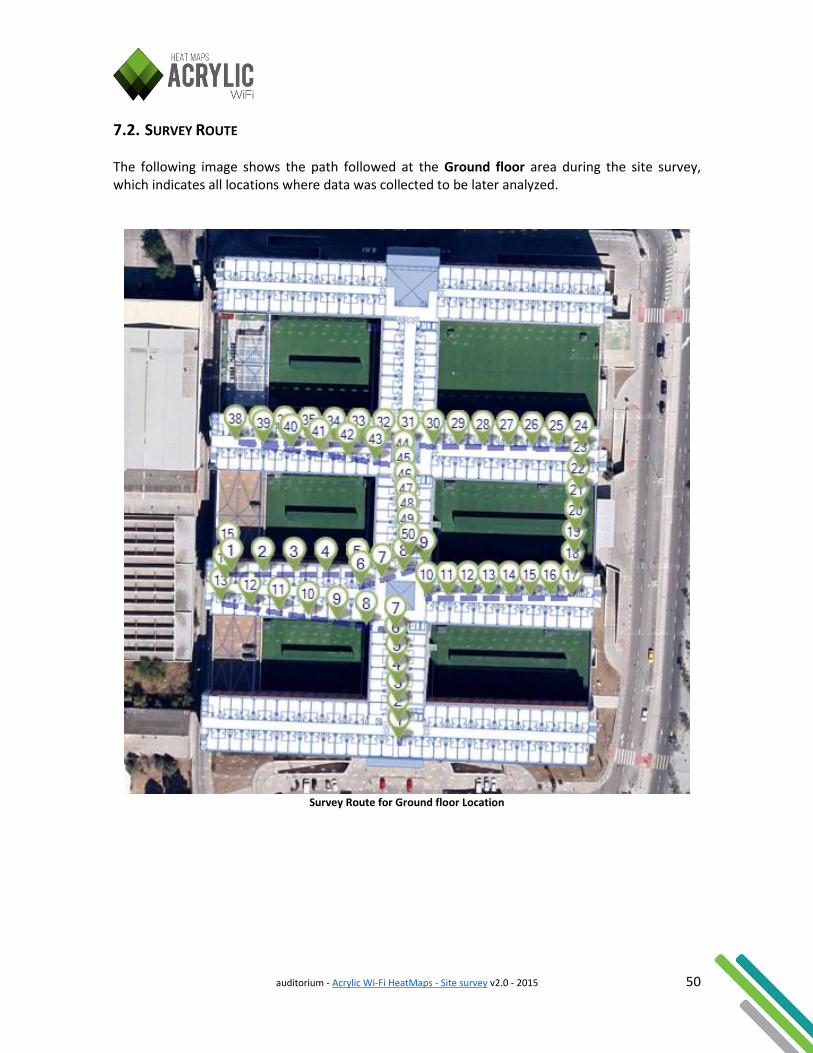
7.2. SURVEY ROUTE The following image shows the path followed at the Ground floor area during the site survey, which indicates all locations where data was collected to be later analyzed.
Survey Route for Ground floor Location
auditorium - Acrylic Wi-Fi HeatMaps - Site survey v2.0 - 2015 51
7.3. PHYSICAL AP'S POSITION The following image shows the approximate positions within the Ground floor area of all access points identified during the site survey. These positions are manually configured, or otherwise are automatically estimated based on the measured data. The graph can't be generated due to the absence of access points with a defined position.
auditorium - Acrylic Wi-Fi HeatMaps - Site survey v2.0 - 2015 52
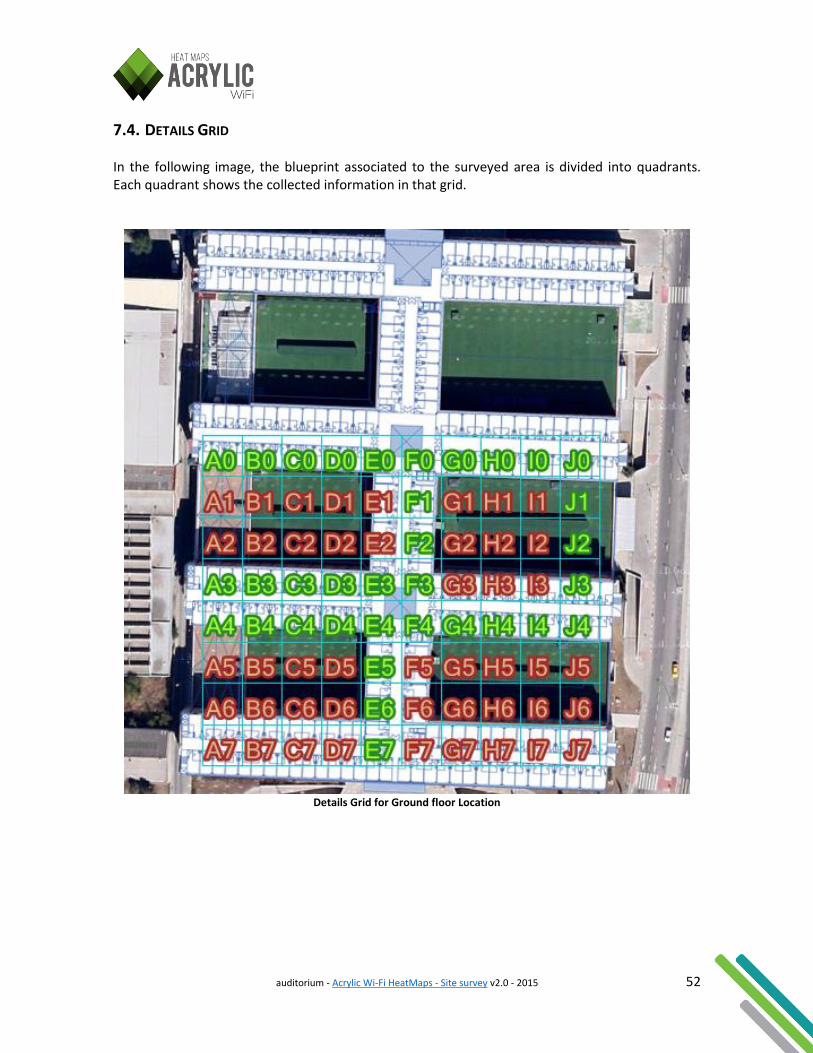
7.4. DETAILS GRID In the following image, the blueprint associated to the surveyed area is divided into quadrants. Each quadrant shows the collected information in that grid.
Details Grid for Ground floor Location

auditorium - Acrylic Wi-Fi HeatMaps - Site survey v2.0 - 2015 53
A0
Number of Survey Points 1
Best Signal (Rssi) -48
Average Signal (Rssi) -57.36
Networks (SSID's) HOTEL_AUDITORIUM
Number of Access Points 9
Data Rates (Max) 130
Number of connected devices 0
Retries (%) 3/14 (21.00%)
B0
Number of Survey Points 4
Best Signal (Rssi) -40
Average Signal (Rssi) -56.96
Networks (SSID's) HOTEL_AUDITORIUM
Number of Access Points 13
Data Rates (Max) 130
Number of connected devices 0
Retries (%) 59/114 (51.00%)
C0
Number of Survey Points 2
Best Signal (Rssi) -39
Average Signal (Rssi) -56.36
Networks (SSID's) HOTEL_AUDITORIUM
Number of Access Points 13
Data Rates (Max) 130
Number of connected devices 0
Retries (%) 36/77 (46.00%)
D0
Number of Survey Points 3
Best Signal (Rssi) -36
Average Signal (Rssi) -61.28
Networks (SSID's) HOTEL_AUDITORIUM
Number of Access Points 15
Data Rates (Max) 130
Number of connected devices 0
Retries (%) 68/144 (47.00%)
E0
Number of Survey Points 2
Best Signal (Rssi) -52
Average Signal (Rssi) -62.36
Networks (SSID's) HOTEL_AUDITORIUM
auditorium - Acrylic Wi-Fi HeatMaps - Site survey v2.0 - 2015 54
Number of Access Points 17
Data Rates (Max) 130
Number of connected devices 0
Retries (%) 69/124 (55.00%)
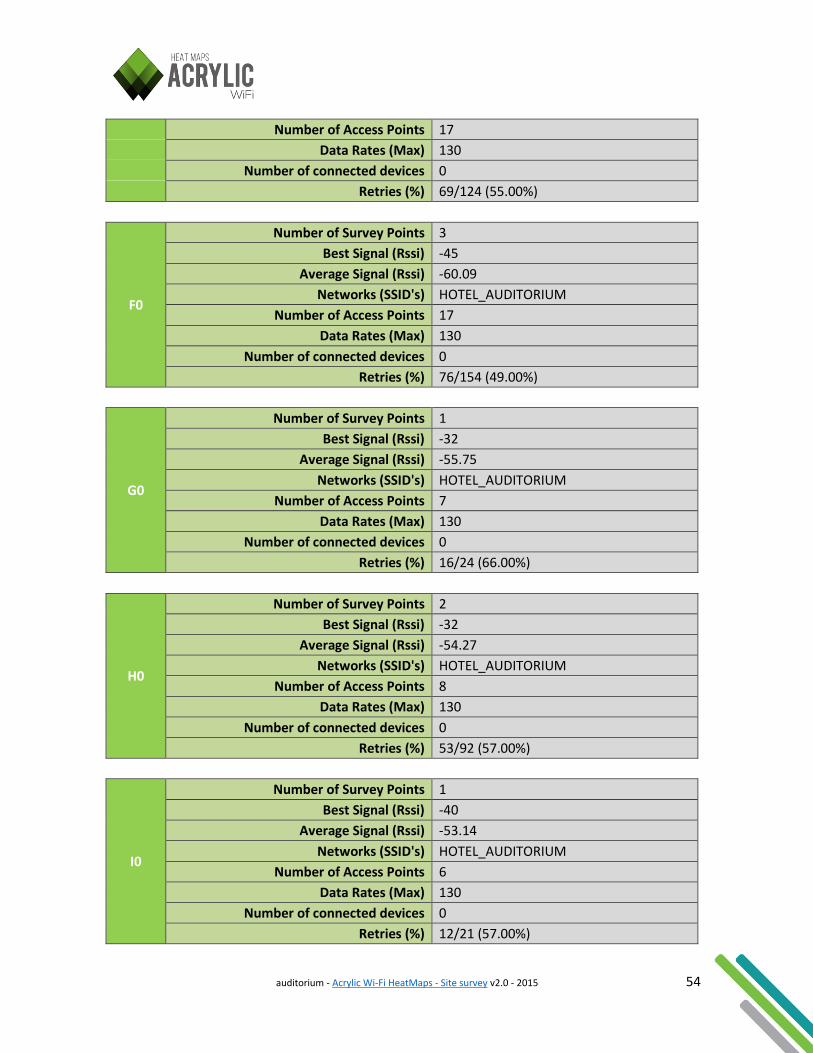
F0
Number of Survey Points 3
Best Signal (Rssi) -45
Average Signal (Rssi) -60.09
Networks (SSID's) HOTEL_AUDITORIUM
Number of Access Points 17
Data Rates (Max) 130
Number of connected devices 0
Retries (%) 76/154 (49.00%)
G0
Number of Survey Points 1
Best Signal (Rssi) -32
Average Signal (Rssi) -55.75
Networks (SSID's) HOTEL_AUDITORIUM
Number of Access Points 7
Data Rates (Max) 130
Number of connected devices 0
Retries (%) 16/24 (66.00%)
H0
Number of Survey Points 2
Best Signal (Rssi) -32
Average Signal (Rssi) -54.27
Networks (SSID's) HOTEL_AUDITORIUM
Number of Access Points 8
Data Rates (Max) 130
Number of connected devices 0
Retries (%) 53/92 (57.00%)
I0
Number of Survey Points 1
Best Signal (Rssi) -40
Average Signal (Rssi) -53.14
Networks (SSID's) HOTEL_AUDITORIUM
Number of Access Points 6
Data Rates (Max) 130
Number of connected devices 0
Retries (%) 12/21 (57.00%)

auditorium - Acrylic Wi-Fi HeatMaps - Site survey v2.0 - 2015 55
F1
Number of Survey Points 3
Best Signal (Rssi) -31
Average Signal (Rssi) -57.49
Networks (SSID's) HOTEL_AUDITORIUM
Number of Access Points 18
Data Rates (Max) 130
Number of connected devices 0
Retries (%) 142/241 (58.00%)
F2
Number of Survey Points 2
Best Signal (Rssi) -40
Average Signal (Rssi) -59.04
Networks (SSID's) HOTEL_AUDITORIUM
Number of Access Points 20
Data Rates (Max) 130
Number of connected devices 0
Retries (%) 164/270 (60.00%)
A3
Number of Survey Points 3
Best Signal (Rssi) -49
Average Signal (Rssi) -60.65
Networks (SSID's) HOTEL_AUDITORIUM
Number of Access Points 18
Data Rates (Max) 130
Number of connected devices 0
Retries (%) 81/146 (55.00%)
B3
Number of Survey Points 1
Best Signal (Rssi) -45
Average Signal (Rssi) -55.31
Networks (SSID's) HOTEL_AUDITORIUM
Number of Access Points 13
Data Rates (Max) 130
Number of connected devices 0
Retries (%) 23/42 (54.00%)
C3
Number of Survey Points 2
Best Signal (Rssi) -46
Average Signal (Rssi) -57.66
auditorium - Acrylic Wi-Fi HeatMaps - Site survey v2.0 - 2015 56
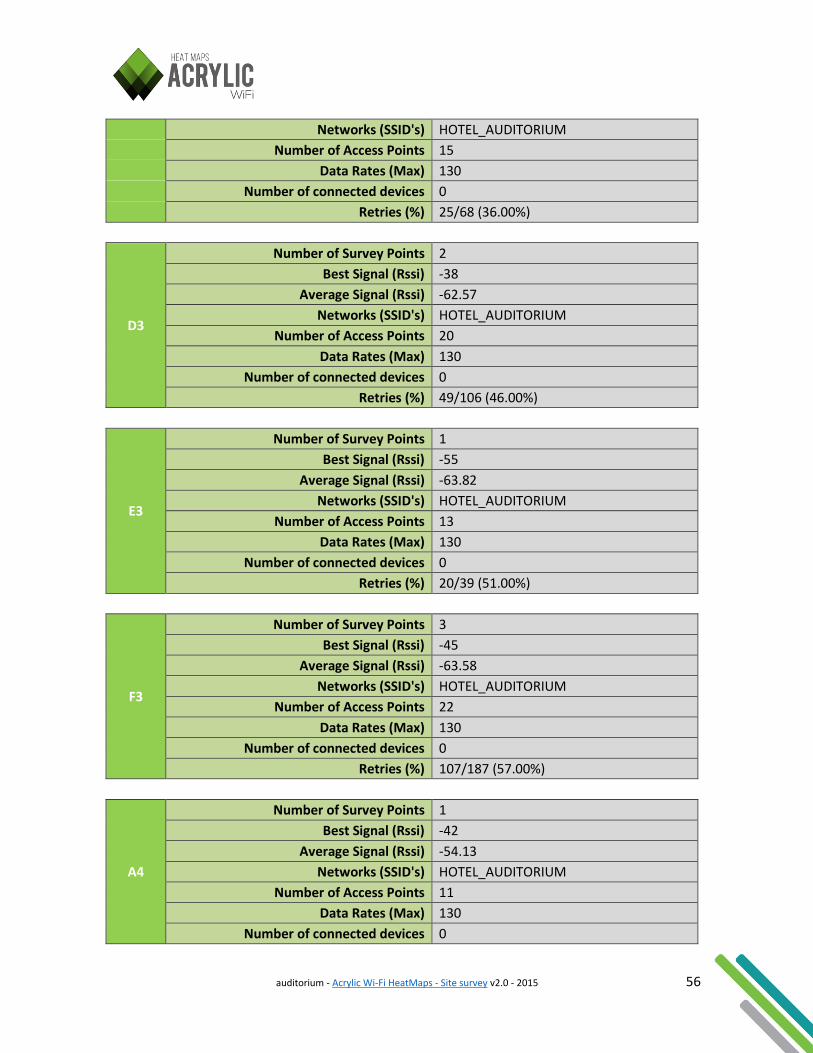
Networks (SSID's) HOTEL_AUDITORIUM
Number of Access Points 15
Data Rates (Max) 130
Number of connected devices 0
Retries (%) 25/68 (36.00%)
D3
Number of Survey Points 2
Best Signal (Rssi) -38
Average Signal (Rssi) -62.57
Networks (SSID's) HOTEL_AUDITORIUM
Number of Access Points 20
Data Rates (Max) 130
Number of connected devices 0
Retries (%) 49/106 (46.00%)
E3
Number of Survey Points 1
Best Signal (Rssi) -55
Average Signal (Rssi) -63.82
Networks (SSID's) HOTEL_AUDITORIUM
Number of Access Points 13
Data Rates (Max) 130
Number of connected devices 0
Retries (%) 20/39 (51.00%)
F3
Number of Survey Points 3
Best Signal (Rssi) -45
Average Signal (Rssi) -63.58
Networks (SSID's) HOTEL_AUDITORIUM
Number of Access Points 22
Data Rates (Max) 130
Number of connected devices 0
Retries (%) 107/187 (57.00%)
A4
Number of Survey Points 1
Best Signal (Rssi) -42
Average Signal (Rssi) -54.13
Networks (SSID's) HOTEL_AUDITORIUM
Number of Access Points 11
Data Rates (Max) 130
Number of connected devices 0

auditorium - Acrylic Wi-Fi HeatMaps - Site survey v2.0 - 2015 57
Retries (%) 0/15 (0.00%)
B4
Number of Survey Points 1
Best Signal (Rssi) -45
Average Signal (Rssi) -52.07
Networks (SSID's) HOTEL_AUDITORIUM
Number of Access Points 9
Data Rates (Max) 130
Number of connected devices 0
Retries (%) 139/187 (74.00%)
C4
Number of Survey Points 1
Best Signal (Rssi) -50
Average Signal (Rssi) -63.80
Networks (SSID's) HOTEL_AUDITORIUM
Number of Access Points 14
Data Rates (Max) 130
Number of connected devices 0
Retries (%) 11/30 (36.00%)
D4
Number of Survey Points 1
Best Signal (Rssi) -38
Average Signal (Rssi) -63.19
Networks (SSID's) HOTEL_AUDITORIUM
Number of Access Points 20
Data Rates (Max) 130
Number of connected devices 0
Retries (%) 45/78 (57.00%)
E4
Number of Survey Points 1
Best Signal (Rssi) -55
Average Signal (Rssi) -65.35
Networks (SSID's) HOTEL_AUDITORIUM
Number of Access Points 17
Data Rates (Max) 130
Number of connected devices 0
Retries (%) 29/63 (46.00%)
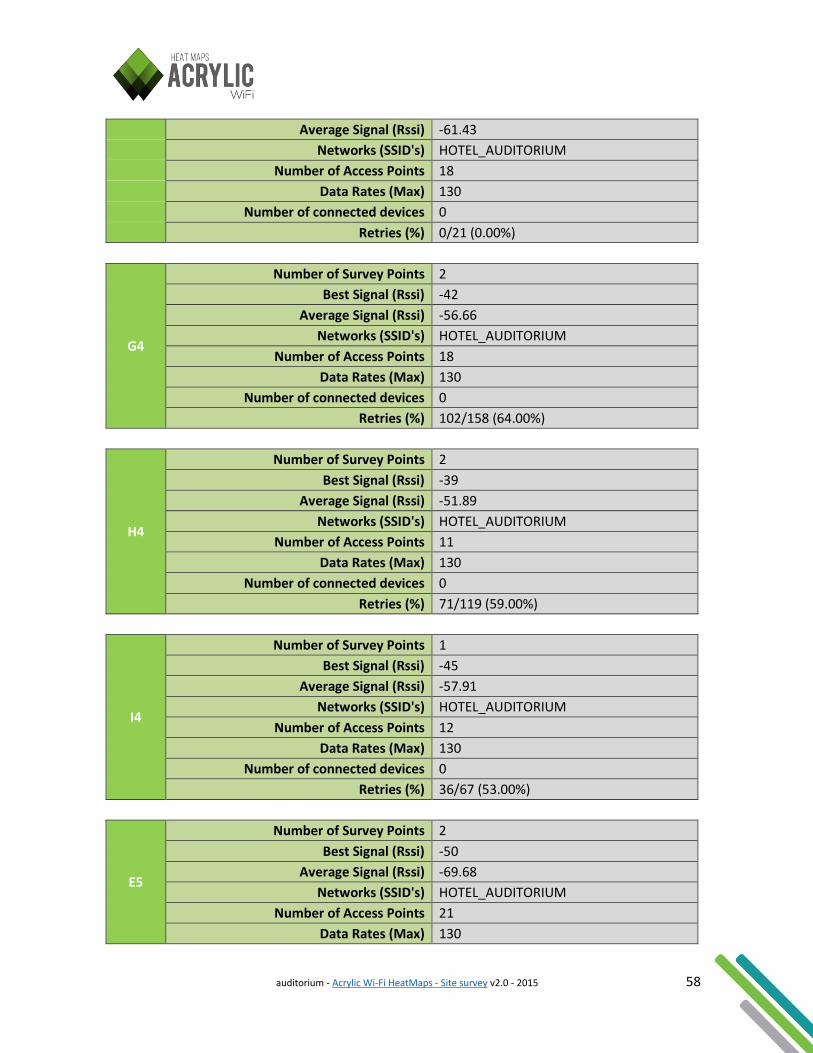
F4 Number of Survey Points 1
Best Signal (Rssi) -44
auditorium - Acrylic Wi-Fi HeatMaps - Site survey v2.0 - 2015 58
Average Signal (Rssi) -61.43
Networks (SSID's) HOTEL_AUDITORIUM
Number of Access Points 18
Data Rates (Max) 130
Number of connected devices 0
Retries (%) 0/21 (0.00%)
G4
Number of Survey Points 2
Best Signal (Rssi) -42
Average Signal (Rssi) -56.66
Networks (SSID's) HOTEL_AUDITORIUM
Number of Access Points 18
Data Rates (Max) 130
Number of connected devices 0
Retries (%) 102/158 (64.00%)
H4
Number of Survey Points 2
Best Signal (Rssi) -39
Average Signal (Rssi) -51.89
Networks (SSID's) HOTEL_AUDITORIUM
Number of Access Points 11
Data Rates (Max) 130
Number of connected devices 0
Retries (%) 71/119 (59.00%)
I4
Number of Survey Points 1
Best Signal (Rssi) -45
Average Signal (Rssi) -57.91
Networks (SSID's) HOTEL_AUDITORIUM
Number of Access Points 12
Data Rates (Max) 130
Number of connected devices 0
Retries (%) 36/67 (53.00%)
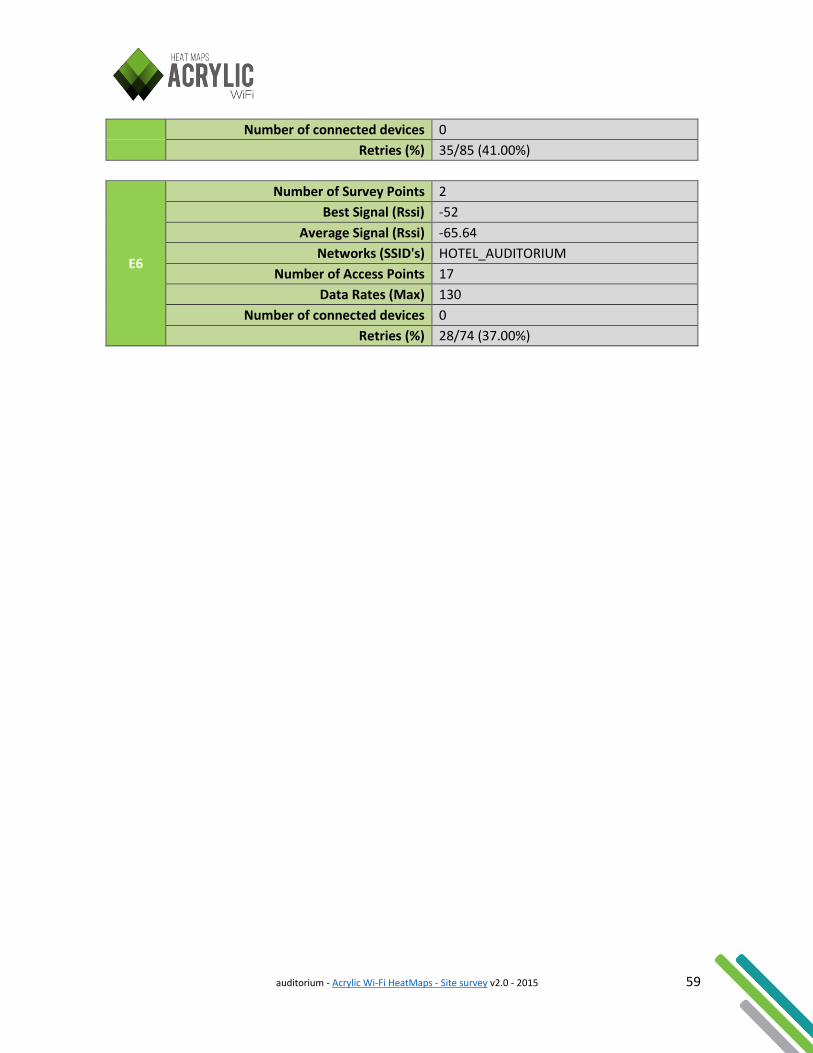
E5
Number of Survey Points 2
Best Signal (Rssi) -50
Average Signal (Rssi) -69.68
Networks (SSID's) HOTEL_AUDITORIUM
Number of Access Points 21
Data Rates (Max) 130
auditorium - Acrylic Wi-Fi HeatMaps - Site survey v2.0 - 2015 59
Number of connected devices 0
Retries (%) 35/85 (41.00%)
E6
Number of Survey Points 2
Best Signal (Rssi) -52
Average Signal (Rssi) -65.64
Networks (SSID's) HOTEL_AUDITORIUM
Number of Access Points 17
Data Rates (Max) 130
Number of connected devices 0
Retries (%) 28/74 (37.00%)
auditorium - Acrylic Wi-Fi HeatMaps - Site survey v2.0 - 2015 60
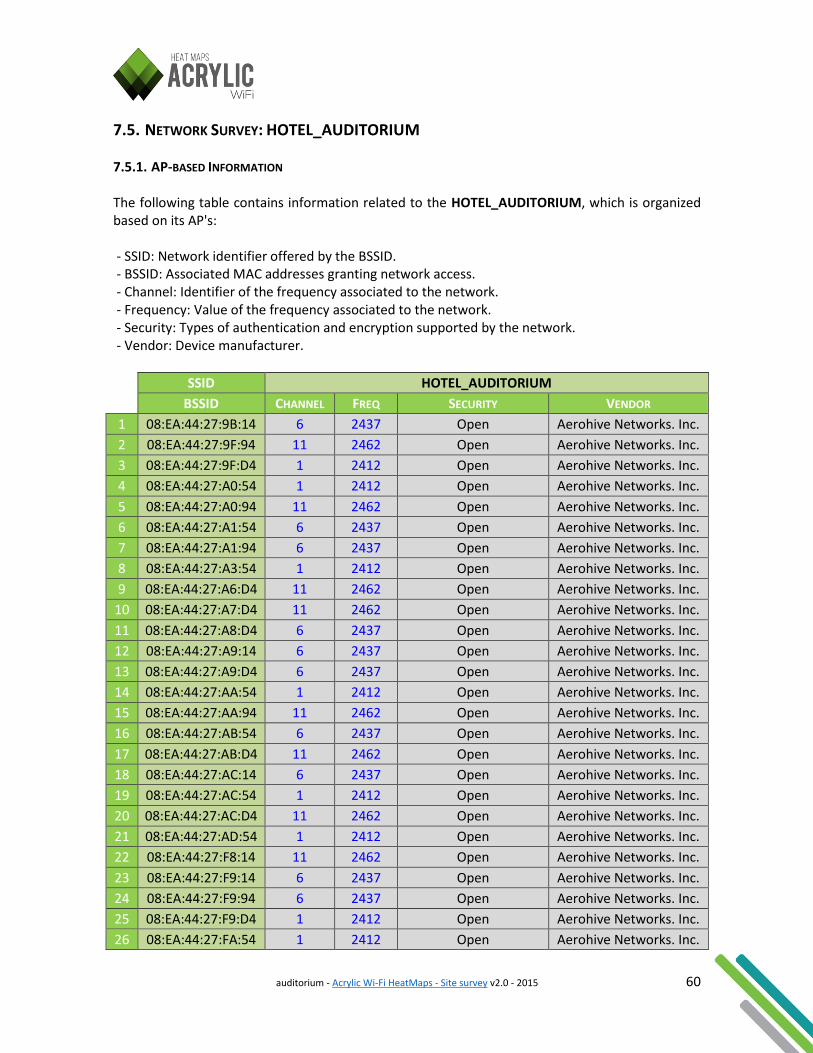
7.5. NETWORK SURVEY: HOTEL_AUDITORIUM 7.5.1. AP-BASED INFORMATION The following table contains information related to the HOTEL_AUDITORIUM, which is organized based on its AP's: - SSID: Network identifier offered by the BSSID. - BSSID: Associated MAC addresses granting network access. - Channel: Identifier of the frequency associated to the network. - Frequency: Value of the frequency associated to the network. - Security: Types of authentication and encryption supported by the network. - Vendor: Device manufacturer.
SSID HOTEL_AUDITORIUM
BSSID CHANNEL FREQ SECURITY VENDOR
1 08:EA:44:27:9B:14 6 2437 Open Aerohive Networks. Inc.
2 08:EA:44:27:9F:94 11 2462 Open Aerohive Networks. Inc.
3 08:EA:44:27:9F:D4 1 2412 Open Aerohive Networks. Inc.
4 08:EA:44:27:A0:54 1 2412 Open Aerohive Networks. Inc.
5 08:EA:44:27:A0:94 11 2462 Open Aerohive Networks. Inc.
6 08:EA:44:27:A1:54 6 2437 Open Aerohive Networks. Inc.
7 08:EA:44:27:A1:94 6 2437 Open Aerohive Networks. Inc.
8 08:EA:44:27:A3:54 1 2412 Open Aerohive Networks. Inc.
9 08:EA:44:27:A6:D4 11 2462 Open Aerohive Networks. Inc.
10 08:EA:44:27:A7:D4 11 2462 Open Aerohive Networks. Inc.
11 08:EA:44:27:A8:D4 6 2437 Open Aerohive Networks. Inc.
12 08:EA:44:27:A9:14 6 2437 Open Aerohive Networks. Inc.
13 08:EA:44:27:A9:D4 6 2437 Open Aerohive Networks. Inc.
14 08:EA:44:27:AA:54 1 2412 Open Aerohive Networks. Inc.
15 08:EA:44:27:AA:94 11 2462 Open Aerohive Networks. Inc.
16 08:EA:44:27:AB:54 6 2437 Open Aerohive Networks. Inc.
17 08:EA:44:27:AB:D4 11 2462 Open Aerohive Networks. Inc.
18 08:EA:44:27:AC:14 6 2437 Open Aerohive Networks. Inc.
19 08:EA:44:27:AC:54 1 2412 Open Aerohive Networks. Inc.
20 08:EA:44:27:AC:D4 11 2462 Open Aerohive Networks. Inc.
21 08:EA:44:27:AD:54 1 2412 Open Aerohive Networks. Inc.
22 08:EA:44:27:F8:14 11 2462 Open Aerohive Networks. Inc.
23 08:EA:44:27:F9:14 6 2437 Open Aerohive Networks. Inc.
24 08:EA:44:27:F9:94 6 2437 Open Aerohive Networks. Inc.
25 08:EA:44:27:F9:D4 1 2412 Open Aerohive Networks. Inc.
26 08:EA:44:27:FA:54 1 2412 Open Aerohive Networks. Inc.
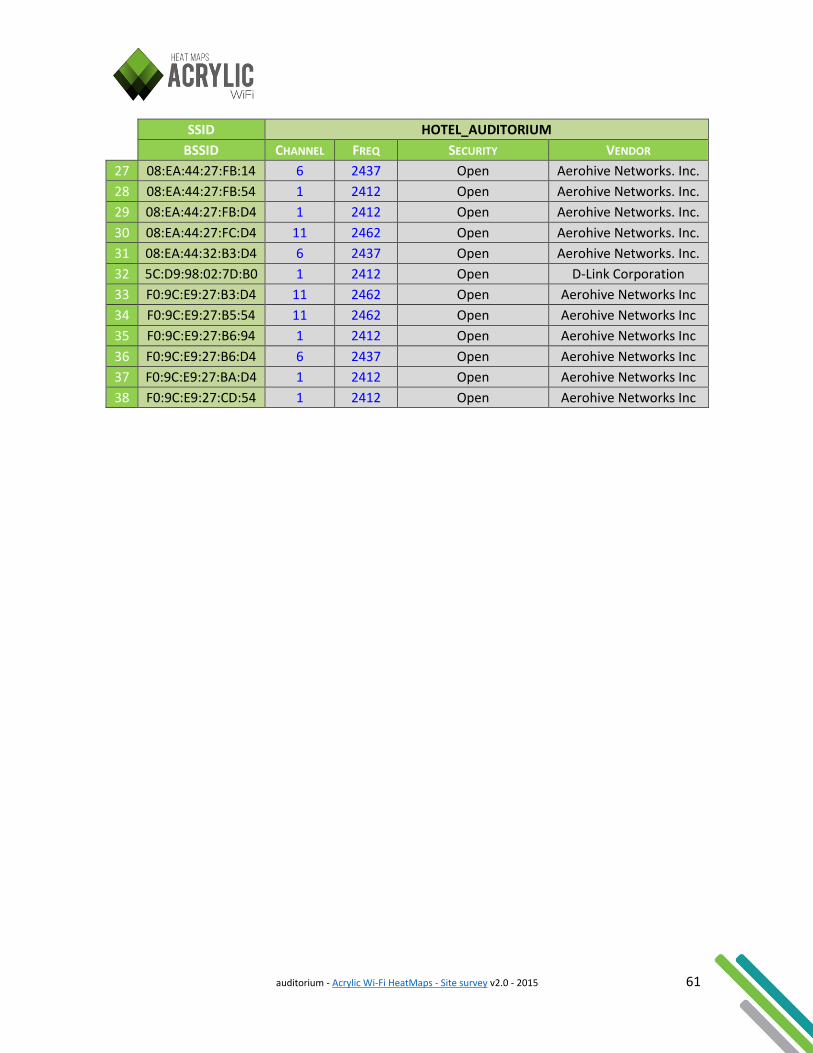
auditorium - Acrylic Wi-Fi HeatMaps - Site survey v2.0 - 2015 61
SSID HOTEL_AUDITORIUM
BSSID CHANNEL FREQ SECURITY VENDOR
27 08:EA:44:27:FB:14 6 2437 Open Aerohive Networks. Inc.
28 08:EA:44:27:FB:54 1 2412 Open Aerohive Networks. Inc.
29 08:EA:44:27:FB:D4 1 2412 Open Aerohive Networks. Inc.
30 08:EA:44:27:FC:D4 11 2462 Open Aerohive Networks. Inc.
31 08:EA:44:32:B3:D4 6 2437 Open Aerohive Networks. Inc.
32 5C:D9:98:02:7D:B0 1 2412 Open D-Link Corporation
33 F0:9C:E9:27:B3:D4 11 2462 Open Aerohive Networks Inc
34 F0:9C:E9:27:B5:54 11 2462 Open Aerohive Networks Inc
35 F0:9C:E9:27:B6:94 1 2412 Open Aerohive Networks Inc
36 F0:9C:E9:27:B6:D4 6 2437 Open Aerohive Networks Inc
37 F0:9C:E9:27:BA:D4 1 2412 Open Aerohive Networks Inc
38 F0:9C:E9:27:CD:54 1 2412 Open Aerohive Networks Inc
auditorium - Acrylic Wi-Fi HeatMaps - Site survey v2.0 - 2015 62
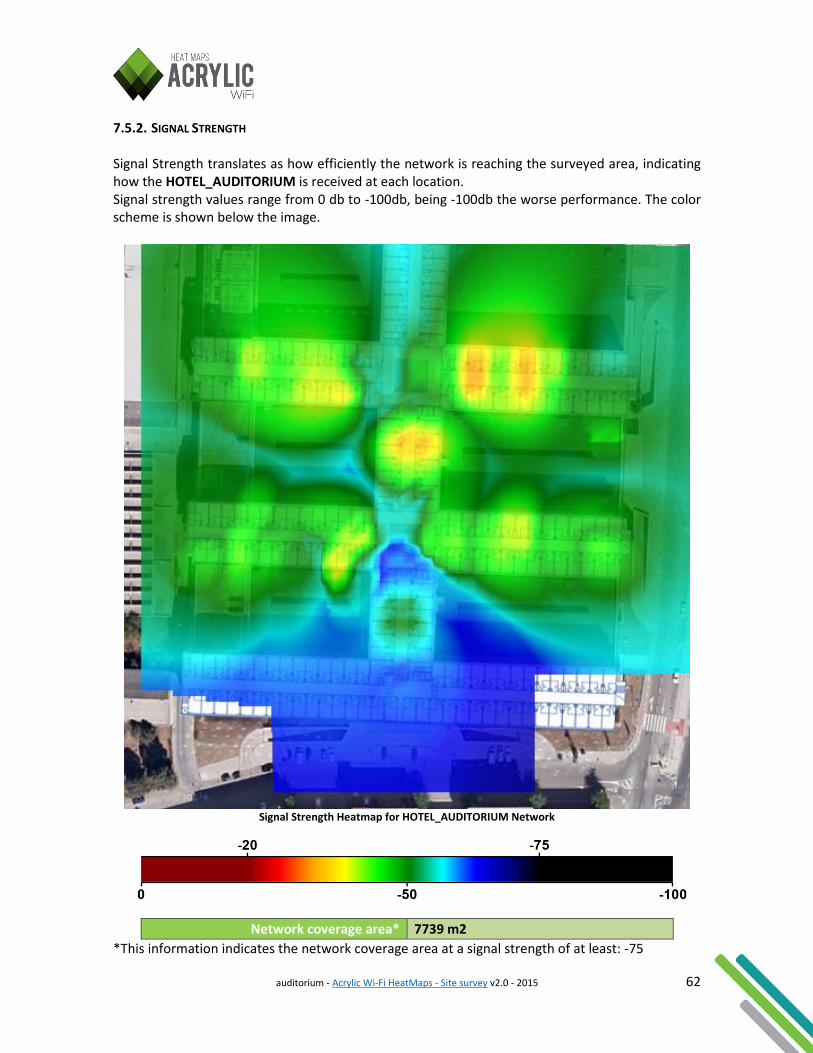
7.5.2. SIGNAL STRENGTH Signal Strength translates as how efficiently the network is reaching the surveyed area, indicating how the HOTEL_AUDITORIUM is received at each location. Signal strength values range from 0 db to -100db, being -100db the worse performance. The color scheme is shown below the image.
Signal Strength Heatmap for HOTEL_AUDITORIUM Network
Network coverage area* 7739 m2
*This information indicates the network coverage area at a signal strength of at least: -75
auditorium - Acrylic Wi-Fi HeatMaps - Site survey v2.0 - 2015 63
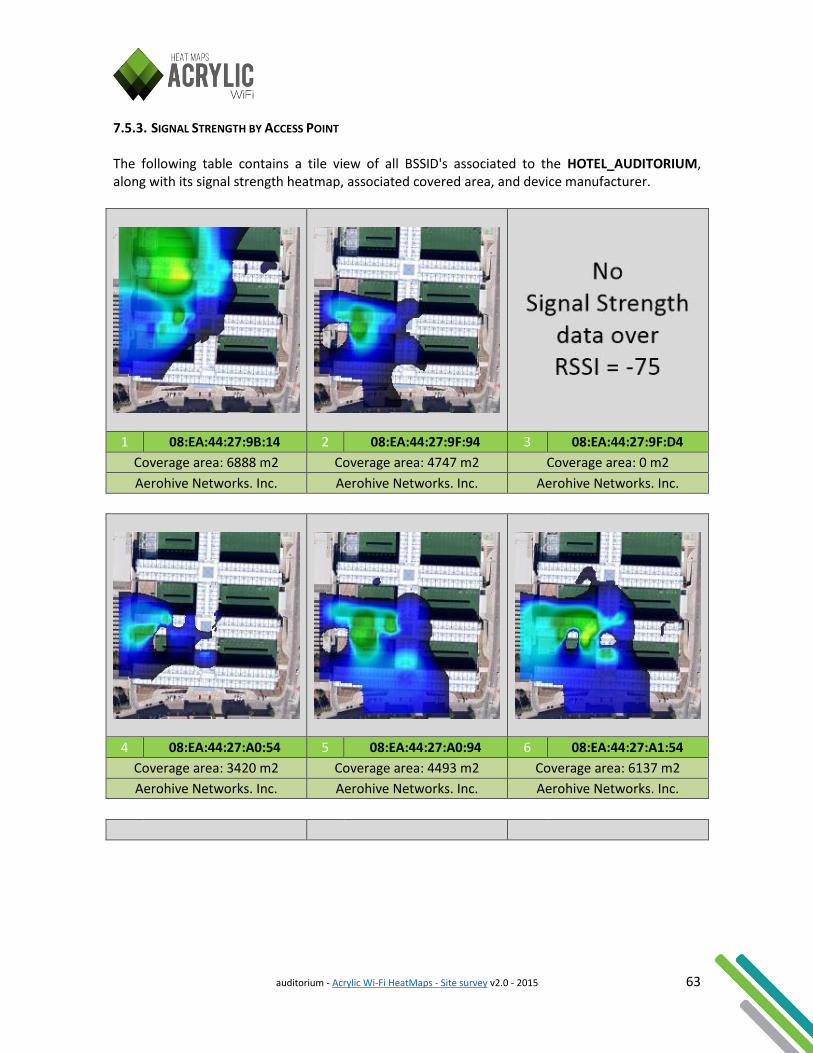
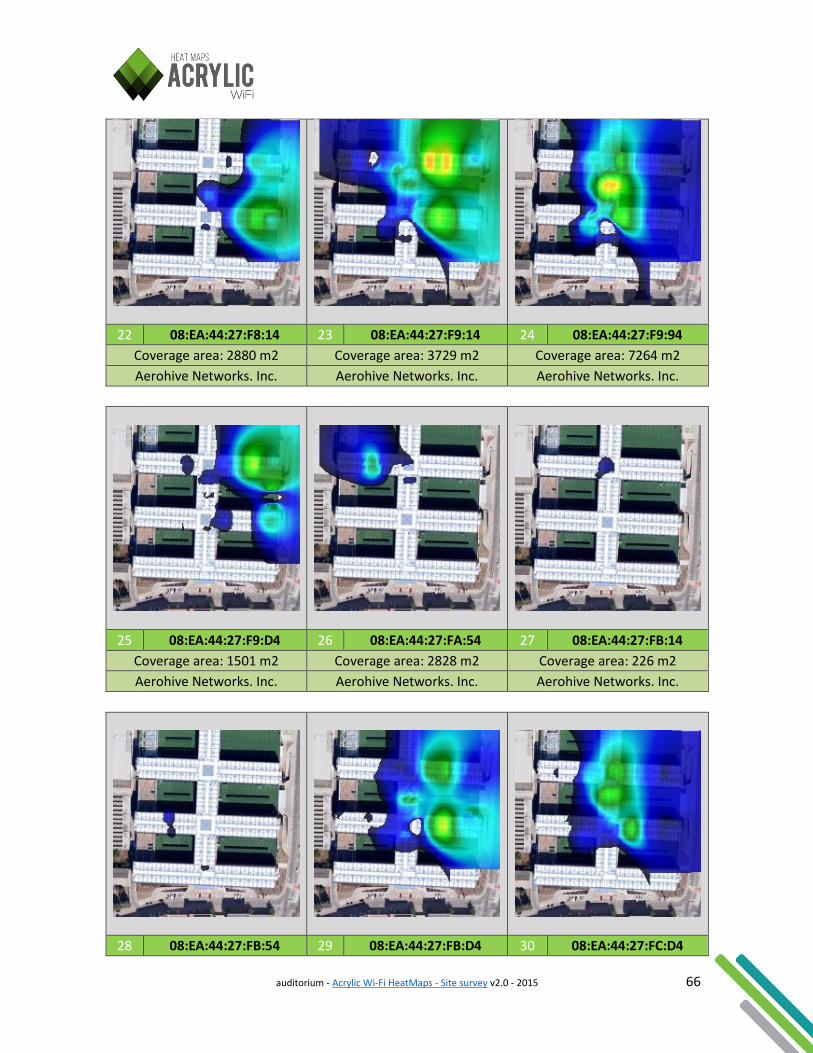
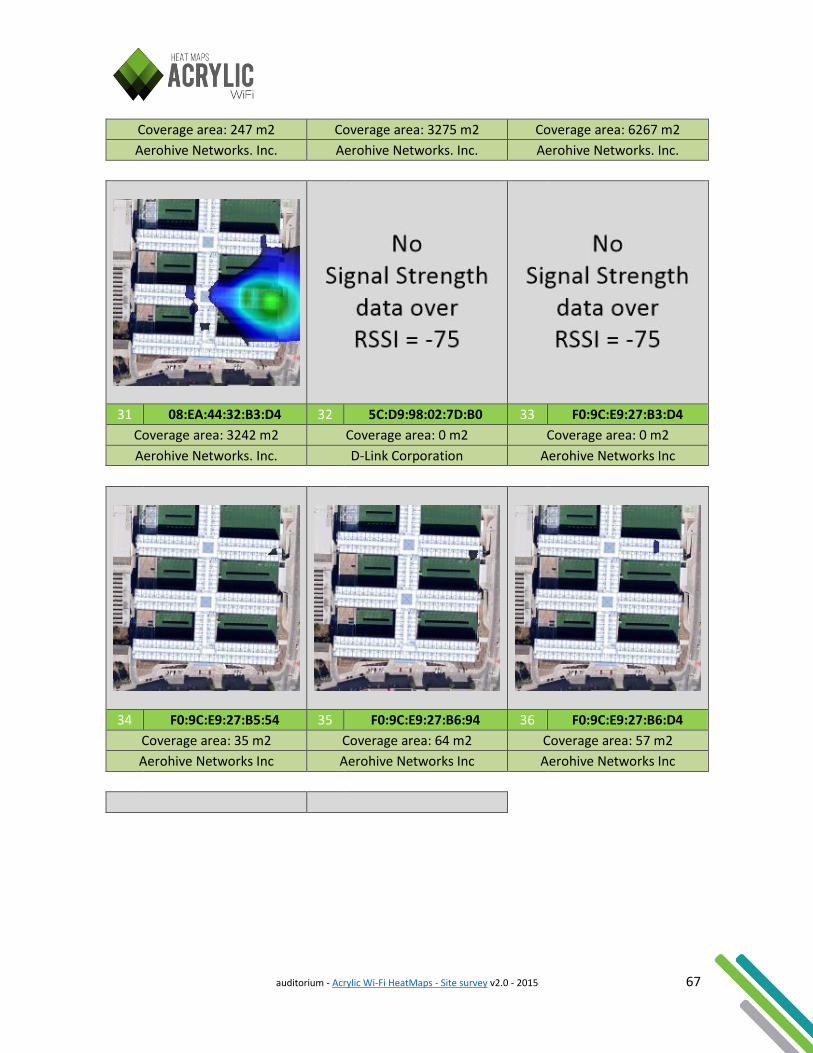
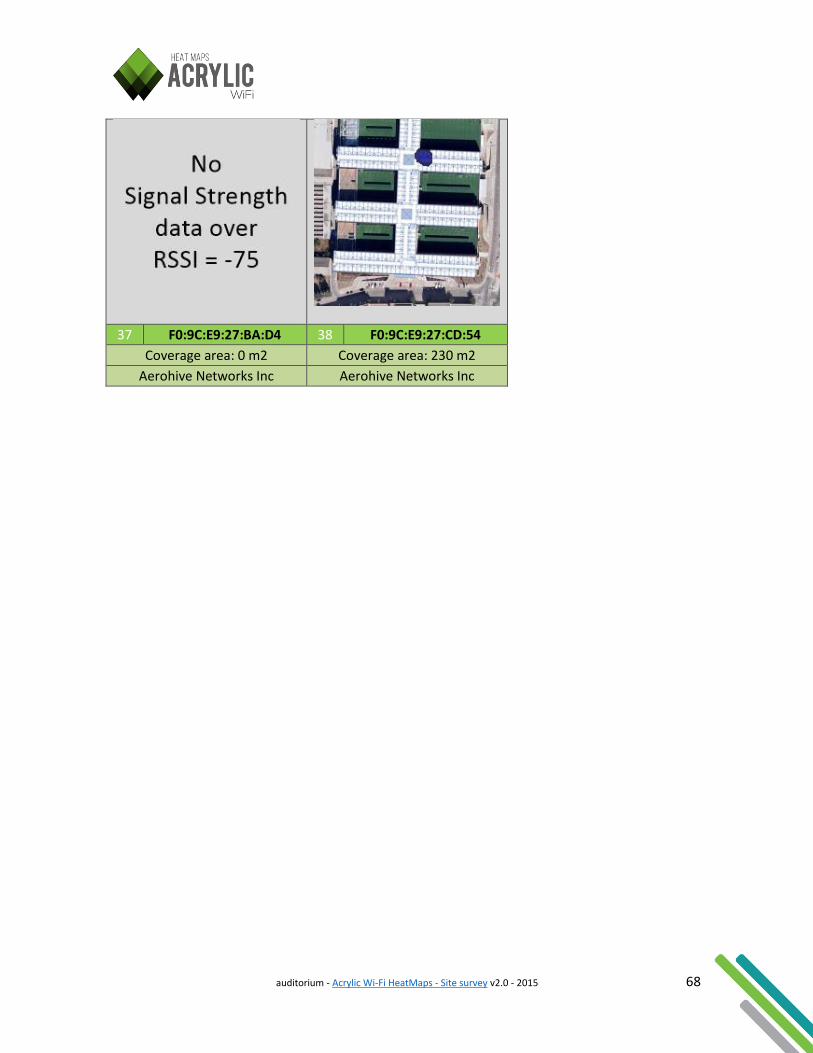
7.5.3. SIGNAL STRENGTH BY ACCESS POINT The following table contains a tile view of all BSSID's associated to the HOTEL_AUDITORIUM, along with its signal strength heatmap, associated covered area, and device manufacturer.
1 08:EA:44:27:9B:14 2 08:EA:44:27:9F:94 3 08:EA:44:27:9F:D4
Coverage area: 6888 m2 Coverage area: 4747 m2 Coverage area: 0 m2
Aerohive Networks. Inc. Aerohive Networks. Inc. Aerohive Networks. Inc.
4 08:EA:44:27:A0:54 5 08:EA:44:27:A0:94 6 08:EA:44:27:A1:54
Coverage area: 3420 m2 Coverage area: 4493 m2 Coverage area: 6137 m2
Aerohive Networks. Inc. Aerohive Networks. Inc. Aerohive Networks. Inc.
auditorium - Acrylic Wi-Fi HeatMaps - Site survey v2.0 - 2015 64
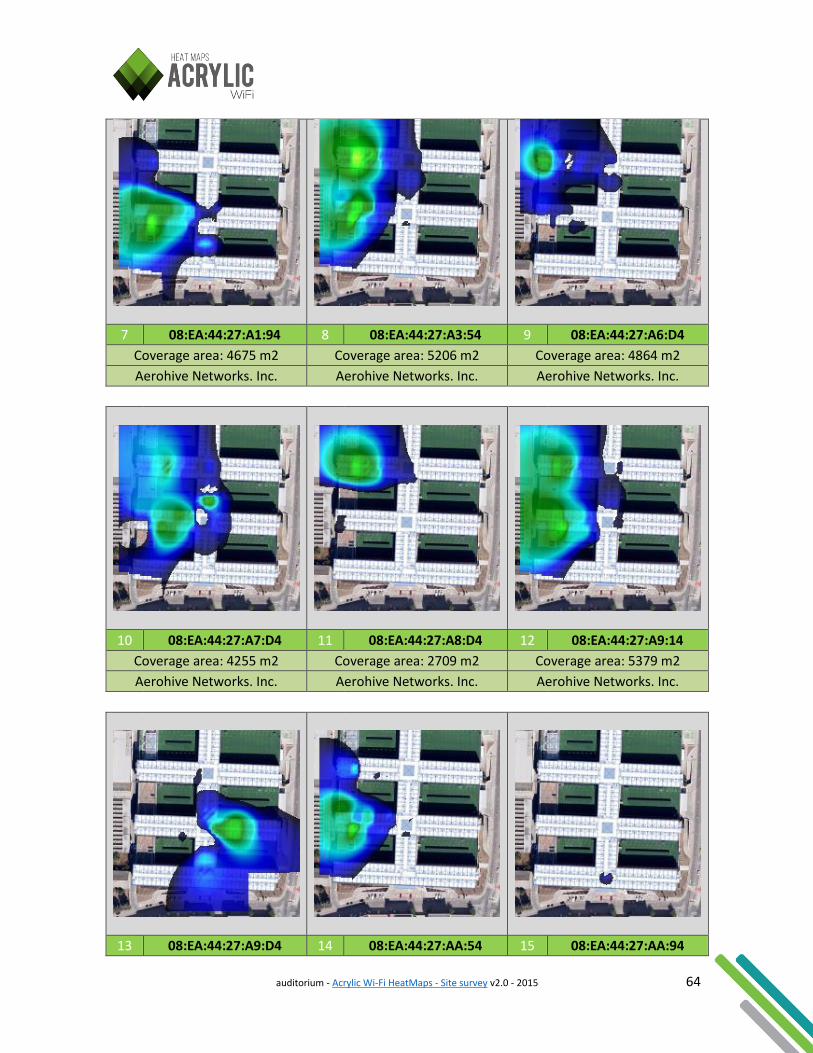
7 08:EA:44:27:A1:94 8 08:EA:44:27:A3:54 9 08:EA:44:27:A6:D4
Coverage area: 4675 m2 Coverage area: 5206 m2 Coverage area: 4864 m2
Aerohive Networks. Inc. Aerohive Networks. Inc. Aerohive Networks. Inc.
10 08:EA:44:27:A7:D4 11 08:EA:44:27:A8:D4 12 08:EA:44:27:A9:14
Coverage area: 4255 m2 Coverage area: 2709 m2 Coverage area: 5379 m2
Aerohive Networks. Inc. Aerohive Networks. Inc. Aerohive Networks. Inc.
13 08:EA:44:27:A9:D4 14 08:EA:44:27:AA:54 15 08:EA:44:27:AA:94
auditorium - Acrylic Wi-Fi HeatMaps - Site survey v2.0 - 2015 65
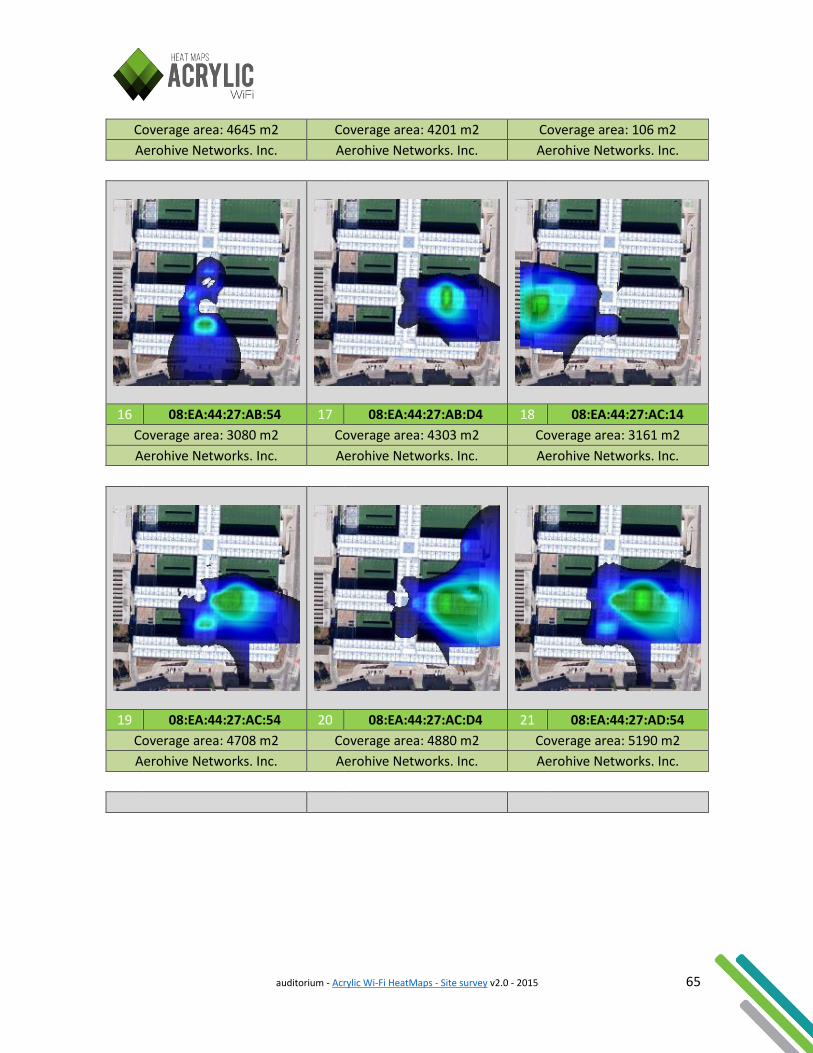
Coverage area: 4645 m2 Coverage area: 4201 m2 Coverage area: 106 m2
Aerohive Networks. Inc. Aerohive Networks. Inc. Aerohive Networks. Inc.
16 08:EA:44:27:AB:54 17 08:EA:44:27:AB:D4 18 08:EA:44:27:AC:14
Coverage area: 3080 m2 Coverage area: 4303 m2 Coverage area: 3161 m2
Aerohive Networks. Inc. Aerohive Networks. Inc. Aerohive Networks. Inc.
19 08:EA:44:27:AC:54 20 08:EA:44:27:AC:D4 21 08:EA:44:27:AD:54
Coverage area: 4708 m2 Coverage area: 4880 m2 Coverage area: 5190 m2
Aerohive Networks. Inc. Aerohive Networks. Inc. Aerohive Networks. Inc.
auditorium - Acrylic Wi-Fi HeatMaps - Site survey v2.0 - 2015 66
22 08:EA:44:27:F8:14 23 08:EA:44:27:F9:14 24 08:EA:44:27:F9:94
Coverage area: 2880 m2 Coverage area: 3729 m2 Coverage area: 7264 m2
Aerohive Networks. Inc. Aerohive Networks. Inc. Aerohive Networks. Inc.
25 08:EA:44:27:F9:D4 26 08:EA:44:27:FA:54 27 08:EA:44:27:FB:14
Coverage area: 1501 m2 Coverage area: 2828 m2 Coverage area: 226 m2
Aerohive Networks. Inc. Aerohive Networks. Inc. Aerohive Networks. Inc.
28 08:EA:44:27:FB:54 29 08:EA:44:27:FB:D4 30 08:EA:44:27:FC:D4
auditorium - Acrylic Wi-Fi HeatMaps - Site survey v2.0 - 2015 67
Coverage area: 247 m2 Coverage area: 3275 m2 Coverage area: 6267 m2
Aerohive Networks. Inc. Aerohive Networks. Inc. Aerohive Networks. Inc.
31 08:EA:44:32:B3:D4 32 5C:D9:98:02:7D:B0 33 F0:9C:E9:27:B3:D4
Coverage area: 3242 m2 Coverage area: 0 m2 Coverage area: 0 m2
Aerohive Networks. Inc. D-Link Corporation Aerohive Networks Inc
34 F0:9C:E9:27:B5:54 35 F0:9C:E9:27:B6:94 36 F0:9C:E9:27:B6:D4
Coverage area: 35 m2 Coverage area: 64 m2 Coverage area: 57 m2
Aerohive Networks Inc Aerohive Networks Inc Aerohive Networks Inc
auditorium - Acrylic Wi-Fi HeatMaps - Site survey v2.0 - 2015 68
37 F0:9C:E9:27:BA:D4 38 F0:9C:E9:27:CD:54
Coverage area: 0 m2 Coverage area: 230 m2
Aerohive Networks Inc Aerohive Networks Inc
auditorium - Acrylic Wi-Fi HeatMaps - Site survey v2.0 - 2015 69
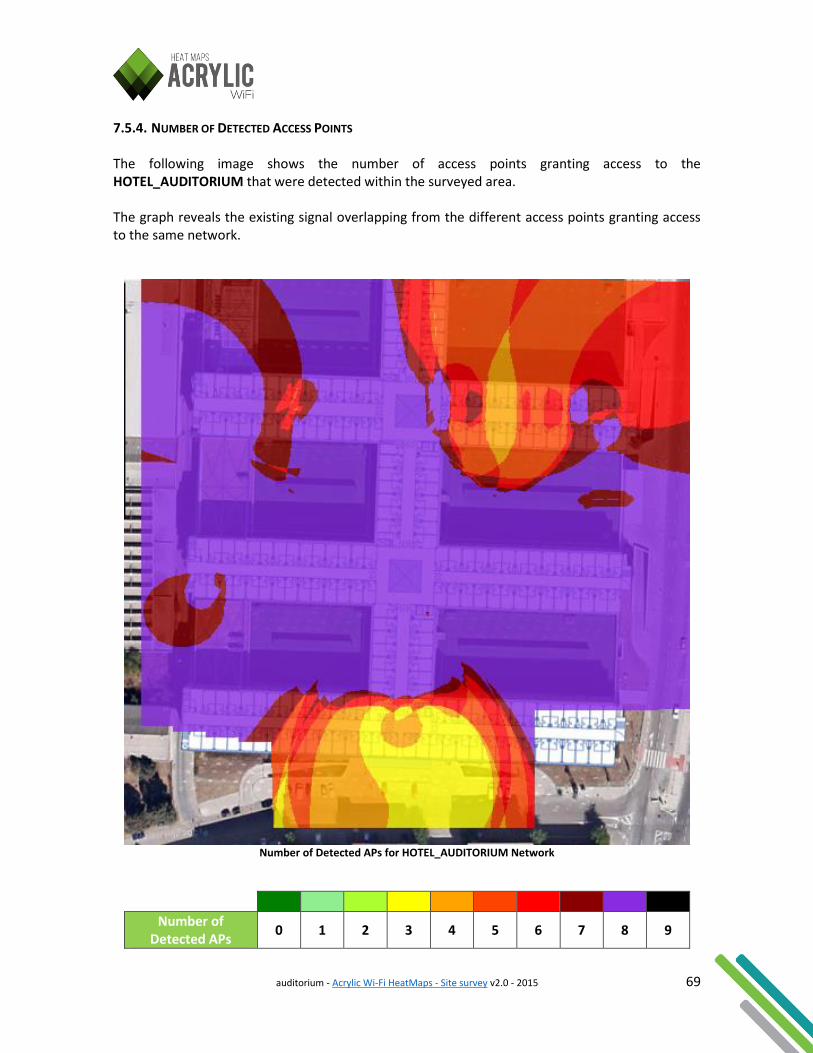
7.5.4. NUMBER OF DETECTED ACCESS POINTS The following image shows the number of access points granting access to the HOTEL_AUDITORIUM that were detected within the surveyed area. The graph reveals the existing signal overlapping from the different access points granting access to the same network.
Number of Detected APs for HOTEL_AUDITORIUM Network
Number of Detected APs
0 1 2 3 4 5 6 7 8 9
auditorium - Acrylic Wi-Fi HeatMaps - Site survey v2.0 - 2015 70
7.5.5. ACCESS POINT COVERAGE The following image shows the color coded coverage of every AP propagating the HOTEL_AUDITORIUM network. If coverage from two or more channels overlap throughout the surveyed area, then the stronger signal channel is display. Using this graph, you will be able to analyze the appropriate coverage distribution.
Access Point Coverage for HOTEL_AUDITORIUM Network
auditorium - Acrylic Wi-Fi HeatMaps - Site survey v2.0 - 2015 71
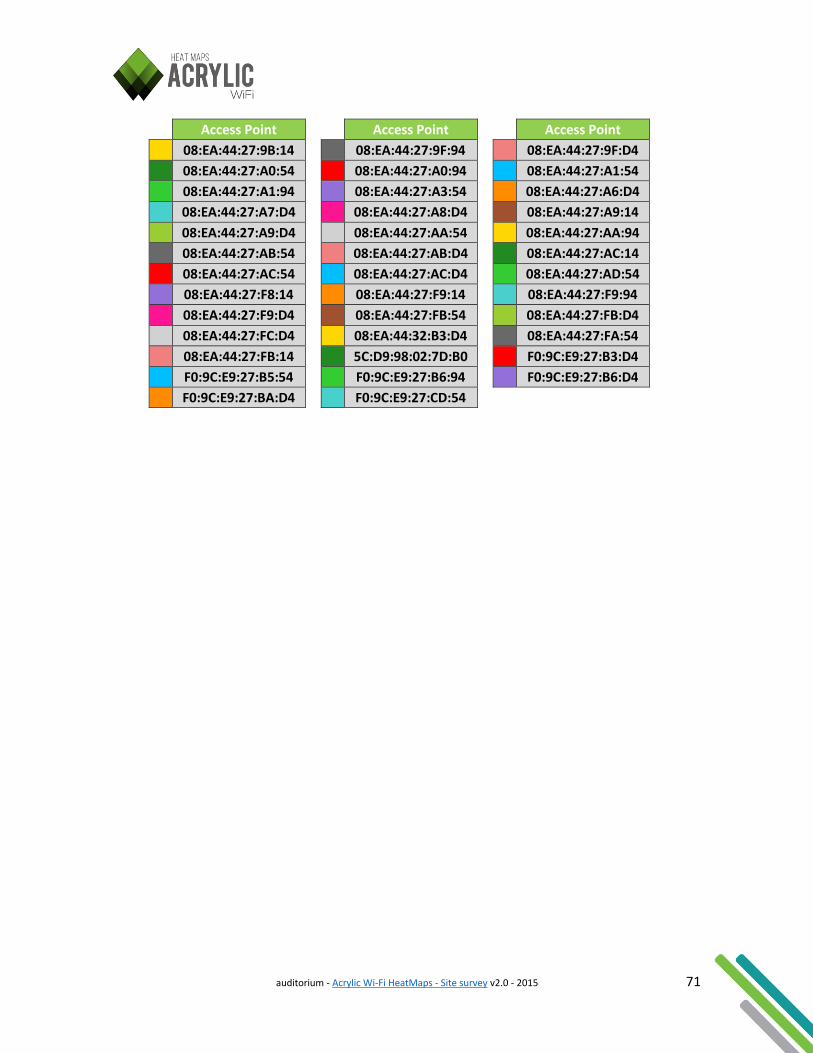
Access Point Access Point Access Point
08:EA:44:27:9B:14 08:EA:44:27:9F:94 08:EA:44:27:9F:D4
08:EA:44:27:A0:54 08:EA:44:27:A0:94 08:EA:44:27:A1:54
08:EA:44:27:A1:94 08:EA:44:27:A3:54 08:EA:44:27:A6:D4
08:EA:44:27:A7:D4 08:EA:44:27:A8:D4 08:EA:44:27:A9:14
08:EA:44:27:A9:D4 08:EA:44:27:AA:54 08:EA:44:27:AA:94
08:EA:44:27:AB:54 08:EA:44:27:AB:D4 08:EA:44:27:AC:14
08:EA:44:27:AC:54 08:EA:44:27:AC:D4 08:EA:44:27:AD:54
08:EA:44:27:F8:14 08:EA:44:27:F9:14 08:EA:44:27:F9:94
08:EA:44:27:F9:D4 08:EA:44:27:FB:54 08:EA:44:27:FB:D4
08:EA:44:27:FC:D4 08:EA:44:32:B3:D4 08:EA:44:27:FA:54
08:EA:44:27:FB:14 5C:D9:98:02:7D:B0 F0:9C:E9:27:B3:D4
F0:9C:E9:27:B5:54 F0:9C:E9:27:B6:94 F0:9C:E9:27:B6:D4
F0:9C:E9:27:BA:D4 F0:9C:E9:27:CD:54
auditorium - Acrylic Wi-Fi HeatMaps - Site survey v2.0 - 2015 72
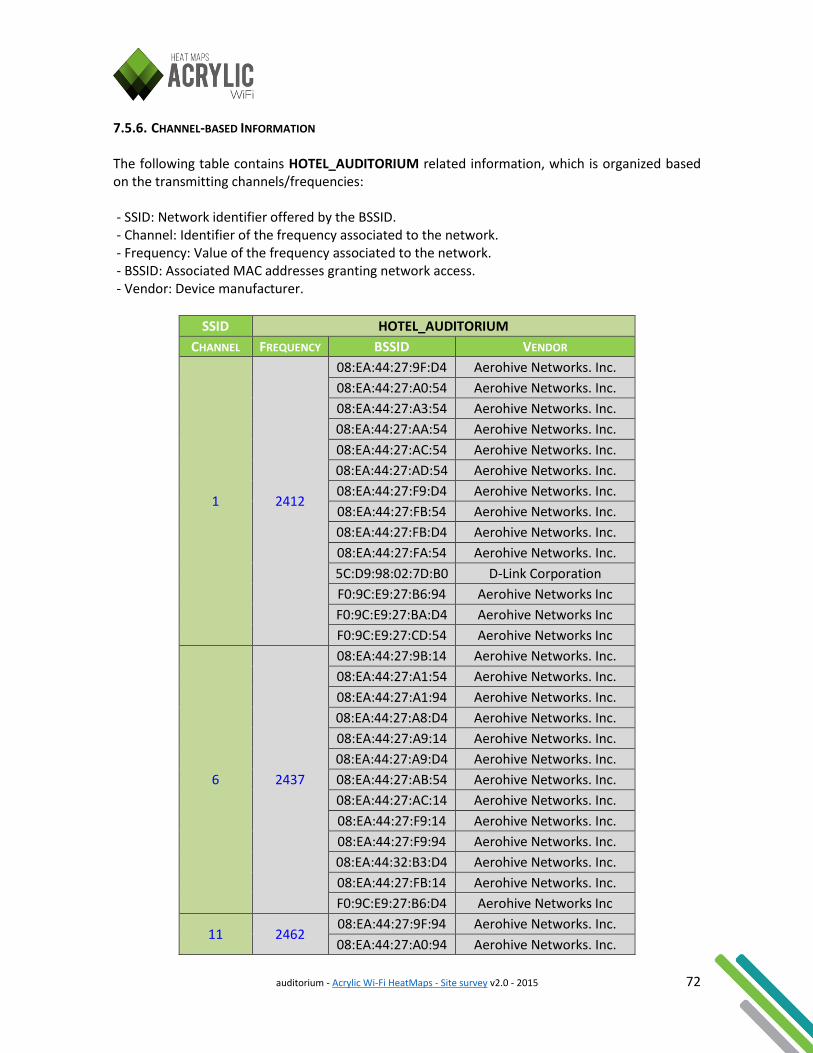
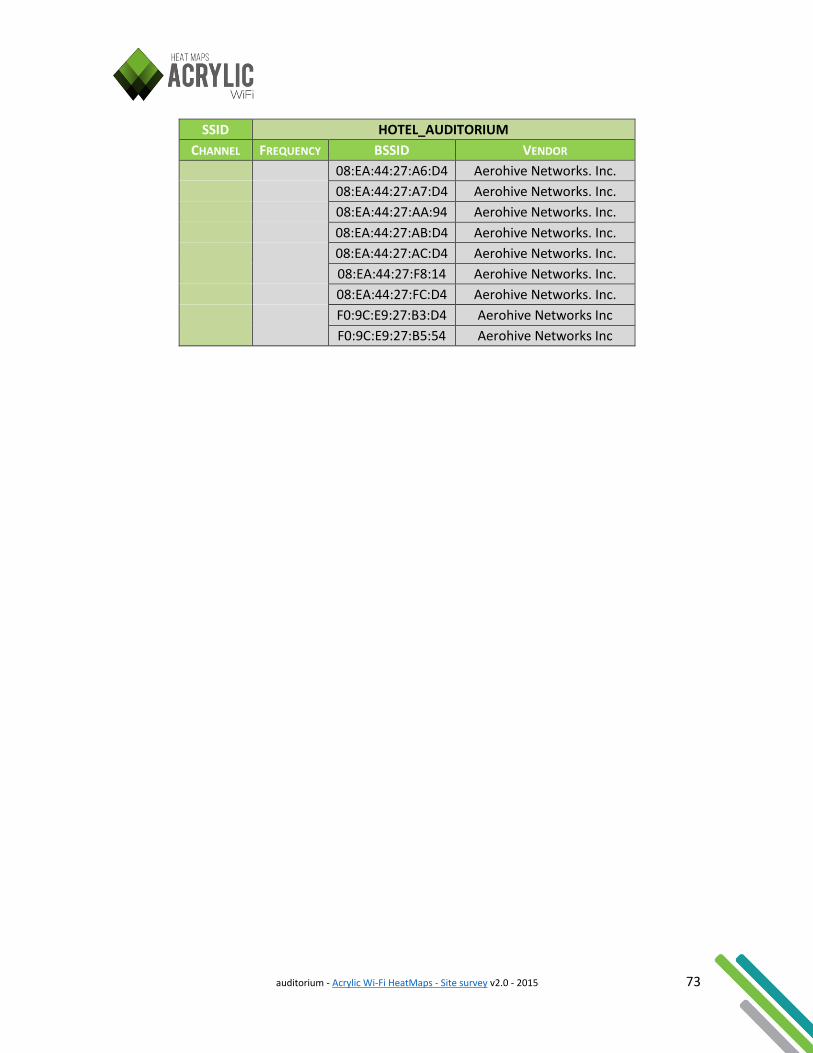
7.5.6. CHANNEL-BASED INFORMATION The following table contains HOTEL_AUDITORIUM related information, which is organized based on the transmitting channels/frequencies: - SSID: Network identifier offered by the BSSID. - Channel: Identifier of the frequency associated to the network. - Frequency: Value of the frequency associated to the network. - BSSID: Associated MAC addresses granting network access. - Vendor: Device manufacturer.
SSID HOTEL_AUDITORIUM
CHANNEL FREQUENCY BSSID VENDOR
1 2412
08:EA:44:27:9F:D4 Aerohive Networks. Inc.
08:EA:44:27:A0:54 Aerohive Networks. Inc.
08:EA:44:27:A3:54 Aerohive Networks. Inc.
08:EA:44:27:AA:54 Aerohive Networks. Inc.
08:EA:44:27:AC:54 Aerohive Networks. Inc.
08:EA:44:27:AD:54 Aerohive Networks. Inc.
08:EA:44:27:F9:D4 Aerohive Networks. Inc.
08:EA:44:27:FB:54 Aerohive Networks. Inc.
08:EA:44:27:FB:D4 Aerohive Networks. Inc.
08:EA:44:27:FA:54 Aerohive Networks. Inc.
5C:D9:98:02:7D:B0 D-Link Corporation
F0:9C:E9:27:B6:94 Aerohive Networks Inc
F0:9C:E9:27:BA:D4 Aerohive Networks Inc
F0:9C:E9:27:CD:54 Aerohive Networks Inc
6 2437
08:EA:44:27:9B:14 Aerohive Networks. Inc.
08:EA:44:27:A1:54 Aerohive Networks. Inc.
08:EA:44:27:A1:94 Aerohive Networks. Inc.
08:EA:44:27:A8:D4 Aerohive Networks. Inc.
08:EA:44:27:A9:14 Aerohive Networks. Inc.
08:EA:44:27:A9:D4 Aerohive Networks. Inc.
08:EA:44:27:AB:54 Aerohive Networks. Inc.
08:EA:44:27:AC:14 Aerohive Networks. Inc.
08:EA:44:27:F9:14 Aerohive Networks. Inc.
08:EA:44:27:F9:94 Aerohive Networks. Inc.
08:EA:44:32:B3:D4 Aerohive Networks. Inc.
08:EA:44:27:FB:14 Aerohive Networks. Inc.
F0:9C:E9:27:B6:D4 Aerohive Networks Inc
11 2462 08:EA:44:27:9F:94 Aerohive Networks. Inc.
08:EA:44:27:A0:94 Aerohive Networks. Inc.
auditorium - Acrylic Wi-Fi HeatMaps - Site survey v2.0 - 2015 73
SSID HOTEL_AUDITORIUM
CHANNEL FREQUENCY BSSID VENDOR
08:EA:44:27:A6:D4 Aerohive Networks. Inc.
08:EA:44:27:A7:D4 Aerohive Networks. Inc.
08:EA:44:27:AA:94 Aerohive Networks. Inc.
08:EA:44:27:AB:D4 Aerohive Networks. Inc.
08:EA:44:27:AC:D4 Aerohive Networks. Inc.
08:EA:44:27:F8:14 Aerohive Networks. Inc.
08:EA:44:27:FC:D4 Aerohive Networks. Inc.
F0:9C:E9:27:B3:D4 Aerohive Networks Inc
F0:9C:E9:27:B5:54 Aerohive Networks Inc
auditorium - Acrylic Wi-Fi HeatMaps - Site survey v2.0 - 2015 74
7.5.7. CHANNEL COVERAGE The following image shows the coverage range for every channel in the HOTEL_AUDITORIUM network. If coverage from two or more channels overlap throughout the surveyed area, then the stronger signal channel is display.
Channel Coverage for HOTEL_AUDITORIUM Network.
Channel 6 11 1
auditorium - Acrylic Wi-Fi HeatMaps - Site survey v2.0 - 2015 75
7.5.8. CHANNEL OVERLAP The following image shows the coverage area for each operative channel on the HOTEL_AUDITORIUM, and the signal overlapping between two or more channels throughout the surveyed area.
Channel Overlap for HOTEL_AUDITORIUM Network
Channel 6 11 1
auditorium - Acrylic Wi-Fi HeatMaps - Site survey v2.0 - 2015 76
7.5.9. SIGNAL STRENGTH BY CHANNEL The following table contains a tile view of all operative channels on the HOTEL_AUDITORIUM. The graph shows the signal strength heatmap, and the coverage area associated with this network on that channel.
1 Channel 1 2 Channel 6 3 Channel 11
Coverage area: 7002 m2 Coverage area: 7852 m2 Coverage area: 7049 m2
auditorium - Acrylic Wi-Fi HeatMaps - Site survey v2.0 - 2015 77
7.5.10. SIGNAL-TO-NOISE RATIO The following image shows the HOTEL_AUDITORIUM's signal-to-noise rate throughout the surveyed area. Signal-to-noise rate measures the ratio between the Wi-Fi network signal strength and the background noise. Higher noise levels will result in a larger negative impact on communications. This parameter offers valuable information on the effectiveness of communications. These values range from 0 to 100, being 100 the best possible communication quality.
Signal to Noise Ratio for HOTEL_AUDITORIUM Network
auditorium - Acrylic Wi-Fi HeatMaps - Site survey v2.0 - 2015 78
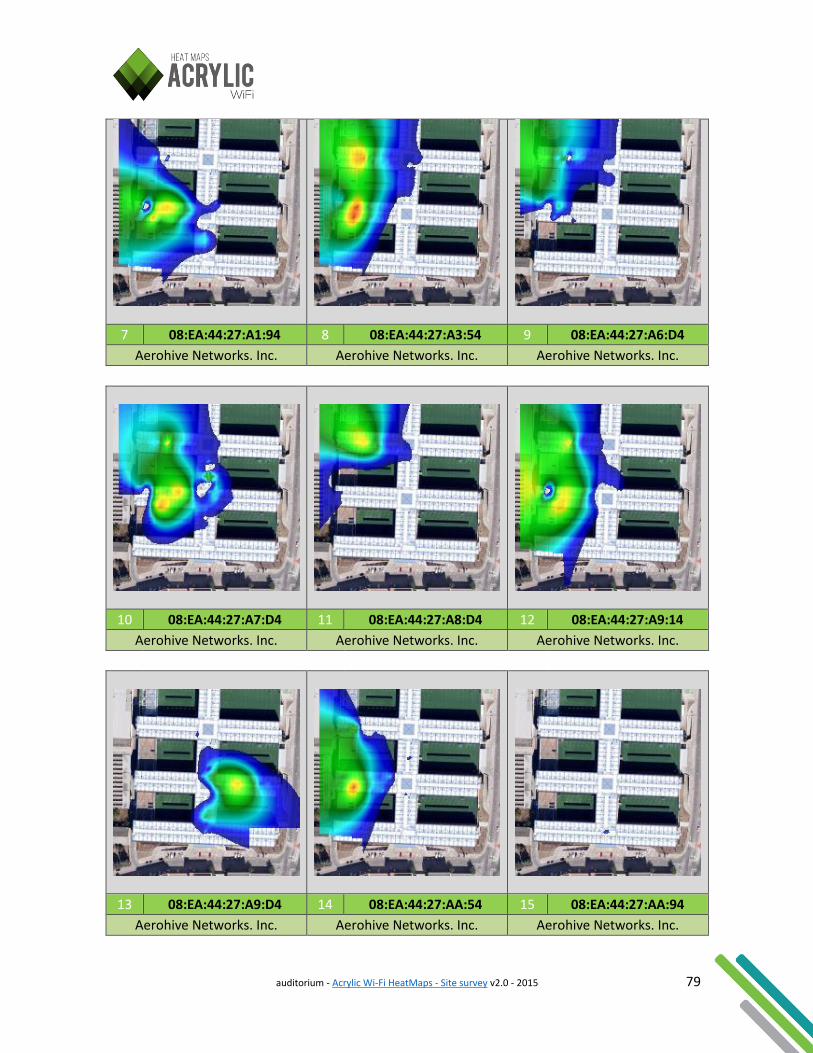
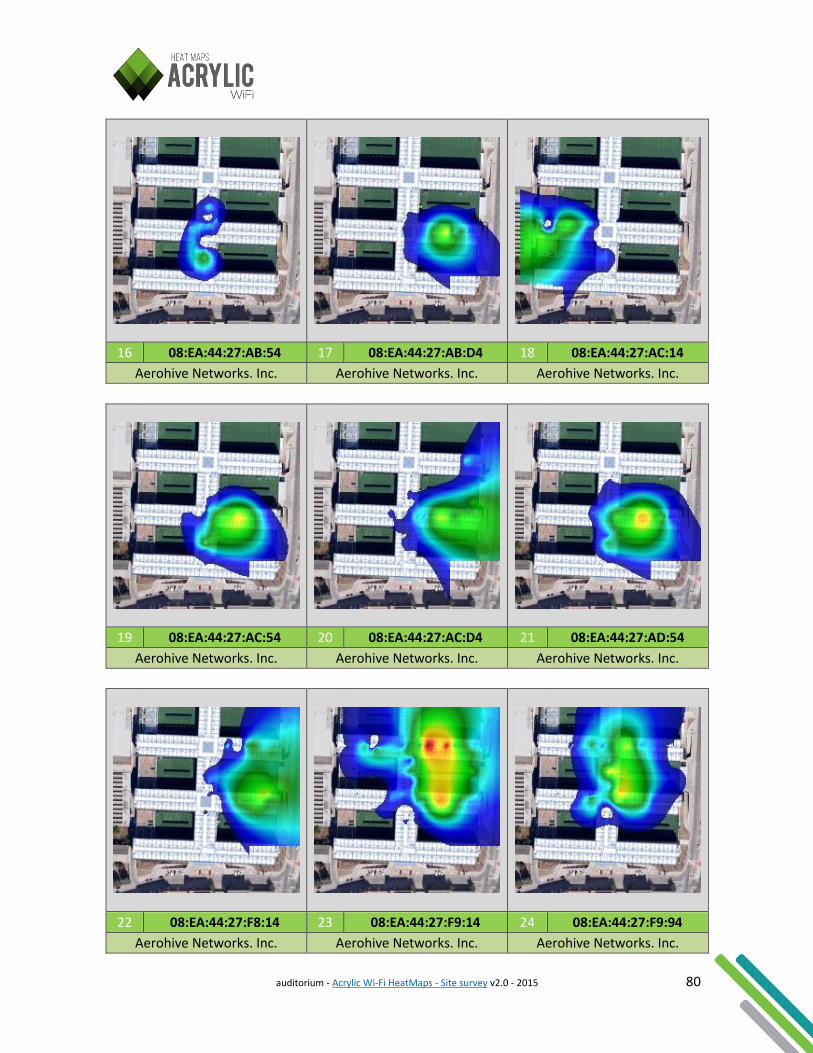
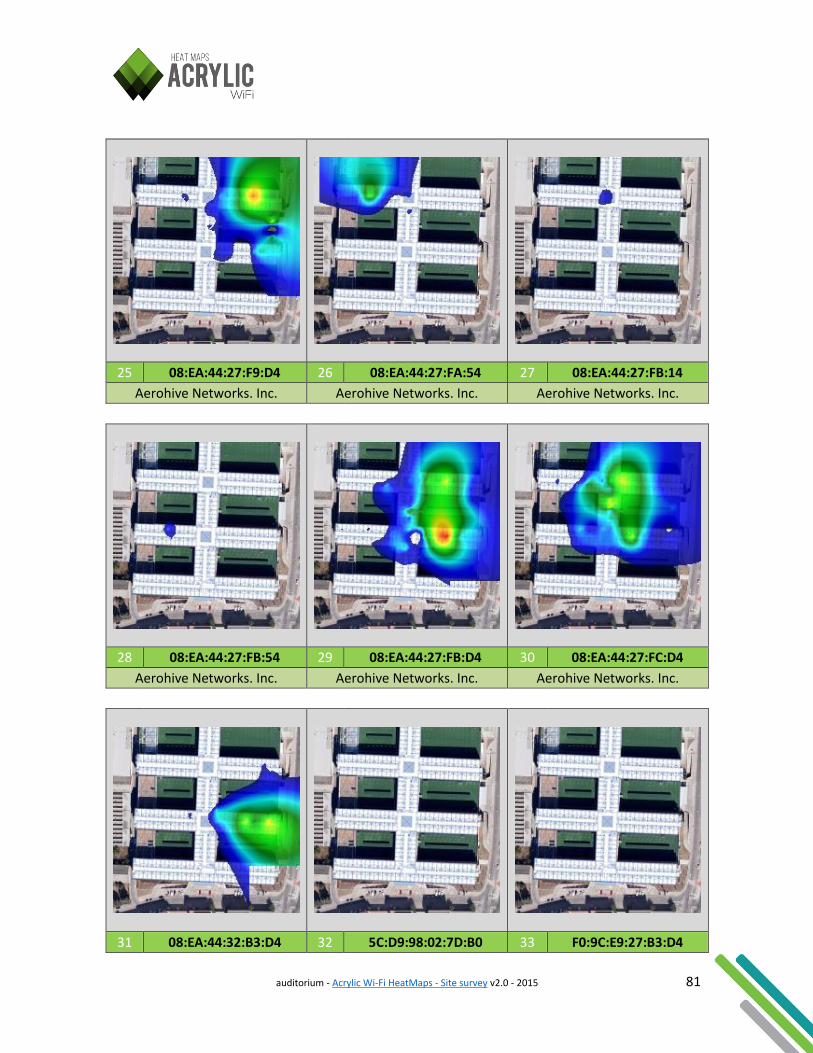
7.5.11. SIGNAL-TO-NOISE RATIO BY AP The following table contains a tile view of all BSSID's associated with the HOTEL_AUDITORIUM, in which a signal-to-noise rate heatmap is shown. Signal-to-noise rate measures the ratio between the Wi-Fi network signal strength and the background noise. Higher noise levels will result in a larger negative impact on communications. This parameter offers valuable information on the effectiveness of communications. These values range from 0 to 100, being 100 the best possible communication quality.
1 08:EA:44:27:9B:14 2 08:EA:44:27:9F:94 3 08:EA:44:27:9F:D4
Aerohive Networks. Inc. Aerohive Networks. Inc. Aerohive Networks. Inc.
4 08:EA:44:27:A0:54 5 08:EA:44:27:A0:94 6 08:EA:44:27:A1:54
Aerohive Networks. Inc. Aerohive Networks. Inc. Aerohive Networks. Inc.
auditorium - Acrylic Wi-Fi HeatMaps - Site survey v2.0 - 2015 79
7 08:EA:44:27:A1:94 8 08:EA:44:27:A3:54 9 08:EA:44:27:A6:D4
Aerohive Networks. Inc. Aerohive Networks. Inc. Aerohive Networks. Inc.
10 08:EA:44:27:A7:D4 11 08:EA:44:27:A8:D4 12 08:EA:44:27:A9:14
Aerohive Networks. Inc. Aerohive Networks. Inc. Aerohive Networks. Inc.
13 08:EA:44:27:A9:D4 14 08:EA:44:27:AA:54 15 08:EA:44:27:AA:94
Aerohive Networks. Inc. Aerohive Networks. Inc. Aerohive Networks. Inc.
auditorium - Acrylic Wi-Fi HeatMaps - Site survey v2.0 - 2015 80
16 08:EA:44:27:AB:54 17 08:EA:44:27:AB:D4 18 08:EA:44:27:AC:14
Aerohive Networks. Inc. Aerohive Networks. Inc. Aerohive Networks. Inc.
19 08:EA:44:27:AC:54 20 08:EA:44:27:AC:D4 21 08:EA:44:27:AD:54
Aerohive Networks. Inc. Aerohive Networks. Inc. Aerohive Networks. Inc.
22 08:EA:44:27:F8:14 23 08:EA:44:27:F9:14 24 08:EA:44:27:F9:94
Aerohive Networks. Inc. Aerohive Networks. Inc. Aerohive Networks. Inc.
auditorium - Acrylic Wi-Fi HeatMaps - Site survey v2.0 - 2015 81
25 08:EA:44:27:F9:D4 26 08:EA:44:27:FA:54 27 08:EA:44:27:FB:14
Aerohive Networks. Inc. Aerohive Networks. Inc. Aerohive Networks. Inc.
28 08:EA:44:27:FB:54 29 08:EA:44:27:FB:D4 30 08:EA:44:27:FC:D4
Aerohive Networks. Inc. Aerohive Networks. Inc. Aerohive Networks. Inc.
31 08:EA:44:32:B3:D4 32 5C:D9:98:02:7D:B0 33 F0:9C:E9:27:B3:D4

auditorium - Acrylic Wi-Fi HeatMaps - Site survey v2.0 - 2015 82
Aerohive Networks. Inc. D-Link Corporation Aerohive Networks Inc
34 F0:9C:E9:27:B5:54 35 F0:9C:E9:27:B6:94 36 F0:9C:E9:27:B6:D4
Aerohive Networks Inc Aerohive Networks Inc Aerohive Networks Inc
37 F0:9C:E9:27:BA:D4 38 F0:9C:E9:27:CD:54
Aerohive Networks Inc Aerohive Networks Inc
auditorium - Acrylic Wi-Fi HeatMaps - Site survey v2.0 - 2015 83
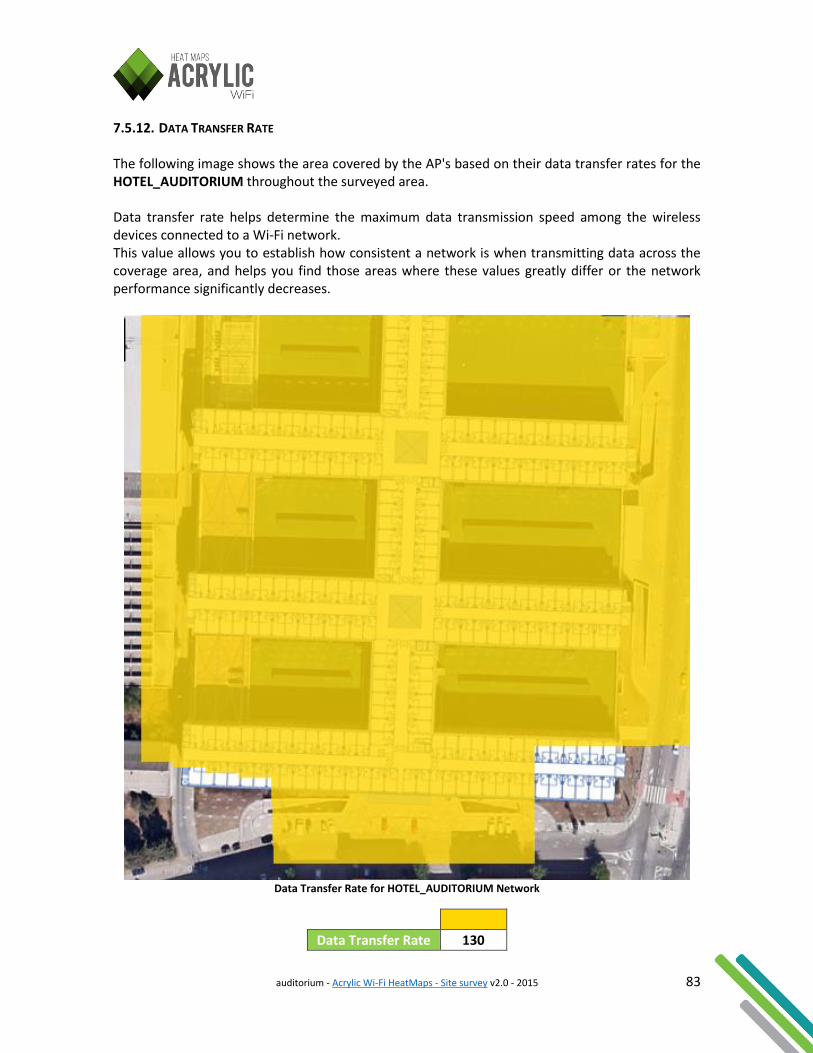
7.5.12. DATA TRANSFER RATE The following image shows the area covered by the AP's based on their data transfer rates for the HOTEL_AUDITORIUM throughout the surveyed area. Data transfer rate helps determine the maximum data transmission speed among the wireless devices connected to a Wi-Fi network. This value allows you to establish how consistent a network is when transmitting data across the coverage area, and helps you find those areas where these values greatly differ or the network performance significantly decreases.
Data Transfer Rate for HOTEL_AUDITORIUM Network
Data Transfer Rate 130
auditorium - Acrylic Wi-Fi HeatMaps - Site survey v2.0 - 2015 84
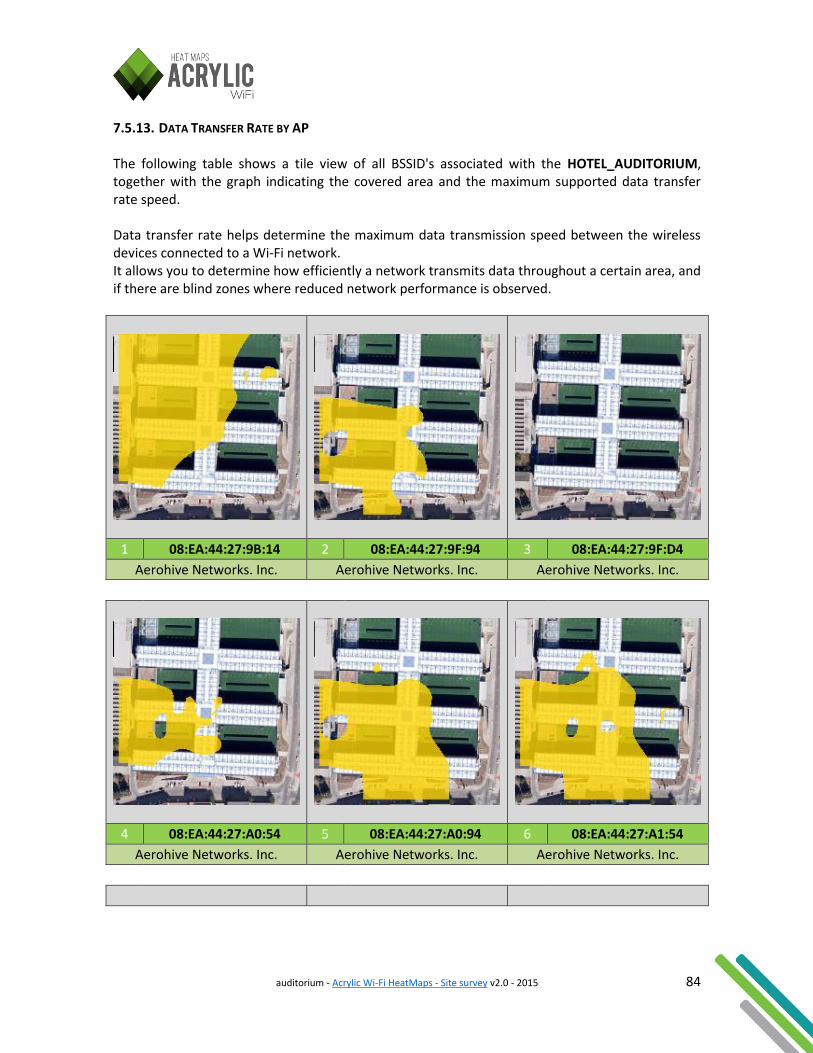
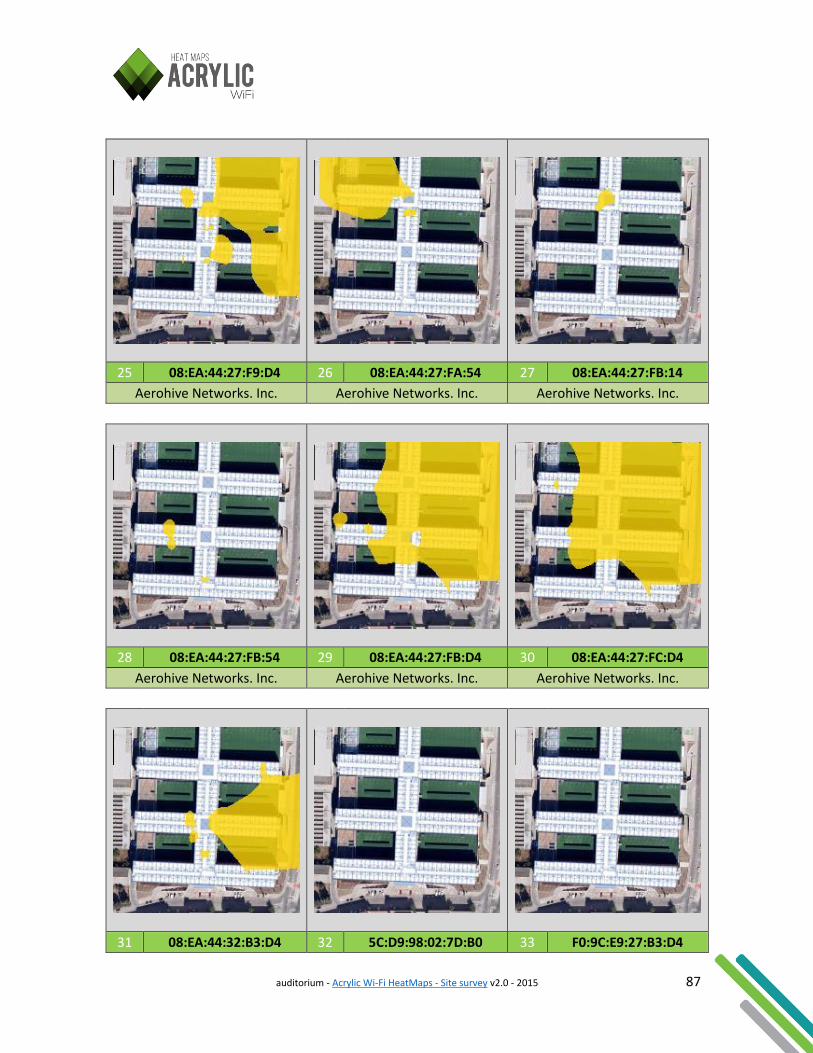
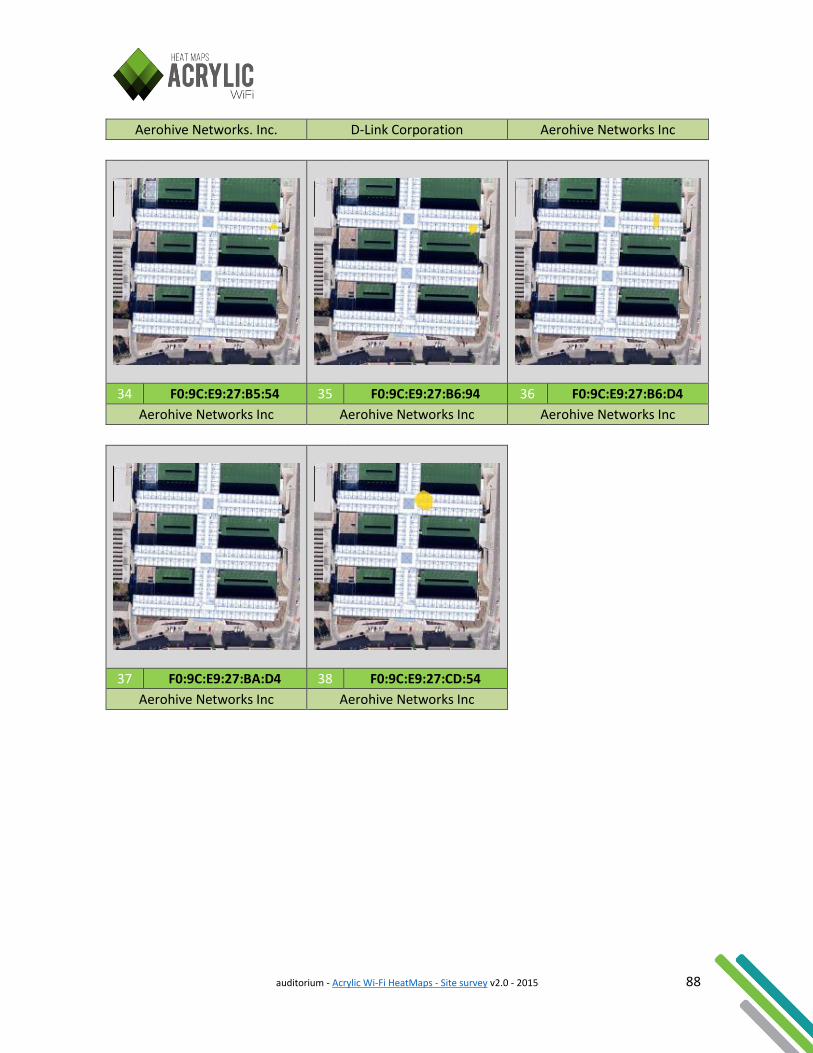
7.5.13. DATA TRANSFER RATE BY AP The following table shows a tile view of all BSSID's associated with the HOTEL_AUDITORIUM, together with the graph indicating the covered area and the maximum supported data transfer rate speed. Data transfer rate helps determine the maximum data transmission speed between the wireless devices connected to a Wi-Fi network. It allows you to determine how efficiently a network transmits data throughout a certain area, and if there are blind zones where reduced network performance is observed.
1 08:EA:44:27:9B:14 2 08:EA:44:27:9F:94 3 08:EA:44:27:9F:D4
Aerohive Networks. Inc. Aerohive Networks. Inc. Aerohive Networks. Inc.
4 08:EA:44:27:A0:54 5 08:EA:44:27:A0:94 6 08:EA:44:27:A1:54
Aerohive Networks. Inc. Aerohive Networks. Inc. Aerohive Networks. Inc.
auditorium - Acrylic Wi-Fi HeatMaps - Site survey v2.0 - 2015 85
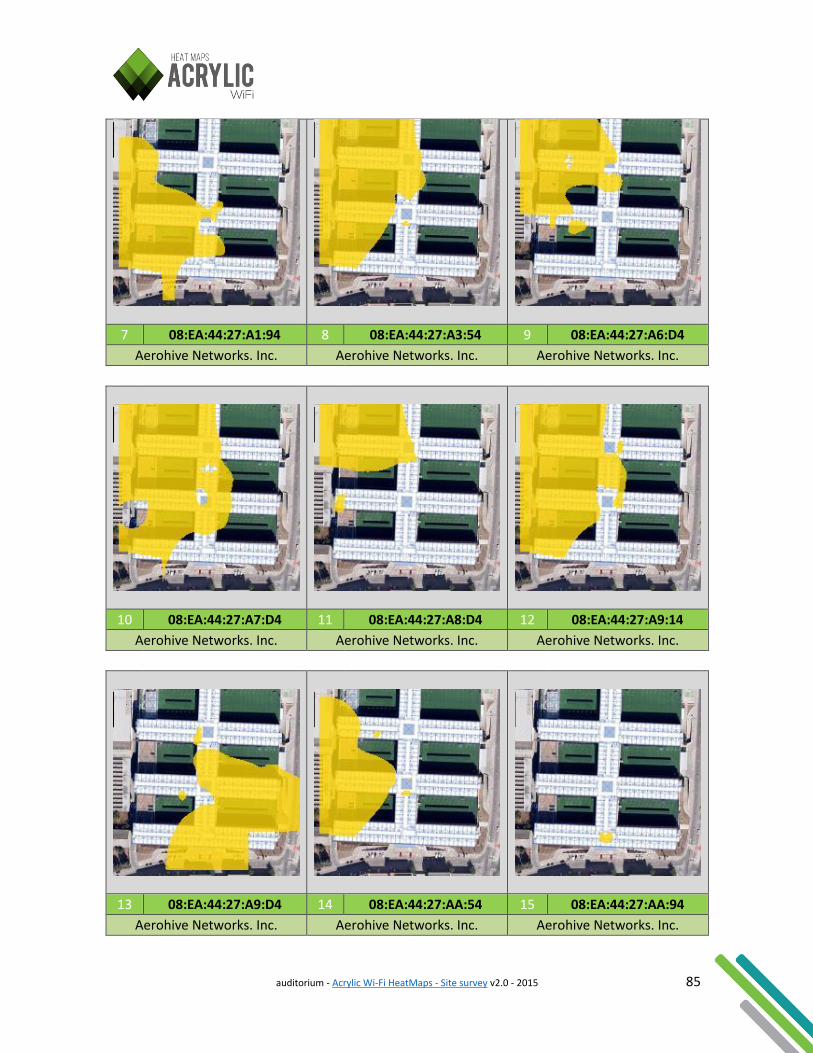
7 08:EA:44:27:A1:94 8 08:EA:44:27:A3:54 9 08:EA:44:27:A6:D4
Aerohive Networks. Inc. Aerohive Networks. Inc. Aerohive Networks. Inc.
10 08:EA:44:27:A7:D4 11 08:EA:44:27:A8:D4 12 08:EA:44:27:A9:14
Aerohive Networks. Inc. Aerohive Networks. Inc. Aerohive Networks. Inc.
13 08:EA:44:27:A9:D4 14 08:EA:44:27:AA:54 15 08:EA:44:27:AA:94
Aerohive Networks. Inc. Aerohive Networks. Inc. Aerohive Networks. Inc.
auditorium - Acrylic Wi-Fi HeatMaps - Site survey v2.0 - 2015 86
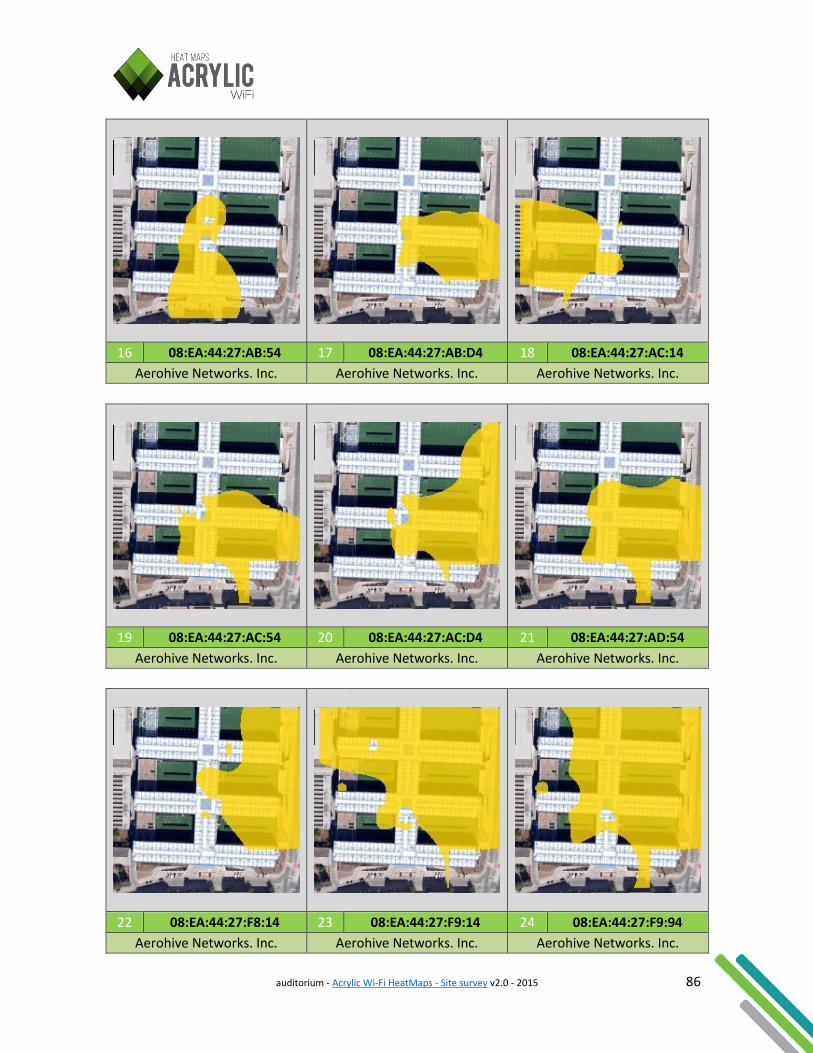
16 08:EA:44:27:AB:54 17 08:EA:44:27:AB:D4 18 08:EA:44:27:AC:14
Aerohive Networks. Inc. Aerohive Networks. Inc. Aerohive Networks. Inc.
19 08:EA:44:27:AC:54 20 08:EA:44:27:AC:D4 21 08:EA:44:27:AD:54
Aerohive Networks. Inc. Aerohive Networks. Inc. Aerohive Networks. Inc.
22 08:EA:44:27:F8:14 23 08:EA:44:27:F9:14 24 08:EA:44:27:F9:94
Aerohive Networks. Inc. Aerohive Networks. Inc. Aerohive Networks. Inc.
auditorium - Acrylic Wi-Fi HeatMaps - Site survey v2.0 - 2015 87
25 08:EA:44:27:F9:D4 26 08:EA:44:27:FA:54 27 08:EA:44:27:FB:14
Aerohive Networks. Inc. Aerohive Networks. Inc. Aerohive Networks. Inc.
28 08:EA:44:27:FB:54 29 08:EA:44:27:FB:D4 30 08:EA:44:27:FC:D4
Aerohive Networks. Inc. Aerohive Networks. Inc. Aerohive Networks. Inc.
31 08:EA:44:32:B3:D4 32 5C:D9:98:02:7D:B0 33 F0:9C:E9:27:B3:D4
auditorium - Acrylic Wi-Fi HeatMaps - Site survey v2.0 - 2015 88
Aerohive Networks. Inc. D-Link Corporation Aerohive Networks Inc
34 F0:9C:E9:27:B5:54 35 F0:9C:E9:27:B6:94 36 F0:9C:E9:27:B6:D4
Aerohive Networks Inc Aerohive Networks Inc Aerohive Networks Inc
37 F0:9C:E9:27:BA:D4 38 F0:9C:E9:27:CD:54
Aerohive Networks Inc Aerohive Networks Inc
auditorium - Acrylic Wi-Fi HeatMaps - Site survey v2.0 - 2015 89
7.5.14. DEVICE DENSITY The following image shows a heatmap revealing the distribution of all client devices connected to the AP's propagating the HOTEL_AUDITORIUM network. Device density allows you to spot which zones have the higher number of client devices connected to the network by showing its saturation. It provides useful information to allow for an even AP distribution according to actual usage.
Device Density for HOTEL_AUDITORIUM Network
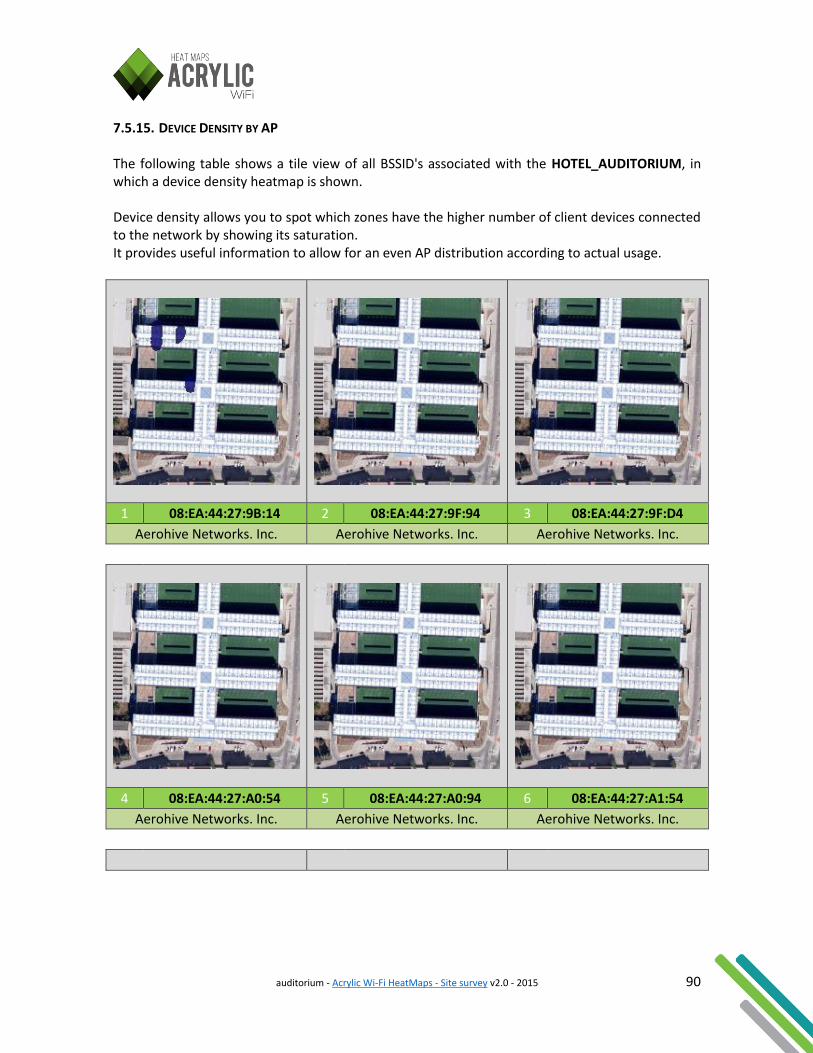
auditorium - Acrylic Wi-Fi HeatMaps - Site survey v2.0 - 2015 90
7.5.15. DEVICE DENSITY BY AP The following table shows a tile view of all BSSID's associated with the HOTEL_AUDITORIUM, in which a device density heatmap is shown. Device density allows you to spot which zones have the higher number of client devices connected to the network by showing its saturation. It provides useful information to allow for an even AP distribution according to actual usage.
1 08:EA:44:27:9B:14 2 08:EA:44:27:9F:94 3 08:EA:44:27:9F:D4
Aerohive Networks. Inc. Aerohive Networks. Inc. Aerohive Networks. Inc.
4 08:EA:44:27:A0:54 5 08:EA:44:27:A0:94 6 08:EA:44:27:A1:54
Aerohive Networks. Inc. Aerohive Networks. Inc. Aerohive Networks. Inc.
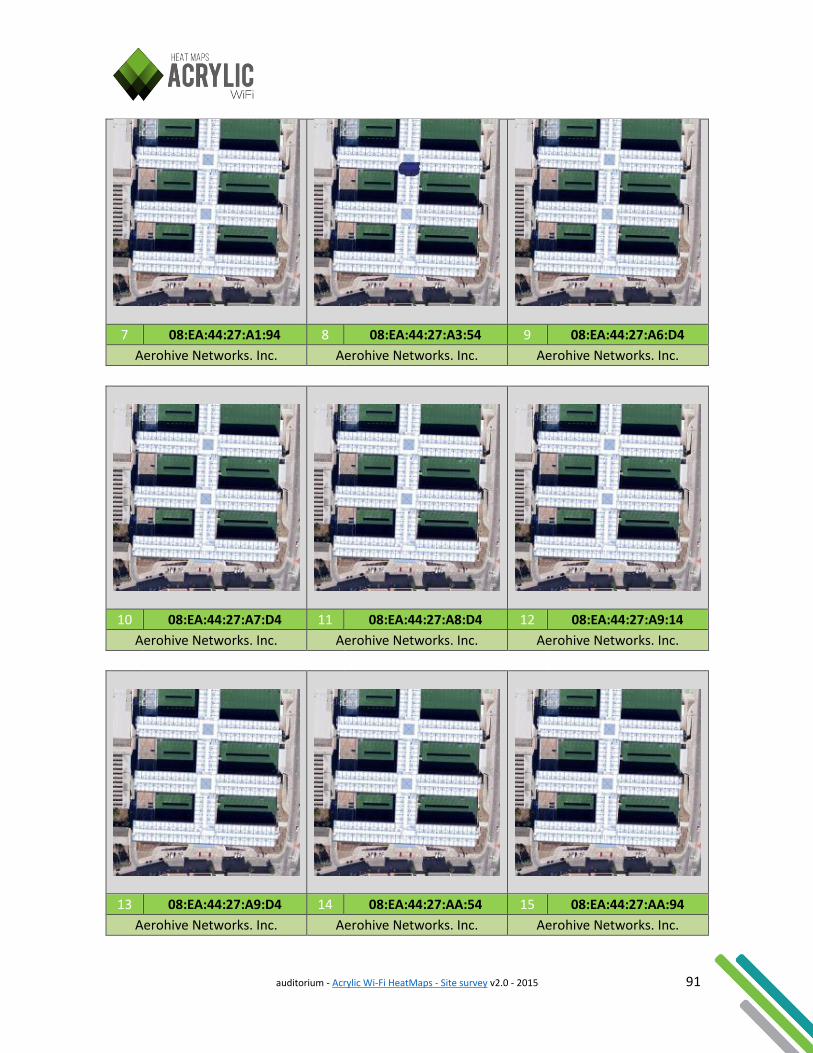
auditorium - Acrylic Wi-Fi HeatMaps - Site survey v2.0 - 2015 91
7 08:EA:44:27:A1:94 8 08:EA:44:27:A3:54 9 08:EA:44:27:A6:D4
Aerohive Networks. Inc. Aerohive Networks. Inc. Aerohive Networks. Inc.
10 08:EA:44:27:A7:D4 11 08:EA:44:27:A8:D4 12 08:EA:44:27:A9:14
Aerohive Networks. Inc. Aerohive Networks. Inc. Aerohive Networks. Inc.
13 08:EA:44:27:A9:D4 14 08:EA:44:27:AA:54 15 08:EA:44:27:AA:94
Aerohive Networks. Inc. Aerohive Networks. Inc. Aerohive Networks. Inc.
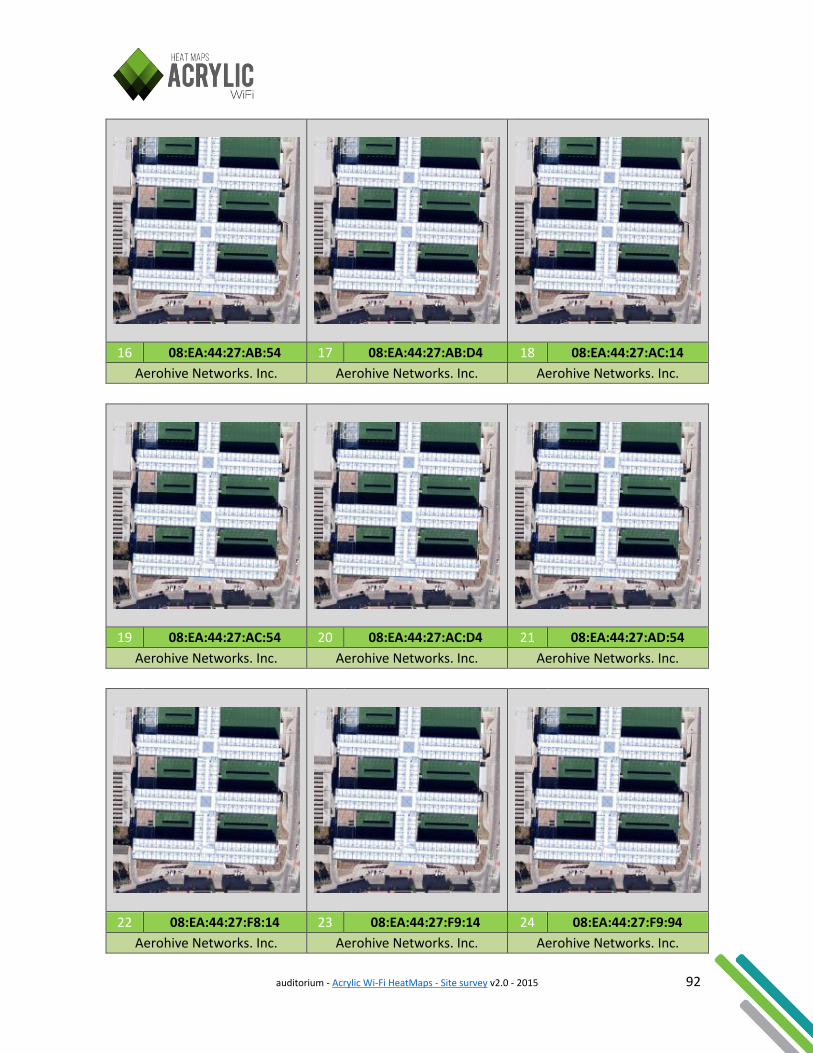
auditorium - Acrylic Wi-Fi HeatMaps - Site survey v2.0 - 2015 92
16 08:EA:44:27:AB:54 17 08:EA:44:27:AB:D4 18 08:EA:44:27:AC:14
Aerohive Networks. Inc. Aerohive Networks. Inc. Aerohive Networks. Inc.
19 08:EA:44:27:AC:54 20 08:EA:44:27:AC:D4 21 08:EA:44:27:AD:54
Aerohive Networks. Inc. Aerohive Networks. Inc. Aerohive Networks. Inc.
22 08:EA:44:27:F8:14 23 08:EA:44:27:F9:14 24 08:EA:44:27:F9:94
Aerohive Networks. Inc. Aerohive Networks. Inc. Aerohive Networks. Inc.
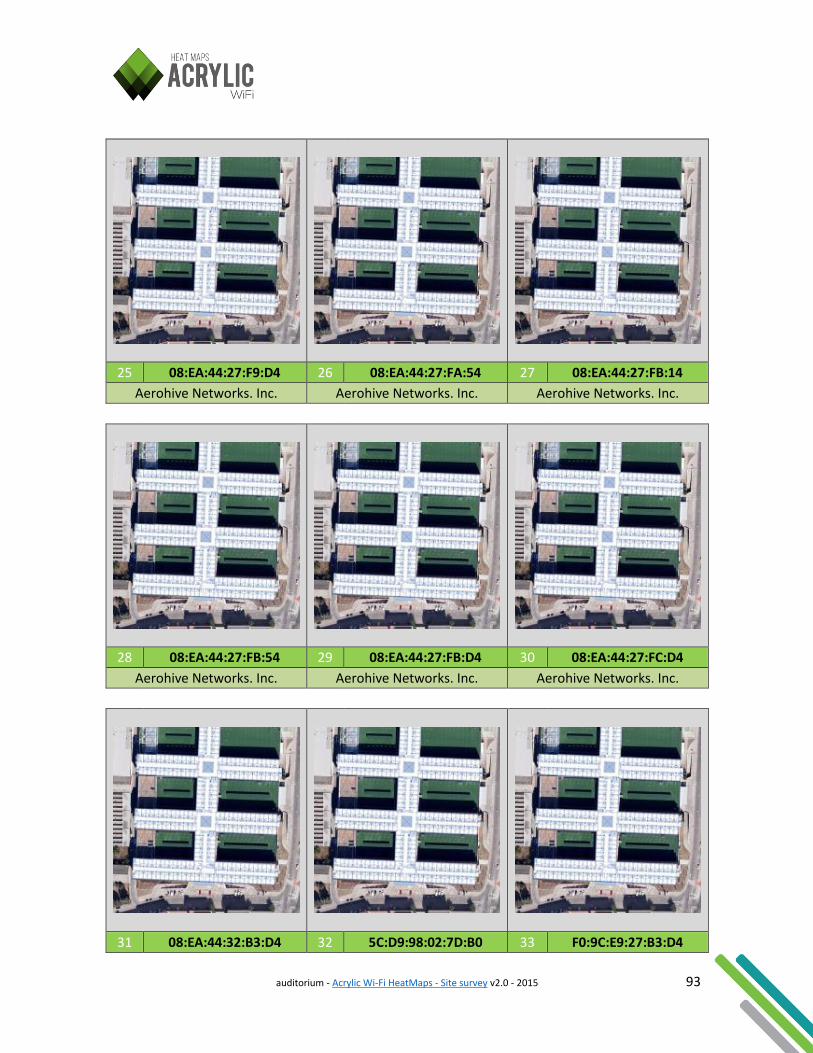
auditorium - Acrylic Wi-Fi HeatMaps - Site survey v2.0 - 2015 93
25 08:EA:44:27:F9:D4 26 08:EA:44:27:FA:54 27 08:EA:44:27:FB:14
Aerohive Networks. Inc. Aerohive Networks. Inc. Aerohive Networks. Inc.
28 08:EA:44:27:FB:54 29 08:EA:44:27:FB:D4 30 08:EA:44:27:FC:D4
Aerohive Networks. Inc. Aerohive Networks. Inc. Aerohive Networks. Inc.
31 08:EA:44:32:B3:D4 32 5C:D9:98:02:7D:B0 33 F0:9C:E9:27:B3:D4

auditorium - Acrylic Wi-Fi HeatMaps - Site survey v2.0 - 2015 94
Aerohive Networks. Inc. D-Link Corporation Aerohive Networks Inc
34 F0:9C:E9:27:B5:54 35 F0:9C:E9:27:B6:94 36 F0:9C:E9:27:B6:D4
Aerohive Networks Inc Aerohive Networks Inc Aerohive Networks Inc
37 F0:9C:E9:27:BA:D4 38 F0:9C:E9:27:CD:54
Aerohive Networks Inc Aerohive Networks Inc
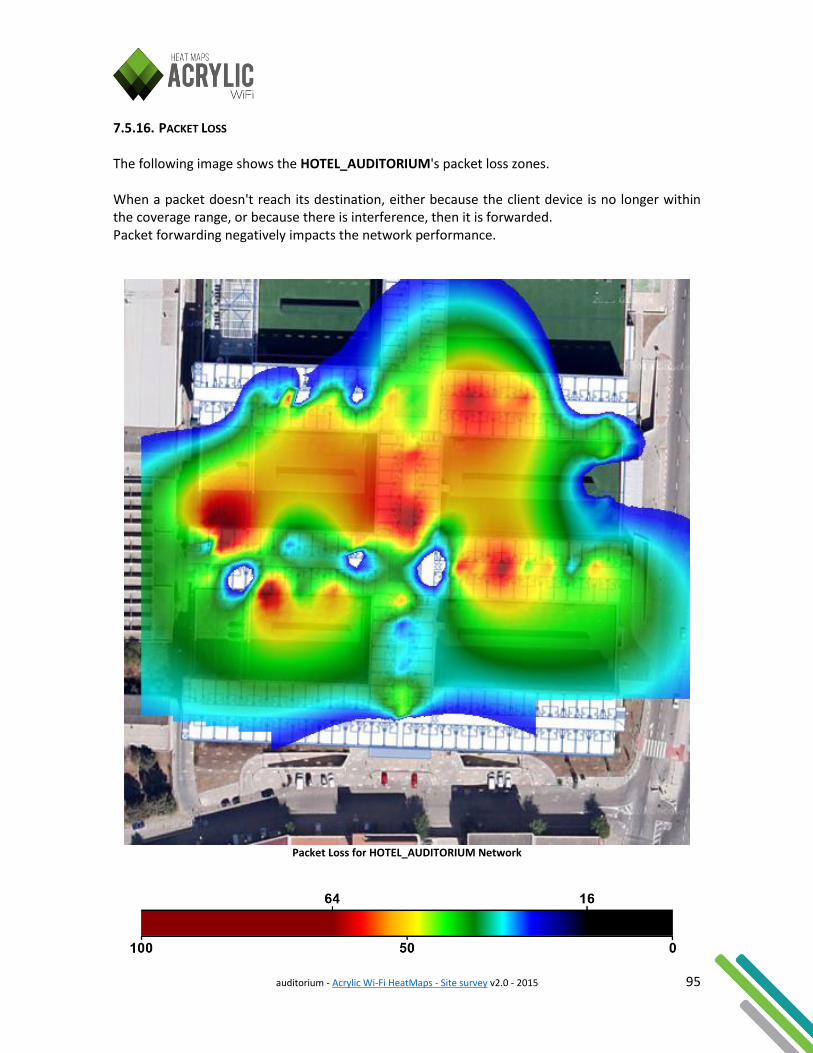
auditorium - Acrylic Wi-Fi HeatMaps - Site survey v2.0 - 2015 95
7.5.16. PACKET LOSS The following image shows the HOTEL_AUDITORIUM's packet loss zones. When a packet doesn't reach its destination, either because the client device is no longer within the coverage range, or because there is interference, then it is forwarded. Packet forwarding negatively impacts the network performance.
Packet Loss for HOTEL_AUDITORIUM Network
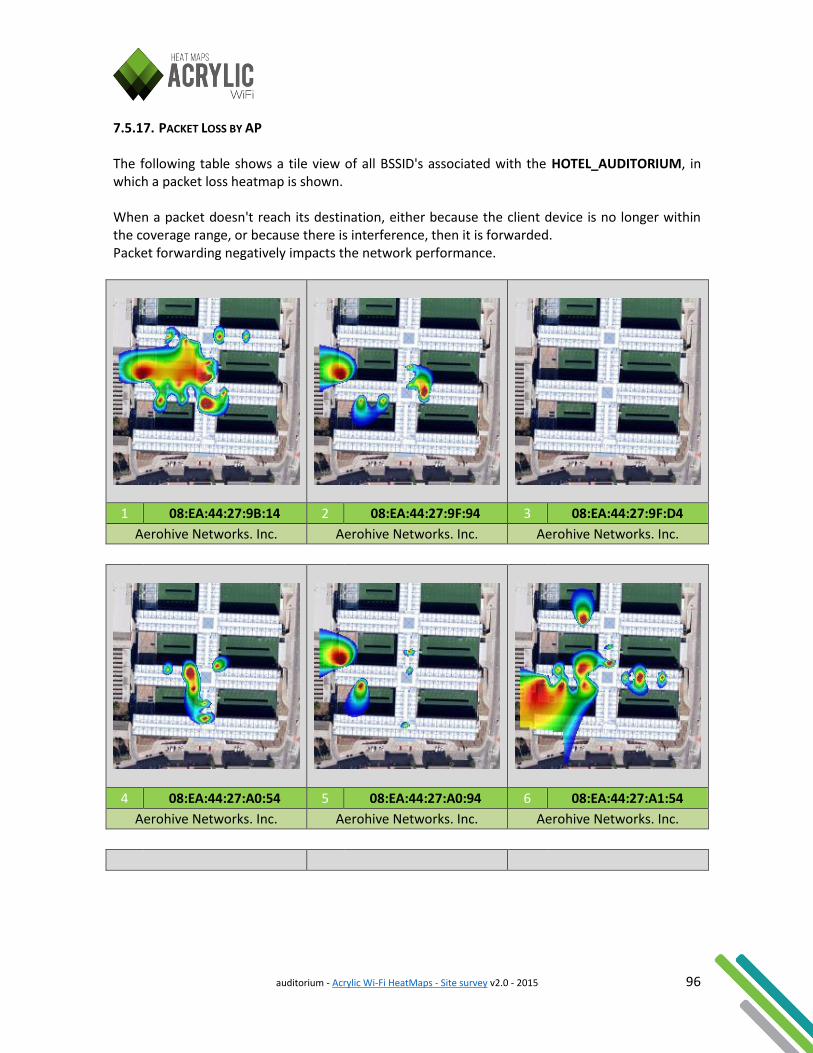
auditorium - Acrylic Wi-Fi HeatMaps - Site survey v2.0 - 2015 96
7.5.17. PACKET LOSS BY AP The following table shows a tile view of all BSSID's associated with the HOTEL_AUDITORIUM, in which a packet loss heatmap is shown. When a packet doesn't reach its destination, either because the client device is no longer within the coverage range, or because there is interference, then it is forwarded. Packet forwarding negatively impacts the network performance.
1 08:EA:44:27:9B:14 2 08:EA:44:27:9F:94 3 08:EA:44:27:9F:D4
Aerohive Networks. Inc. Aerohive Networks. Inc. Aerohive Networks. Inc.
4 08:EA:44:27:A0:54 5 08:EA:44:27:A0:94 6 08:EA:44:27:A1:54
Aerohive Networks. Inc. Aerohive Networks. Inc. Aerohive Networks. Inc.
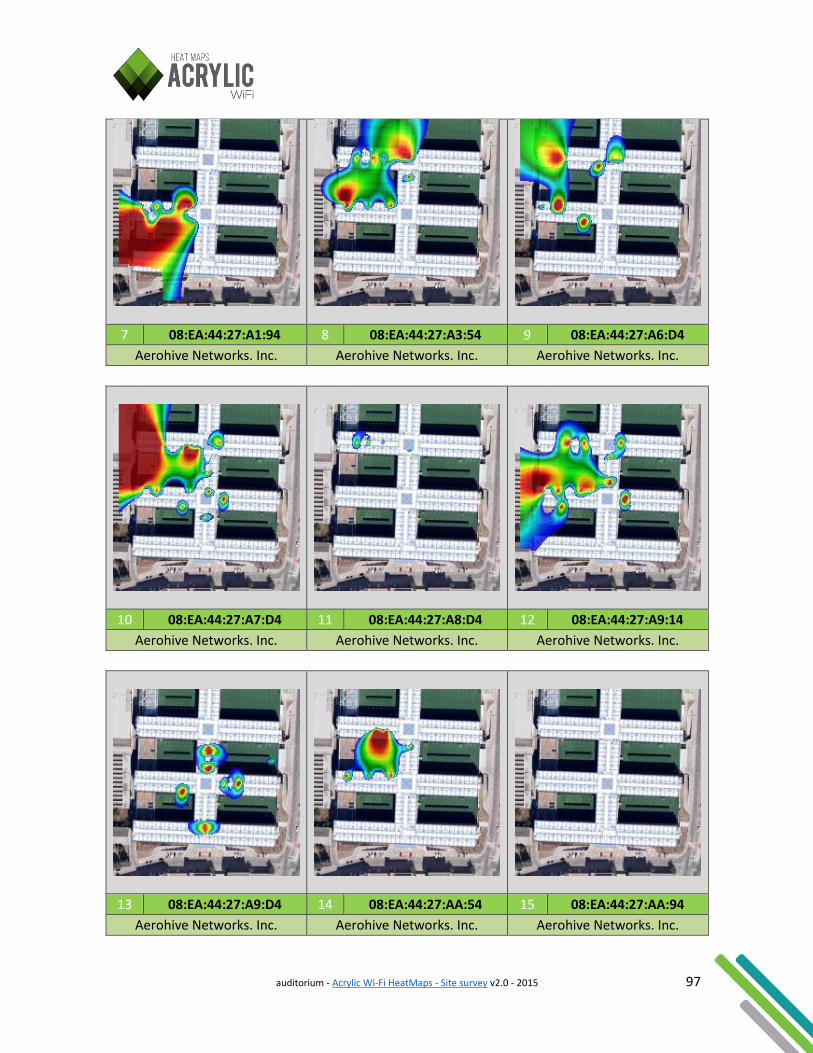
auditorium - Acrylic Wi-Fi HeatMaps - Site survey v2.0 - 2015 97
7 08:EA:44:27:A1:94 8 08:EA:44:27:A3:54 9 08:EA:44:27:A6:D4
Aerohive Networks. Inc. Aerohive Networks. Inc. Aerohive Networks. Inc.
10 08:EA:44:27:A7:D4 11 08:EA:44:27:A8:D4 12 08:EA:44:27:A9:14
Aerohive Networks. Inc. Aerohive Networks. Inc. Aerohive Networks. Inc.
13 08:EA:44:27:A9:D4 14 08:EA:44:27:AA:54 15 08:EA:44:27:AA:94
Aerohive Networks. Inc. Aerohive Networks. Inc. Aerohive Networks. Inc.
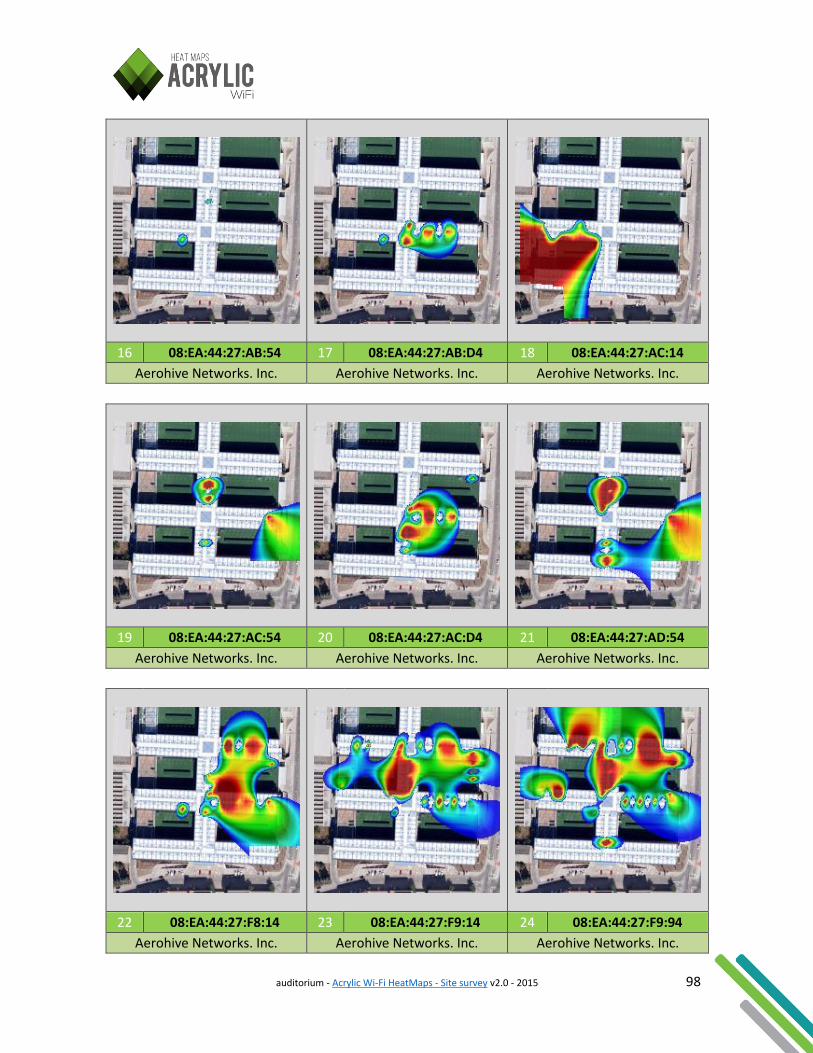
auditorium - Acrylic Wi-Fi HeatMaps - Site survey v2.0 - 2015 98
16 08:EA:44:27:AB:54 17 08:EA:44:27:AB:D4 18 08:EA:44:27:AC:14
Aerohive Networks. Inc. Aerohive Networks. Inc. Aerohive Networks. Inc.
19 08:EA:44:27:AC:54 20 08:EA:44:27:AC:D4 21 08:EA:44:27:AD:54
Aerohive Networks. Inc. Aerohive Networks. Inc. Aerohive Networks. Inc.
22 08:EA:44:27:F8:14 23 08:EA:44:27:F9:14 24 08:EA:44:27:F9:94
Aerohive Networks. Inc. Aerohive Networks. Inc. Aerohive Networks. Inc.
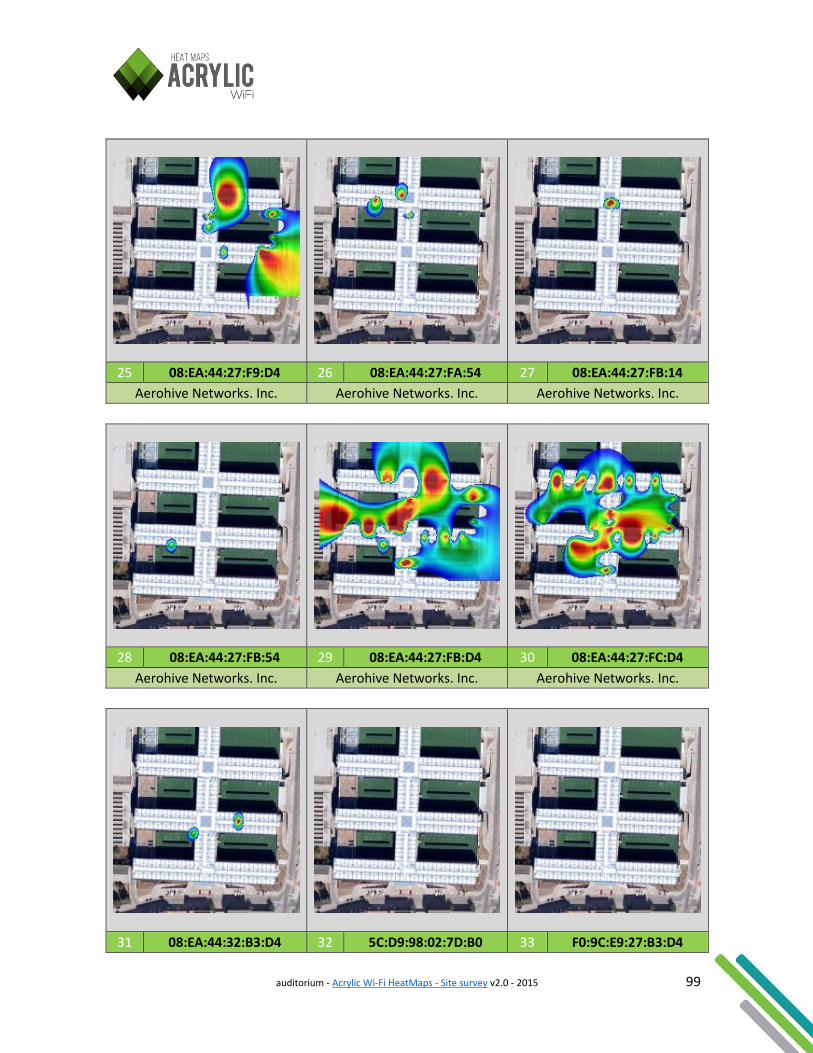
auditorium - Acrylic Wi-Fi HeatMaps - Site survey v2.0 - 2015 99
25 08:EA:44:27:F9:D4 26 08:EA:44:27:FA:54 27 08:EA:44:27:FB:14
Aerohive Networks. Inc. Aerohive Networks. Inc. Aerohive Networks. Inc.
28 08:EA:44:27:FB:54 29 08:EA:44:27:FB:D4 30 08:EA:44:27:FC:D4
Aerohive Networks. Inc. Aerohive Networks. Inc. Aerohive Networks. Inc.
31 08:EA:44:32:B3:D4 32 5C:D9:98:02:7D:B0 33 F0:9C:E9:27:B3:D4

auditorium - Acrylic Wi-Fi HeatMaps - Site survey v2.0 - 2015 100
Aerohive Networks. Inc. D-Link Corporation Aerohive Networks Inc
34 F0:9C:E9:27:B5:54 35 F0:9C:E9:27:B6:94 36 F0:9C:E9:27:B6:D4
Aerohive Networks Inc Aerohive Networks Inc Aerohive Networks Inc
37 F0:9C:E9:27:BA:D4 38 F0:9C:E9:27:CD:54
Aerohive Networks Inc Aerohive Networks Inc
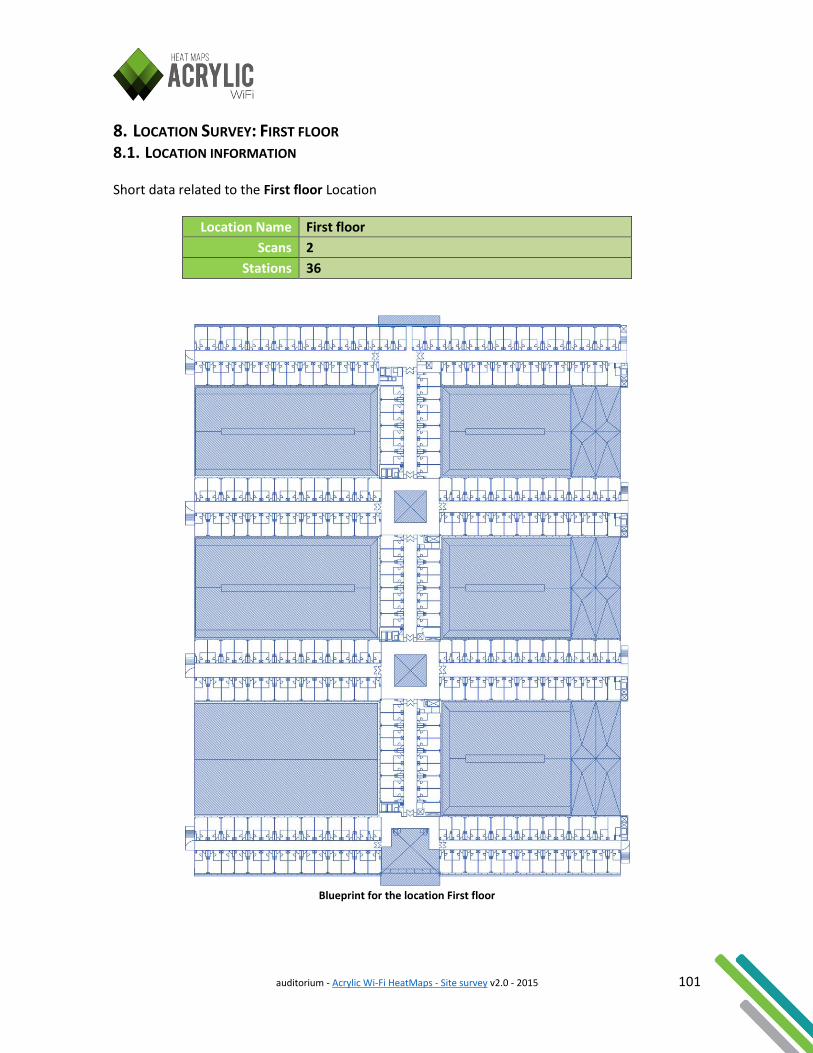
auditorium - Acrylic Wi-Fi HeatMaps - Site survey v2.0 - 2015 101
8. LOCATION SURVEY: FIRST FLOOR 8.1. LOCATION INFORMATION Short data related to the First floor Location
Location Name First floor
Scans 2
Stations 36
Blueprint for the location First floor
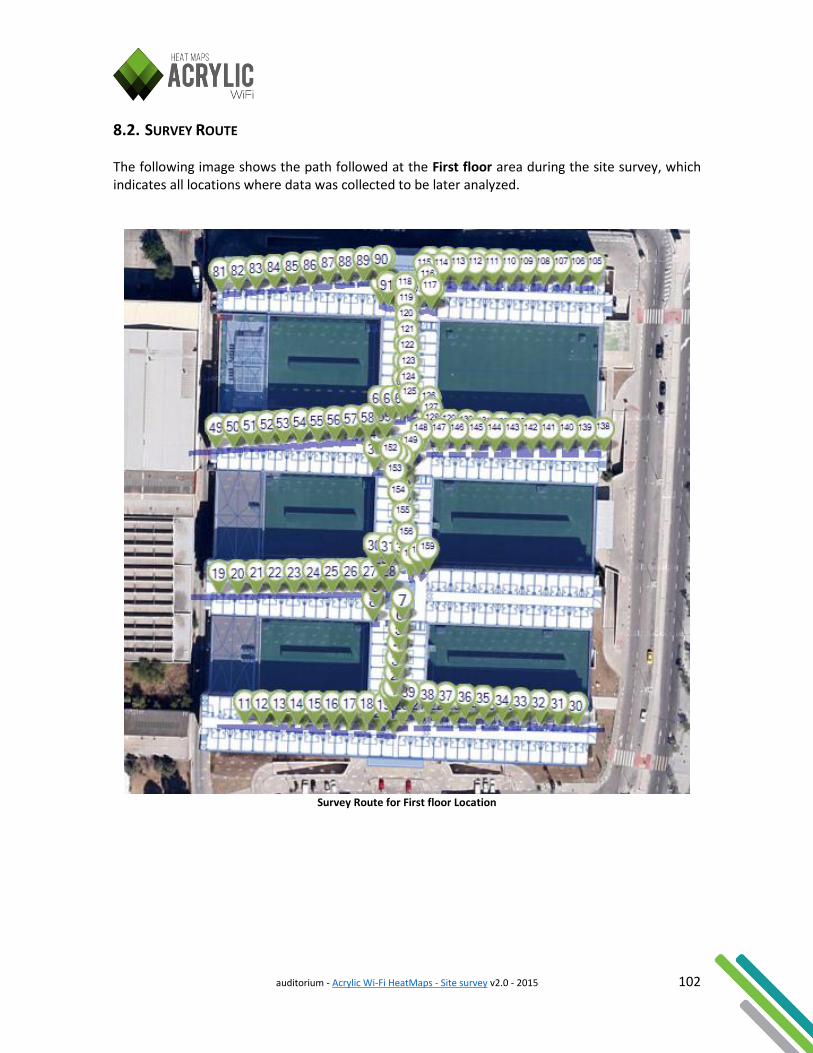
auditorium - Acrylic Wi-Fi HeatMaps - Site survey v2.0 - 2015 102
8.2. SURVEY ROUTE The following image shows the path followed at the First floor area during the site survey, which indicates all locations where data was collected to be later analyzed.
Survey Route for First floor Location
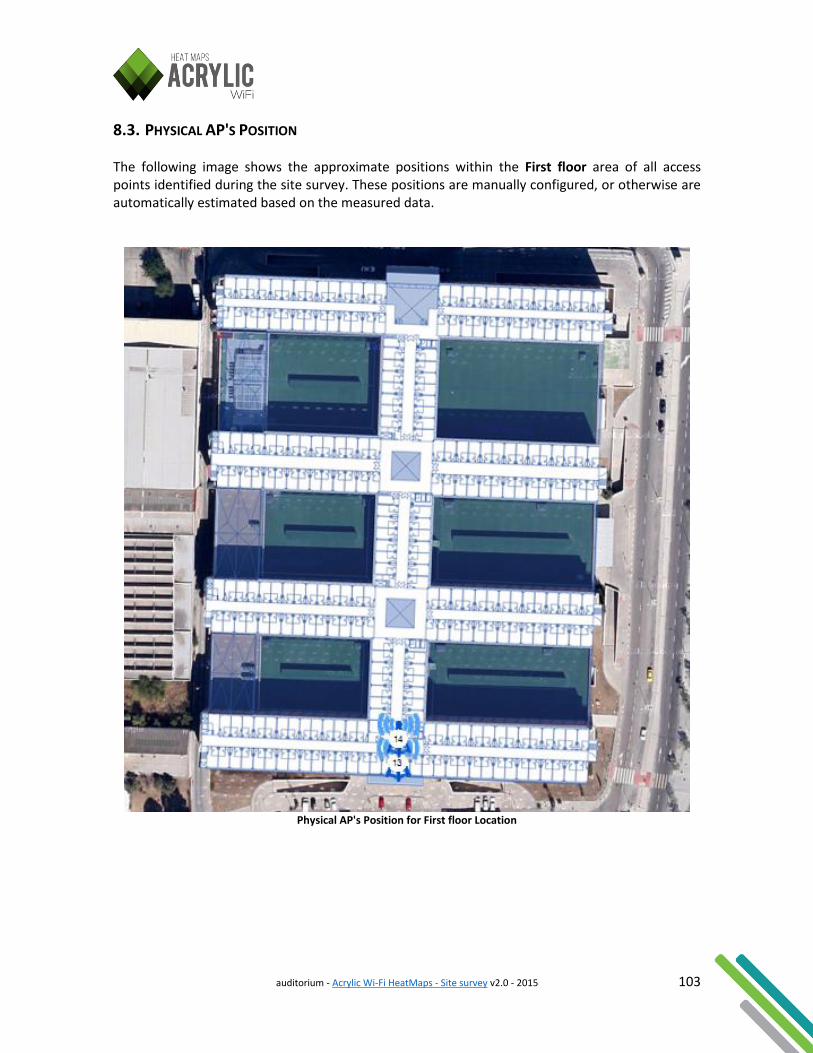
auditorium - Acrylic Wi-Fi HeatMaps - Site survey v2.0 - 2015 103
8.3. PHYSICAL AP'S POSITION The following image shows the approximate positions within the First floor area of all access points identified during the site survey. These positions are manually configured, or otherwise are automatically estimated based on the measured data.
Physical AP's Position for First floor Location
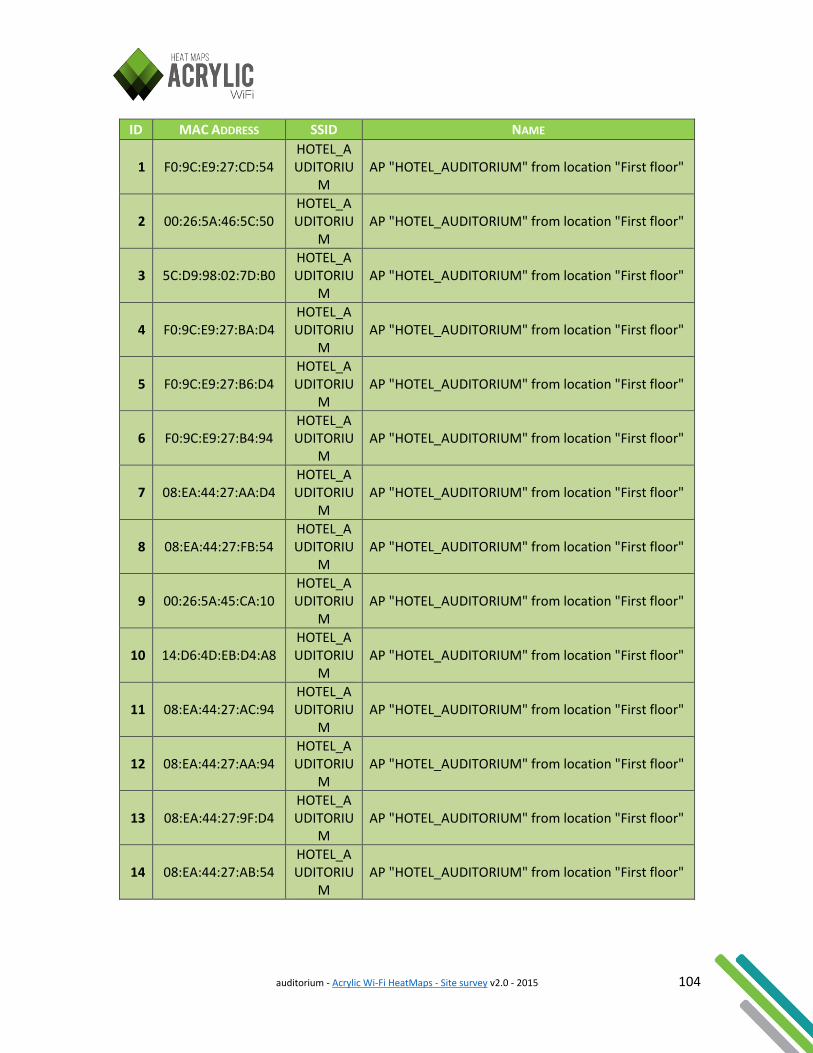
auditorium - Acrylic Wi-Fi HeatMaps - Site survey v2.0 - 2015 104
ID MAC ADDRESS SSID NAME
1 F0:9C:E9:27:CD:54 HOTEL_AUDITORIU
M AP "HOTEL_AUDITORIUM" from location "First floor"
2 00:26:5A:46:5C:50 HOTEL_AUDITORIU
M AP "HOTEL_AUDITORIUM" from location "First floor"
3 5C:D9:98:02:7D:B0 HOTEL_AUDITORIU
M AP "HOTEL_AUDITORIUM" from location "First floor"
4 F0:9C:E9:27:BA:D4 HOTEL_AUDITORIU
M AP "HOTEL_AUDITORIUM" from location "First floor"
5 F0:9C:E9:27:B6:D4 HOTEL_AUDITORIU
M AP "HOTEL_AUDITORIUM" from location "First floor"
6 F0:9C:E9:27:B4:94 HOTEL_AUDITORIU
M AP "HOTEL_AUDITORIUM" from location "First floor"
7 08:EA:44:27:AA:D4 HOTEL_AUDITORIU
M AP "HOTEL_AUDITORIUM" from location "First floor"
8 08:EA:44:27:FB:54 HOTEL_AUDITORIU
M AP "HOTEL_AUDITORIUM" from location "First floor"
9 00:26:5A:45:CA:10 HOTEL_AUDITORIU
M AP "HOTEL_AUDITORIUM" from location "First floor"
10 14:D6:4D:EB:D4:A8 HOTEL_AUDITORIU
M AP "HOTEL_AUDITORIUM" from location "First floor"
11 08:EA:44:27:AC:94 HOTEL_AUDITORIU
M AP "HOTEL_AUDITORIUM" from location "First floor"
12 08:EA:44:27:AA:94 HOTEL_AUDITORIU
M AP "HOTEL_AUDITORIUM" from location "First floor"
13 08:EA:44:27:9F:D4 HOTEL_AUDITORIU
M AP "HOTEL_AUDITORIUM" from location "First floor"
14 08:EA:44:27:AB:54 HOTEL_AUDITORIU
M AP "HOTEL_AUDITORIUM" from location "First floor"
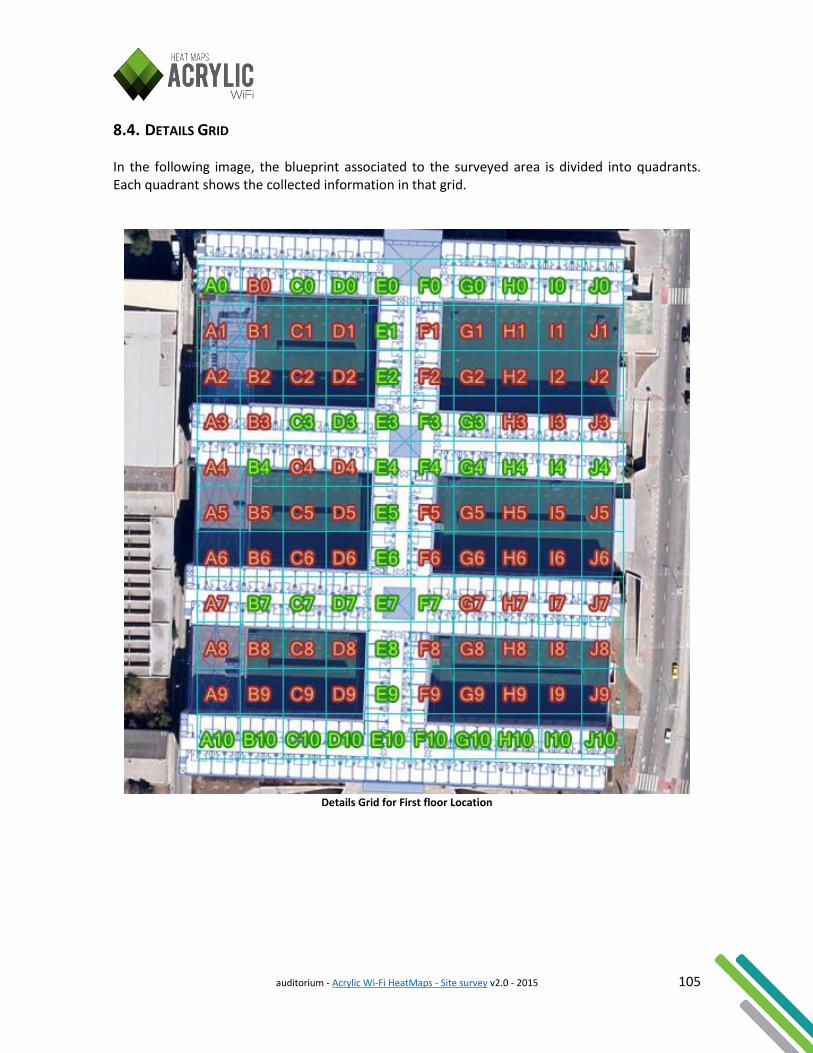
auditorium - Acrylic Wi-Fi HeatMaps - Site survey v2.0 - 2015 105
8.4. DETAILS GRID In the following image, the blueprint associated to the surveyed area is divided into quadrants. Each quadrant shows the collected information in that grid.
Details Grid for First floor Location

auditorium - Acrylic Wi-Fi HeatMaps - Site survey v2.0 - 2015 106
A0
Number of Survey Points 3
Best Signal (Rssi) -84
Average Signal (Rssi) -84.00
Networks (SSID's) HOTEL_AUDITORIUM
Number of Access Points 1
Data Rates (Max) 130
Number of connected devices 0
Retries (%) 0/1 (0.00%)
C0
Number of Survey Points 4
Best Signal (Rssi) -70
Average Signal (Rssi) -73.78
Networks (SSID's) HOTEL_AUDITORIUM
Number of Access Points 2
Data Rates (Max) 130
Number of connected devices 0
Retries (%) 8/18 (44.00%)
D0
Number of Survey Points 4
Best Signal (Rssi) -66
Average Signal (Rssi) -74.46
Networks (SSID's) HOTEL_AUDITORIUM
Number of Access Points 4
Data Rates (Max) 130
Number of connected devices 0
Retries (%) 0/13 (0.00%)
E0
Number of Survey Points 9
Best Signal (Rssi) -59
Average Signal (Rssi) -70.10
Networks (SSID's) HOTEL_AUDITORIUM
Number of Access Points 4
Data Rates (Max) 130
Number of connected devices 0
Retries (%) 3/52 (5.00%)
F0
Number of Survey Points 8
Best Signal (Rssi) -48
Average Signal (Rssi) -66.34
Networks (SSID's) HOTEL_AUDITORIUM

auditorium - Acrylic Wi-Fi HeatMaps - Site survey v2.0 - 2015 107
Number of Access Points 3
Data Rates (Max) 130
Number of connected devices 0
Retries (%) 3/47 (6.00%)
G0
Number of Survey Points 4
Best Signal (Rssi) -44
Average Signal (Rssi) -63.17
Networks (SSID's) HOTEL_AUDITORIUM
Number of Access Points 2
Data Rates (Max) 130
Number of connected devices 0
Retries (%) 0/24 (0.00%)
H0
Number of Survey Points 4
Best Signal (Rssi) -67
Average Signal (Rssi) -74.14
Networks (SSID's) HOTEL_AUDITORIUM
Number of Access Points 2
Data Rates (Max) 130
Number of connected devices 0
Retries (%) 0/21 (0.00%)
I0
Number of Survey Points 6
Best Signal (Rssi) -64
Average Signal (Rssi) -73.32
Networks (SSID's) HOTEL_AUDITORIUM
Number of Access Points 4
Data Rates (Max) 130
Number of connected devices 0
Retries (%) 0/37 (0.00%)
E1
Number of Survey Points 5
Best Signal (Rssi) -75
Average Signal (Rssi) -78.00
Networks (SSID's) HOTEL_AUDITORIUM
Number of Access Points 2
Data Rates (Max) 130
Number of connected devices 0
Retries (%) 0/5 (0.00%)
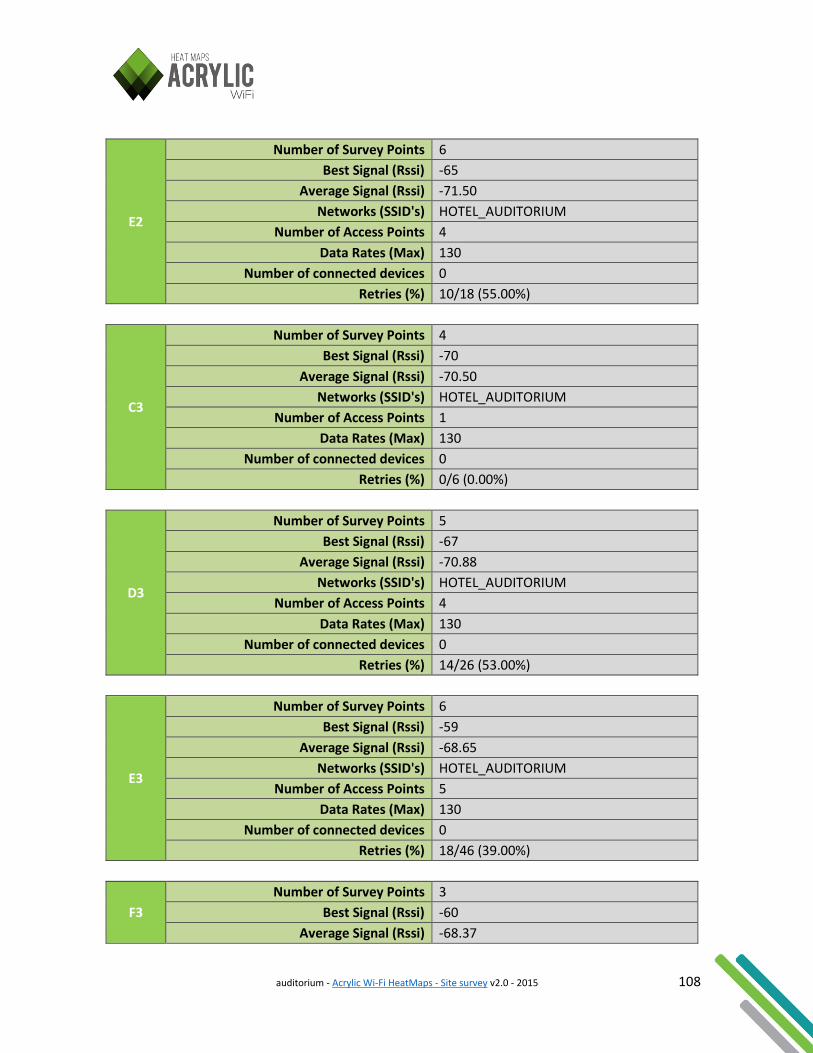
auditorium - Acrylic Wi-Fi HeatMaps - Site survey v2.0 - 2015 108
E2
Number of Survey Points 6
Best Signal (Rssi) -65
Average Signal (Rssi) -71.50
Networks (SSID's) HOTEL_AUDITORIUM
Number of Access Points 4
Data Rates (Max) 130
Number of connected devices 0
Retries (%) 10/18 (55.00%)
C3
Number of Survey Points 4
Best Signal (Rssi) -70
Average Signal (Rssi) -70.50
Networks (SSID's) HOTEL_AUDITORIUM
Number of Access Points 1
Data Rates (Max) 130
Number of connected devices 0
Retries (%) 0/6 (0.00%)
D3
Number of Survey Points 5
Best Signal (Rssi) -67
Average Signal (Rssi) -70.88
Networks (SSID's) HOTEL_AUDITORIUM
Number of Access Points 4
Data Rates (Max) 130
Number of connected devices 0
Retries (%) 14/26 (53.00%)
E3
Number of Survey Points 6
Best Signal (Rssi) -59
Average Signal (Rssi) -68.65
Networks (SSID's) HOTEL_AUDITORIUM
Number of Access Points 5
Data Rates (Max) 130
Number of connected devices 0
Retries (%) 18/46 (39.00%)
F3
Number of Survey Points 3
Best Signal (Rssi) -60
Average Signal (Rssi) -68.37

auditorium - Acrylic Wi-Fi HeatMaps - Site survey v2.0 - 2015 109
Networks (SSID's) HOTEL_AUDITORIUM
Number of Access Points 7
Data Rates (Max) 130
Number of connected devices 0
Retries (%) 43/75 (57.00%)
G3
Number of Survey Points 2
Best Signal (Rssi) -65
Average Signal (Rssi) -72.55
Networks (SSID's) HOTEL_AUDITORIUM
Number of Access Points 2
Data Rates (Max) 130
Number of connected devices 0
Retries (%) 3/11 (27.00%)
B4
Number of Survey Points 3
Best Signal (Rssi) -73
Average Signal (Rssi) -73.67
Networks (SSID's) HOTEL_AUDITORIUM
Number of Access Points 1
Data Rates (Max) 130
Number of connected devices 0
Retries (%) 0/3 (0.00%)
E4
Number of Survey Points 7
Best Signal (Rssi) -65
Average Signal (Rssi) -71.33
Networks (SSID's) HOTEL_AUDITORIUM
Number of Access Points 6
Data Rates (Max) 130
Number of connected devices 0
Retries (%) 80/139 (57.00%)
F4
Number of Survey Points 3
Best Signal (Rssi) -59
Average Signal (Rssi) -68.04
Networks (SSID's) HOTEL_AUDITORIUM
Number of Access Points 5
Data Rates (Max) 130
Number of connected devices 0

auditorium - Acrylic Wi-Fi HeatMaps - Site survey v2.0 - 2015 110
Retries (%) 30/47 (63.00%)
G4
Number of Survey Points 3
Best Signal (Rssi) -47
Average Signal (Rssi) -64.11
Networks (SSID's) HOTEL_AUDITORIUM
Number of Access Points 4
Data Rates (Max) 130
Number of connected devices 0
Retries (%) 1/9 (11.00%)
H4
Number of Survey Points 4
Best Signal (Rssi) -57
Average Signal (Rssi) -68.96
Networks (SSID's) HOTEL_AUDITORIUM
Number of Access Points 4
Data Rates (Max) 130
Number of connected devices 0
Retries (%) 8/24 (33.00%)
I4
Number of Survey Points 4
Best Signal (Rssi) -44
Average Signal (Rssi) -65.06
Networks (SSID's) HOTEL_AUDITORIUM
Number of Access Points 4
Data Rates (Max) 130
Number of connected devices 0
Retries (%) 8/16 (50.00%)
E5
Number of Survey Points 4
Best Signal (Rssi) -64
Average Signal (Rssi) -71.38
Networks (SSID's) HOTEL_AUDITORIUM
Number of Access Points 3
Data Rates (Max) 130
Number of connected devices 0
Retries (%) 5/8 (62.00%)
E6 Number of Survey Points 7
Best Signal (Rssi) -52
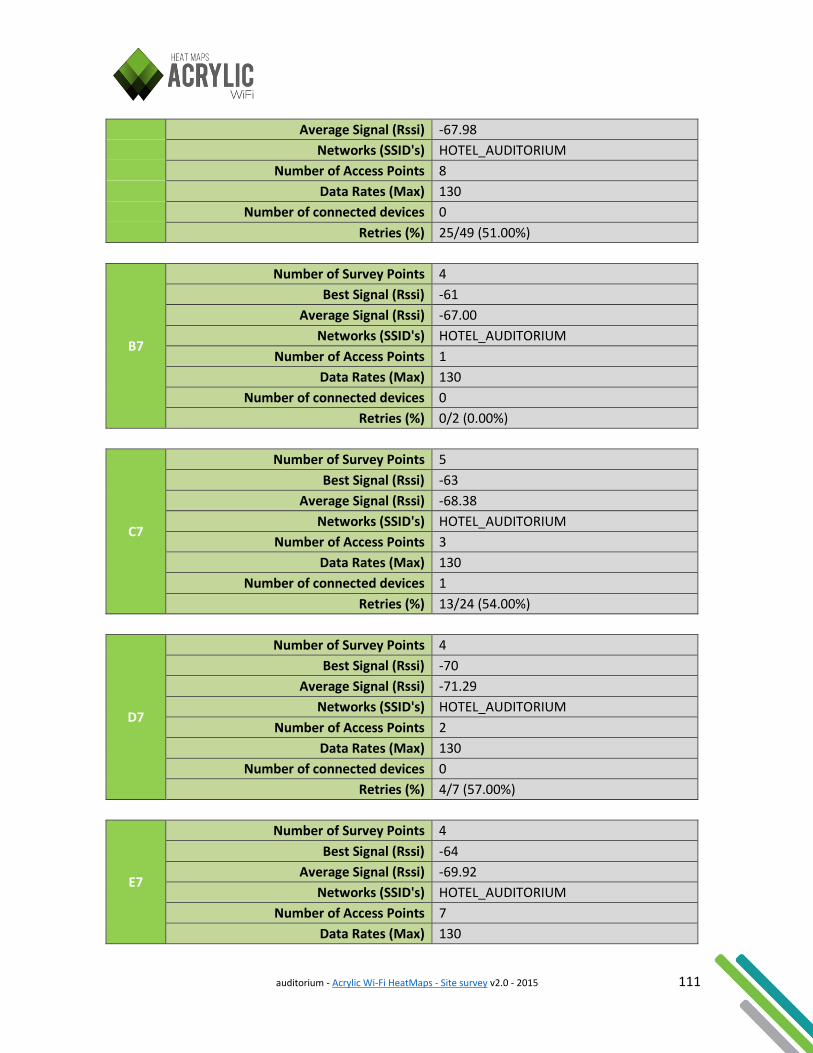
auditorium - Acrylic Wi-Fi HeatMaps - Site survey v2.0 - 2015 111
Average Signal (Rssi) -67.98
Networks (SSID's) HOTEL_AUDITORIUM
Number of Access Points 8
Data Rates (Max) 130
Number of connected devices 0
Retries (%) 25/49 (51.00%)
B7
Number of Survey Points 4
Best Signal (Rssi) -61
Average Signal (Rssi) -67.00
Networks (SSID's) HOTEL_AUDITORIUM
Number of Access Points 1
Data Rates (Max) 130
Number of connected devices 0
Retries (%) 0/2 (0.00%)
C7
Number of Survey Points 5
Best Signal (Rssi) -63
Average Signal (Rssi) -68.38
Networks (SSID's) HOTEL_AUDITORIUM
Number of Access Points 3
Data Rates (Max) 130
Number of connected devices 1
Retries (%) 13/24 (54.00%)
D7
Number of Survey Points 4
Best Signal (Rssi) -70
Average Signal (Rssi) -71.29
Networks (SSID's) HOTEL_AUDITORIUM
Number of Access Points 2
Data Rates (Max) 130
Number of connected devices 0
Retries (%) 4/7 (57.00%)
E7
Number of Survey Points 4
Best Signal (Rssi) -64
Average Signal (Rssi) -69.92
Networks (SSID's) HOTEL_AUDITORIUM
Number of Access Points 7
Data Rates (Max) 130
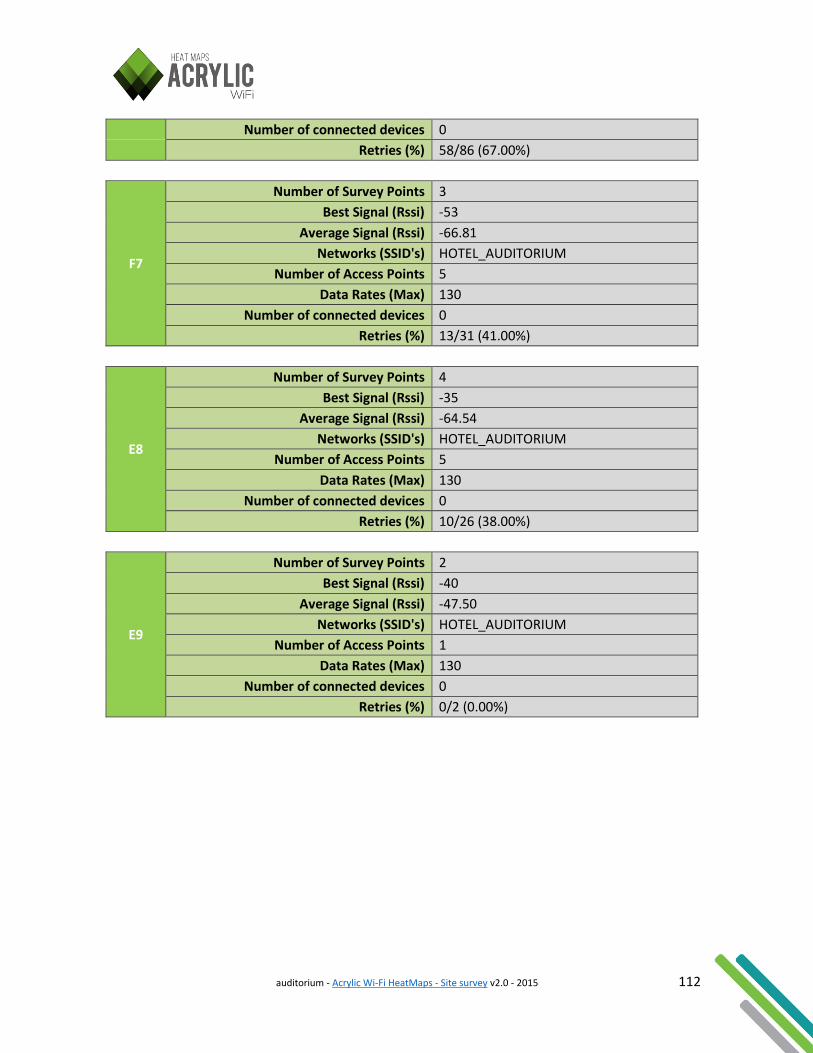
auditorium - Acrylic Wi-Fi HeatMaps - Site survey v2.0 - 2015 112
Number of connected devices 0
Retries (%) 58/86 (67.00%)
F7
Number of Survey Points 3
Best Signal (Rssi) -53
Average Signal (Rssi) -66.81
Networks (SSID's) HOTEL_AUDITORIUM
Number of Access Points 5
Data Rates (Max) 130
Number of connected devices 0
Retries (%) 13/31 (41.00%)
E8
Number of Survey Points 4
Best Signal (Rssi) -35
Average Signal (Rssi) -64.54
Networks (SSID's) HOTEL_AUDITORIUM
Number of Access Points 5
Data Rates (Max) 130
Number of connected devices 0
Retries (%) 10/26 (38.00%)
E9
Number of Survey Points 2
Best Signal (Rssi) -40
Average Signal (Rssi) -47.50
Networks (SSID's) HOTEL_AUDITORIUM
Number of Access Points 1
Data Rates (Max) 130
Number of connected devices 0
Retries (%) 0/2 (0.00%)
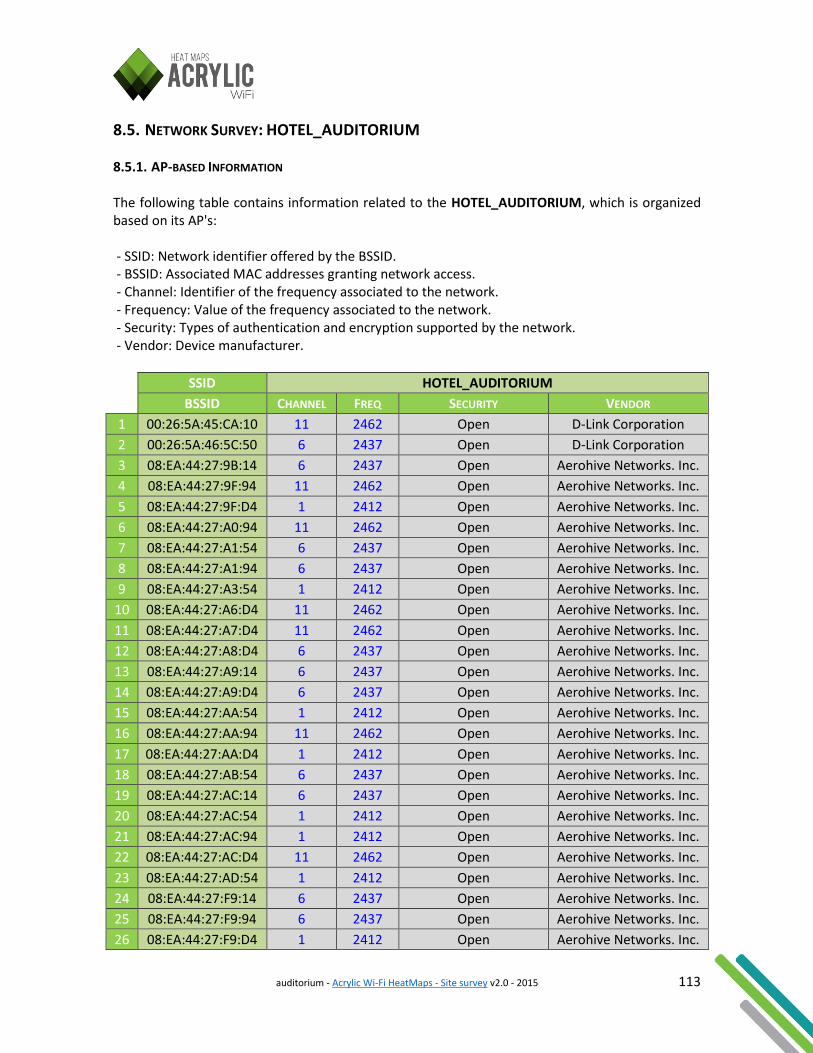
auditorium - Acrylic Wi-Fi HeatMaps - Site survey v2.0 - 2015 113
8.5. NETWORK SURVEY: HOTEL_AUDITORIUM 8.5.1. AP-BASED INFORMATION The following table contains information related to the HOTEL_AUDITORIUM, which is organized based on its AP's: - SSID: Network identifier offered by the BSSID. - BSSID: Associated MAC addresses granting network access. - Channel: Identifier of the frequency associated to the network. - Frequency: Value of the frequency associated to the network. - Security: Types of authentication and encryption supported by the network. - Vendor: Device manufacturer.
SSID HOTEL_AUDITORIUM
BSSID CHANNEL FREQ SECURITY VENDOR
1 00:26:5A:45:CA:10 11 2462 Open D-Link Corporation
2 00:26:5A:46:5C:50 6 2437 Open D-Link Corporation
3 08:EA:44:27:9B:14 6 2437 Open Aerohive Networks. Inc.
4 08:EA:44:27:9F:94 11 2462 Open Aerohive Networks. Inc.
5 08:EA:44:27:9F:D4 1 2412 Open Aerohive Networks. Inc.
6 08:EA:44:27:A0:94 11 2462 Open Aerohive Networks. Inc.
7 08:EA:44:27:A1:54 6 2437 Open Aerohive Networks. Inc.
8 08:EA:44:27:A1:94 6 2437 Open Aerohive Networks. Inc.
9 08:EA:44:27:A3:54 1 2412 Open Aerohive Networks. Inc.
10 08:EA:44:27:A6:D4 11 2462 Open Aerohive Networks. Inc.
11 08:EA:44:27:A7:D4 11 2462 Open Aerohive Networks. Inc.
12 08:EA:44:27:A8:D4 6 2437 Open Aerohive Networks. Inc.
13 08:EA:44:27:A9:14 6 2437 Open Aerohive Networks. Inc.
14 08:EA:44:27:A9:D4 6 2437 Open Aerohive Networks. Inc.
15 08:EA:44:27:AA:54 1 2412 Open Aerohive Networks. Inc.
16 08:EA:44:27:AA:94 11 2462 Open Aerohive Networks. Inc.
17 08:EA:44:27:AA:D4 1 2412 Open Aerohive Networks. Inc.
18 08:EA:44:27:AB:54 6 2437 Open Aerohive Networks. Inc.
19 08:EA:44:27:AC:14 6 2437 Open Aerohive Networks. Inc.
20 08:EA:44:27:AC:54 1 2412 Open Aerohive Networks. Inc.
21 08:EA:44:27:AC:94 1 2412 Open Aerohive Networks. Inc.
22 08:EA:44:27:AC:D4 11 2462 Open Aerohive Networks. Inc.
23 08:EA:44:27:AD:54 1 2412 Open Aerohive Networks. Inc.
24 08:EA:44:27:F9:14 6 2437 Open Aerohive Networks. Inc.
25 08:EA:44:27:F9:94 6 2437 Open Aerohive Networks. Inc.
26 08:EA:44:27:F9:D4 1 2412 Open Aerohive Networks. Inc.
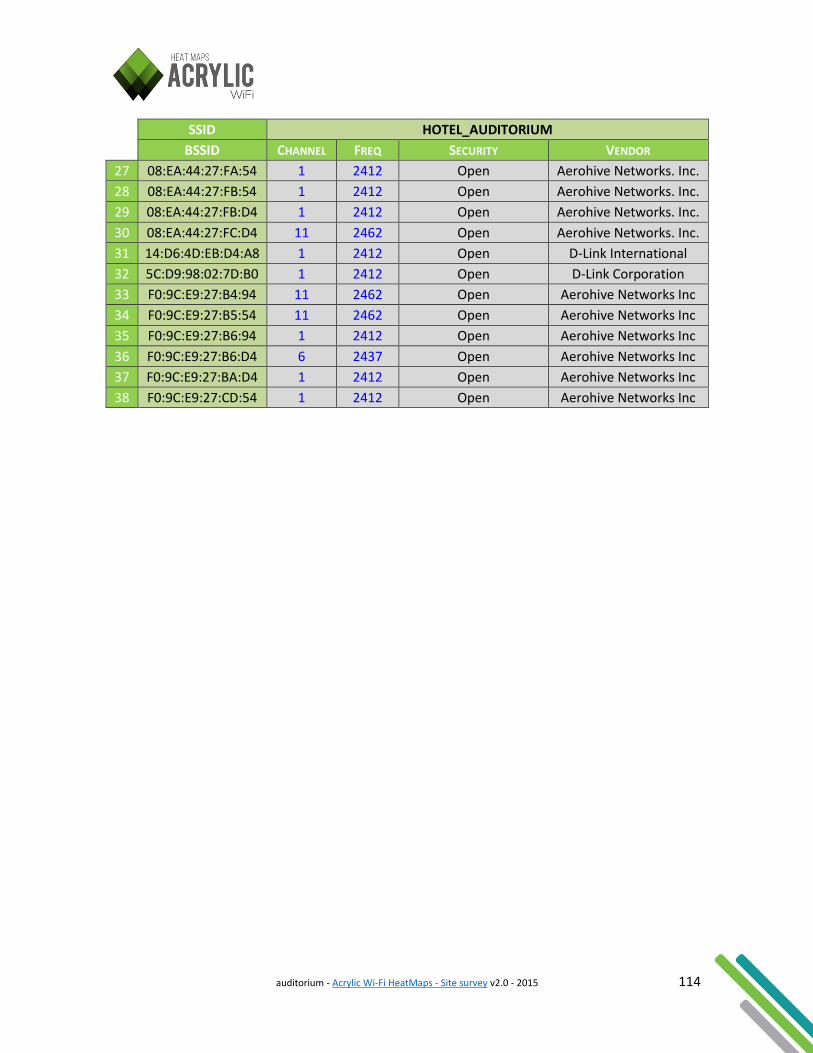
auditorium - Acrylic Wi-Fi HeatMaps - Site survey v2.0 - 2015 114
SSID HOTEL_AUDITORIUM
BSSID CHANNEL FREQ SECURITY VENDOR
27 08:EA:44:27:FA:54 1 2412 Open Aerohive Networks. Inc.
28 08:EA:44:27:FB:54 1 2412 Open Aerohive Networks. Inc.
29 08:EA:44:27:FB:D4 1 2412 Open Aerohive Networks. Inc.
30 08:EA:44:27:FC:D4 11 2462 Open Aerohive Networks. Inc.
31 14:D6:4D:EB:D4:A8 1 2412 Open D-Link International
32 5C:D9:98:02:7D:B0 1 2412 Open D-Link Corporation
33 F0:9C:E9:27:B4:94 11 2462 Open Aerohive Networks Inc
34 F0:9C:E9:27:B5:54 11 2462 Open Aerohive Networks Inc
35 F0:9C:E9:27:B6:94 1 2412 Open Aerohive Networks Inc
36 F0:9C:E9:27:B6:D4 6 2437 Open Aerohive Networks Inc
37 F0:9C:E9:27:BA:D4 1 2412 Open Aerohive Networks Inc
38 F0:9C:E9:27:CD:54 1 2412 Open Aerohive Networks Inc
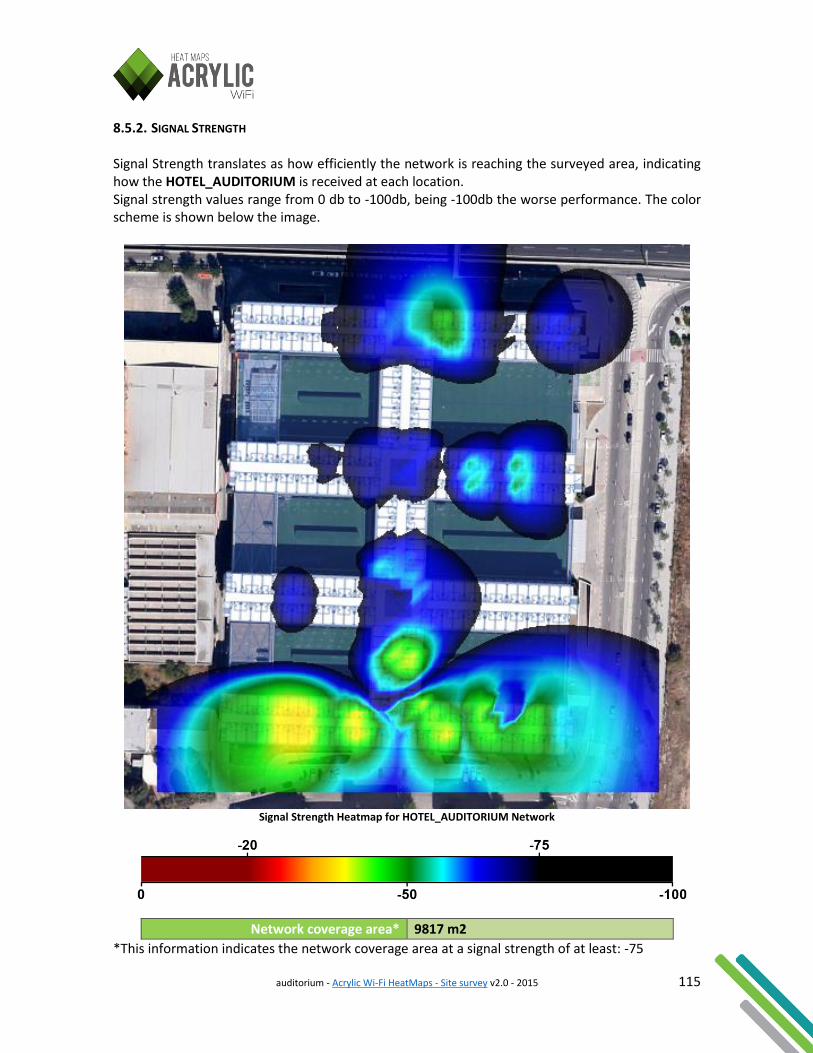
auditorium - Acrylic Wi-Fi HeatMaps - Site survey v2.0 - 2015 115
8.5.2. SIGNAL STRENGTH Signal Strength translates as how efficiently the network is reaching the surveyed area, indicating how the HOTEL_AUDITORIUM is received at each location. Signal strength values range from 0 db to -100db, being -100db the worse performance. The color scheme is shown below the image.
Signal Strength Heatmap for HOTEL_AUDITORIUM Network
Network coverage area* 9817 m2
*This information indicates the network coverage area at a signal strength of at least: -75
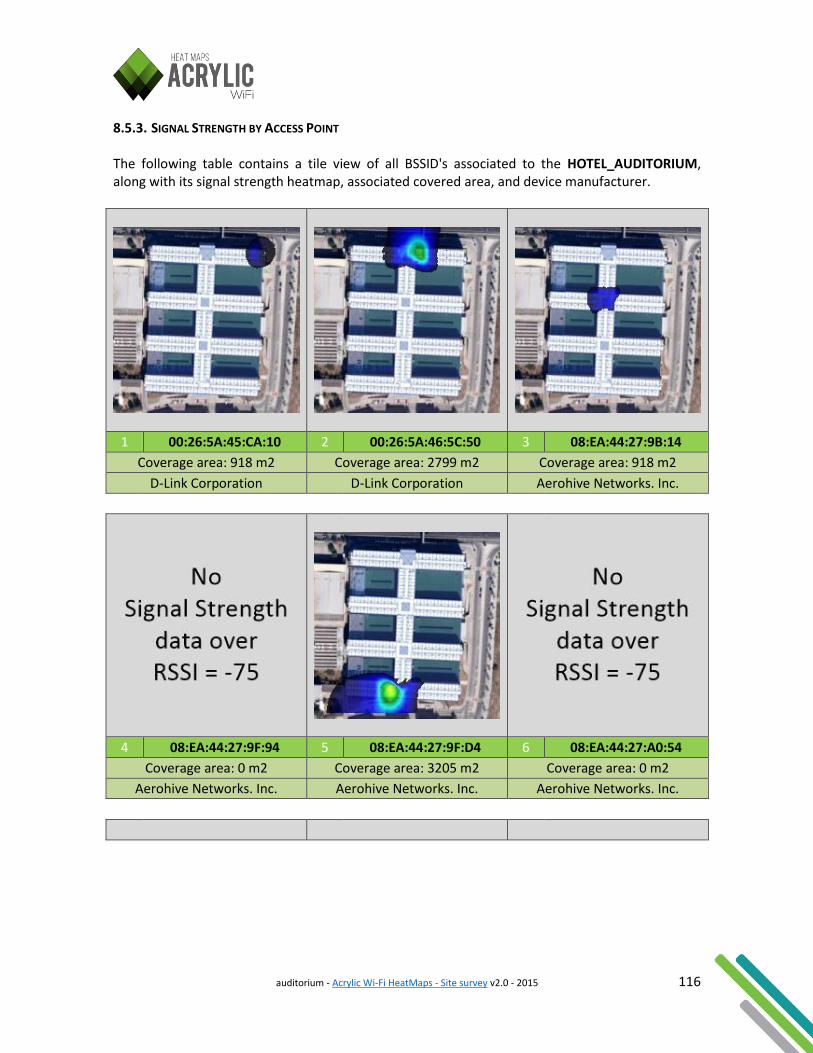
auditorium - Acrylic Wi-Fi HeatMaps - Site survey v2.0 - 2015 116
8.5.3. SIGNAL STRENGTH BY ACCESS POINT The following table contains a tile view of all BSSID's associated to the HOTEL_AUDITORIUM, along with its signal strength heatmap, associated covered area, and device manufacturer.
1 00:26:5A:45:CA:10 2 00:26:5A:46:5C:50 3 08:EA:44:27:9B:14
Coverage area: 918 m2 Coverage area: 2799 m2 Coverage area: 918 m2
D-Link Corporation D-Link Corporation Aerohive Networks. Inc.
4 08:EA:44:27:9F:94 5 08:EA:44:27:9F:D4 6 08:EA:44:27:A0:54
Coverage area: 0 m2 Coverage area: 3205 m2 Coverage area: 0 m2
Aerohive Networks. Inc. Aerohive Networks. Inc. Aerohive Networks. Inc.
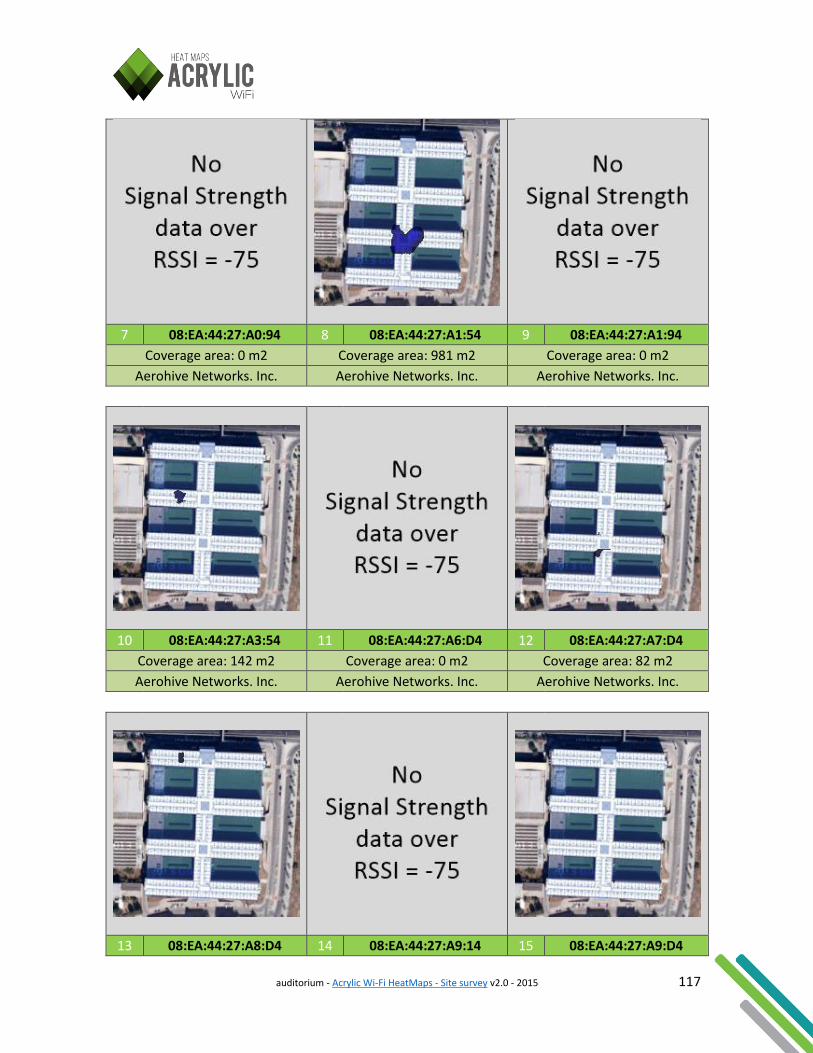
auditorium - Acrylic Wi-Fi HeatMaps - Site survey v2.0 - 2015 117
7 08:EA:44:27:A0:94 8 08:EA:44:27:A1:54 9 08:EA:44:27:A1:94
Coverage area: 0 m2 Coverage area: 981 m2 Coverage area: 0 m2
Aerohive Networks. Inc. Aerohive Networks. Inc. Aerohive Networks. Inc.
10 08:EA:44:27:A3:54 11 08:EA:44:27:A6:D4 12 08:EA:44:27:A7:D4
Coverage area: 142 m2 Coverage area: 0 m2 Coverage area: 82 m2
Aerohive Networks. Inc. Aerohive Networks. Inc. Aerohive Networks. Inc.
13 08:EA:44:27:A8:D4 14 08:EA:44:27:A9:14 15 08:EA:44:27:A9:D4
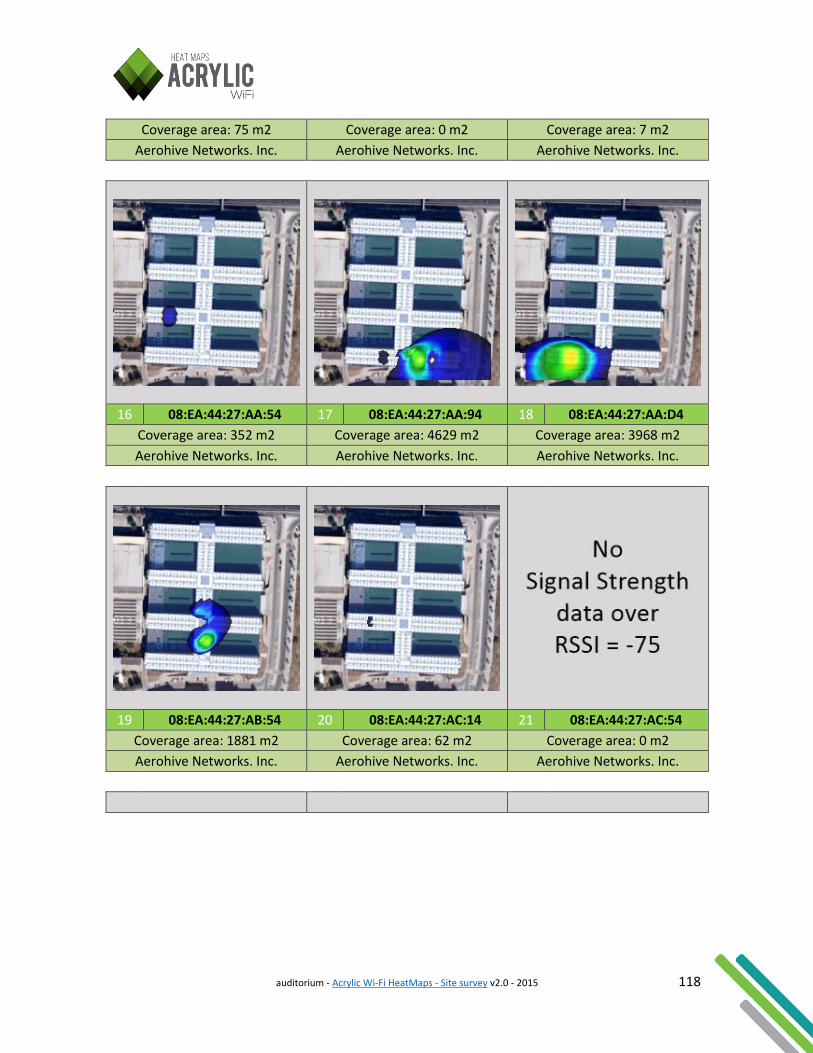
auditorium - Acrylic Wi-Fi HeatMaps - Site survey v2.0 - 2015 118
Coverage area: 75 m2 Coverage area: 0 m2 Coverage area: 7 m2
Aerohive Networks. Inc. Aerohive Networks. Inc. Aerohive Networks. Inc.
16 08:EA:44:27:AA:54 17 08:EA:44:27:AA:94 18 08:EA:44:27:AA:D4
Coverage area: 352 m2 Coverage area: 4629 m2 Coverage area: 3968 m2
Aerohive Networks. Inc. Aerohive Networks. Inc. Aerohive Networks. Inc.
19 08:EA:44:27:AB:54 20 08:EA:44:27:AC:14 21 08:EA:44:27:AC:54
Coverage area: 1881 m2 Coverage area: 62 m2 Coverage area: 0 m2
Aerohive Networks. Inc. Aerohive Networks. Inc. Aerohive Networks. Inc.
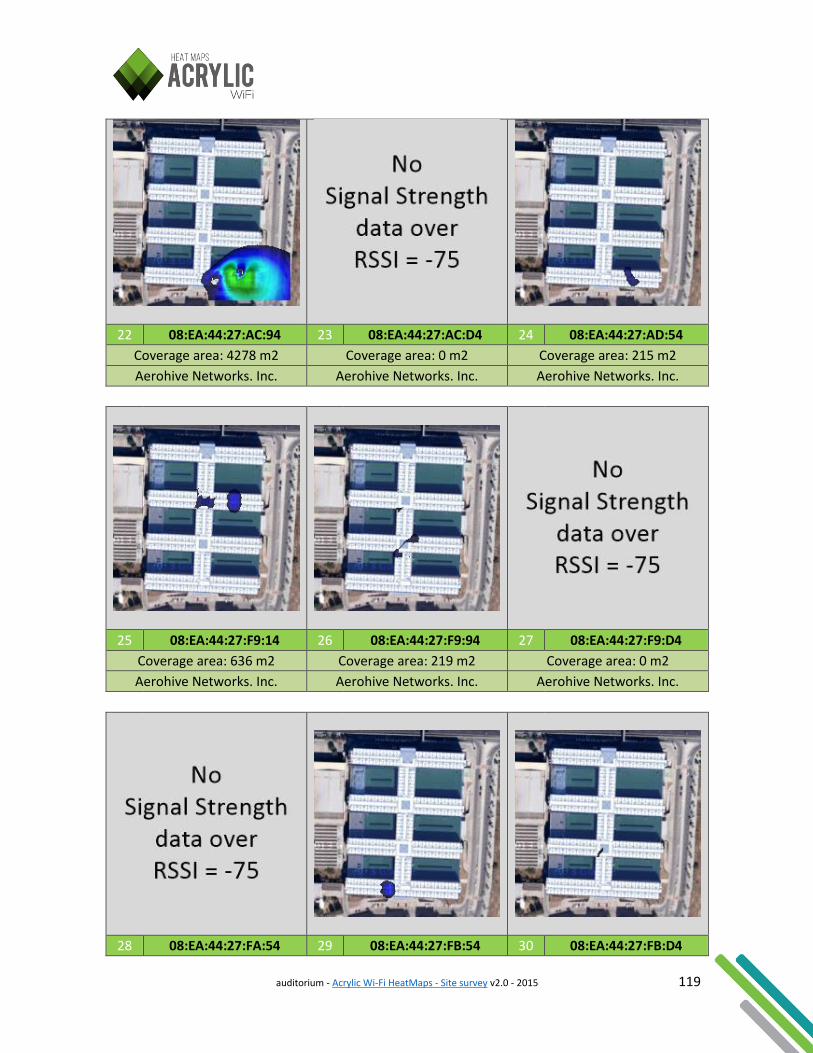
auditorium - Acrylic Wi-Fi HeatMaps - Site survey v2.0 - 2015 119
22 08:EA:44:27:AC:94 23 08:EA:44:27:AC:D4 24 08:EA:44:27:AD:54
Coverage area: 4278 m2 Coverage area: 0 m2 Coverage area: 215 m2
Aerohive Networks. Inc. Aerohive Networks. Inc. Aerohive Networks. Inc.
25 08:EA:44:27:F9:14 26 08:EA:44:27:F9:94 27 08:EA:44:27:F9:D4
Coverage area: 636 m2 Coverage area: 219 m2 Coverage area: 0 m2
Aerohive Networks. Inc. Aerohive Networks. Inc. Aerohive Networks. Inc.
28 08:EA:44:27:FA:54 29 08:EA:44:27:FB:54 30 08:EA:44:27:FB:D4
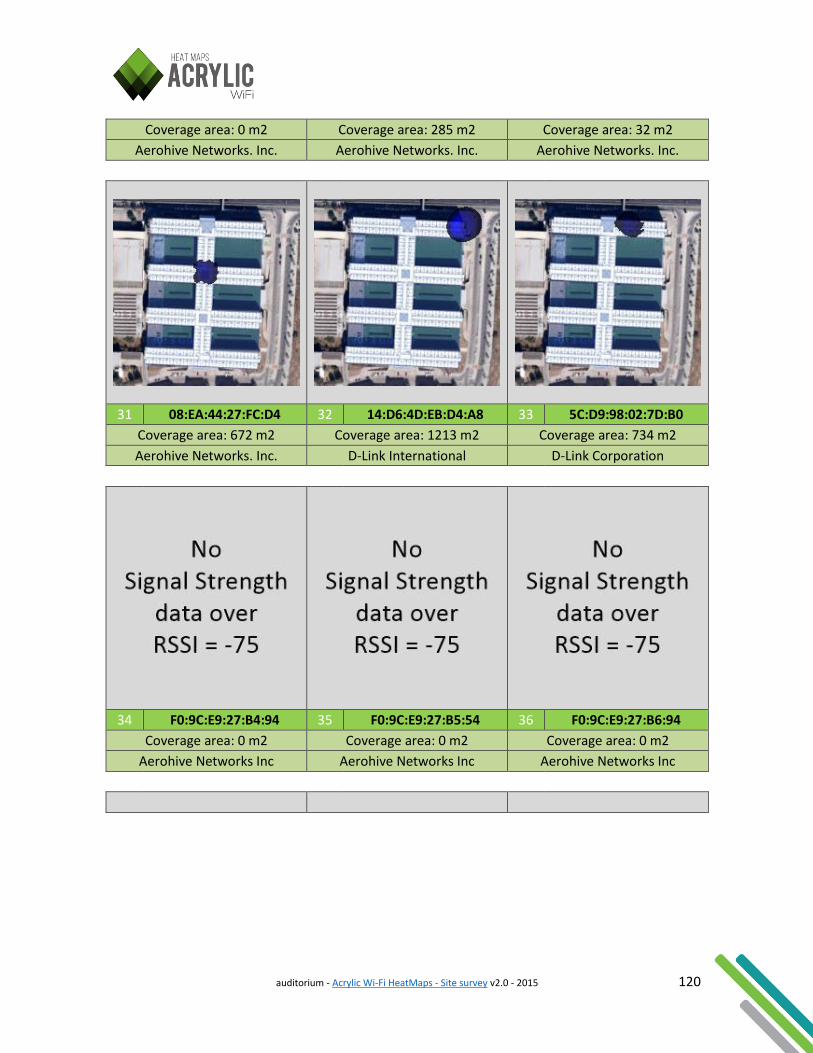
auditorium - Acrylic Wi-Fi HeatMaps - Site survey v2.0 - 2015 120
Coverage area: 0 m2 Coverage area: 285 m2 Coverage area: 32 m2
Aerohive Networks. Inc. Aerohive Networks. Inc. Aerohive Networks. Inc.
31 08:EA:44:27:FC:D4 32 14:D6:4D:EB:D4:A8 33 5C:D9:98:02:7D:B0
Coverage area: 672 m2 Coverage area: 1213 m2 Coverage area: 734 m2
Aerohive Networks. Inc. D-Link International D-Link Corporation
34 F0:9C:E9:27:B4:94 35 F0:9C:E9:27:B5:54 36 F0:9C:E9:27:B6:94
Coverage area: 0 m2 Coverage area: 0 m2 Coverage area: 0 m2
Aerohive Networks Inc Aerohive Networks Inc Aerohive Networks Inc
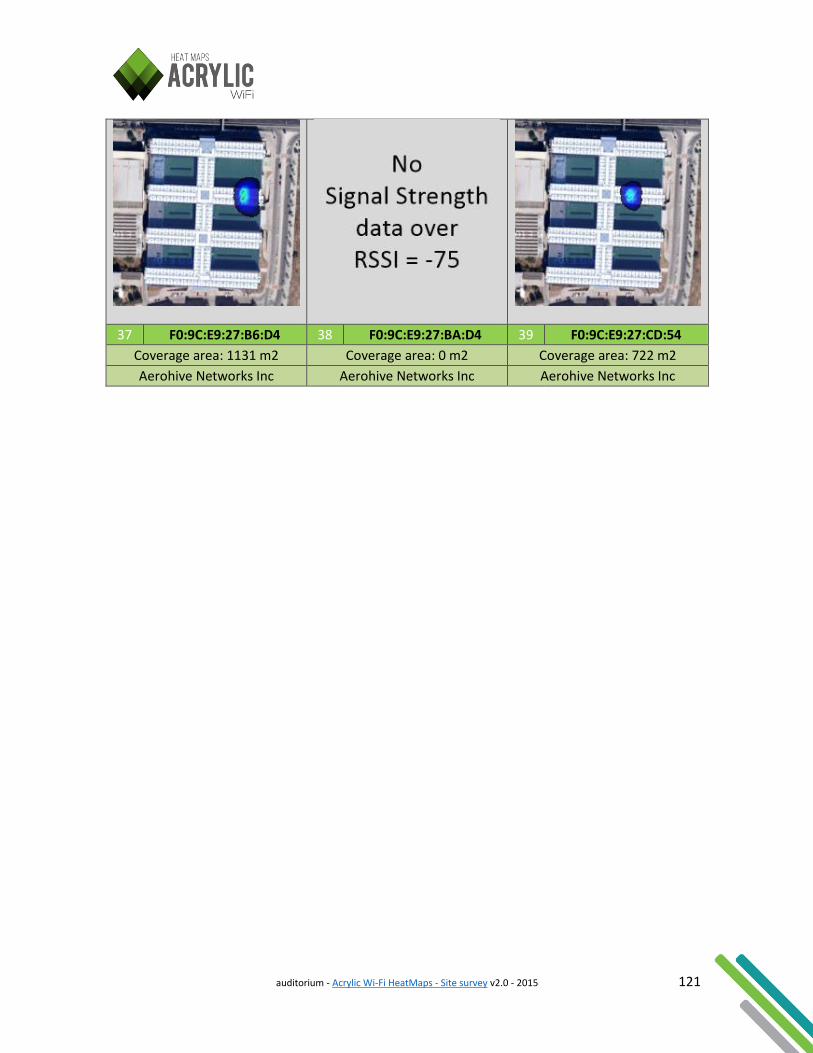
auditorium - Acrylic Wi-Fi HeatMaps - Site survey v2.0 - 2015 121
37 F0:9C:E9:27:B6:D4 38 F0:9C:E9:27:BA:D4 39 F0:9C:E9:27:CD:54
Coverage area: 1131 m2 Coverage area: 0 m2 Coverage area: 722 m2
Aerohive Networks Inc Aerohive Networks Inc Aerohive Networks Inc
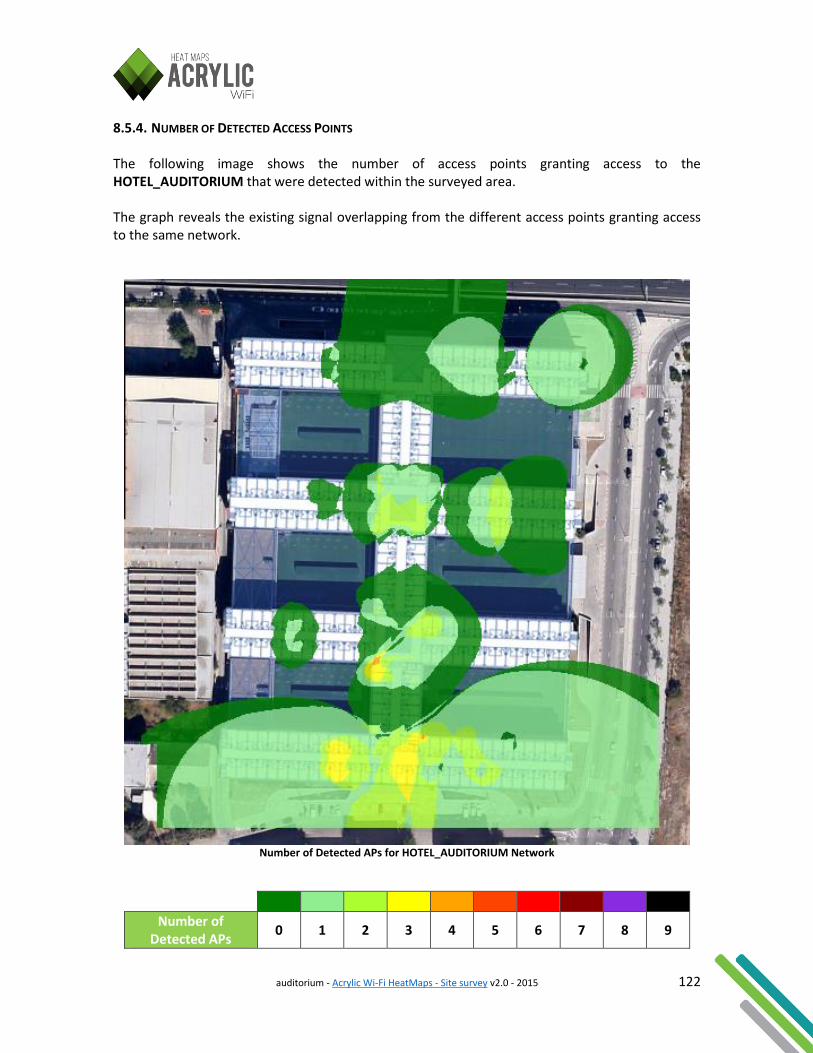
auditorium - Acrylic Wi-Fi HeatMaps - Site survey v2.0 - 2015 122
8.5.4. NUMBER OF DETECTED ACCESS POINTS The following image shows the number of access points granting access to the HOTEL_AUDITORIUM that were detected within the surveyed area. The graph reveals the existing signal overlapping from the different access points granting access to the same network.
Number of Detected APs for HOTEL_AUDITORIUM Network
Number of Detected APs
0 1 2 3 4 5 6 7 8 9
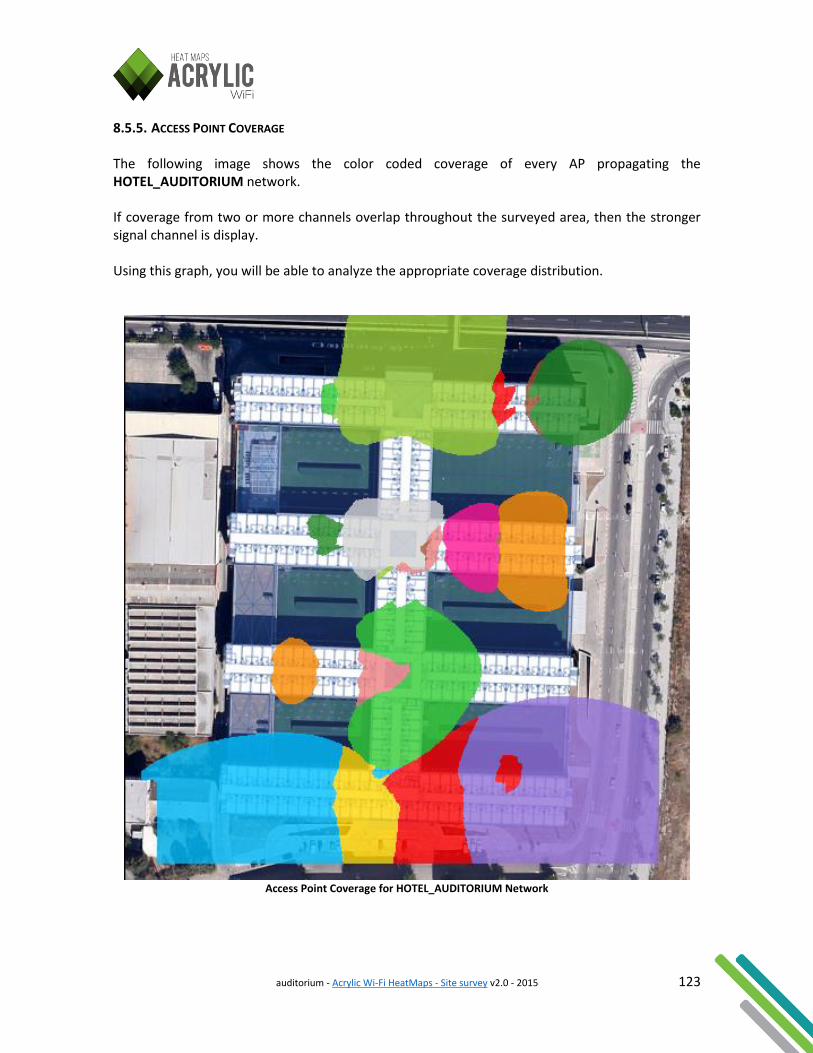
auditorium - Acrylic Wi-Fi HeatMaps - Site survey v2.0 - 2015 123
8.5.5. ACCESS POINT COVERAGE The following image shows the color coded coverage of every AP propagating the HOTEL_AUDITORIUM network. If coverage from two or more channels overlap throughout the surveyed area, then the stronger signal channel is display. Using this graph, you will be able to analyze the appropriate coverage distribution.
Access Point Coverage for HOTEL_AUDITORIUM Network
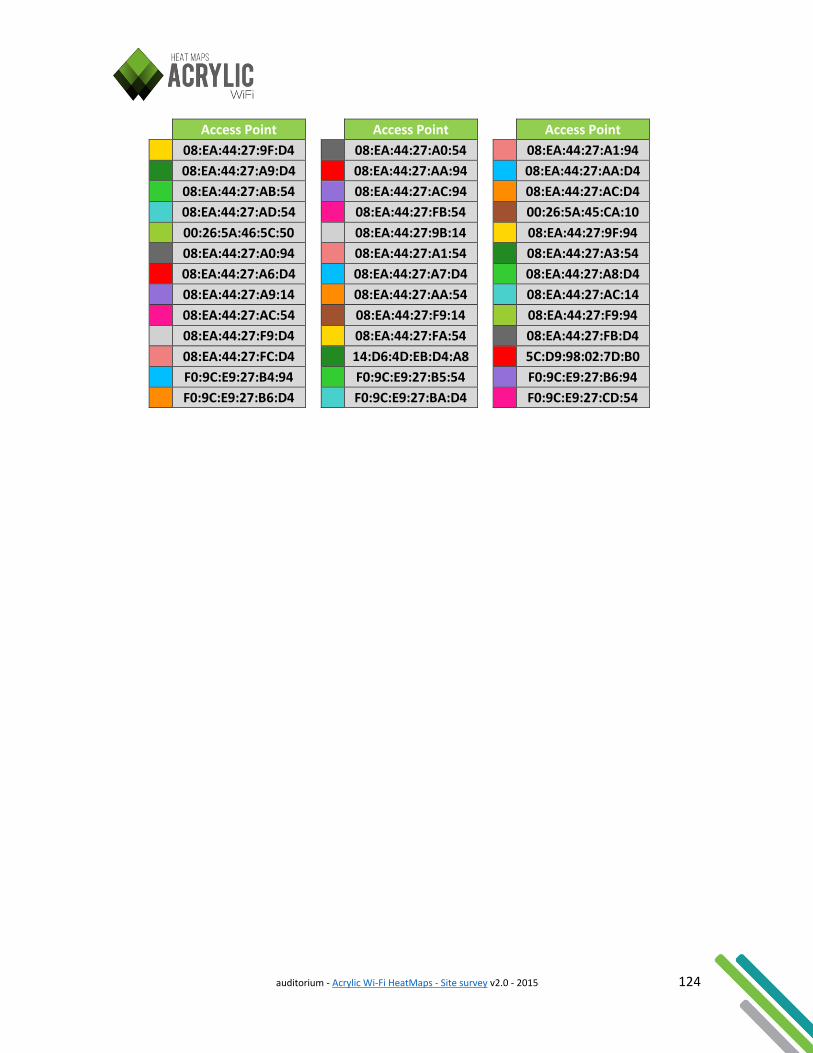
auditorium - Acrylic Wi-Fi HeatMaps - Site survey v2.0 - 2015 124
Access Point Access Point Access Point
08:EA:44:27:9F:D4 08:EA:44:27:A0:54 08:EA:44:27:A1:94
08:EA:44:27:A9:D4 08:EA:44:27:AA:94 08:EA:44:27:AA:D4
08:EA:44:27:AB:54 08:EA:44:27:AC:94 08:EA:44:27:AC:D4
08:EA:44:27:AD:54 08:EA:44:27:FB:54 00:26:5A:45:CA:10
00:26:5A:46:5C:50 08:EA:44:27:9B:14 08:EA:44:27:9F:94
08:EA:44:27:A0:94 08:EA:44:27:A1:54 08:EA:44:27:A3:54
08:EA:44:27:A6:D4 08:EA:44:27:A7:D4 08:EA:44:27:A8:D4
08:EA:44:27:A9:14 08:EA:44:27:AA:54 08:EA:44:27:AC:14
08:EA:44:27:AC:54 08:EA:44:27:F9:14 08:EA:44:27:F9:94
08:EA:44:27:F9:D4 08:EA:44:27:FA:54 08:EA:44:27:FB:D4
08:EA:44:27:FC:D4 14:D6:4D:EB:D4:A8 5C:D9:98:02:7D:B0
F0:9C:E9:27:B4:94 F0:9C:E9:27:B5:54 F0:9C:E9:27:B6:94
F0:9C:E9:27:B6:D4 F0:9C:E9:27:BA:D4 F0:9C:E9:27:CD:54
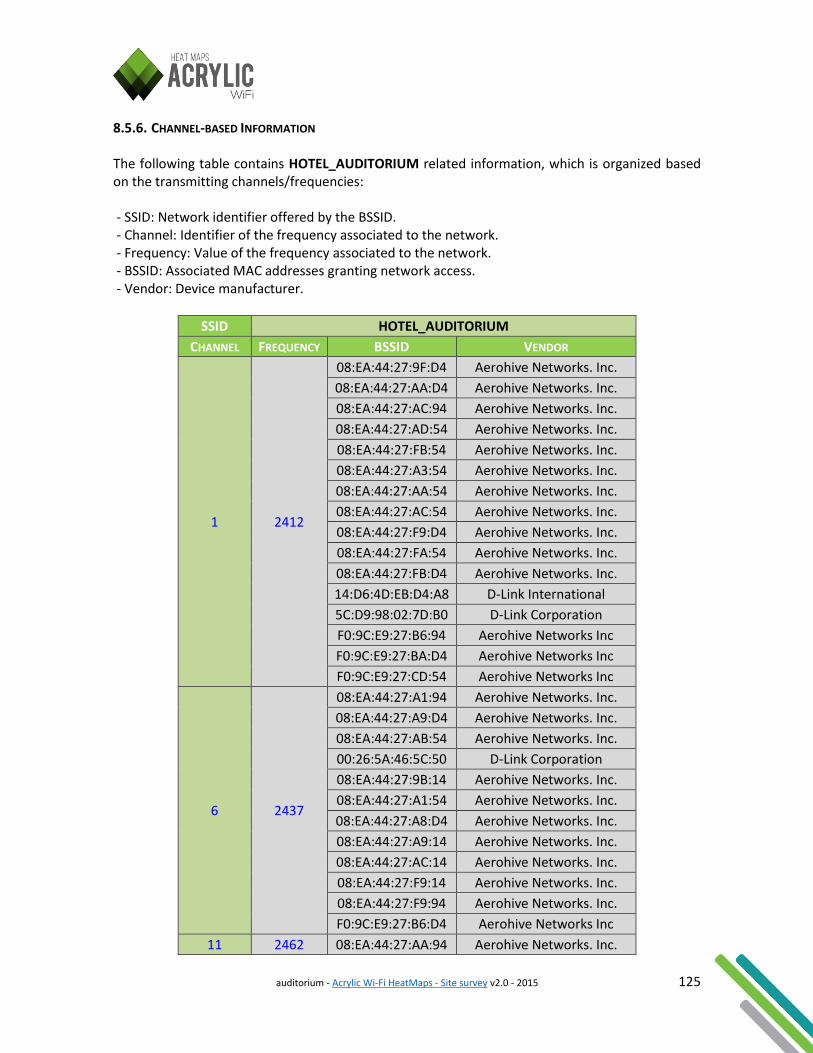
auditorium - Acrylic Wi-Fi HeatMaps - Site survey v2.0 - 2015 125
8.5.6. CHANNEL-BASED INFORMATION The following table contains HOTEL_AUDITORIUM related information, which is organized based on the transmitting channels/frequencies: - SSID: Network identifier offered by the BSSID. - Channel: Identifier of the frequency associated to the network. - Frequency: Value of the frequency associated to the network. - BSSID: Associated MAC addresses granting network access. - Vendor: Device manufacturer.
SSID HOTEL_AUDITORIUM
CHANNEL FREQUENCY BSSID VENDOR
1 2412
08:EA:44:27:9F:D4 Aerohive Networks. Inc.
08:EA:44:27:AA:D4 Aerohive Networks. Inc.
08:EA:44:27:AC:94 Aerohive Networks. Inc.
08:EA:44:27:AD:54 Aerohive Networks. Inc.
08:EA:44:27:FB:54 Aerohive Networks. Inc.
08:EA:44:27:A3:54 Aerohive Networks. Inc.
08:EA:44:27:AA:54 Aerohive Networks. Inc.
08:EA:44:27:AC:54 Aerohive Networks. Inc.
08:EA:44:27:F9:D4 Aerohive Networks. Inc.
08:EA:44:27:FA:54 Aerohive Networks. Inc.
08:EA:44:27:FB:D4 Aerohive Networks. Inc.
14:D6:4D:EB:D4:A8 D-Link International
5C:D9:98:02:7D:B0 D-Link Corporation
F0:9C:E9:27:B6:94 Aerohive Networks Inc
F0:9C:E9:27:BA:D4 Aerohive Networks Inc
F0:9C:E9:27:CD:54 Aerohive Networks Inc
6 2437
08:EA:44:27:A1:94 Aerohive Networks. Inc.
08:EA:44:27:A9:D4 Aerohive Networks. Inc.
08:EA:44:27:AB:54 Aerohive Networks. Inc.
00:26:5A:46:5C:50 D-Link Corporation
08:EA:44:27:9B:14 Aerohive Networks. Inc.
08:EA:44:27:A1:54 Aerohive Networks. Inc.
08:EA:44:27:A8:D4 Aerohive Networks. Inc.
08:EA:44:27:A9:14 Aerohive Networks. Inc.
08:EA:44:27:AC:14 Aerohive Networks. Inc.
08:EA:44:27:F9:14 Aerohive Networks. Inc.
08:EA:44:27:F9:94 Aerohive Networks. Inc.
F0:9C:E9:27:B6:D4 Aerohive Networks Inc
11 2462 08:EA:44:27:AA:94 Aerohive Networks. Inc.
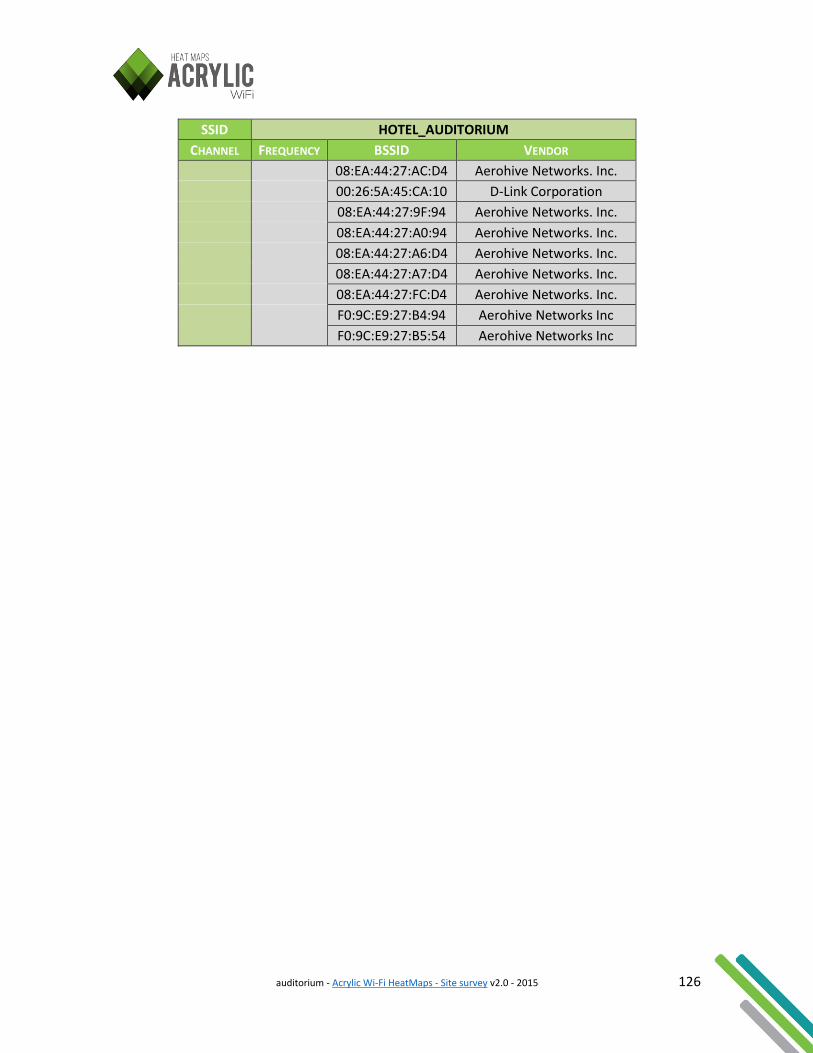
auditorium - Acrylic Wi-Fi HeatMaps - Site survey v2.0 - 2015 126
SSID HOTEL_AUDITORIUM
CHANNEL FREQUENCY BSSID VENDOR
08:EA:44:27:AC:D4 Aerohive Networks. Inc.
00:26:5A:45:CA:10 D-Link Corporation
08:EA:44:27:9F:94 Aerohive Networks. Inc.
08:EA:44:27:A0:94 Aerohive Networks. Inc.
08:EA:44:27:A6:D4 Aerohive Networks. Inc.
08:EA:44:27:A7:D4 Aerohive Networks. Inc.
08:EA:44:27:FC:D4 Aerohive Networks. Inc.
F0:9C:E9:27:B4:94 Aerohive Networks Inc
F0:9C:E9:27:B5:54 Aerohive Networks Inc
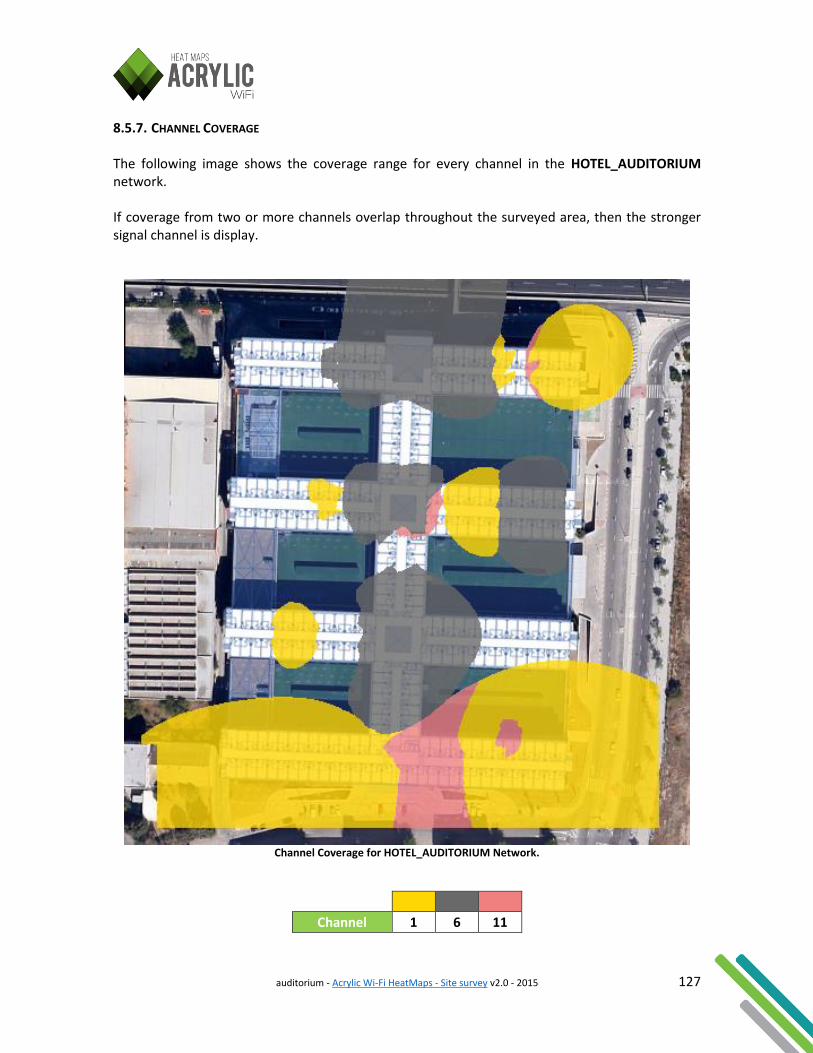
auditorium - Acrylic Wi-Fi HeatMaps - Site survey v2.0 - 2015 127
8.5.7. CHANNEL COVERAGE The following image shows the coverage range for every channel in the HOTEL_AUDITORIUM network. If coverage from two or more channels overlap throughout the surveyed area, then the stronger signal channel is display.
Channel Coverage for HOTEL_AUDITORIUM Network.
Channel 1 6 11
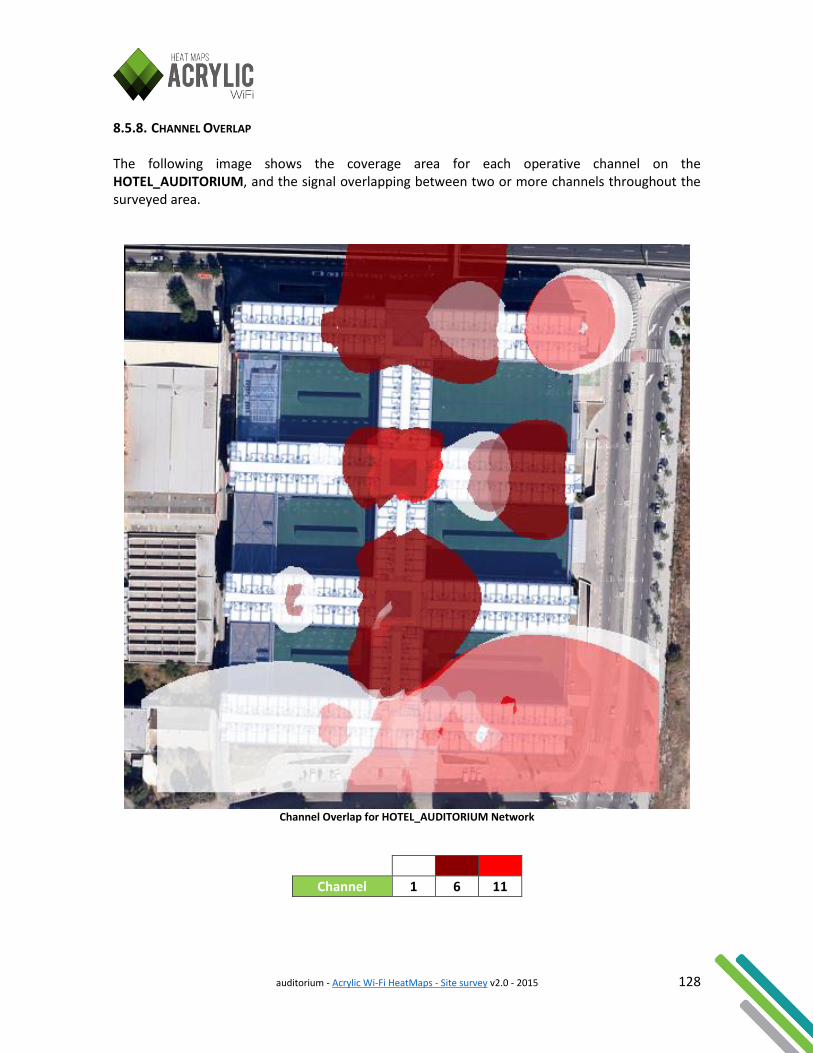
auditorium - Acrylic Wi-Fi HeatMaps - Site survey v2.0 - 2015 128
8.5.8. CHANNEL OVERLAP The following image shows the coverage area for each operative channel on the HOTEL_AUDITORIUM, and the signal overlapping between two or more channels throughout the surveyed area.
Channel Overlap for HOTEL_AUDITORIUM Network
Channel 1 6 11
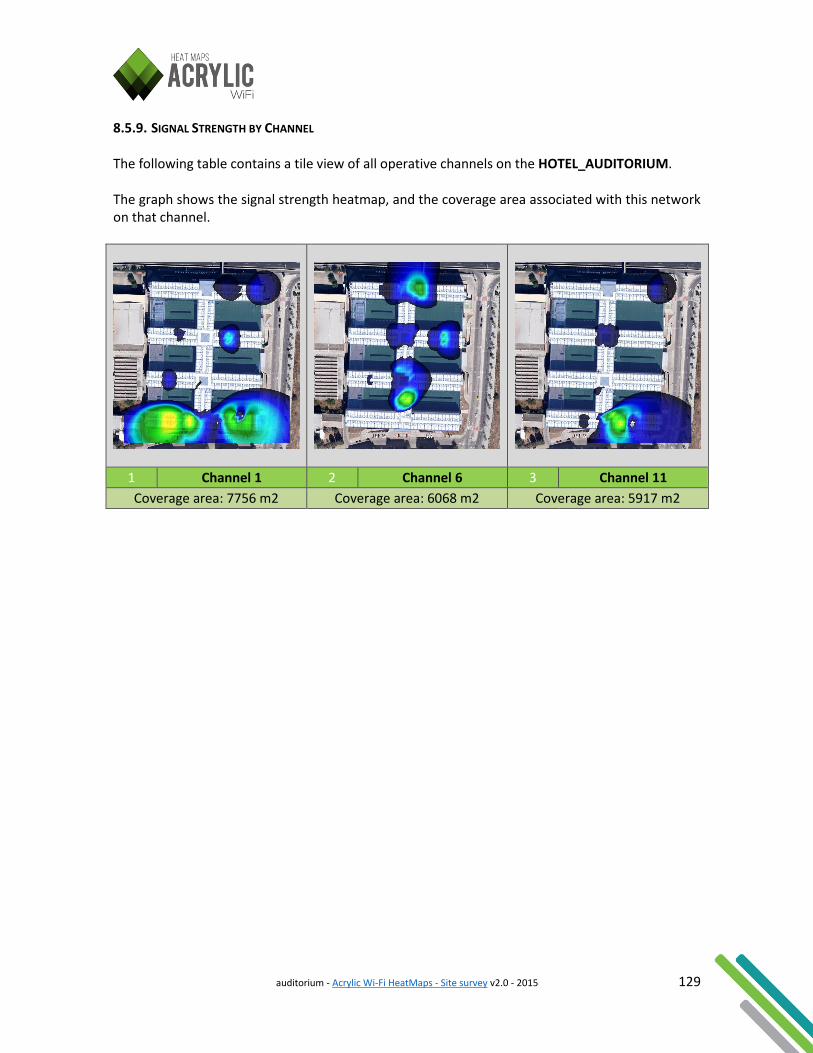
auditorium - Acrylic Wi-Fi HeatMaps - Site survey v2.0 - 2015 129
8.5.9. SIGNAL STRENGTH BY CHANNEL The following table contains a tile view of all operative channels on the HOTEL_AUDITORIUM. The graph shows the signal strength heatmap, and the coverage area associated with this network on that channel.
1 Channel 1 2 Channel 6 3 Channel 11
Coverage area: 7756 m2 Coverage area: 6068 m2 Coverage area: 5917 m2
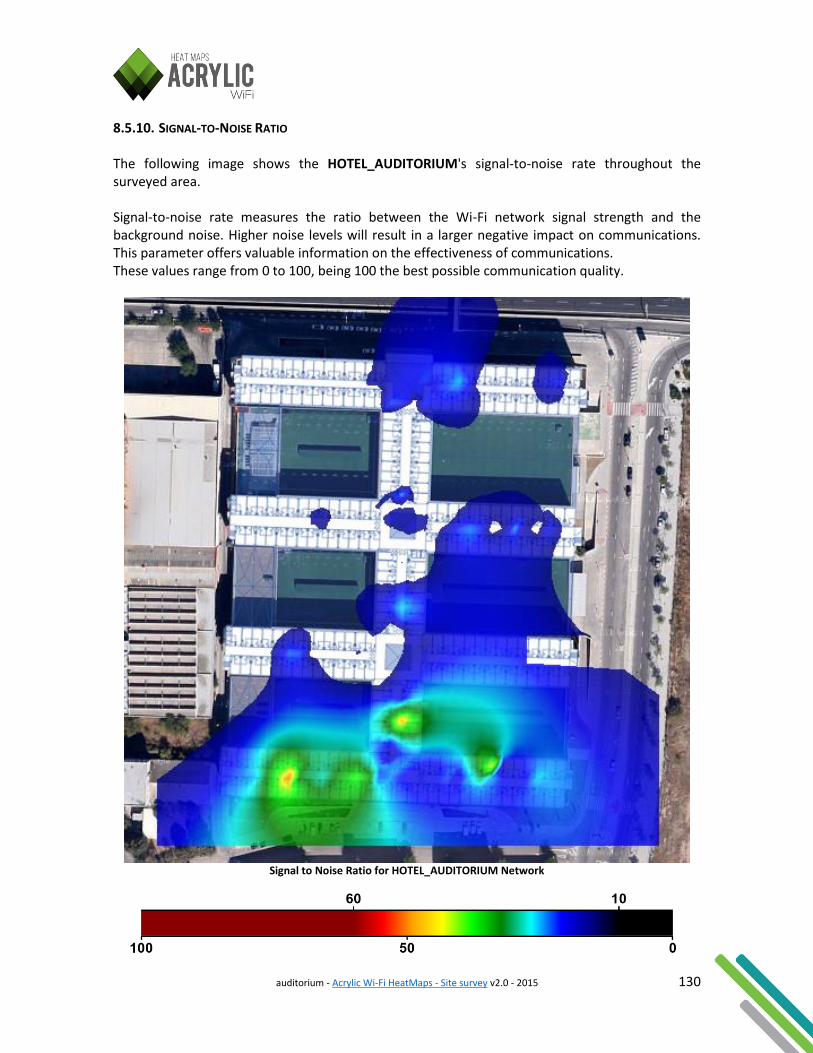
auditorium - Acrylic Wi-Fi HeatMaps - Site survey v2.0 - 2015 130
8.5.10. SIGNAL-TO-NOISE RATIO The following image shows the HOTEL_AUDITORIUM's signal-to-noise rate throughout the surveyed area. Signal-to-noise rate measures the ratio between the Wi-Fi network signal strength and the background noise. Higher noise levels will result in a larger negative impact on communications. This parameter offers valuable information on the effectiveness of communications. These values range from 0 to 100, being 100 the best possible communication quality.
Signal to Noise Ratio for HOTEL_AUDITORIUM Network
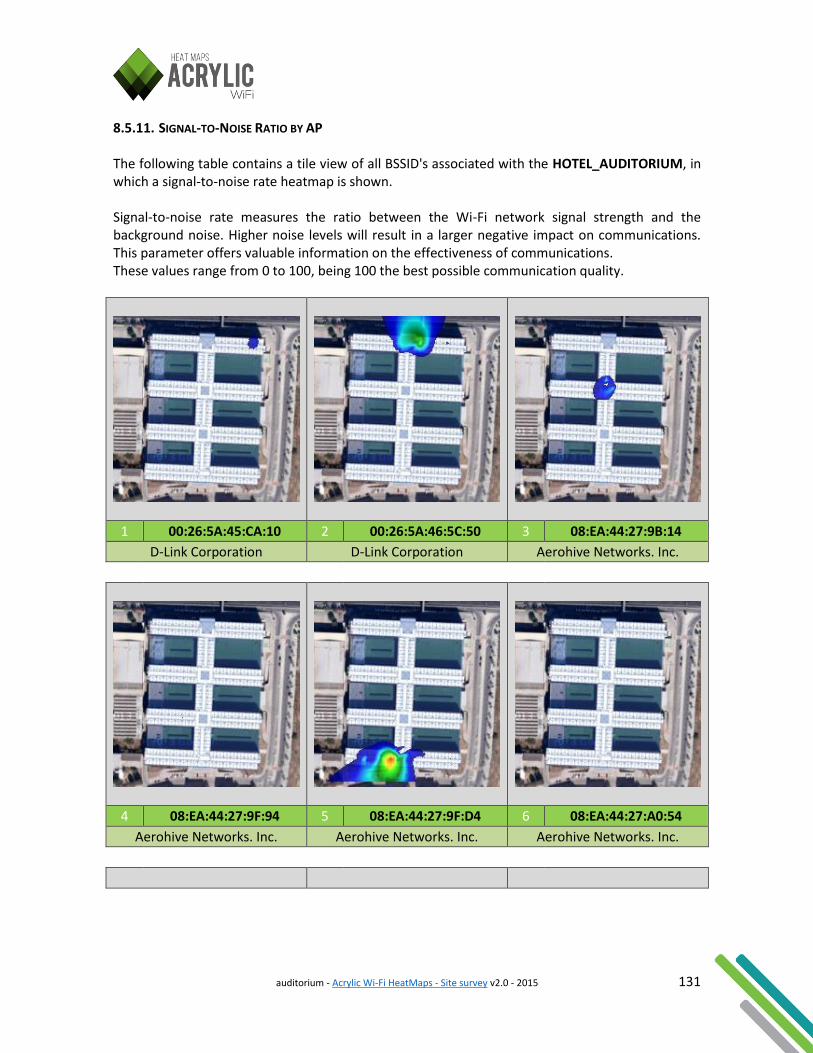
auditorium - Acrylic Wi-Fi HeatMaps - Site survey v2.0 - 2015 131
8.5.11. SIGNAL-TO-NOISE RATIO BY AP The following table contains a tile view of all BSSID's associated with the HOTEL_AUDITORIUM, in which a signal-to-noise rate heatmap is shown. Signal-to-noise rate measures the ratio between the Wi-Fi network signal strength and the background noise. Higher noise levels will result in a larger negative impact on communications. This parameter offers valuable information on the effectiveness of communications. These values range from 0 to 100, being 100 the best possible communication quality.
1 00:26:5A:45:CA:10 2 00:26:5A:46:5C:50 3 08:EA:44:27:9B:14
D-Link Corporation D-Link Corporation Aerohive Networks. Inc.
4 08:EA:44:27:9F:94 5 08:EA:44:27:9F:D4 6 08:EA:44:27:A0:54
Aerohive Networks. Inc. Aerohive Networks. Inc. Aerohive Networks. Inc.
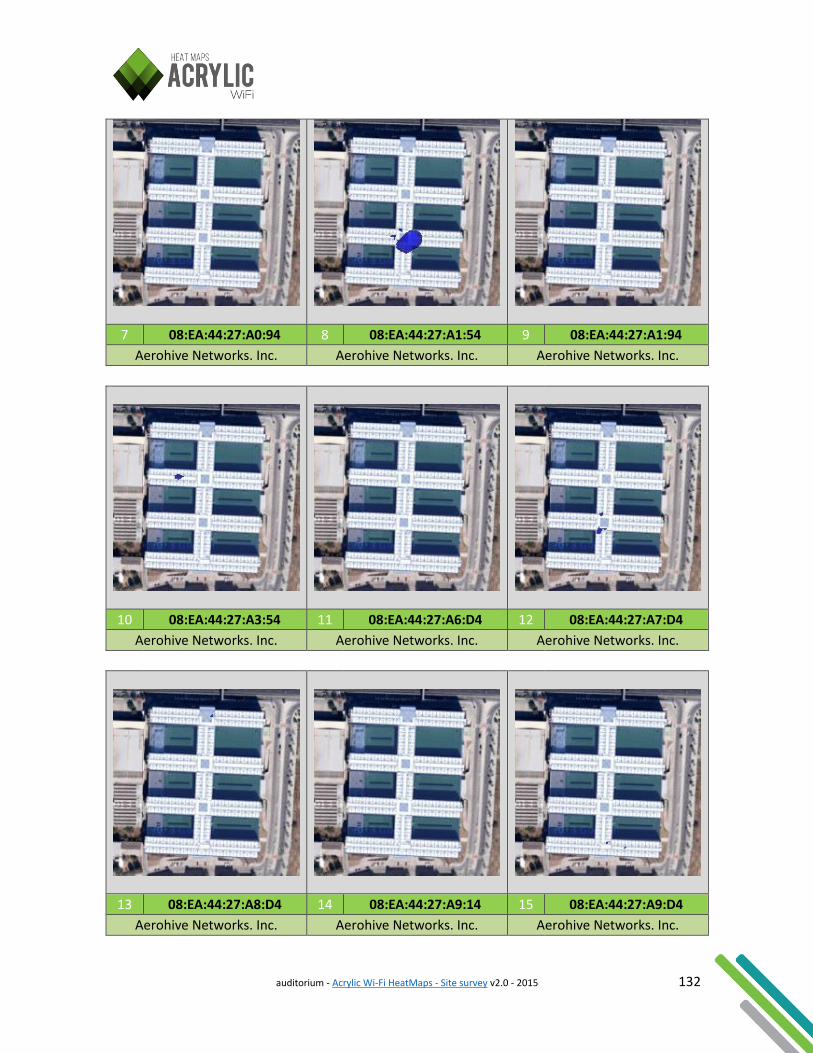
auditorium - Acrylic Wi-Fi HeatMaps - Site survey v2.0 - 2015 132
7 08:EA:44:27:A0:94 8 08:EA:44:27:A1:54 9 08:EA:44:27:A1:94
Aerohive Networks. Inc. Aerohive Networks. Inc. Aerohive Networks. Inc.
10 08:EA:44:27:A3:54 11 08:EA:44:27:A6:D4 12 08:EA:44:27:A7:D4
Aerohive Networks. Inc. Aerohive Networks. Inc. Aerohive Networks. Inc.
13 08:EA:44:27:A8:D4 14 08:EA:44:27:A9:14 15 08:EA:44:27:A9:D4
Aerohive Networks. Inc. Aerohive Networks. Inc. Aerohive Networks. Inc.
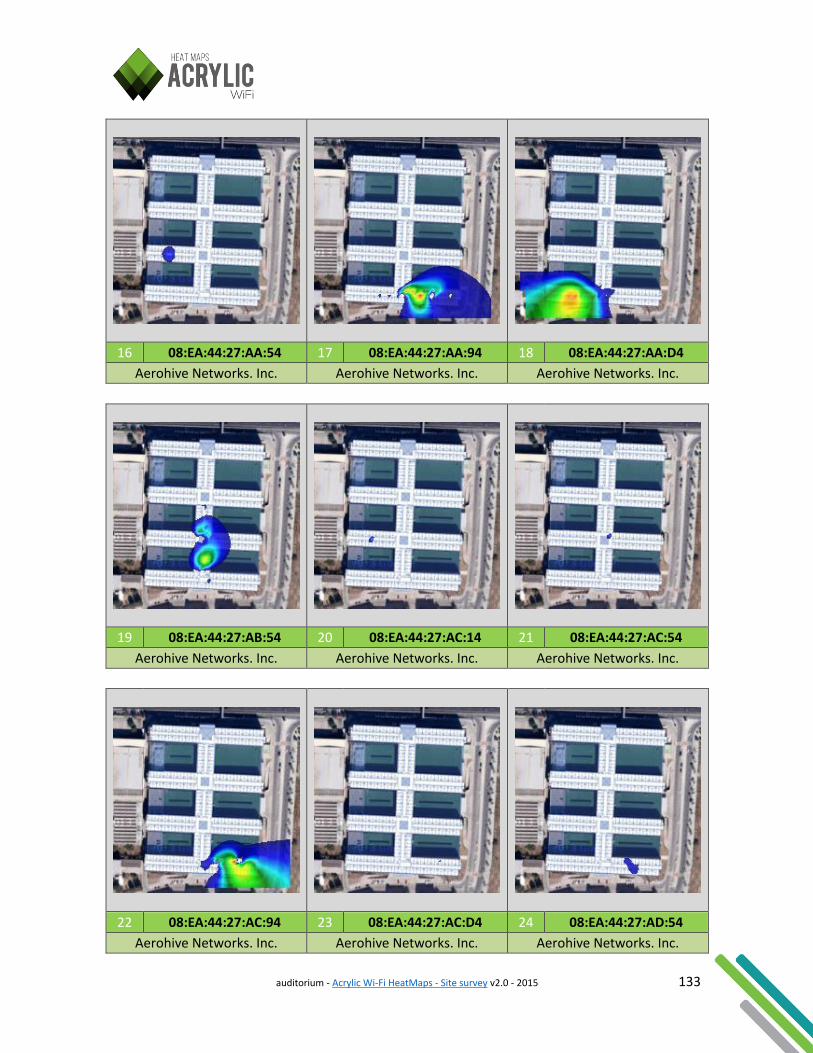
auditorium - Acrylic Wi-Fi HeatMaps - Site survey v2.0 - 2015 133
16 08:EA:44:27:AA:54 17 08:EA:44:27:AA:94 18 08:EA:44:27:AA:D4
Aerohive Networks. Inc. Aerohive Networks. Inc. Aerohive Networks. Inc.
19 08:EA:44:27:AB:54 20 08:EA:44:27:AC:14 21 08:EA:44:27:AC:54
Aerohive Networks. Inc. Aerohive Networks. Inc. Aerohive Networks. Inc.
22 08:EA:44:27:AC:94 23 08:EA:44:27:AC:D4 24 08:EA:44:27:AD:54
Aerohive Networks. Inc. Aerohive Networks. Inc. Aerohive Networks. Inc.
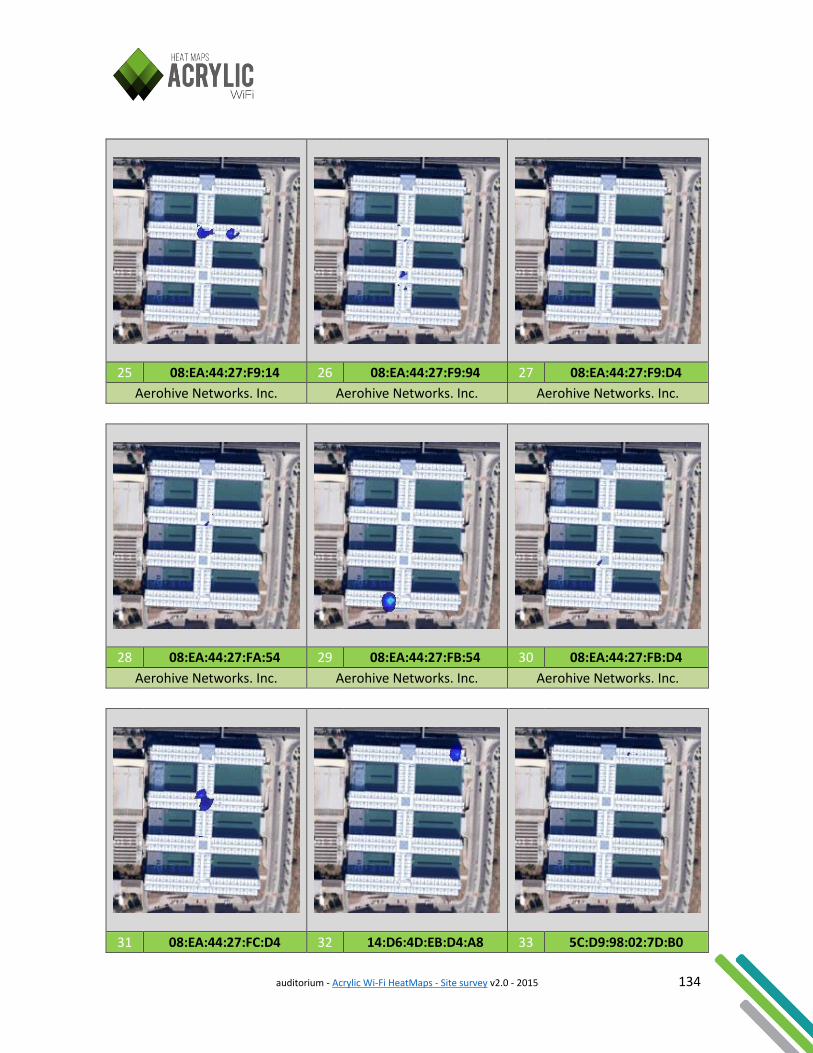
auditorium - Acrylic Wi-Fi HeatMaps - Site survey v2.0 - 2015 134
25 08:EA:44:27:F9:14 26 08:EA:44:27:F9:94 27 08:EA:44:27:F9:D4
Aerohive Networks. Inc. Aerohive Networks. Inc. Aerohive Networks. Inc.
28 08:EA:44:27:FA:54 29 08:EA:44:27:FB:54 30 08:EA:44:27:FB:D4
Aerohive Networks. Inc. Aerohive Networks. Inc. Aerohive Networks. Inc.
31 08:EA:44:27:FC:D4 32 14:D6:4D:EB:D4:A8 33 5C:D9:98:02:7D:B0

auditorium - Acrylic Wi-Fi HeatMaps - Site survey v2.0 - 2015 135
Aerohive Networks. Inc. D-Link International D-Link Corporation
34 F0:9C:E9:27:B4:94 35 F0:9C:E9:27:B5:54 36 F0:9C:E9:27:B6:94
Aerohive Networks Inc Aerohive Networks Inc Aerohive Networks Inc
37 F0:9C:E9:27:B6:D4 38 F0:9C:E9:27:BA:D4 39 F0:9C:E9:27:CD:54
Aerohive Networks Inc Aerohive Networks Inc Aerohive Networks Inc
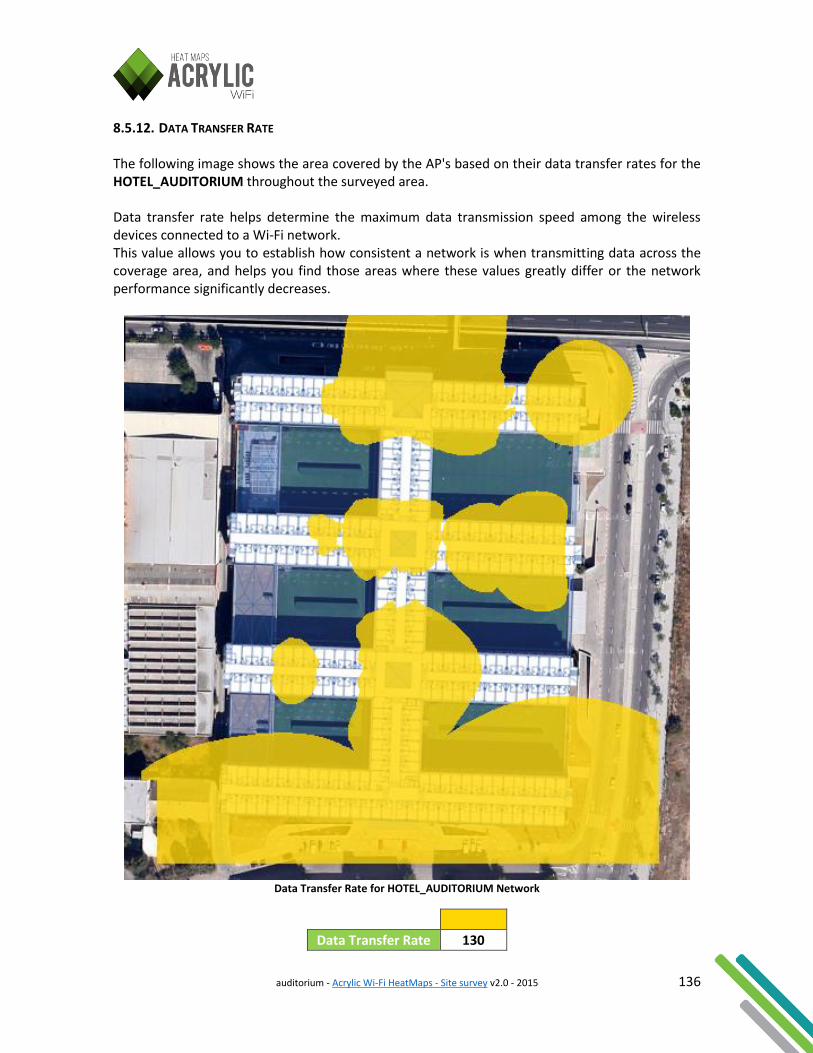
auditorium - Acrylic Wi-Fi HeatMaps - Site survey v2.0 - 2015 136
8.5.12. DATA TRANSFER RATE The following image shows the area covered by the AP's based on their data transfer rates for the HOTEL_AUDITORIUM throughout the surveyed area. Data transfer rate helps determine the maximum data transmission speed among the wireless devices connected to a Wi-Fi network. This value allows you to establish how consistent a network is when transmitting data across the coverage area, and helps you find those areas where these values greatly differ or the network performance significantly decreases.
Data Transfer Rate for HOTEL_AUDITORIUM Network
Data Transfer Rate 130
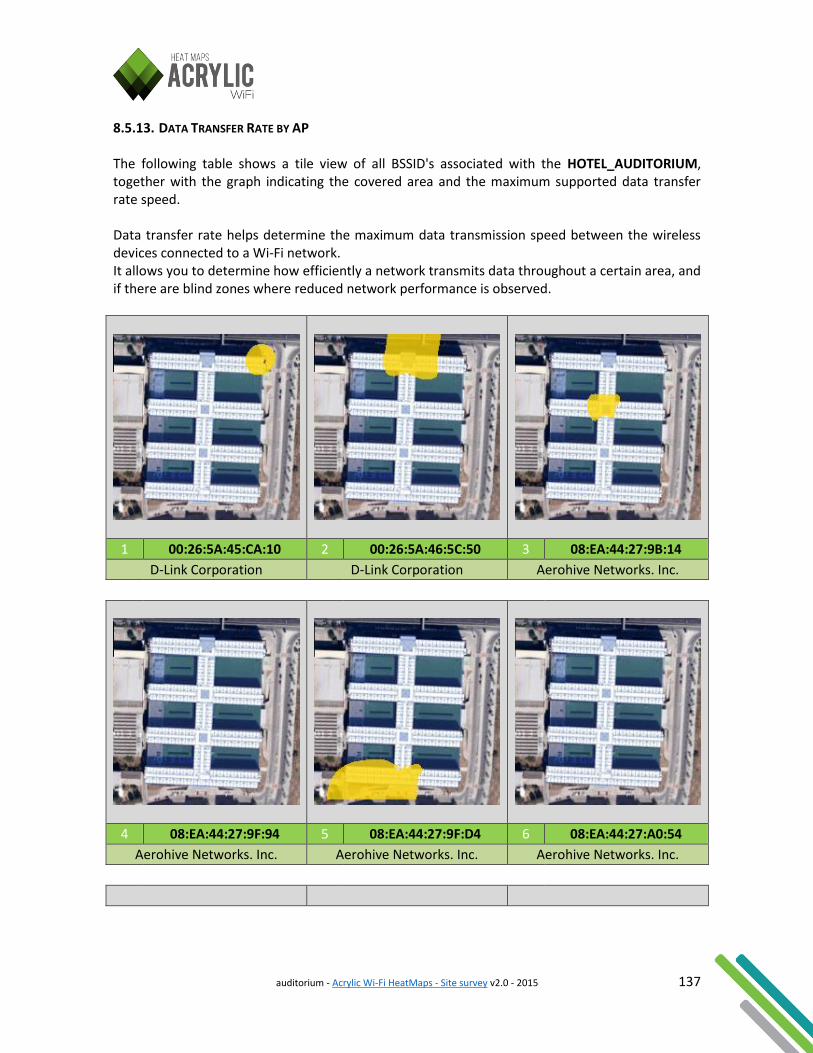
auditorium - Acrylic Wi-Fi HeatMaps - Site survey v2.0 - 2015 137
8.5.13. DATA TRANSFER RATE BY AP The following table shows a tile view of all BSSID's associated with the HOTEL_AUDITORIUM, together with the graph indicating the covered area and the maximum supported data transfer rate speed. Data transfer rate helps determine the maximum data transmission speed between the wireless devices connected to a Wi-Fi network. It allows you to determine how efficiently a network transmits data throughout a certain area, and if there are blind zones where reduced network performance is observed.
1 00:26:5A:45:CA:10 2 00:26:5A:46:5C:50 3 08:EA:44:27:9B:14
D-Link Corporation D-Link Corporation Aerohive Networks. Inc.
4 08:EA:44:27:9F:94 5 08:EA:44:27:9F:D4 6 08:EA:44:27:A0:54
Aerohive Networks. Inc. Aerohive Networks. Inc. Aerohive Networks. Inc.

auditorium - Acrylic Wi-Fi HeatMaps - Site survey v2.0 - 2015 138
7 08:EA:44:27:A0:94 8 08:EA:44:27:A1:54 9 08:EA:44:27:A1:94
Aerohive Networks. Inc. Aerohive Networks. Inc. Aerohive Networks. Inc.
10 08:EA:44:27:A3:54 11 08:EA:44:27:A6:D4 12 08:EA:44:27:A7:D4
Aerohive Networks. Inc. Aerohive Networks. Inc. Aerohive Networks. Inc.
13 08:EA:44:27:A8:D4 14 08:EA:44:27:A9:14 15 08:EA:44:27:A9:D4
Aerohive Networks. Inc. Aerohive Networks. Inc. Aerohive Networks. Inc.
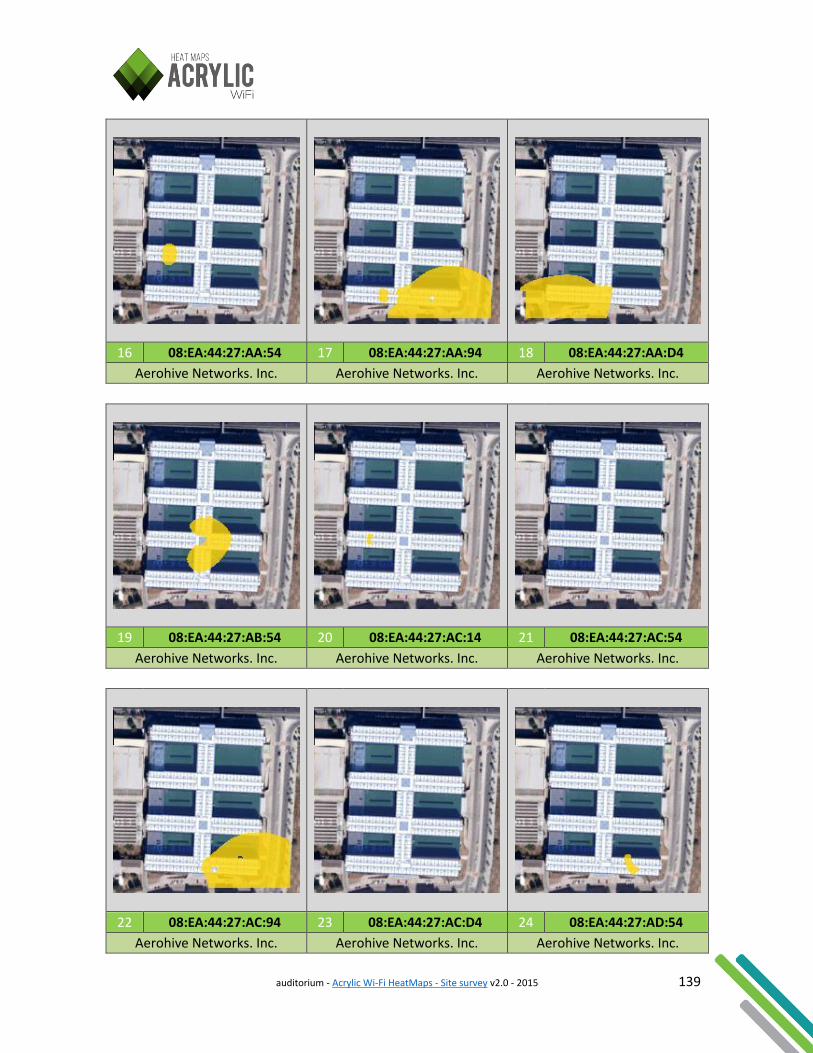
auditorium - Acrylic Wi-Fi HeatMaps - Site survey v2.0 - 2015 139
16 08:EA:44:27:AA:54 17 08:EA:44:27:AA:94 18 08:EA:44:27:AA:D4
Aerohive Networks. Inc. Aerohive Networks. Inc. Aerohive Networks. Inc.
19 08:EA:44:27:AB:54 20 08:EA:44:27:AC:14 21 08:EA:44:27:AC:54
Aerohive Networks. Inc. Aerohive Networks. Inc. Aerohive Networks. Inc.
22 08:EA:44:27:AC:94 23 08:EA:44:27:AC:D4 24 08:EA:44:27:AD:54
Aerohive Networks. Inc. Aerohive Networks. Inc. Aerohive Networks. Inc.
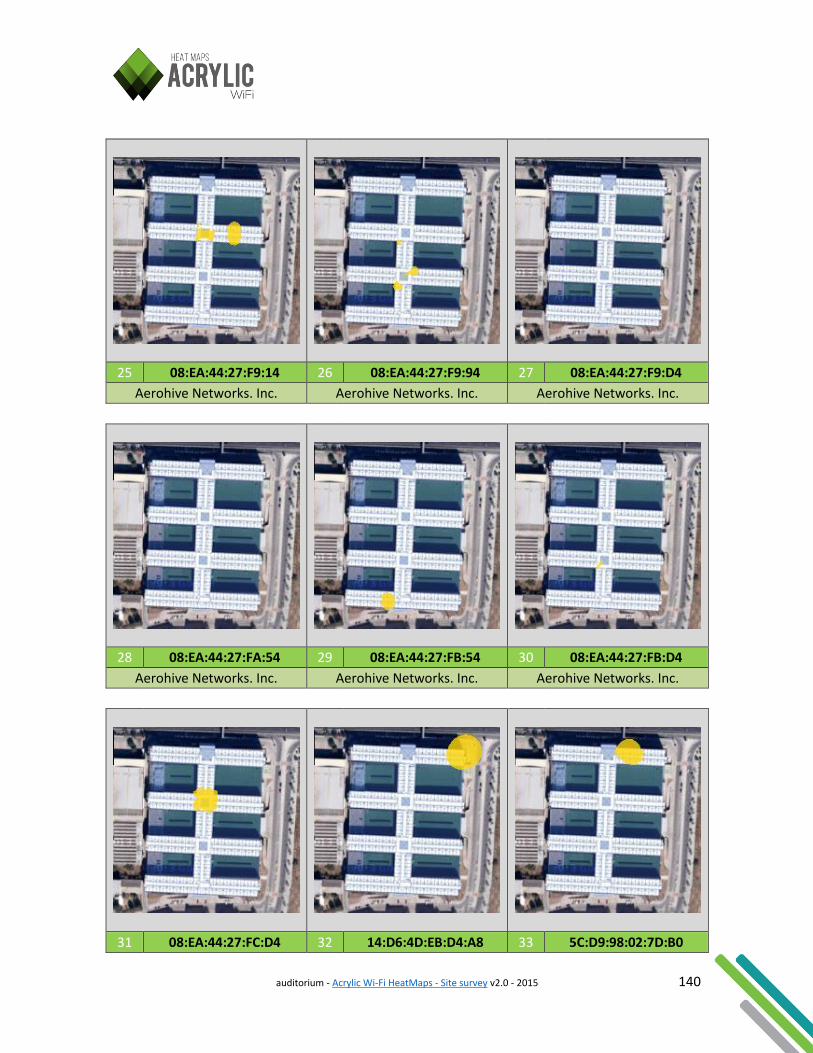
auditorium - Acrylic Wi-Fi HeatMaps - Site survey v2.0 - 2015 140
25 08:EA:44:27:F9:14 26 08:EA:44:27:F9:94 27 08:EA:44:27:F9:D4
Aerohive Networks. Inc. Aerohive Networks. Inc. Aerohive Networks. Inc.
28 08:EA:44:27:FA:54 29 08:EA:44:27:FB:54 30 08:EA:44:27:FB:D4
Aerohive Networks. Inc. Aerohive Networks. Inc. Aerohive Networks. Inc.
31 08:EA:44:27:FC:D4 32 14:D6:4D:EB:D4:A8 33 5C:D9:98:02:7D:B0
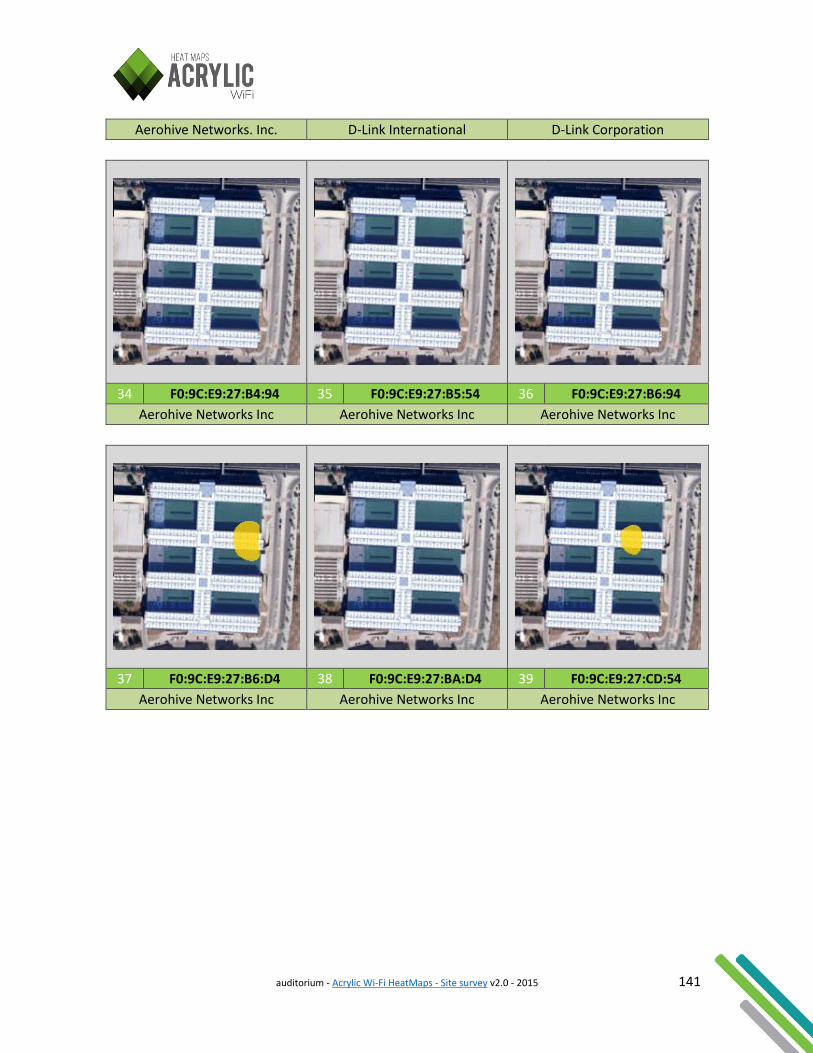
auditorium - Acrylic Wi-Fi HeatMaps - Site survey v2.0 - 2015 141
Aerohive Networks. Inc. D-Link International D-Link Corporation
34 F0:9C:E9:27:B4:94 35 F0:9C:E9:27:B5:54 36 F0:9C:E9:27:B6:94
Aerohive Networks Inc Aerohive Networks Inc Aerohive Networks Inc
37 F0:9C:E9:27:B6:D4 38 F0:9C:E9:27:BA:D4 39 F0:9C:E9:27:CD:54
Aerohive Networks Inc Aerohive Networks Inc Aerohive Networks Inc
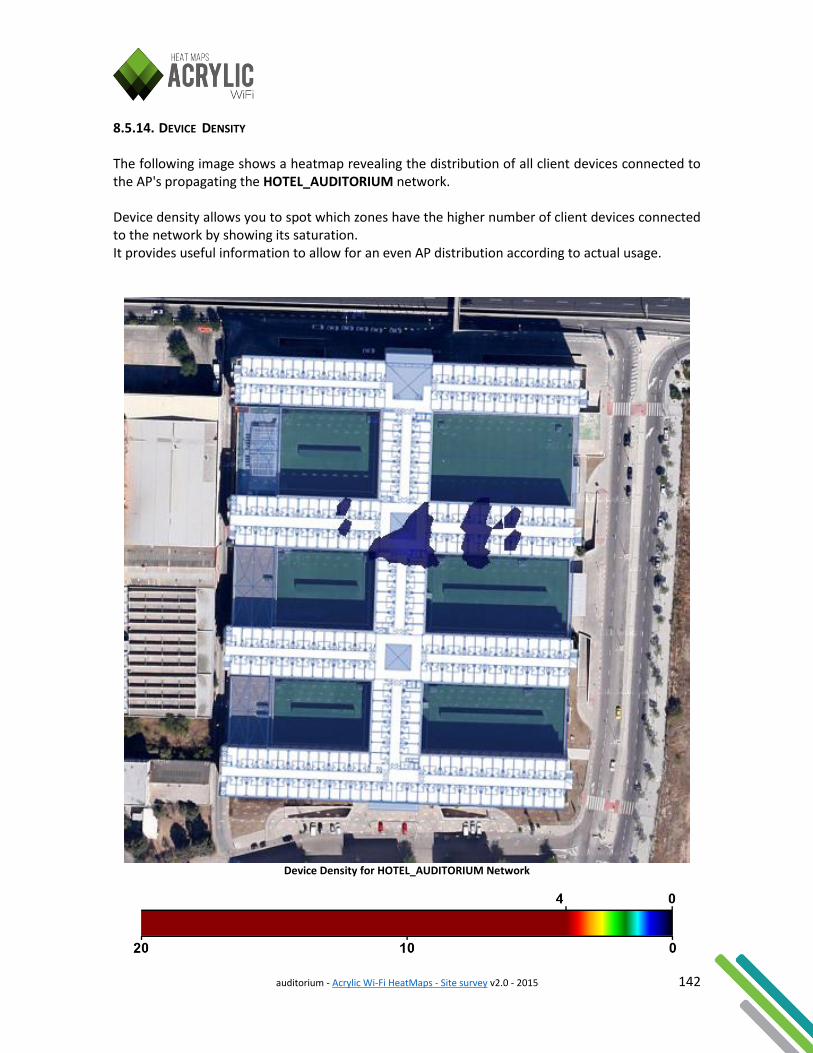
auditorium - Acrylic Wi-Fi HeatMaps - Site survey v2.0 - 2015 142
8.5.14. DEVICE DENSITY The following image shows a heatmap revealing the distribution of all client devices connected to the AP's propagating the HOTEL_AUDITORIUM network. Device density allows you to spot which zones have the higher number of client devices connected to the network by showing its saturation. It provides useful information to allow for an even AP distribution according to actual usage.
Device Density for HOTEL_AUDITORIUM Network
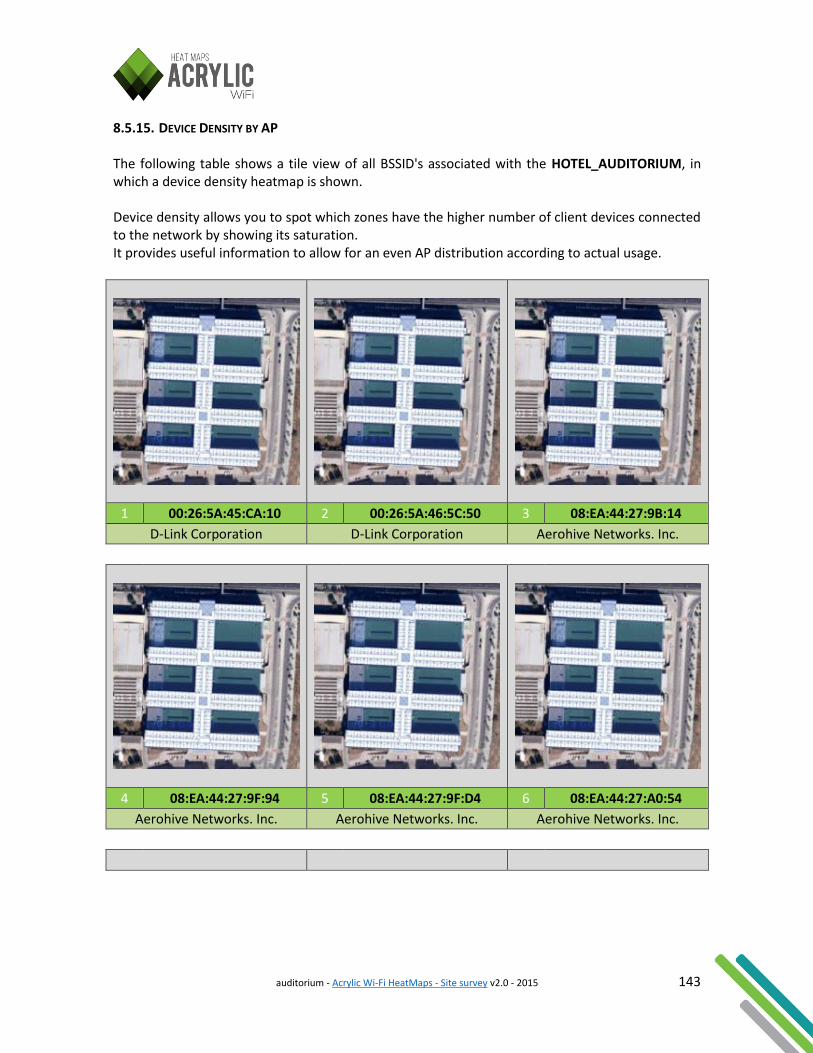
auditorium - Acrylic Wi-Fi HeatMaps - Site survey v2.0 - 2015 143
8.5.15. DEVICE DENSITY BY AP The following table shows a tile view of all BSSID's associated with the HOTEL_AUDITORIUM, in which a device density heatmap is shown. Device density allows you to spot which zones have the higher number of client devices connected to the network by showing its saturation. It provides useful information to allow for an even AP distribution according to actual usage.
1 00:26:5A:45:CA:10 2 00:26:5A:46:5C:50 3 08:EA:44:27:9B:14
D-Link Corporation D-Link Corporation Aerohive Networks. Inc.
4 08:EA:44:27:9F:94 5 08:EA:44:27:9F:D4 6 08:EA:44:27:A0:54
Aerohive Networks. Inc. Aerohive Networks. Inc. Aerohive Networks. Inc.
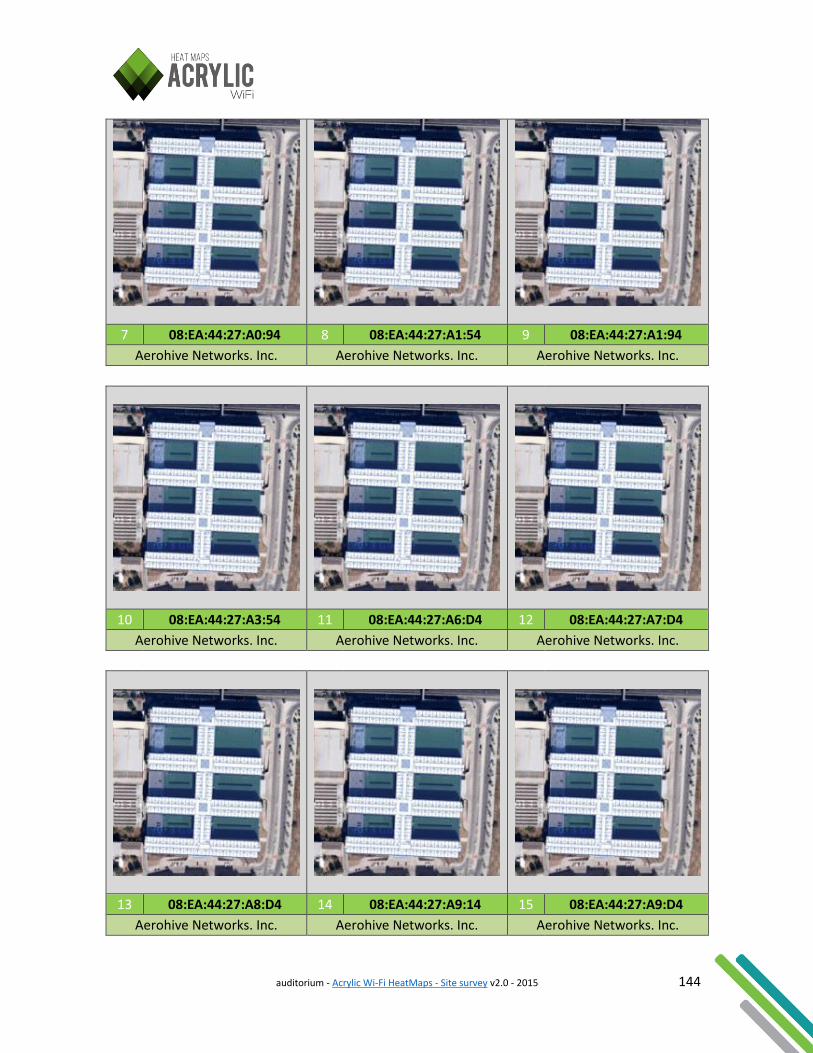
auditorium - Acrylic Wi-Fi HeatMaps - Site survey v2.0 - 2015 144
7 08:EA:44:27:A0:94 8 08:EA:44:27:A1:54 9 08:EA:44:27:A1:94
Aerohive Networks. Inc. Aerohive Networks. Inc. Aerohive Networks. Inc.
10 08:EA:44:27:A3:54 11 08:EA:44:27:A6:D4 12 08:EA:44:27:A7:D4
Aerohive Networks. Inc. Aerohive Networks. Inc. Aerohive Networks. Inc.
13 08:EA:44:27:A8:D4 14 08:EA:44:27:A9:14 15 08:EA:44:27:A9:D4
Aerohive Networks. Inc. Aerohive Networks. Inc. Aerohive Networks. Inc.
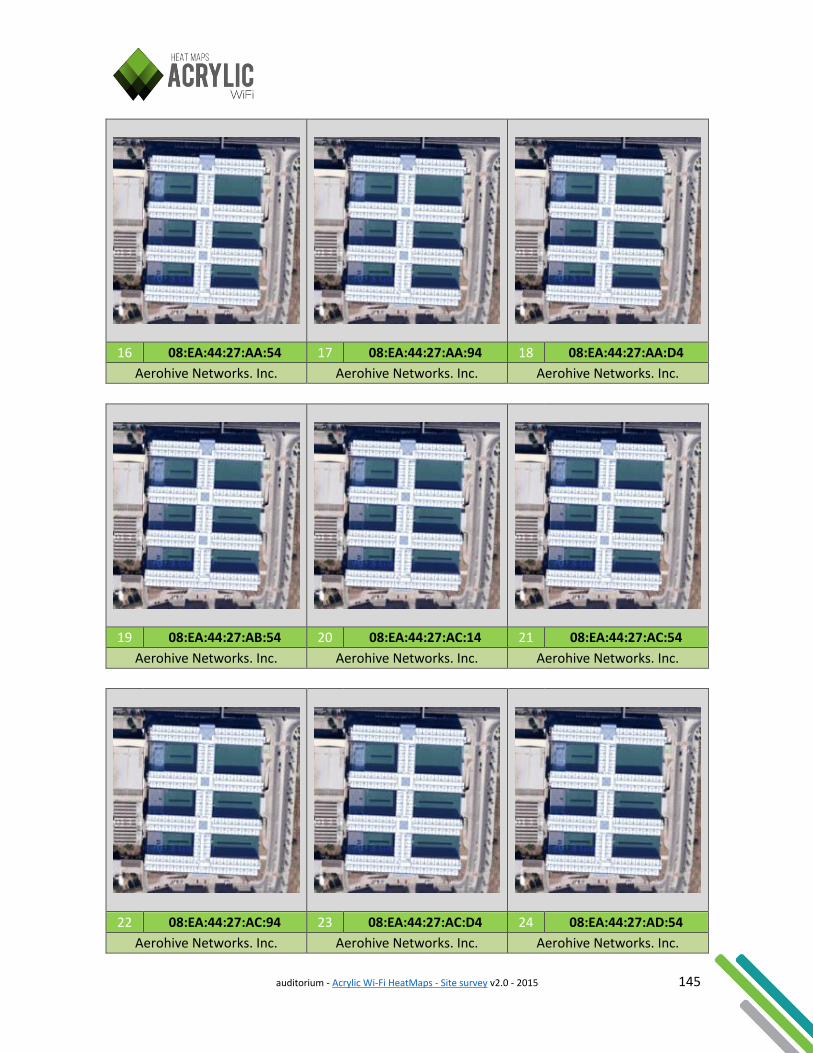
auditorium - Acrylic Wi-Fi HeatMaps - Site survey v2.0 - 2015 145
16 08:EA:44:27:AA:54 17 08:EA:44:27:AA:94 18 08:EA:44:27:AA:D4
Aerohive Networks. Inc. Aerohive Networks. Inc. Aerohive Networks. Inc.
19 08:EA:44:27:AB:54 20 08:EA:44:27:AC:14 21 08:EA:44:27:AC:54
Aerohive Networks. Inc. Aerohive Networks. Inc. Aerohive Networks. Inc.
22 08:EA:44:27:AC:94 23 08:EA:44:27:AC:D4 24 08:EA:44:27:AD:54
Aerohive Networks. Inc. Aerohive Networks. Inc. Aerohive Networks. Inc.
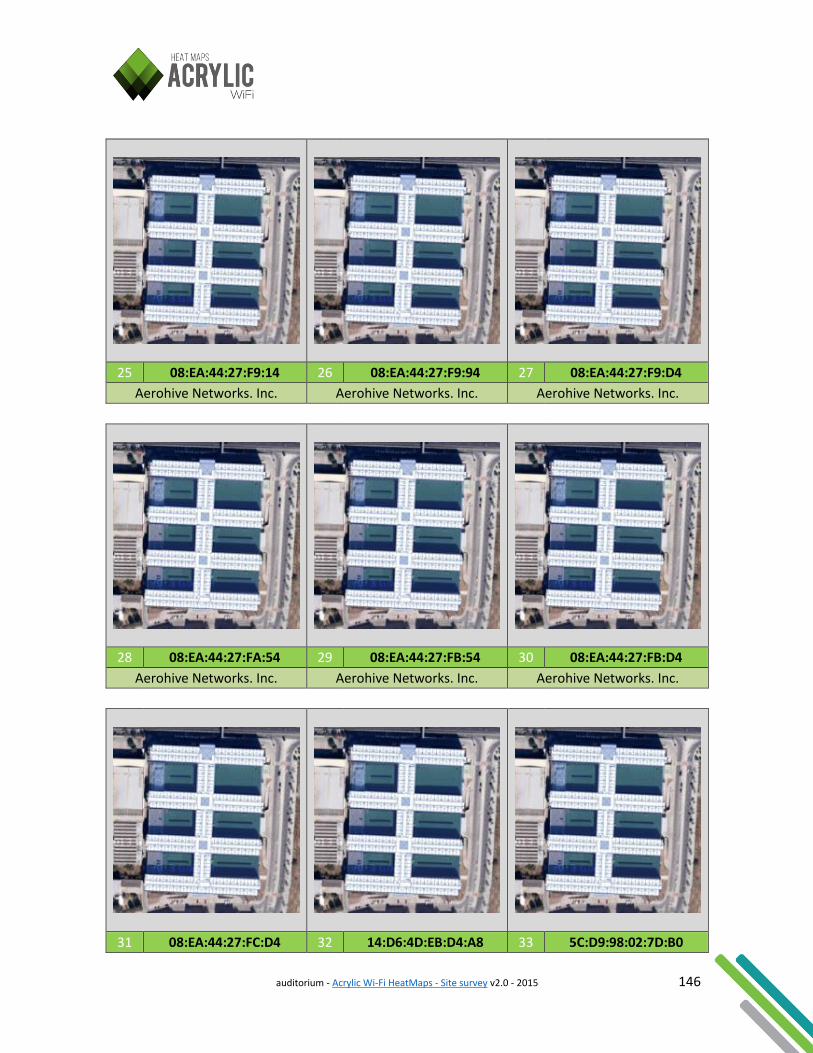
auditorium - Acrylic Wi-Fi HeatMaps - Site survey v2.0 - 2015 146
25 08:EA:44:27:F9:14 26 08:EA:44:27:F9:94 27 08:EA:44:27:F9:D4
Aerohive Networks. Inc. Aerohive Networks. Inc. Aerohive Networks. Inc.
28 08:EA:44:27:FA:54 29 08:EA:44:27:FB:54 30 08:EA:44:27:FB:D4
Aerohive Networks. Inc. Aerohive Networks. Inc. Aerohive Networks. Inc.
31 08:EA:44:27:FC:D4 32 14:D6:4D:EB:D4:A8 33 5C:D9:98:02:7D:B0
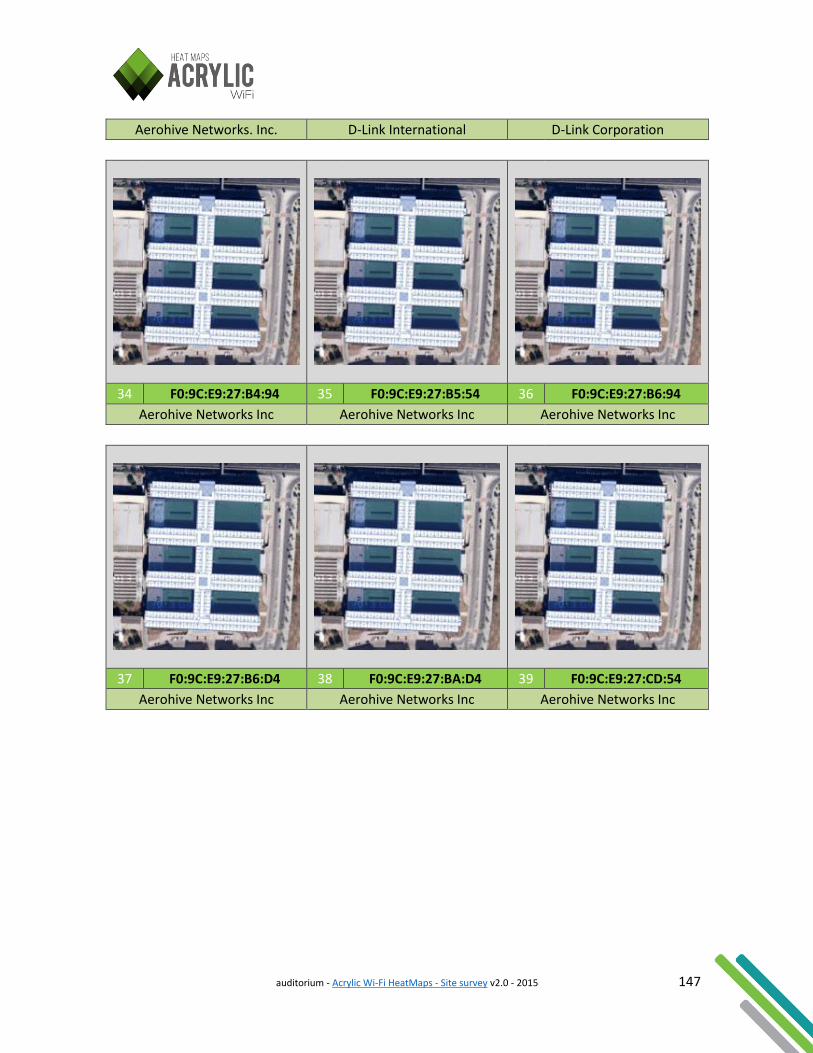
auditorium - Acrylic Wi-Fi HeatMaps - Site survey v2.0 - 2015 147
Aerohive Networks. Inc. D-Link International D-Link Corporation
34 F0:9C:E9:27:B4:94 35 F0:9C:E9:27:B5:54 36 F0:9C:E9:27:B6:94
Aerohive Networks Inc Aerohive Networks Inc Aerohive Networks Inc
37 F0:9C:E9:27:B6:D4 38 F0:9C:E9:27:BA:D4 39 F0:9C:E9:27:CD:54
Aerohive Networks Inc Aerohive Networks Inc Aerohive Networks Inc
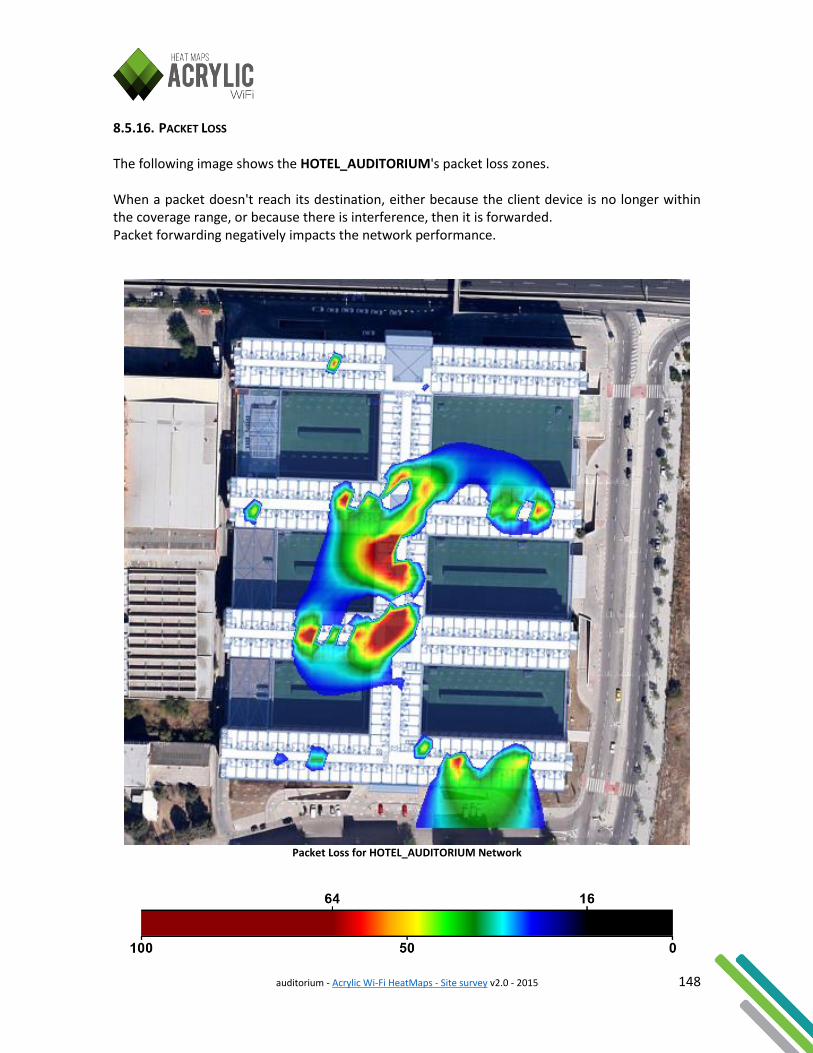
auditorium - Acrylic Wi-Fi HeatMaps - Site survey v2.0 - 2015 148
8.5.16. PACKET LOSS The following image shows the HOTEL_AUDITORIUM's packet loss zones. When a packet doesn't reach its destination, either because the client device is no longer within the coverage range, or because there is interference, then it is forwarded. Packet forwarding negatively impacts the network performance.
Packet Loss for HOTEL_AUDITORIUM Network
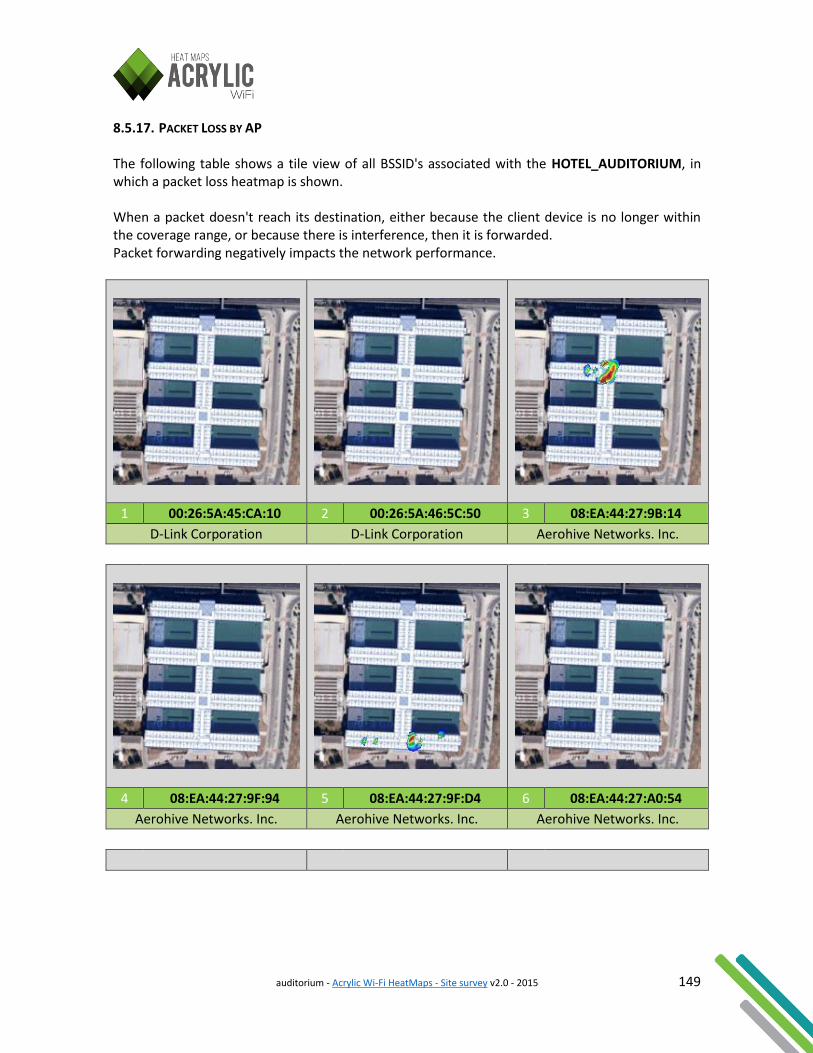
auditorium - Acrylic Wi-Fi HeatMaps - Site survey v2.0 - 2015 149
8.5.17. PACKET LOSS BY AP The following table shows a tile view of all BSSID's associated with the HOTEL_AUDITORIUM, in which a packet loss heatmap is shown. When a packet doesn't reach its destination, either because the client device is no longer within the coverage range, or because there is interference, then it is forwarded. Packet forwarding negatively impacts the network performance.
1 00:26:5A:45:CA:10 2 00:26:5A:46:5C:50 3 08:EA:44:27:9B:14
D-Link Corporation D-Link Corporation Aerohive Networks. Inc.
4 08:EA:44:27:9F:94 5 08:EA:44:27:9F:D4 6 08:EA:44:27:A0:54
Aerohive Networks. Inc. Aerohive Networks. Inc. Aerohive Networks. Inc.
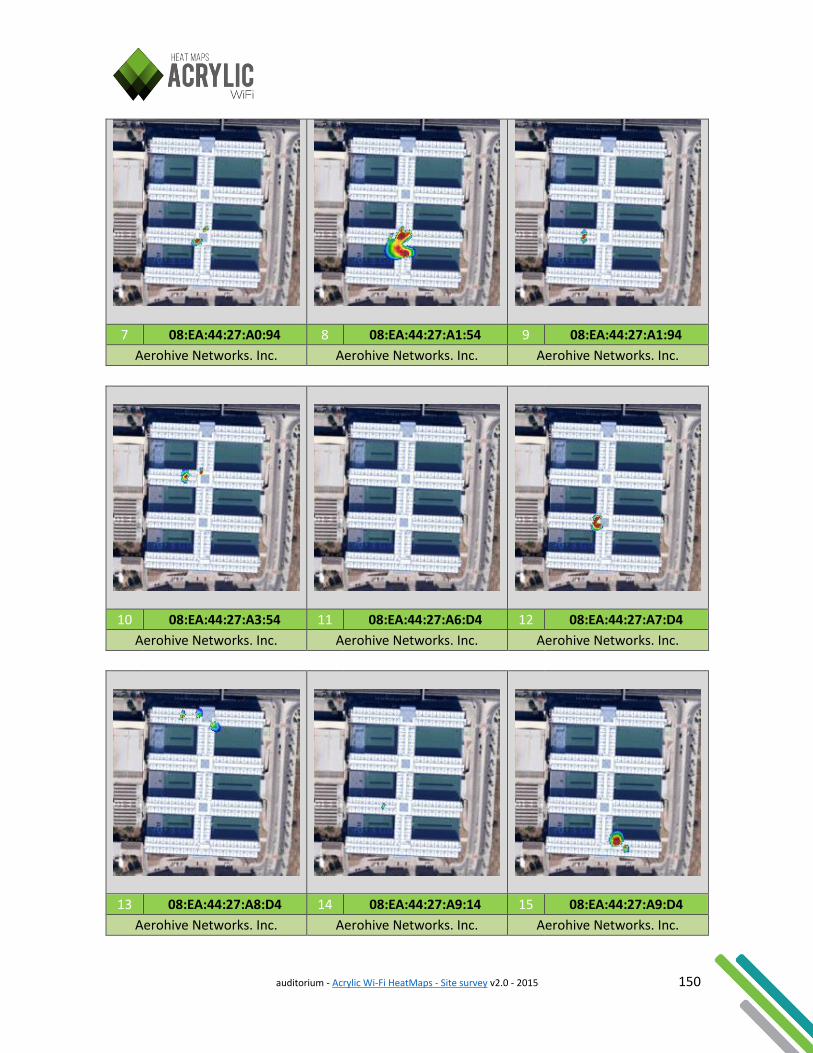
auditorium - Acrylic Wi-Fi HeatMaps - Site survey v2.0 - 2015 150
7 08:EA:44:27:A0:94 8 08:EA:44:27:A1:54 9 08:EA:44:27:A1:94
Aerohive Networks. Inc. Aerohive Networks. Inc. Aerohive Networks. Inc.
10 08:EA:44:27:A3:54 11 08:EA:44:27:A6:D4 12 08:EA:44:27:A7:D4
Aerohive Networks. Inc. Aerohive Networks. Inc. Aerohive Networks. Inc.
13 08:EA:44:27:A8:D4 14 08:EA:44:27:A9:14 15 08:EA:44:27:A9:D4
Aerohive Networks. Inc. Aerohive Networks. Inc. Aerohive Networks. Inc.
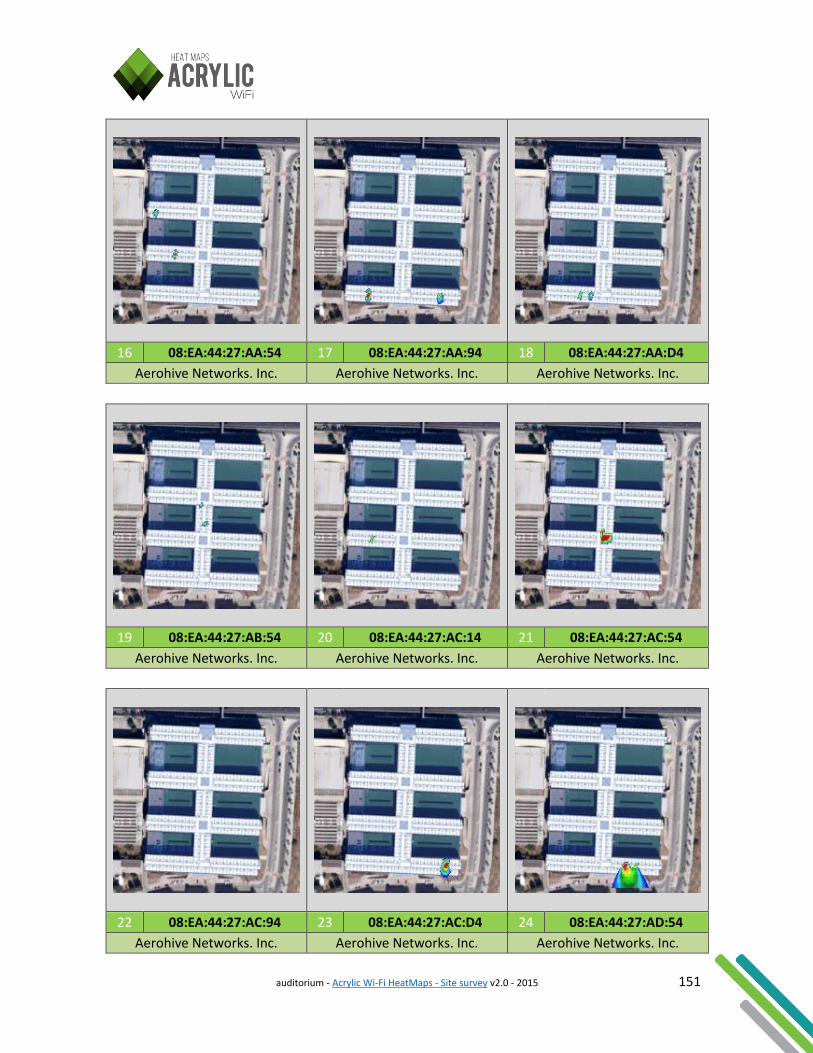
auditorium - Acrylic Wi-Fi HeatMaps - Site survey v2.0 - 2015 151
16 08:EA:44:27:AA:54 17 08:EA:44:27:AA:94 18 08:EA:44:27:AA:D4
Aerohive Networks. Inc. Aerohive Networks. Inc. Aerohive Networks. Inc.
19 08:EA:44:27:AB:54 20 08:EA:44:27:AC:14 21 08:EA:44:27:AC:54
Aerohive Networks. Inc. Aerohive Networks. Inc. Aerohive Networks. Inc.
22 08:EA:44:27:AC:94 23 08:EA:44:27:AC:D4 24 08:EA:44:27:AD:54
Aerohive Networks. Inc. Aerohive Networks. Inc. Aerohive Networks. Inc.
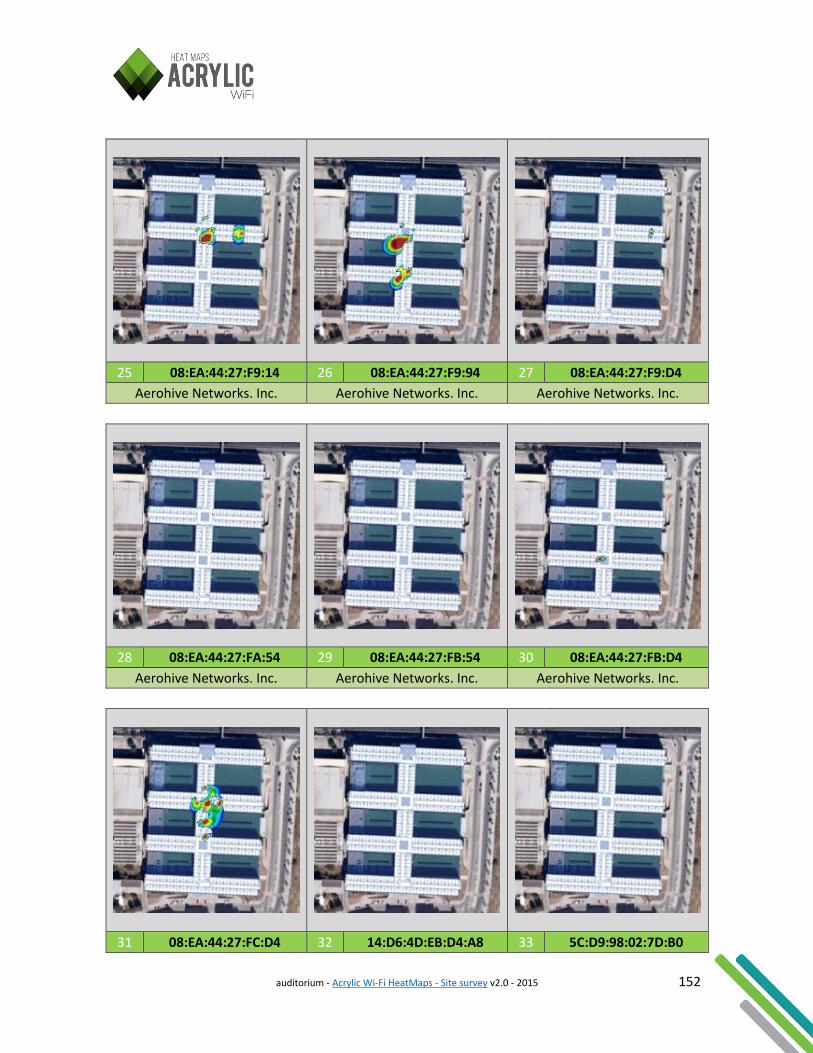
auditorium - Acrylic Wi-Fi HeatMaps - Site survey v2.0 - 2015 152
25 08:EA:44:27:F9:14 26 08:EA:44:27:F9:94 27 08:EA:44:27:F9:D4
Aerohive Networks. Inc. Aerohive Networks. Inc. Aerohive Networks. Inc.
28 08:EA:44:27:FA:54 29 08:EA:44:27:FB:54 30 08:EA:44:27:FB:D4
Aerohive Networks. Inc. Aerohive Networks. Inc. Aerohive Networks. Inc.
31 08:EA:44:27:FC:D4 32 14:D6:4D:EB:D4:A8 33 5C:D9:98:02:7D:B0
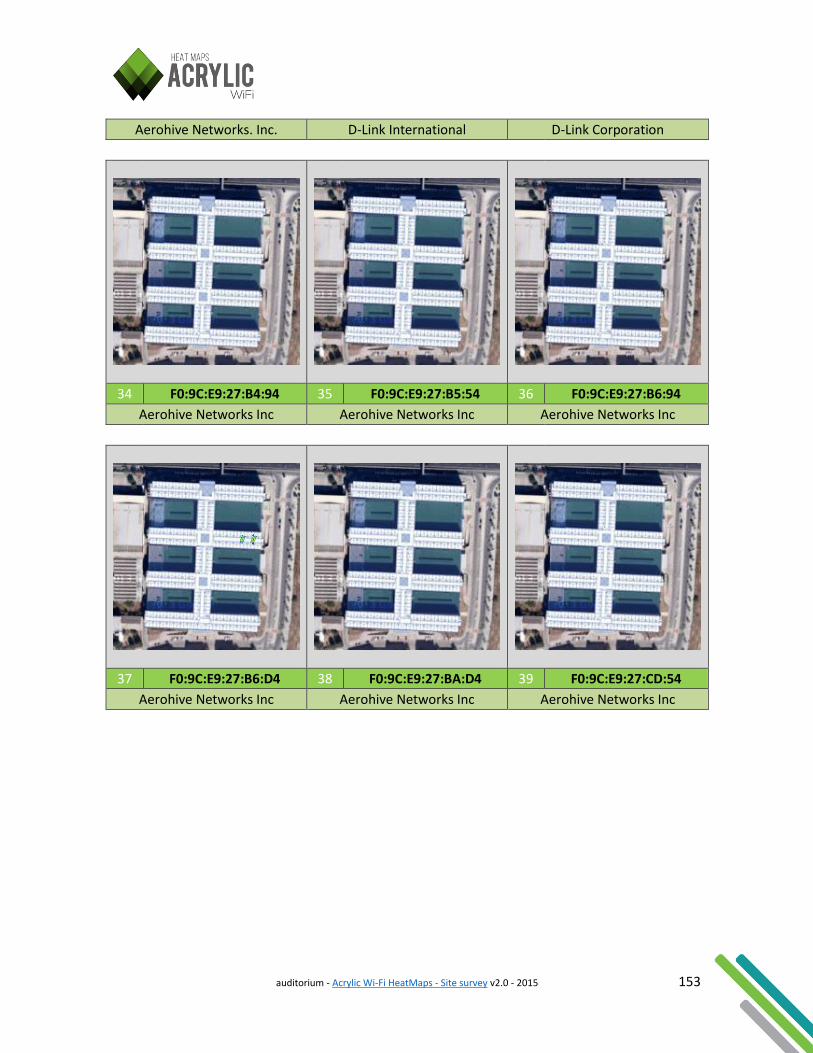
auditorium - Acrylic Wi-Fi HeatMaps - Site survey v2.0 - 2015 153
Aerohive Networks. Inc. D-Link International D-Link Corporation
34 F0:9C:E9:27:B4:94 35 F0:9C:E9:27:B5:54 36 F0:9C:E9:27:B6:94
Aerohive Networks Inc Aerohive Networks Inc Aerohive Networks Inc
37 F0:9C:E9:27:B6:D4 38 F0:9C:E9:27:BA:D4 39 F0:9C:E9:27:CD:54
Aerohive Networks Inc Aerohive Networks Inc Aerohive Networks Inc
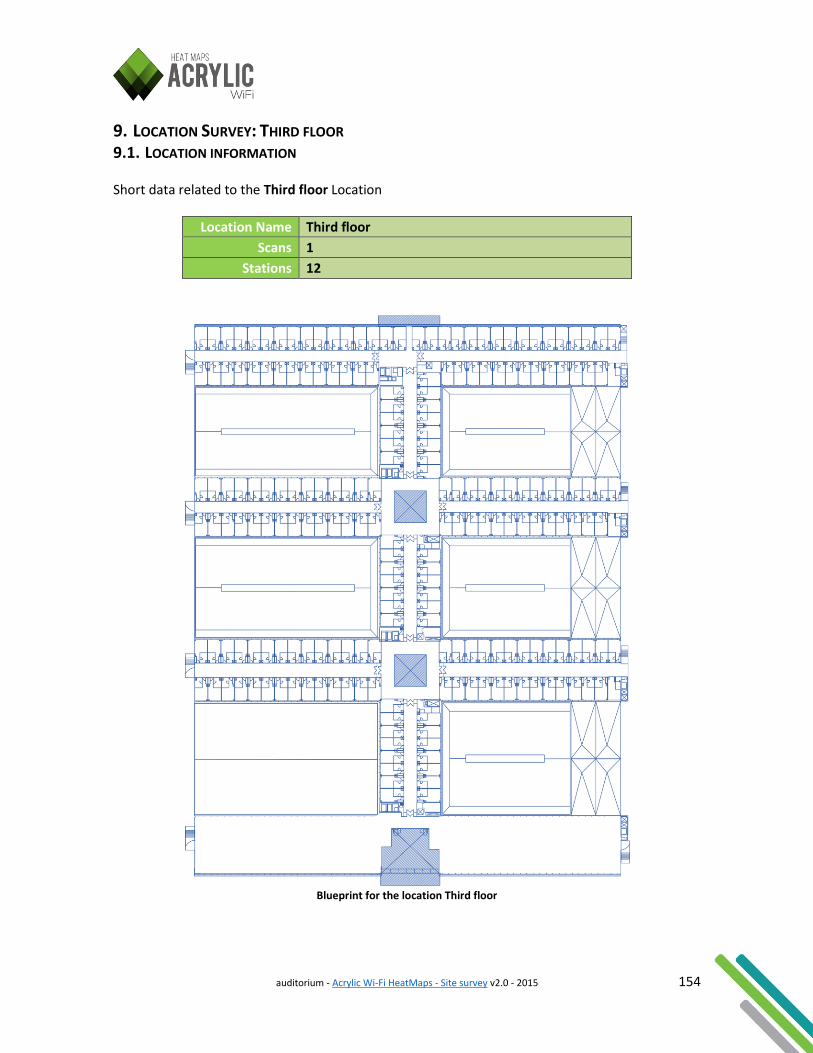
auditorium - Acrylic Wi-Fi HeatMaps - Site survey v2.0 - 2015 154
9. LOCATION SURVEY: THIRD FLOOR 9.1. LOCATION INFORMATION Short data related to the Third floor Location
Location Name Third floor
Scans 1
Stations 12
Blueprint for the location Third floor
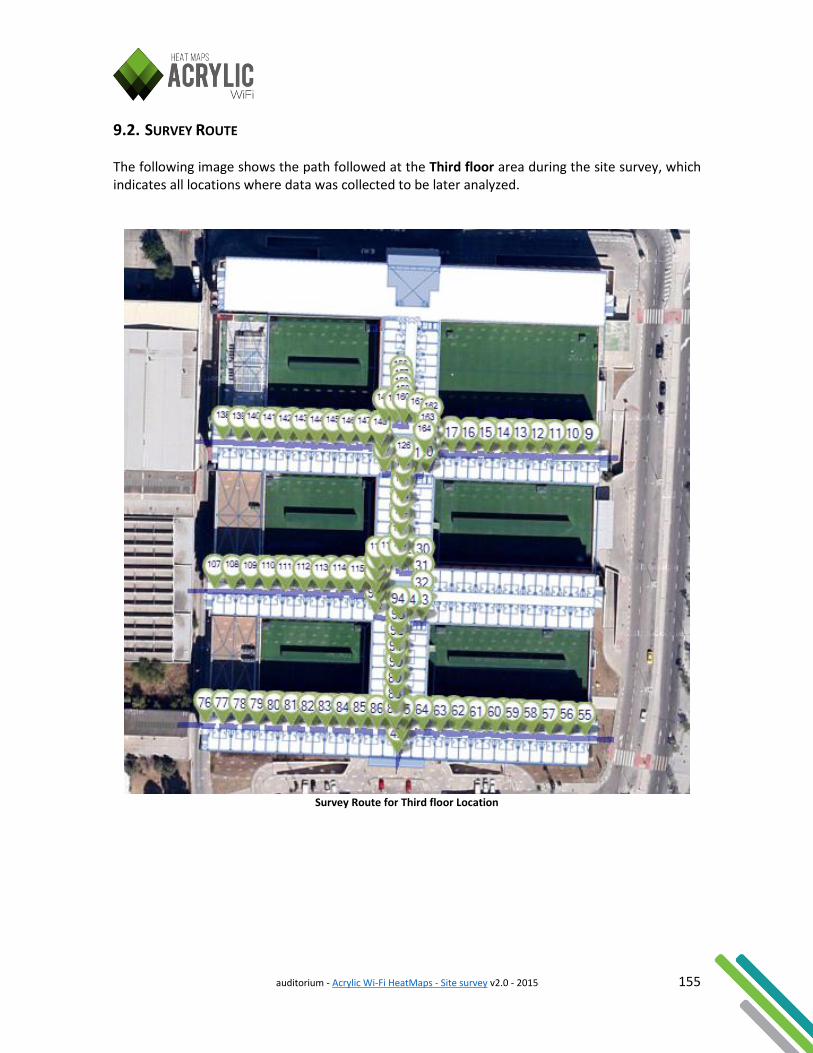
auditorium - Acrylic Wi-Fi HeatMaps - Site survey v2.0 - 2015 155
9.2. SURVEY ROUTE The following image shows the path followed at the Third floor area during the site survey, which indicates all locations where data was collected to be later analyzed.
Survey Route for Third floor Location
auditorium - Acrylic Wi-Fi HeatMaps - Site survey v2.0 - 2015 156
9.3. PHYSICAL AP'S POSITION The following image shows the approximate positions within the Third floor area of all access points identified during the site survey. These positions are manually configured, or otherwise are automatically estimated based on the measured data. The graph can't be generated due to the absence of access points with a defined position.
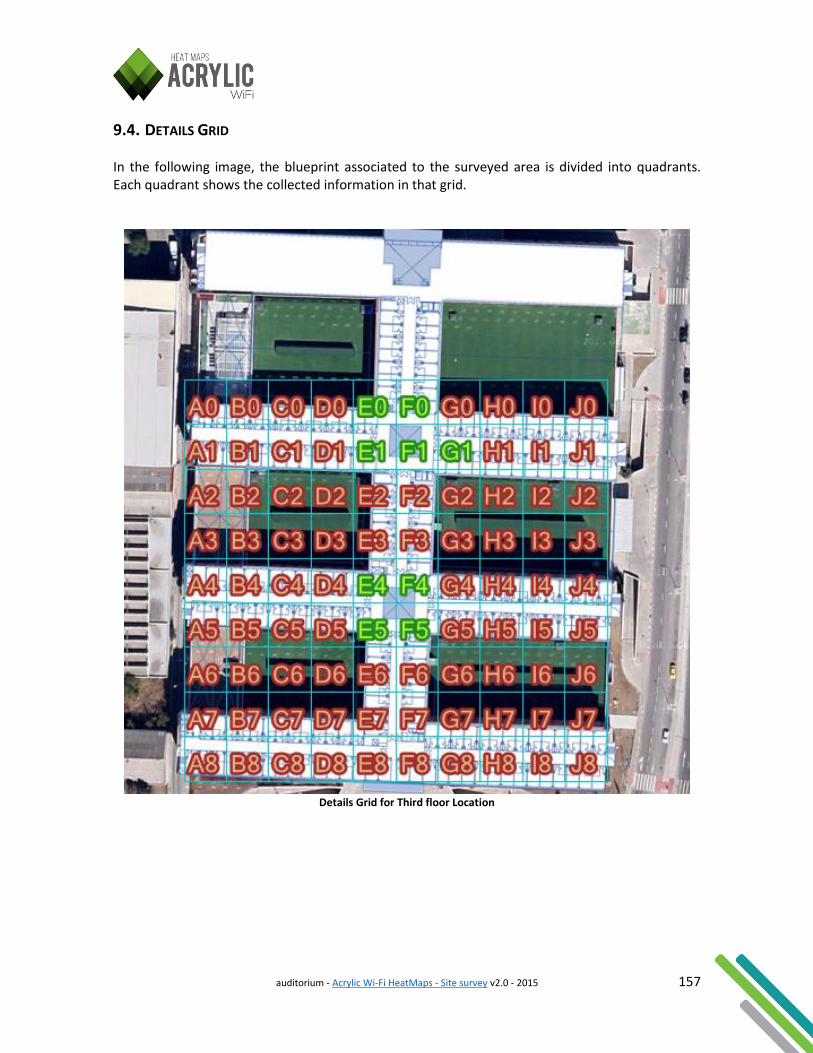
auditorium - Acrylic Wi-Fi HeatMaps - Site survey v2.0 - 2015 157
9.4. DETAILS GRID In the following image, the blueprint associated to the surveyed area is divided into quadrants. Each quadrant shows the collected information in that grid.
Details Grid for Third floor Location
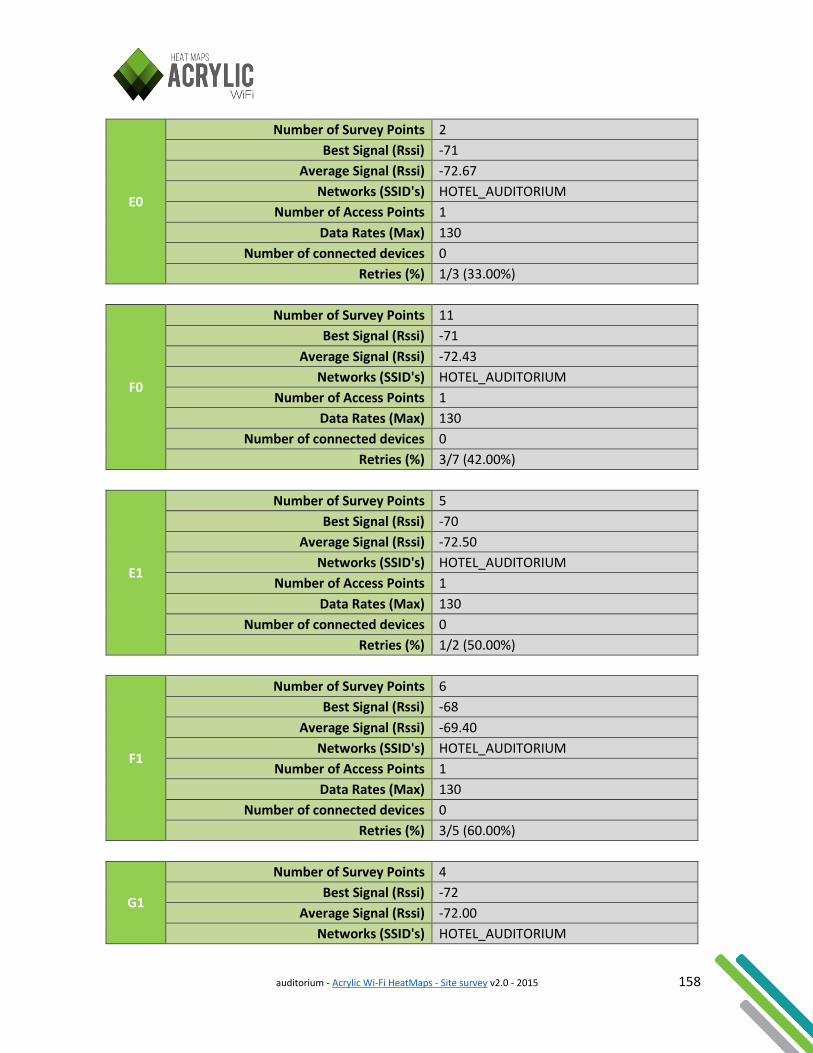
auditorium - Acrylic Wi-Fi HeatMaps - Site survey v2.0 - 2015 158
E0
Number of Survey Points 2
Best Signal (Rssi) -71
Average Signal (Rssi) -72.67
Networks (SSID's) HOTEL_AUDITORIUM
Number of Access Points 1
Data Rates (Max) 130
Number of connected devices 0
Retries (%) 1/3 (33.00%)
F0
Number of Survey Points 11
Best Signal (Rssi) -71
Average Signal (Rssi) -72.43
Networks (SSID's) HOTEL_AUDITORIUM
Number of Access Points 1
Data Rates (Max) 130
Number of connected devices 0
Retries (%) 3/7 (42.00%)
E1
Number of Survey Points 5
Best Signal (Rssi) -70
Average Signal (Rssi) -72.50
Networks (SSID's) HOTEL_AUDITORIUM
Number of Access Points 1
Data Rates (Max) 130
Number of connected devices 0
Retries (%) 1/2 (50.00%)
F1
Number of Survey Points 6
Best Signal (Rssi) -68
Average Signal (Rssi) -69.40
Networks (SSID's) HOTEL_AUDITORIUM
Number of Access Points 1
Data Rates (Max) 130
Number of connected devices 0
Retries (%) 3/5 (60.00%)
G1
Number of Survey Points 4
Best Signal (Rssi) -72
Average Signal (Rssi) -72.00
Networks (SSID's) HOTEL_AUDITORIUM
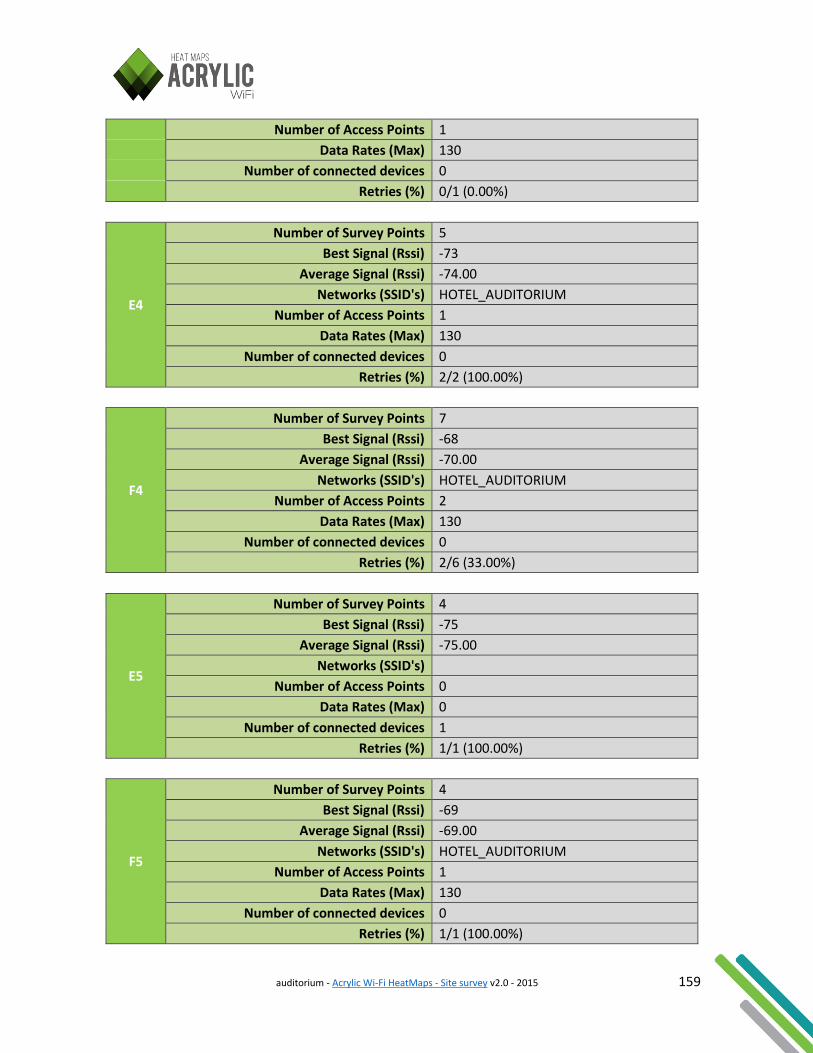
auditorium - Acrylic Wi-Fi HeatMaps - Site survey v2.0 - 2015 159
Number of Access Points 1
Data Rates (Max) 130
Number of connected devices 0
Retries (%) 0/1 (0.00%)
E4
Number of Survey Points 5
Best Signal (Rssi) -73
Average Signal (Rssi) -74.00
Networks (SSID's) HOTEL_AUDITORIUM
Number of Access Points 1
Data Rates (Max) 130
Number of connected devices 0
Retries (%) 2/2 (100.00%)
F4
Number of Survey Points 7
Best Signal (Rssi) -68
Average Signal (Rssi) -70.00
Networks (SSID's) HOTEL_AUDITORIUM
Number of Access Points 2
Data Rates (Max) 130
Number of connected devices 0
Retries (%) 2/6 (33.00%)
E5
Number of Survey Points 4
Best Signal (Rssi) -75
Average Signal (Rssi) -75.00
Networks (SSID's)
Number of Access Points 0
Data Rates (Max) 0
Number of connected devices 1
Retries (%) 1/1 (100.00%)
F5
Number of Survey Points 4
Best Signal (Rssi) -69
Average Signal (Rssi) -69.00
Networks (SSID's) HOTEL_AUDITORIUM
Number of Access Points 1
Data Rates (Max) 130
Number of connected devices 0
Retries (%) 1/1 (100.00%)
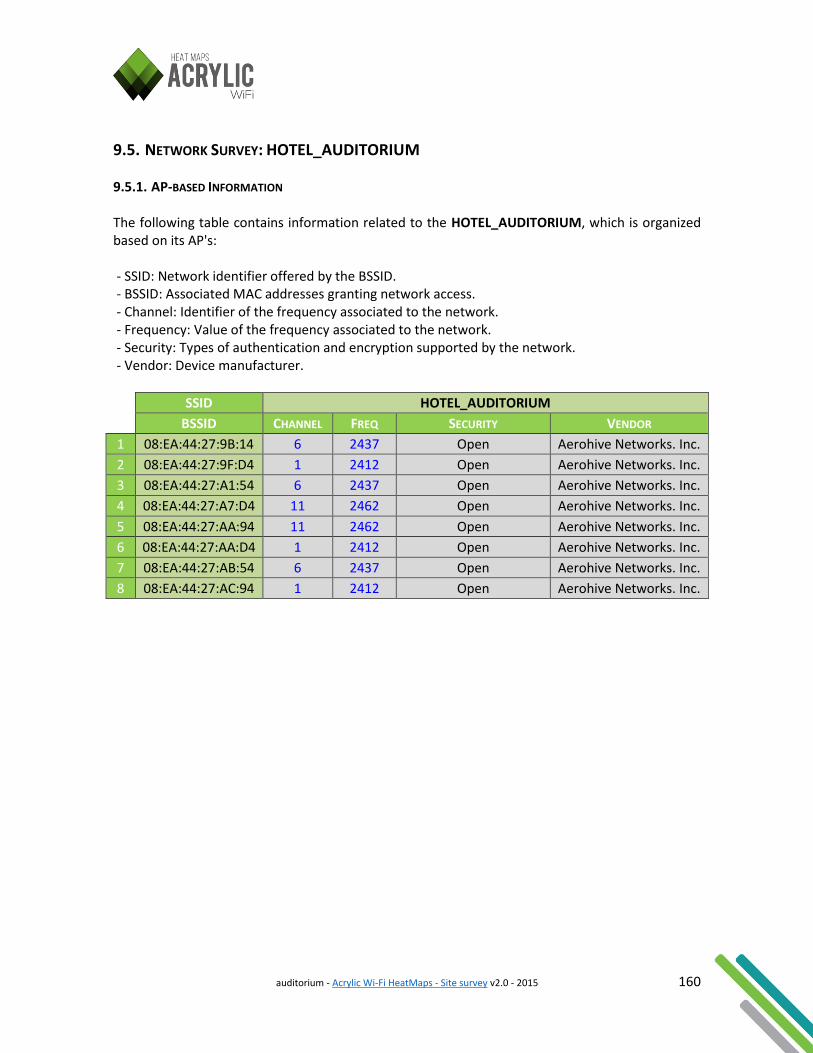
auditorium - Acrylic Wi-Fi HeatMaps - Site survey v2.0 - 2015 160
9.5. NETWORK SURVEY: HOTEL_AUDITORIUM 9.5.1. AP-BASED INFORMATION The following table contains information related to the HOTEL_AUDITORIUM, which is organized based on its AP's: - SSID: Network identifier offered by the BSSID. - BSSID: Associated MAC addresses granting network access. - Channel: Identifier of the frequency associated to the network. - Frequency: Value of the frequency associated to the network. - Security: Types of authentication and encryption supported by the network. - Vendor: Device manufacturer.
SSID HOTEL_AUDITORIUM
BSSID CHANNEL FREQ SECURITY VENDOR
1 08:EA:44:27:9B:14 6 2437 Open Aerohive Networks. Inc.
2 08:EA:44:27:9F:D4 1 2412 Open Aerohive Networks. Inc.
3 08:EA:44:27:A1:54 6 2437 Open Aerohive Networks. Inc.
4 08:EA:44:27:A7:D4 11 2462 Open Aerohive Networks. Inc.
5 08:EA:44:27:AA:94 11 2462 Open Aerohive Networks. Inc.
6 08:EA:44:27:AA:D4 1 2412 Open Aerohive Networks. Inc.
7 08:EA:44:27:AB:54 6 2437 Open Aerohive Networks. Inc.
8 08:EA:44:27:AC:94 1 2412 Open Aerohive Networks. Inc.
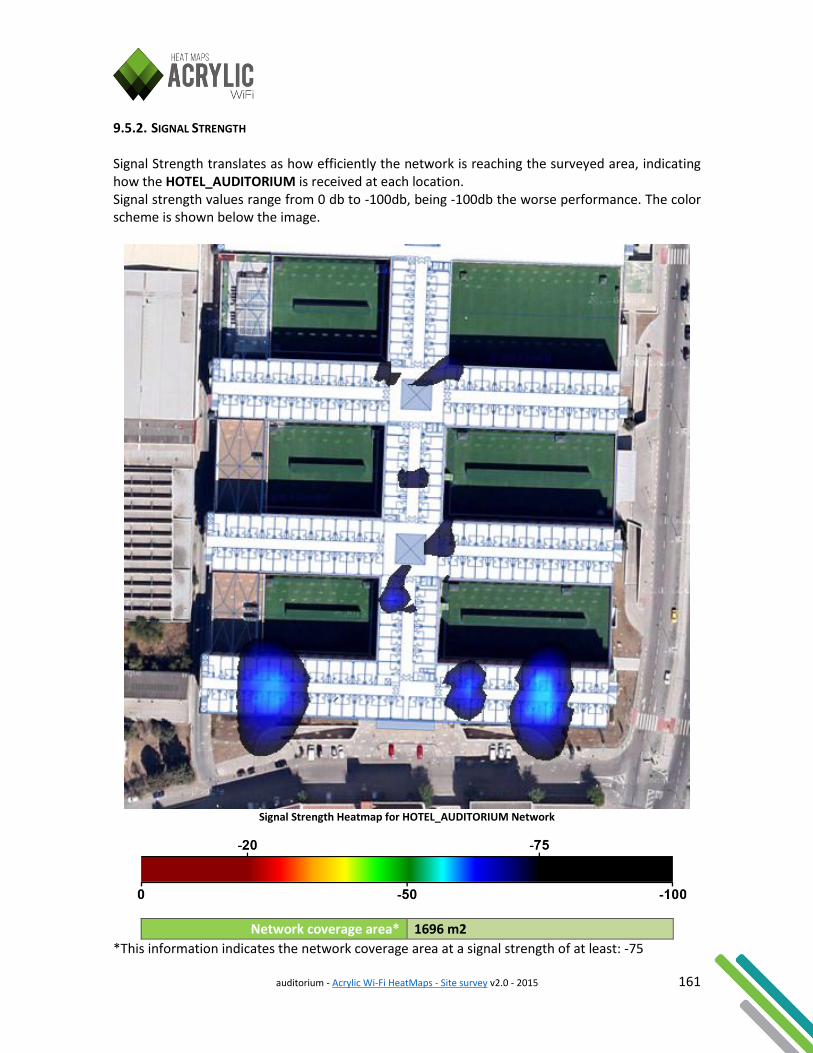
auditorium - Acrylic Wi-Fi HeatMaps - Site survey v2.0 - 2015 161
9.5.2. SIGNAL STRENGTH Signal Strength translates as how efficiently the network is reaching the surveyed area, indicating how the HOTEL_AUDITORIUM is received at each location. Signal strength values range from 0 db to -100db, being -100db the worse performance. The color scheme is shown below the image.
Signal Strength Heatmap for HOTEL_AUDITORIUM Network
Network coverage area* 1696 m2
*This information indicates the network coverage area at a signal strength of at least: -75
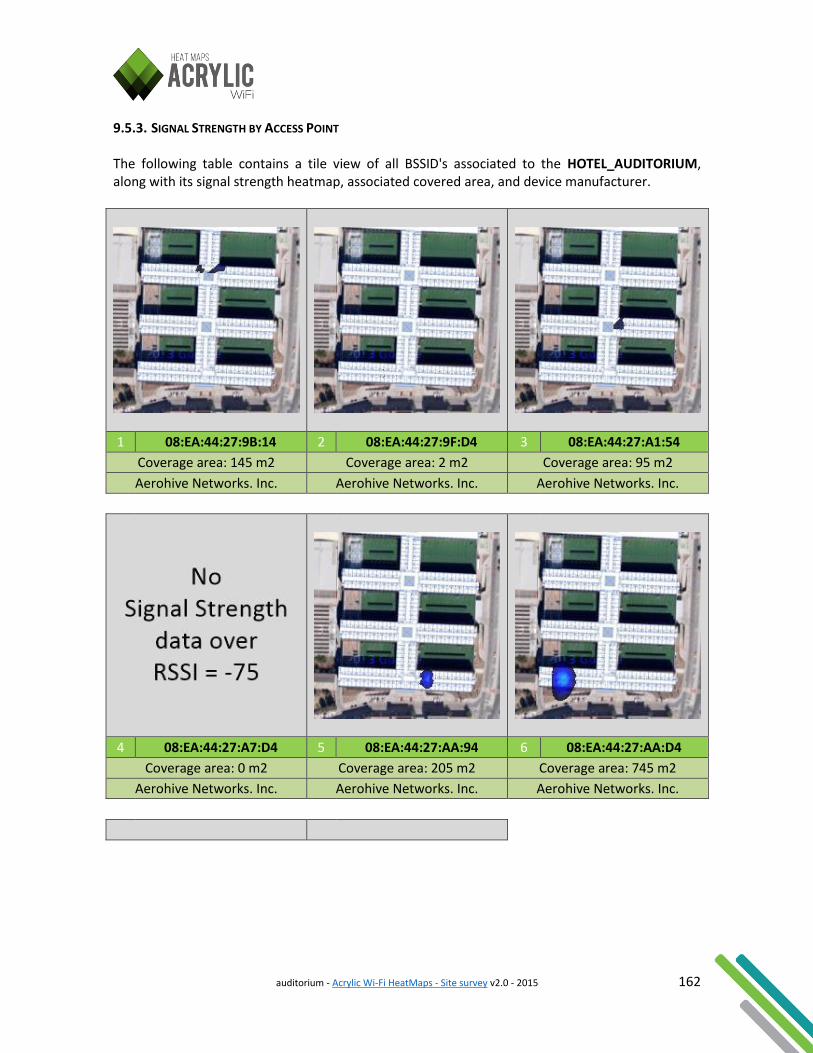
auditorium - Acrylic Wi-Fi HeatMaps - Site survey v2.0 - 2015 162
9.5.3. SIGNAL STRENGTH BY ACCESS POINT The following table contains a tile view of all BSSID's associated to the HOTEL_AUDITORIUM, along with its signal strength heatmap, associated covered area, and device manufacturer.
1 08:EA:44:27:9B:14 2 08:EA:44:27:9F:D4 3 08:EA:44:27:A1:54
Coverage area: 145 m2 Coverage area: 2 m2 Coverage area: 95 m2
Aerohive Networks. Inc. Aerohive Networks. Inc. Aerohive Networks. Inc.
4 08:EA:44:27:A7:D4 5 08:EA:44:27:AA:94 6 08:EA:44:27:AA:D4
Coverage area: 0 m2 Coverage area: 205 m2 Coverage area: 745 m2
Aerohive Networks. Inc. Aerohive Networks. Inc. Aerohive Networks. Inc.
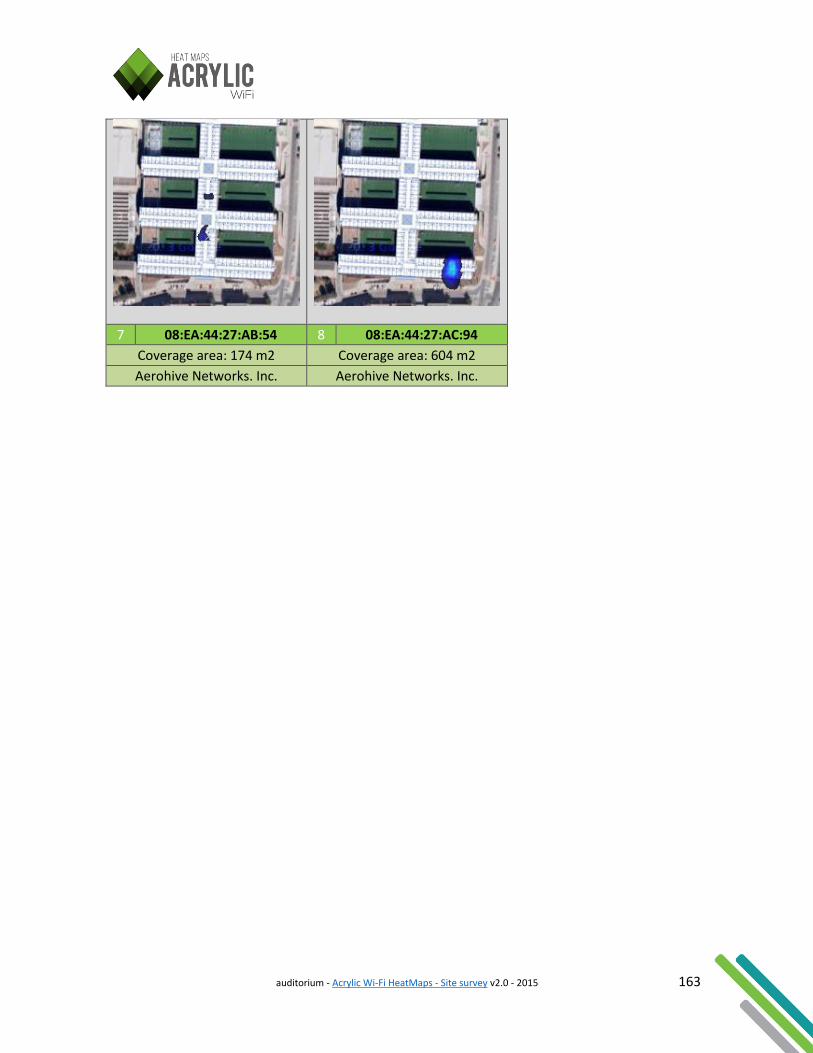
auditorium - Acrylic Wi-Fi HeatMaps - Site survey v2.0 - 2015 163
7 08:EA:44:27:AB:54 8 08:EA:44:27:AC:94
Coverage area: 174 m2 Coverage area: 604 m2
Aerohive Networks. Inc. Aerohive Networks. Inc.
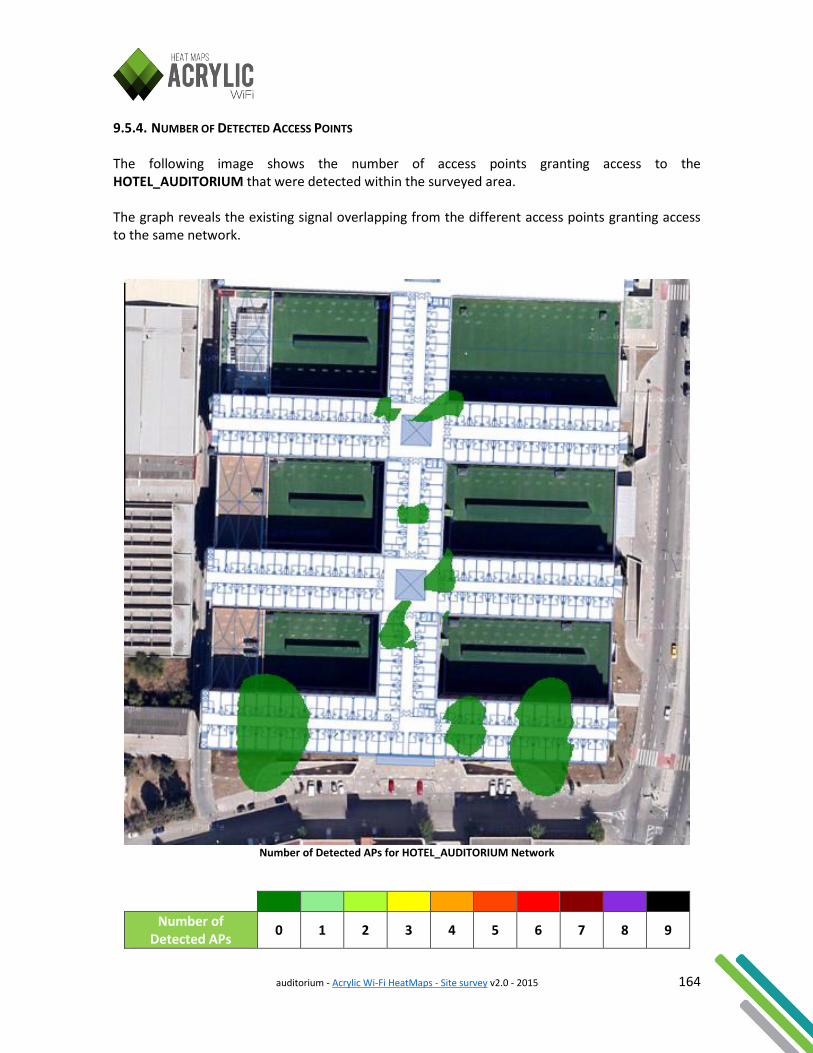
auditorium - Acrylic Wi-Fi HeatMaps - Site survey v2.0 - 2015 164
9.5.4. NUMBER OF DETECTED ACCESS POINTS The following image shows the number of access points granting access to the HOTEL_AUDITORIUM that were detected within the surveyed area. The graph reveals the existing signal overlapping from the different access points granting access to the same network.
Number of Detected APs for HOTEL_AUDITORIUM Network
Number of Detected APs
0 1 2 3 4 5 6 7 8 9
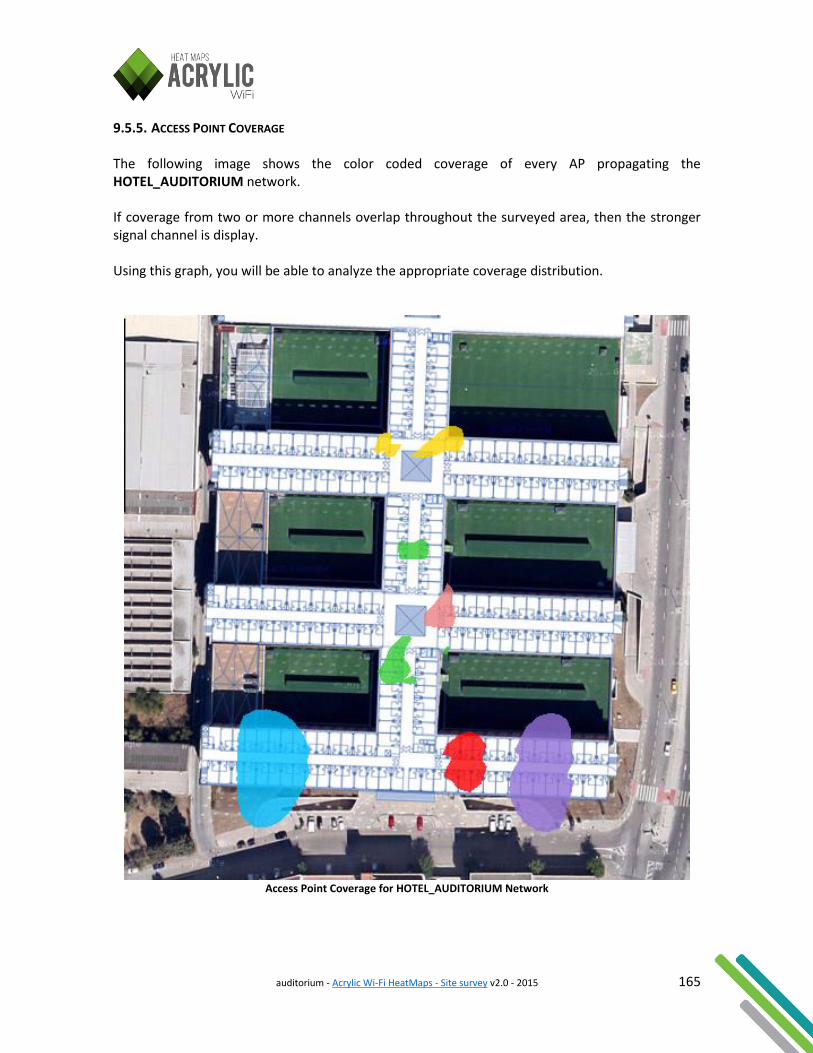
auditorium - Acrylic Wi-Fi HeatMaps - Site survey v2.0 - 2015 165
9.5.5. ACCESS POINT COVERAGE The following image shows the color coded coverage of every AP propagating the HOTEL_AUDITORIUM network. If coverage from two or more channels overlap throughout the surveyed area, then the stronger signal channel is display. Using this graph, you will be able to analyze the appropriate coverage distribution.
Access Point Coverage for HOTEL_AUDITORIUM Network
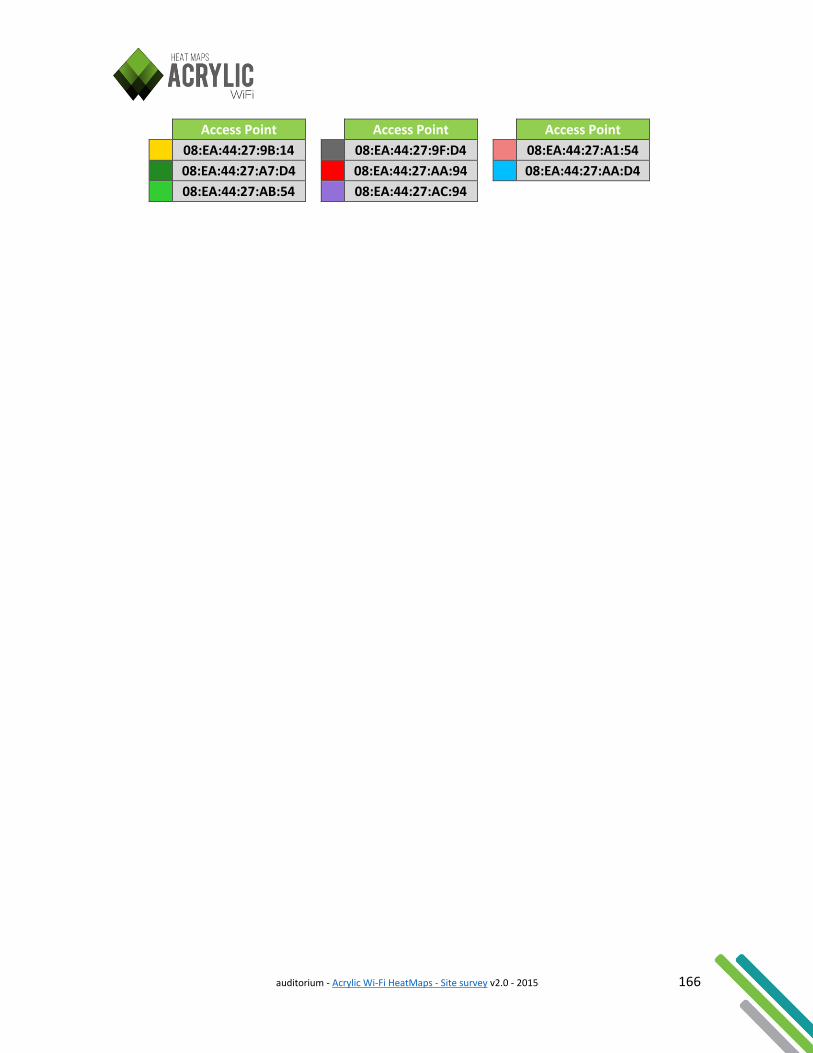
auditorium - Acrylic Wi-Fi HeatMaps - Site survey v2.0 - 2015 166
Access Point Access Point Access Point
08:EA:44:27:9B:14 08:EA:44:27:9F:D4 08:EA:44:27:A1:54
08:EA:44:27:A7:D4 08:EA:44:27:AA:94 08:EA:44:27:AA:D4
08:EA:44:27:AB:54 08:EA:44:27:AC:94
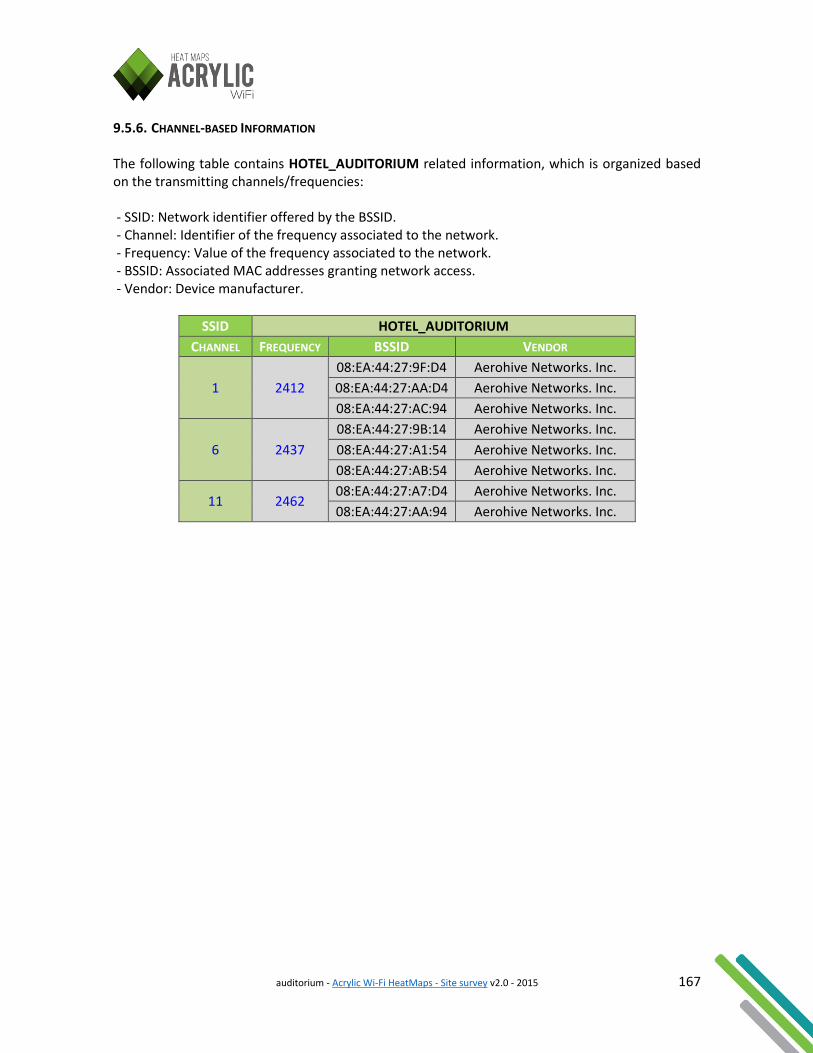
auditorium - Acrylic Wi-Fi HeatMaps - Site survey v2.0 - 2015 167
9.5.6. CHANNEL-BASED INFORMATION The following table contains HOTEL_AUDITORIUM related information, which is organized based on the transmitting channels/frequencies: - SSID: Network identifier offered by the BSSID. - Channel: Identifier of the frequency associated to the network. - Frequency: Value of the frequency associated to the network. - BSSID: Associated MAC addresses granting network access. - Vendor: Device manufacturer.
SSID HOTEL_AUDITORIUM
CHANNEL FREQUENCY BSSID VENDOR
1 2412
08:EA:44:27:9F:D4 Aerohive Networks. Inc.
08:EA:44:27:AA:D4 Aerohive Networks. Inc.
08:EA:44:27:AC:94 Aerohive Networks. Inc.
6 2437
08:EA:44:27:9B:14 Aerohive Networks. Inc.
08:EA:44:27:A1:54 Aerohive Networks. Inc.
08:EA:44:27:AB:54 Aerohive Networks. Inc.
11 2462 08:EA:44:27:A7:D4 Aerohive Networks. Inc.
08:EA:44:27:AA:94 Aerohive Networks. Inc.
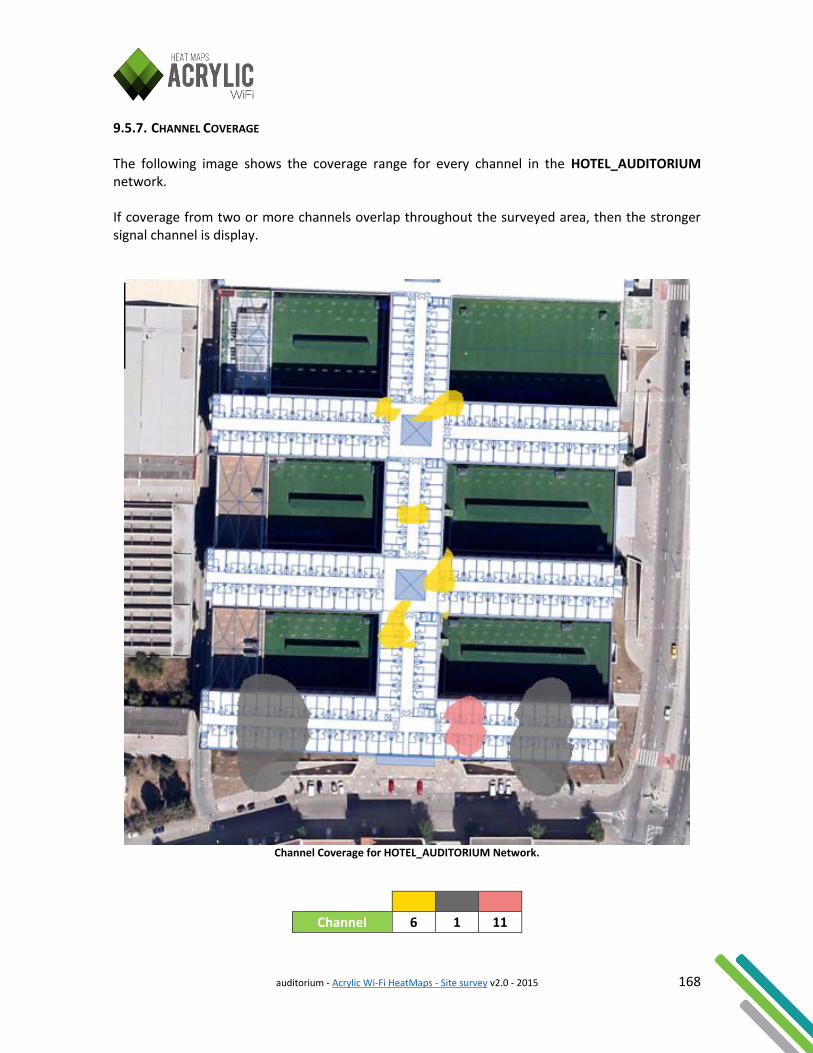
auditorium - Acrylic Wi-Fi HeatMaps - Site survey v2.0 - 2015 168
9.5.7. CHANNEL COVERAGE The following image shows the coverage range for every channel in the HOTEL_AUDITORIUM network. If coverage from two or more channels overlap throughout the surveyed area, then the stronger signal channel is display.
Channel Coverage for HOTEL_AUDITORIUM Network.
Channel 6 1 11
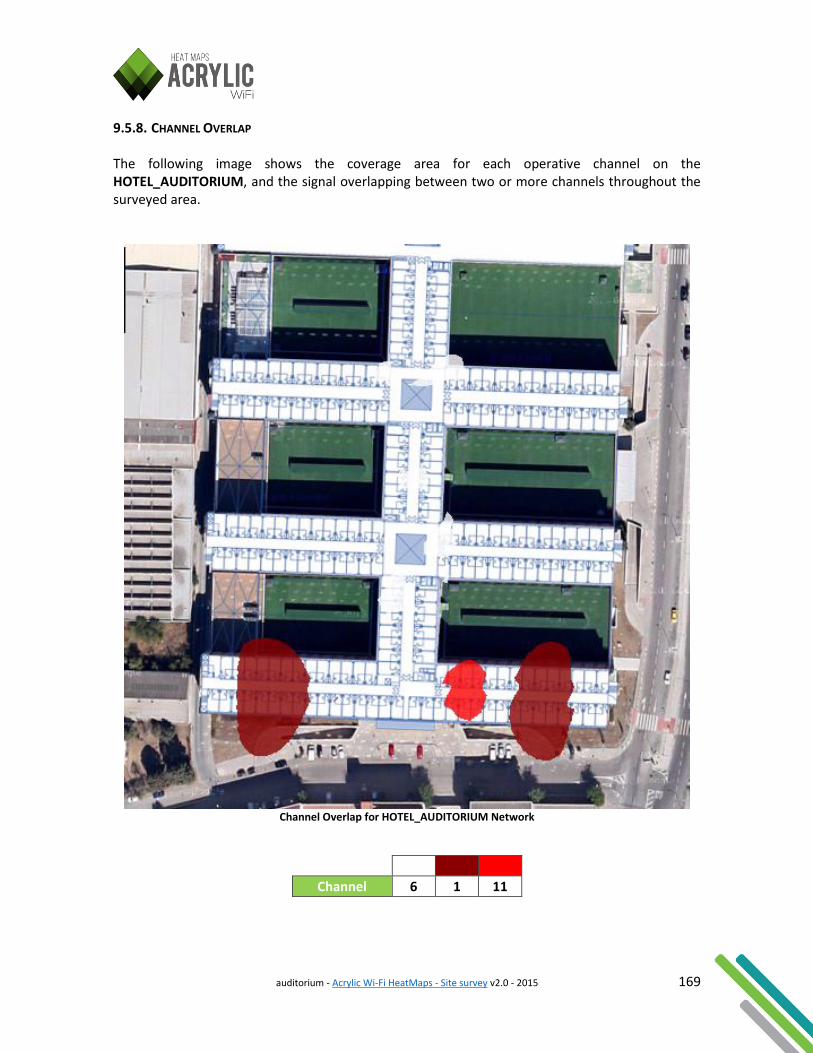
auditorium - Acrylic Wi-Fi HeatMaps - Site survey v2.0 - 2015 169
9.5.8. CHANNEL OVERLAP The following image shows the coverage area for each operative channel on the HOTEL_AUDITORIUM, and the signal overlapping between two or more channels throughout the surveyed area.
Channel Overlap for HOTEL_AUDITORIUM Network
Channel 6 1 11
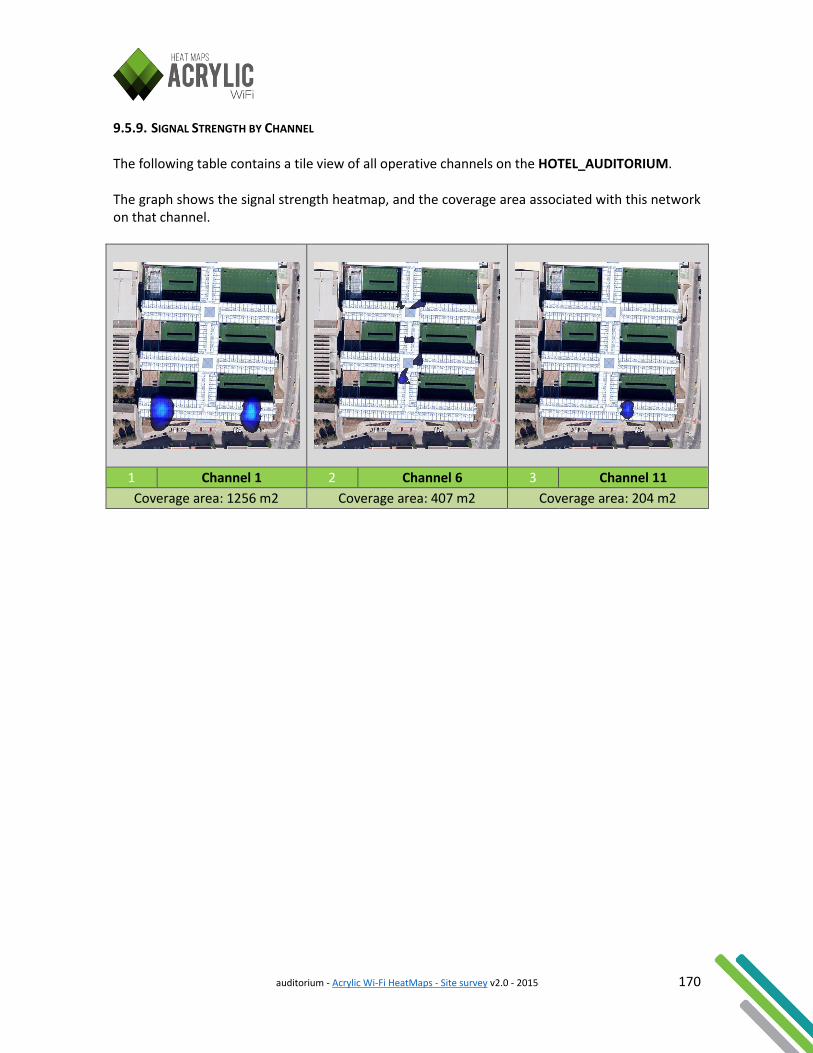
auditorium - Acrylic Wi-Fi HeatMaps - Site survey v2.0 - 2015 170
9.5.9. SIGNAL STRENGTH BY CHANNEL The following table contains a tile view of all operative channels on the HOTEL_AUDITORIUM. The graph shows the signal strength heatmap, and the coverage area associated with this network on that channel.
1 Channel 1 2 Channel 6 3 Channel 11
Coverage area: 1256 m2 Coverage area: 407 m2 Coverage area: 204 m2
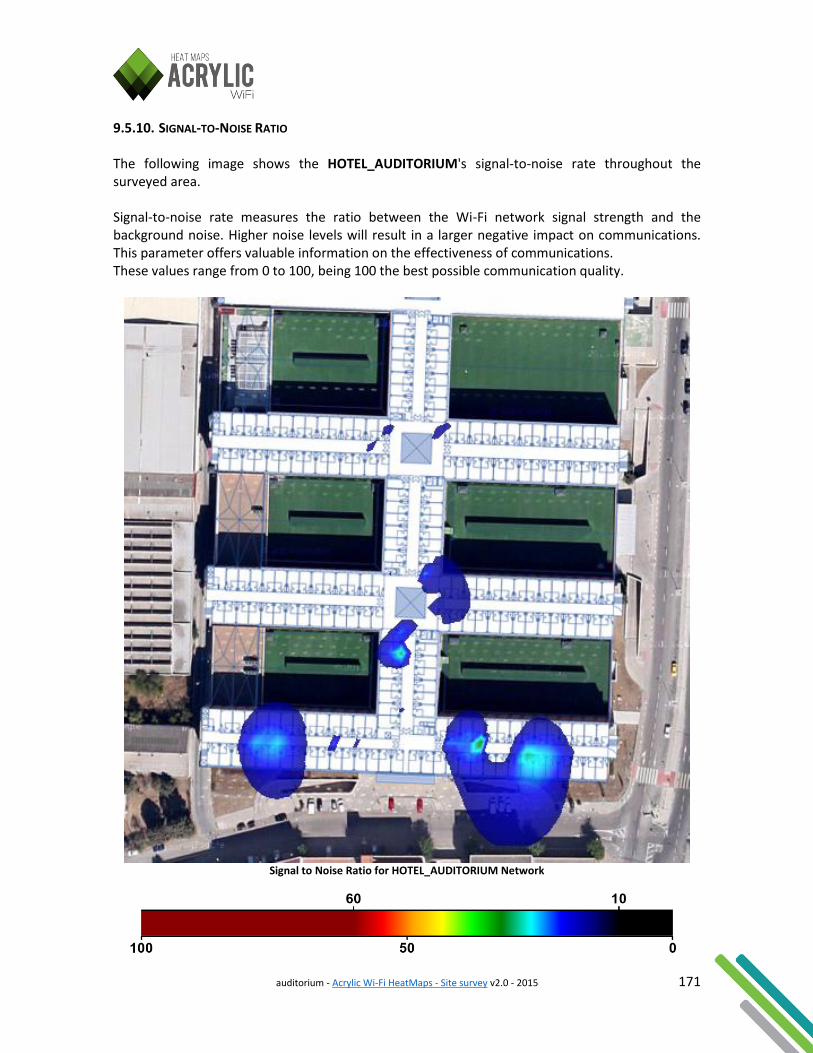
auditorium - Acrylic Wi-Fi HeatMaps - Site survey v2.0 - 2015 171
9.5.10. SIGNAL-TO-NOISE RATIO The following image shows the HOTEL_AUDITORIUM's signal-to-noise rate throughout the surveyed area. Signal-to-noise rate measures the ratio between the Wi-Fi network signal strength and the background noise. Higher noise levels will result in a larger negative impact on communications. This parameter offers valuable information on the effectiveness of communications. These values range from 0 to 100, being 100 the best possible communication quality.
Signal to Noise Ratio for HOTEL_AUDITORIUM Network
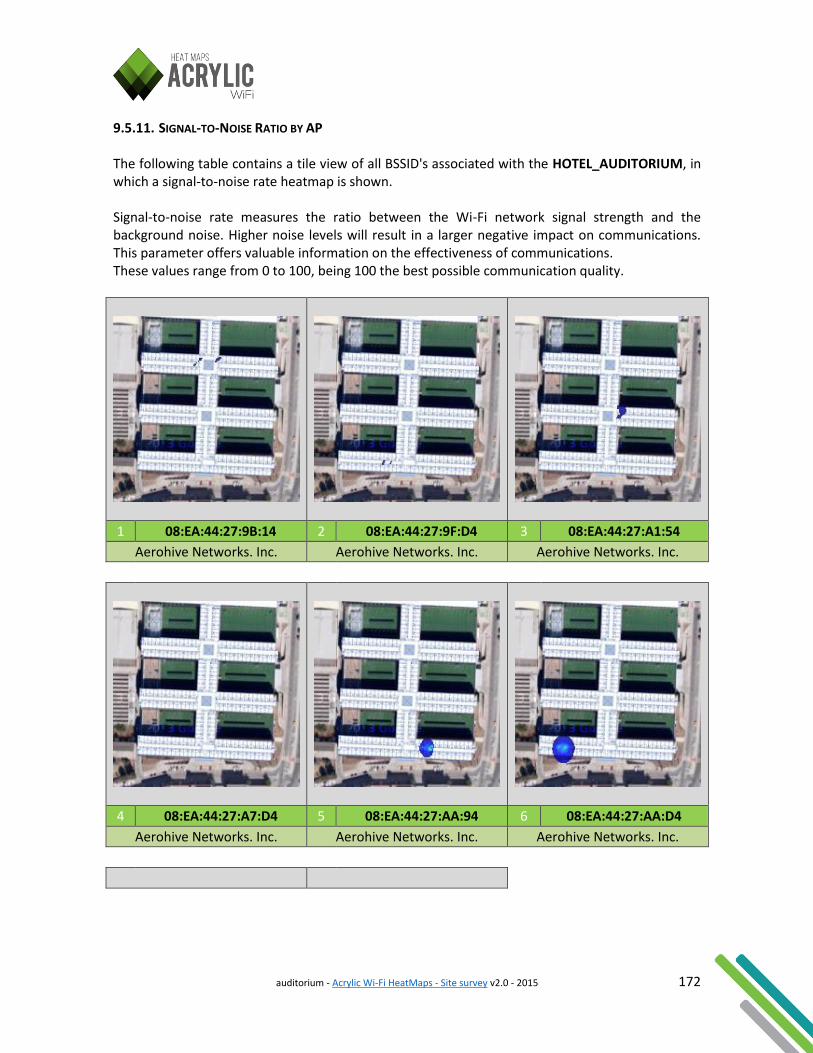
auditorium - Acrylic Wi-Fi HeatMaps - Site survey v2.0 - 2015 172
9.5.11. SIGNAL-TO-NOISE RATIO BY AP The following table contains a tile view of all BSSID's associated with the HOTEL_AUDITORIUM, in which a signal-to-noise rate heatmap is shown. Signal-to-noise rate measures the ratio between the Wi-Fi network signal strength and the background noise. Higher noise levels will result in a larger negative impact on communications. This parameter offers valuable information on the effectiveness of communications. These values range from 0 to 100, being 100 the best possible communication quality.
1 08:EA:44:27:9B:14 2 08:EA:44:27:9F:D4 3 08:EA:44:27:A1:54
Aerohive Networks. Inc. Aerohive Networks. Inc. Aerohive Networks. Inc.
4 08:EA:44:27:A7:D4 5 08:EA:44:27:AA:94 6 08:EA:44:27:AA:D4
Aerohive Networks. Inc. Aerohive Networks. Inc. Aerohive Networks. Inc.

auditorium - Acrylic Wi-Fi HeatMaps - Site survey v2.0 - 2015 173
7 08:EA:44:27:AB:54 8 08:EA:44:27:AC:94
Aerohive Networks. Inc. Aerohive Networks. Inc.
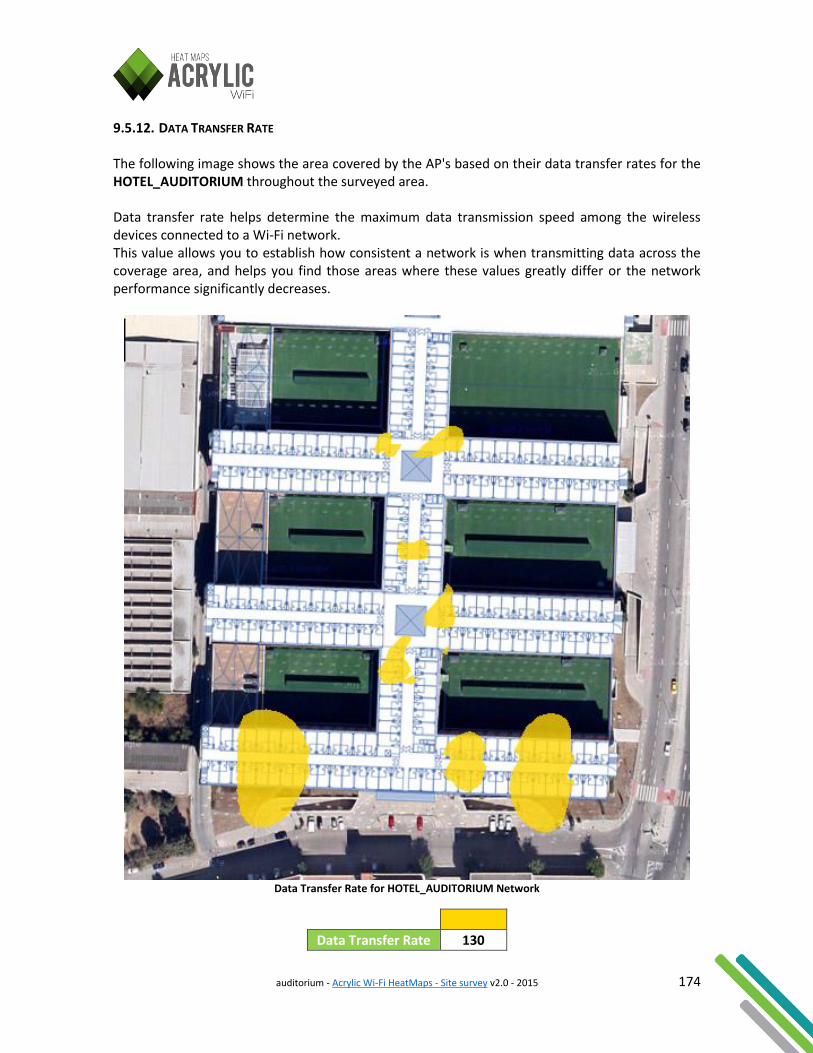
auditorium - Acrylic Wi-Fi HeatMaps - Site survey v2.0 - 2015 174
9.5.12. DATA TRANSFER RATE The following image shows the area covered by the AP's based on their data transfer rates for the HOTEL_AUDITORIUM throughout the surveyed area. Data transfer rate helps determine the maximum data transmission speed among the wireless devices connected to a Wi-Fi network. This value allows you to establish how consistent a network is when transmitting data across the coverage area, and helps you find those areas where these values greatly differ or the network performance significantly decreases.
Data Transfer Rate for HOTEL_AUDITORIUM Network
Data Transfer Rate 130
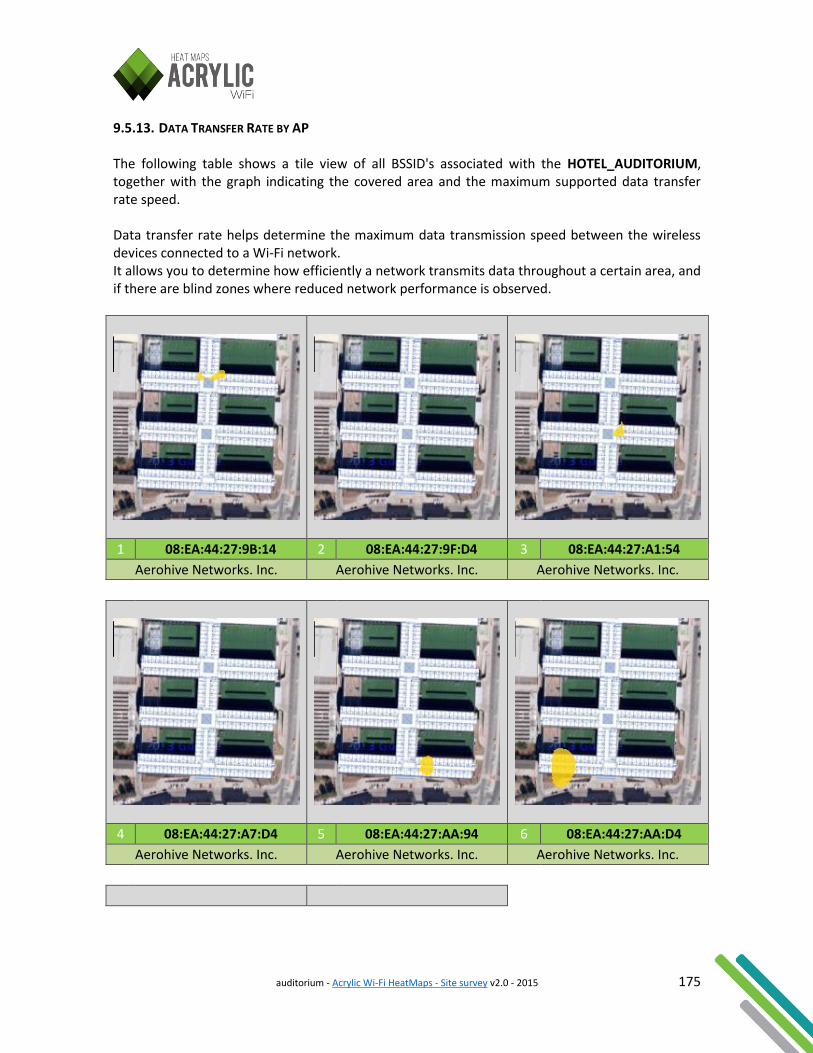
auditorium - Acrylic Wi-Fi HeatMaps - Site survey v2.0 - 2015 175
9.5.13. DATA TRANSFER RATE BY AP The following table shows a tile view of all BSSID's associated with the HOTEL_AUDITORIUM, together with the graph indicating the covered area and the maximum supported data transfer rate speed. Data transfer rate helps determine the maximum data transmission speed between the wireless devices connected to a Wi-Fi network. It allows you to determine how efficiently a network transmits data throughout a certain area, and if there are blind zones where reduced network performance is observed.
1 08:EA:44:27:9B:14 2 08:EA:44:27:9F:D4 3 08:EA:44:27:A1:54
Aerohive Networks. Inc. Aerohive Networks. Inc. Aerohive Networks. Inc.
4 08:EA:44:27:A7:D4 5 08:EA:44:27:AA:94 6 08:EA:44:27:AA:D4
Aerohive Networks. Inc. Aerohive Networks. Inc. Aerohive Networks. Inc.

auditorium - Acrylic Wi-Fi HeatMaps - Site survey v2.0 - 2015 176
7 08:EA:44:27:AB:54 8 08:EA:44:27:AC:94
Aerohive Networks. Inc. Aerohive Networks. Inc.
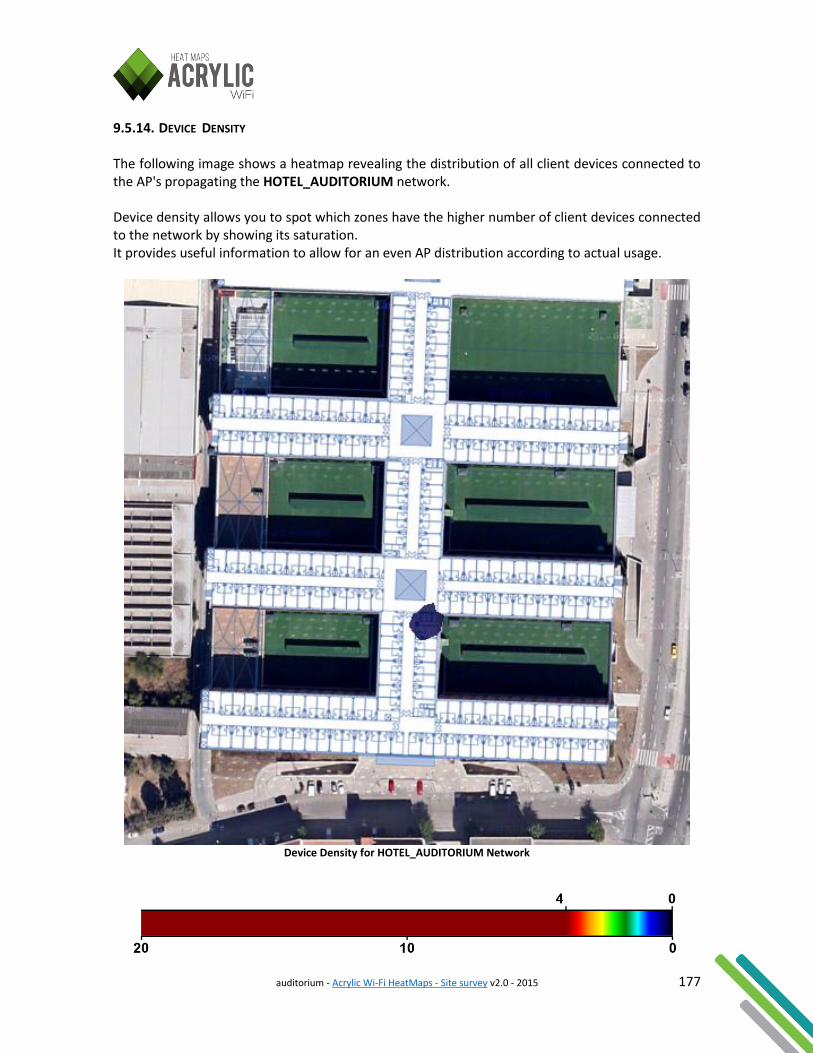
auditorium - Acrylic Wi-Fi HeatMaps - Site survey v2.0 - 2015 177
9.5.14. DEVICE DENSITY The following image shows a heatmap revealing the distribution of all client devices connected to the AP's propagating the HOTEL_AUDITORIUM network. Device density allows you to spot which zones have the higher number of client devices connected to the network by showing its saturation. It provides useful information to allow for an even AP distribution according to actual usage.
Device Density for HOTEL_AUDITORIUM Network
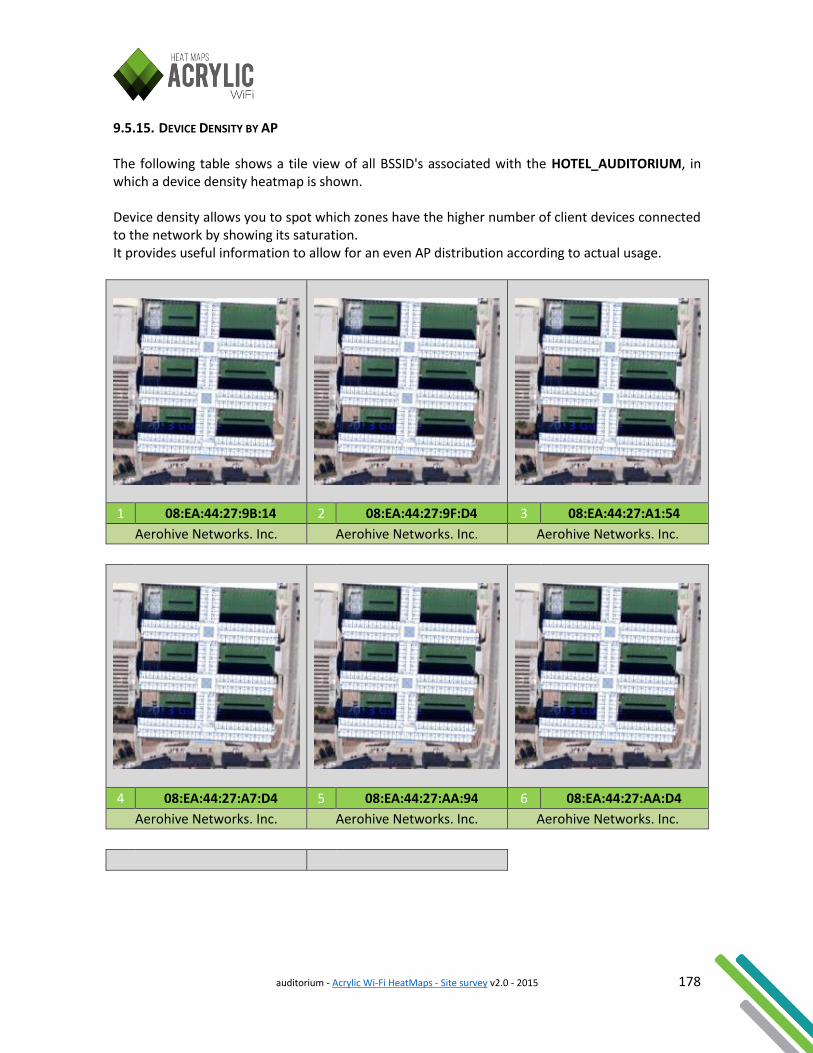
auditorium - Acrylic Wi-Fi HeatMaps - Site survey v2.0 - 2015 178
9.5.15. DEVICE DENSITY BY AP The following table shows a tile view of all BSSID's associated with the HOTEL_AUDITORIUM, in which a device density heatmap is shown. Device density allows you to spot which zones have the higher number of client devices connected to the network by showing its saturation. It provides useful information to allow for an even AP distribution according to actual usage.
1 08:EA:44:27:9B:14 2 08:EA:44:27:9F:D4 3 08:EA:44:27:A1:54
Aerohive Networks. Inc. Aerohive Networks. Inc. Aerohive Networks. Inc.
4 08:EA:44:27:A7:D4 5 08:EA:44:27:AA:94 6 08:EA:44:27:AA:D4
Aerohive Networks. Inc. Aerohive Networks. Inc. Aerohive Networks. Inc.
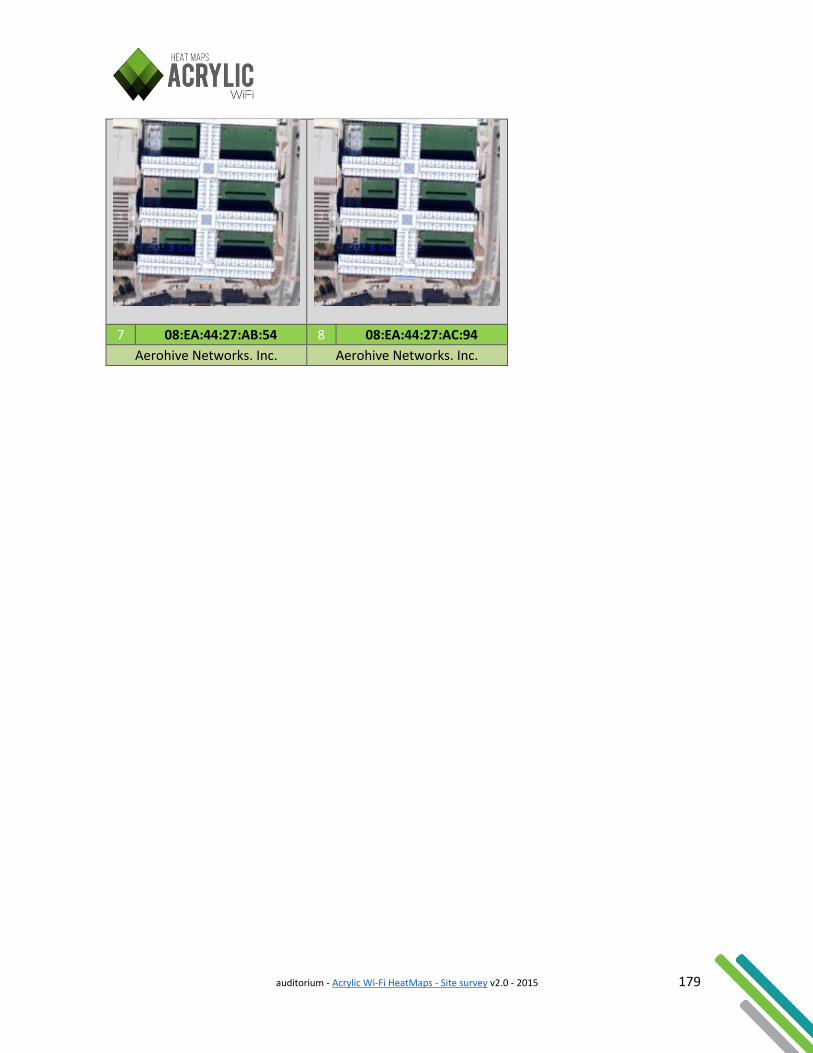
auditorium - Acrylic Wi-Fi HeatMaps - Site survey v2.0 - 2015 179
7 08:EA:44:27:AB:54 8 08:EA:44:27:AC:94
Aerohive Networks. Inc. Aerohive Networks. Inc.
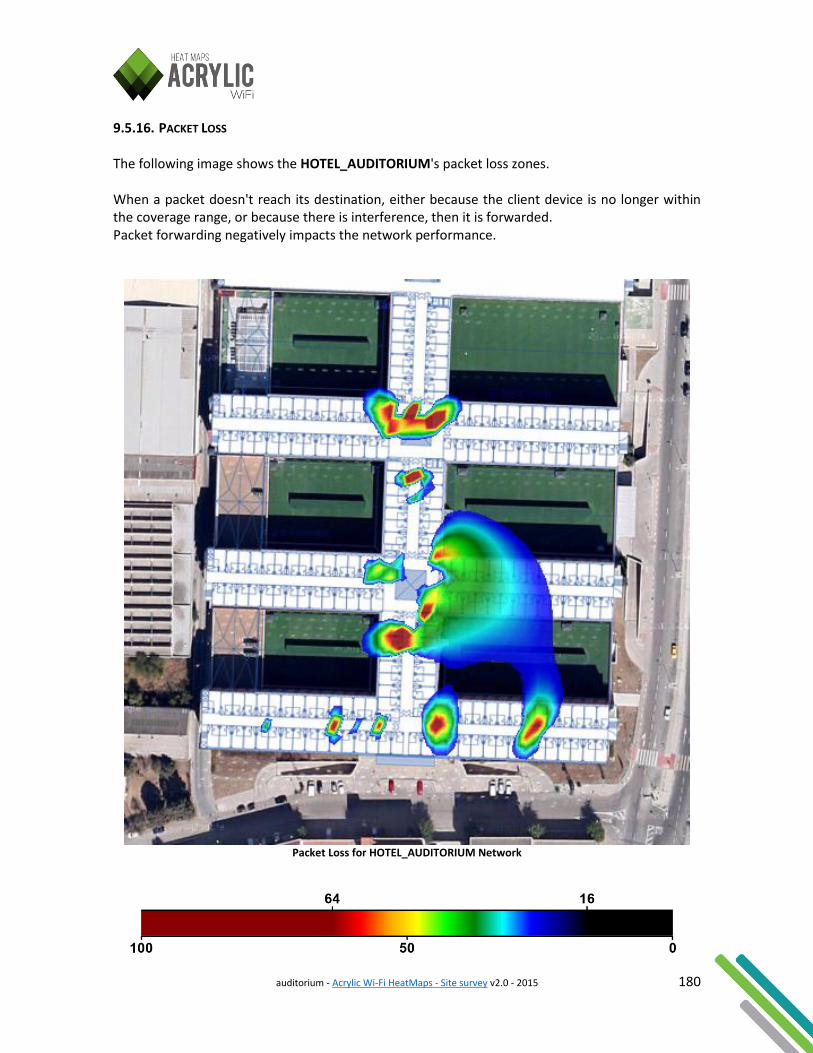
auditorium - Acrylic Wi-Fi HeatMaps - Site survey v2.0 - 2015 180
9.5.16. PACKET LOSS The following image shows the HOTEL_AUDITORIUM's packet loss zones. When a packet doesn't reach its destination, either because the client device is no longer within the coverage range, or because there is interference, then it is forwarded. Packet forwarding negatively impacts the network performance.
Packet Loss for HOTEL_AUDITORIUM Network
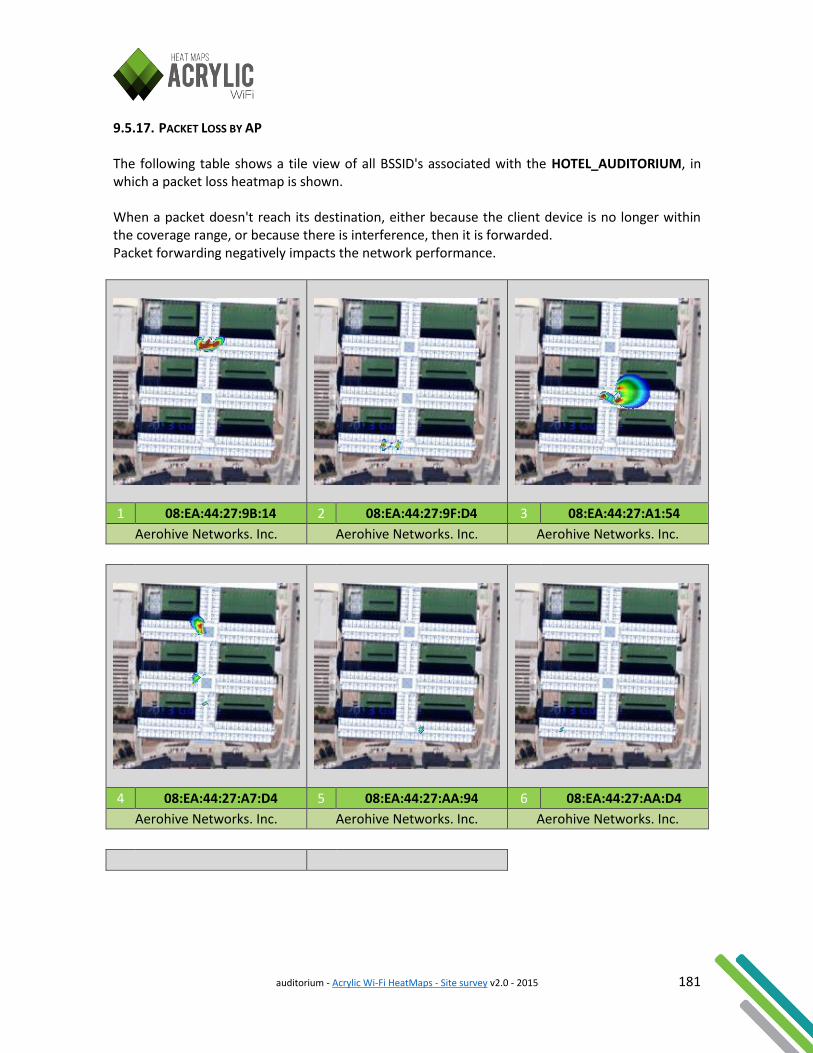
auditorium - Acrylic Wi-Fi HeatMaps - Site survey v2.0 - 2015 181
9.5.17. PACKET LOSS BY AP The following table shows a tile view of all BSSID's associated with the HOTEL_AUDITORIUM, in which a packet loss heatmap is shown. When a packet doesn't reach its destination, either because the client device is no longer within the coverage range, or because there is interference, then it is forwarded. Packet forwarding negatively impacts the network performance.
1 08:EA:44:27:9B:14 2 08:EA:44:27:9F:D4 3 08:EA:44:27:A1:54
Aerohive Networks. Inc. Aerohive Networks. Inc. Aerohive Networks. Inc.
4 08:EA:44:27:A7:D4 5 08:EA:44:27:AA:94 6 08:EA:44:27:AA:D4
Aerohive Networks. Inc. Aerohive Networks. Inc. Aerohive Networks. Inc.
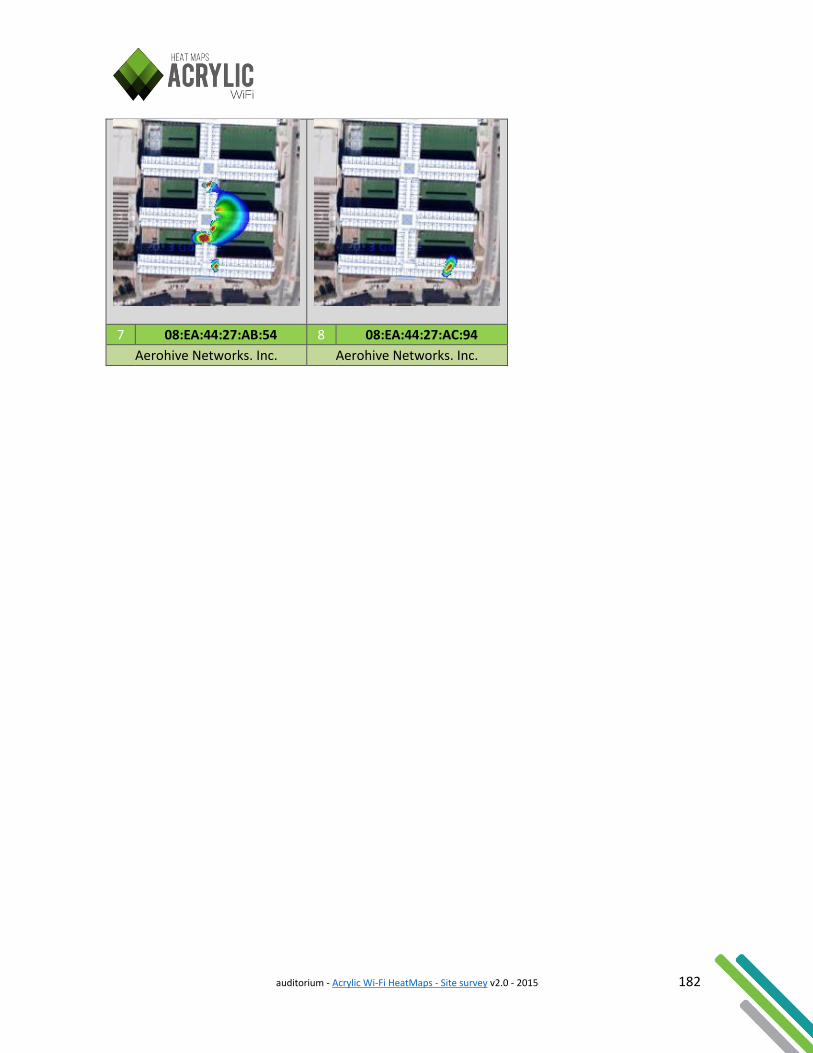
auditorium - Acrylic Wi-Fi HeatMaps - Site survey v2.0 - 2015 182
7 08:EA:44:27:AB:54 8 08:EA:44:27:AC:94
Aerohive Networks. Inc. Aerohive Networks. Inc.
auditorium - Acrylic Wi-Fi HeatMaps - Site survey v2.0 - 2015 183
10. WIFI SITE SURVEY SOFTWARE This WiFi site survey report was performed with Acrylic WiFi heatmaps. Download your free fully working trial versión at https://www.acrylicwifi.com/en/wlan-software/wireless-coverage-acrylic-wifi-heat-maps-site-survey/