widely tunable rapid-scanning mid-infrared laser spectrometer for industrial gas process stream...
TRANSCRIPT

Widely tunable rapid-scanning mid-infrared laserspectrometer for industrial gas process stream analysis
Douglas J. Bamford,* David J. Cook, Scott J. Sharpe, and Aaron D. Van PeltPhysical Sciences, Incorporated, 2110 Omega Road, Suite D, San Ramon, California, 94583-1295
*Corresponding author: [email protected]
Received 3 October 2006; accepted 23 January 2007;posted 7 February 2007 (Doc. ID 75654); published 12 June 2007
A mid-infrared spectrometer with a tuning range of �400 cm�1 in the C–H stretching region of thespectrum has been designed and constructed. The spectrometer is based on the difference-frequencygeneration of two tunable diode lasers in periodically poled lithium niobate waveguides. Tuning isachieved by varying a single parameter, the wavelength of one of the near-infrared input lasers. Theinstrument can be tuned over the entire tuning range in less than 1 s. By taking advantage of the widetuning range, the instrument has been used to analyze a mixture of methane, ethylene, and propylene.Each of these major components was measured with an accuracy of better than 2% (where the error isdefined as a percentage of the measured value) in a single 30 s long scan. When optimized, the spec-trometer has the potential to meet both the performance requirements and the practical requirementsfor real-time process control in petrochemical manufacturing. The general principles for the design ofmid-infrared spectrometers with wide tuning ranges are explained, including the use of variablewaveguide fabrication recipes to create broad phase-matching resonances (which lead to broad tuning) inthe desired location. © 2007 Optical Society of America
OCIS codes: 120.6200, 190.2620.
1. Introduction
Tunable, narrowband mid-infrared radiation is use-ful for a variety of gas sensing applications, especiallythe detection of trace gases. A commonly used methodfor generating this radiation, in a manner that iscompatible with the construction of portable instru-ments, is to use the difference-frequency generationof two near-infrared solid-state lasers in a suitablenonlinear optical material. Periodically poled lithiumniobate (PPLN) has proved to be a particularly usefulnonlinear optical material because its high nonlinearoptical coefficient allows it to be used with cw la-sers with relatively low peak powers. Spectrometersbased on difference-frequency generation (DFG) inPPLN have been used in a number of highly success-ful demonstrations of trace gas detection [1–3]. Thesemeasurements are often based on repeated scans ofthe laser through a single transition of the targetspecies.
For some applications, a different type of measure-ment is required: the rapid, quantitative measure-ment of the major components of a gas mixture.Because the measurement requirements are differ-ent, a spectrometer with a different set of propertiesis needed. This work was motivated by the need tomeasure the end products of a petrochemical process,hydrocarbon cracking. By measuring the concentra-tions of three key components (methane, ethylene,and propylene) and by using the results to calculatetwo ratios (methane�propylene and propylene�ethyl-ene) it is possible to monitor the extent of the crack-ing process and to make appropriate adjustments tooptimize the product yield when conditions changeinside the furnace [4,5]. Although near-infrared spec-troscopy has been proposed as a means of makingthese measurements [4], the spectral features of thetarget gases in the near infrared are not distinctenough to permit accurate enough speciation. Themost commonly used technique for monitoring theproducts of hydrocarbon cracking is gas chromatog-raphy, which does not allow the process to be con-trolled in real time because samples must be taken to
0003-6935/07/193958-11$15.00/0© 2007 Optical Society of America
3958 APPLIED OPTICS � Vol. 46, No. 19 � 1 July 2007

a remote location. In the mid-infrared region of thespectrum (near 3000 cm�1), the spectral signatures ofthe target gases are distinct enough to permit accu-rate speciation. Therefore a diode-laser-based mid-infrared spectrometer with a wide tuning rangecentered near 3000 cm�1 has the potential to providethe information needed for real-time process control.
In general, the tuning range of a DFG-based spec-trometer is limited by the width of the phase-matching resonance. This limitation can be overcomeby mechanisms such as temperature tuning, or usinga fan-out PPLN structure [2], but these methods aretoo slow for the petrochemical process control appli-cation. Broad phase-matching resonances (leading tobroad tuning ranges) were observed in some of theearliest spectrometers based on DFG in bulk PPLN[6] and more recently in a device based on DFG inridge waveguides [7]. Annealed-proton exchange (APE)waveguides are an attractive alternative to bulkPPLN chips or ridge-waveguide chips because theyoffer an additional degree of freedom (the waveguidefabrication recipe), which can be used to shift theposition of the broad phase-matching resonance tothe desired location, thus allowing the spectral regionof interest to be covered using a commercially avail-able, widely tunable near-infrared laser as the tuningelement.
We describe the design, construction, and evalu-ation of a widely tunable spectrometer based onDFG in APE waveguides in PPLN. Section 2 de-scribes the theory behind the existence of broadphase-matching resonances in a manner that showshow one would go about designing a broadly tunablespectrometer centered at any mid-infrared wave-length within the transparency range of lithiumniobate. Section 3 describes the procedures used todesign the waveguides, explaining in detail how theposition of the broad phase-matching resonancewas engineered, and briefly describes the proce-dures used to fabricate the waveguides. Section 4describes the laser spectrometer, gives its key per-formance parameters, and explains how it was usedto characterize the waveguides and record the spec-tra of hydrocarbons. The experimental results, in-cluding measurements on a calibrated mixture ofhydrocarbons, are detailed in Section 5. A discus-sion of the results is given in Section 6, followed bya summary in Section 7.
2. Theory of Broad Phase-Matching Resonances
To generate broadly tunable mid-infrared radiationcentered around a given mid-infrared output wave-length (called the idler wavelength) using DFG, theinput wavelengths (the pump and signal wavelengths)must be properly chosen. In principle, many differentcombinations of pump and signal wavelengths canproduce a given idler wavelength. However, there arecertain pump�signal combinations that can be usedto generate tunable radiation with a very large tun-ing range. This broad tuning range results from afortuitous cancellation of terms in the expression
for phase matching in PPLN. The phase mismatchfor a quasi-phase-matched DFG interaction, �k, isgiven by
�k � 2��N3�3 � N2�2 � N1�1 �1��, (1)
where N is the effective index of refraction for thewaveguide mode, ��1 is the wavelength, and � is thequasi-phase-matching (QPM) period. (The subscripts3, 2, and 1 refer to the pump, signal, and idler beams,respectively.) For any given set of interaction wave-lengths, the value of �k can always be set to zerothrough a proper choice of the QPM period. At thisvalue of �, tuning over a certain phase-matchingbandwidth can be achieved by changing the signalfrequency, while keeping the pump frequency fixed.The phase-matching bandwidth will be particularlylarge if
���k���2
� 0, (2)
since the phase-matching condition will (to first or-der) not depend on the frequency of the laser beingtuned. The pump, signal, and idler frequencies areconstrained by the following conservation-of-energyequation:
�1 �2 � �3. (3)
Equations (1)–(3) can be combined to yield the follow-ing equation:
N1 �1
�N1
��1� N2 �2
�N2
��2. (4)
The quantities on either side of Eq. (4) are the groupindices of refraction at the respective frequencies.Therefore when the signal laser is being tuned, broadphase matching is achieved when the group indices atthe signal and idler frequencies are equal to eachother.
Equation (4) can be generalized to cover bulk in-teractions by replacing the N, the effective index ofthe waveguide mode, by n, the bulk index of refrac-tion. For bulk DFG, Eq. (4) can be solved numericallyusing the published Sellmeier equations (expressingn as a function of �) for lithium niobate [8]. For anygiven mid-infrared frequency, there is one signal fre-quency at which Eq. (4) is satisfied. Thus if we havea broadly tunable laser source centered at that signalfrequency, and an appropriate fixed-frequency pumplaser, we can produce broadly tunable mid-infraredradiation centered about the chosen idler frequency.
A DFG device in which the signal and idler wave-lengths are nearly the same (i.e., one operating neardegeneracy) will always satisfy Eq. (4). However, it ispossible to satisfy this equation when operating farfrom the degeneracy point.
1 July 2007 � Vol. 46, No. 19 � APPLIED OPTICS 3959

One can also achieve broad tuning for a DFG spec-trometer in which the pump laser is tuned, while thesignal frequency is fixed. Using the same line of rea-soning described above, broad tuning is achievedwhen the following equation is satisfied:
N1 �1
�N1
��1� N3 �3
�N3
��3. (5)
Equation (5) has the same form as Eq. (4), the onlydifference being the change in the subscripts on theright-hand side of the equation. Therefore when thepump laser is being tuned, broad phase matching isachieved when the group indices at the pump andidler frequencies are equal to each other.
If a broadly tunable laser is available centered atthe signal frequency, which satisfies Eq. (4), thenbroadly tunable idler radiation centered at the targetidler frequency can be produced. Any tunable laserthat satisfies Eq. (4), when it is used as the signallaser, will also satisfy Eq. (5) when it is used as thepump laser. This means that for any given idler fre-quency it is possible to achieve broad tuning usingtwo different combinations of pump and signal fre-quencies (or, equivalently, two different combina-tions of pump and signal wavelengths). In both cases,the laser that satisfies Eq. (4) or Eq. (5) is tuned. Thisconcept is summarized in Fig. 1, which shows thewavelength combinations that can be used forbroadly tunable mid-infrared generation as a func-tion of the target mid-infrared frequency.
As can be seen by the form of Eqs. (4) and (5), theposition of the broad phase-matching resonance is asensitive function of the dispersion of the nonlinearoptical material. Because waveguide devices have dif-ferent dispersion than do bulk devices, the position ofthe broad phase-matching resonance will changewhen making the transition from bulk to waveguidedevices. Moreover, the position of the broad phase-matching resonance can be tuned by changing thewaveguide fabrication recipe. This is a degree of free-dom that is not available to devices based on bulkDFG, including the original broadly tunable devicedemonstrated by Goldberg and co-workers [6]. De-vices based on ridge waveguides have also exhibited
wide tunability [7], but also do not have the samedegree of freedom available to them.
3. Waveguide Design and Fabrication
Before the results for broad tuning in waveguide de-vices can be presented, it is necessary to describe howthe waveguide devices were fabricated and designed.
A. Basic Fabrication Procedures
Prior to waveguide fabrication, periodic poling wascarried out on 3 in. (7.6 cm) diameter wafers usingprocedures that have been described previously [9]. Alayer of patterned photoresist was produced on theplus Z surface, then covered with a chrome�gold over-coat. A pulse of high voltage was applied to pro-duce patterned domain inversion. After stripping themetal and photoresist, the minus Z surface of thewafer was etched to reveal the domain pattern andproduce features that could be used to align thewaveguide mask.
The basic steps involved in the formation of planarAPE waveguides have been described in the litera-ture [10,11]. The details particular to our setup areincluded here. For proton exchange, the chips wereplaced in a test tube and covered with benzoic acidpowder at room temperature. The test tube was thenimmersed in a temperature-controlled, circulating-oilbath. When the exchange was finished the test tubewas removed from the oil bath. The liquid benzoicacid was poured away and the chip allowed to coolslowly to room temperature. Annealing was carriedout by placing the chips on a machined aluminumplate, into which was embedded a NIST-traceableresistance temperature detector (RTD) with an abso-lute accuracy of 0.3 °C. An aluminum cover wasplaced over the plate (leaving a small air gap abovethe plus Z surface of the chip), and the assembly wasplaced in a muffle furnace that was programmed toramp the temperature up to the annealing tempera-ture over 4 h, hold the temperature fixed at the an-nealing temperature for a prescribed period of time,and then cool back to room temperature over 15–20 h.
For channel waveguide fabrication, the basic stepswere the same, with one difference: The plus Z sur-face of the wafer was covered with patterned silicondioxide. To form this pattern, a 0.2 m thick layer ofSiO2 was formed by sputtering on a periodically poledwafer. This layer was then covered with a photore-sist, and the photoresist was patterned using a pho-tolithographic mask. Reactive ion etching, with acalibrated etch rate, was used to remove the exposedSiO2 without cutting significantly into the substrate.
B. Computer Model of Annealed-Proton ExchangeProcess
Important parameters in the fabrication of waveguidesinclude the exchange time, exchange temperature, an-neal time, anneal temperature, and channel width.Because the parameter space represented by thesevariables is large, it is useful to perform numericalmodeling to guide the development of waveguide fab-rication recipes. The procedure for numerical modeling
Fig. 1. Calculated wavelength combinations that can be used toproduce broadly tunable mid-infrared radiation centered at a givenmid-infrared frequency in bulk DFG.
3960 APPLIED OPTICS � Vol. 46, No. 19 � 1 July 2007
followed the basic approach outlined by Bortz andFejer [11] and refined more recently by Roussev andco-workers [12]. This approach deals empirically withthe complexities of concentration-dependent diffusionin the HxLi1�xNbO3 system. After proton exchange, aconcentration gradient is established between thesurface and the position of an abrupt decrease protonconcentration. The position of this abrupt step iscalled the exchange depth. As has been shown previ-ously [13], concentration profiles of this type can beobtained in systems that consist of two phases: ahigh-concentration phase in which diffusion is fastand a low-concentration phase in which diffusion isslow. After a very brief period of annealing, the sys-tem evolves to a state in which the concentrationprofile is steplike. The position of the step is referredto as the soft-anneal depth [12]. The soft-annealdepth has been found empirically to be �1.6 times aslarge as the exchange depth for proton exchange inbenzoic acid. Using the steplike profile as a startingpoint, the concentration-dependent diffusion of pro-tons within the low-concentration phase is modeledempirically. The equation used to model the concen-tration dependence of the diffusion coefficient is
D�C, T� � D�T��� �1 � ��
��C ��, (6)
where C is a dimensionless number proportional tothe value of x in HxLi1�xNbO3, �, �, and � are empir-ically determined dimensionless constants, and D(T)is a temperature-dependent diffusion coefficient. Thevalue of C is assumed equal to unity at the surfaceafter soft annealing. The following values, taken fromthe work of Roussev et al. [12], are used for the di-mensionless constants: � � 0.08, � � 35, � 0.065.The value of D(T) was determined empirically at onetemperature when the model was validated experi-mentally, as described below. The resulting value ofD(T) was 0.721 m2�h at a temperature of 330 °C.
To relate concentration profiles to index profiles,the relationship between local proton concentrationand local refractive index must be known. The indexstep at a given wavelength is assumed to dependon concentration according to the following equa-tion [12]:
�n��, C� � C�a1 a2
�2 � �02 � a3�
2 � nsub����, (7)
where � is the wavelength in micrometers, nsub��� isthe extraordinary refractive index of the substrate atthat wavelength, and the empirical constants havethe following values: a1 � 4.945, a2 � 0.1354, �0 �0.2324, and a3 � 0.0278.
A 1D computer model of proton exchange based onthese equations was validated by fabricating planarwaveguides, measuring the effective indices of refrac-tion of the waveguide modes with a Metricon prismcoupler, calculating index profiles from the mode in-dices using the inverse-WKB approximation [14], and
comparing these experimental index profiles with thepredicted index profiles. The model was then gener-alized to two dimensions by assuming that the diffu-sion coefficient had the same value in the depth andwidth directions. After the 2D index profiles werecalculated, the electric-field profiles for the channelwaveguide modes and the effective indices of refrac-tion for those modes were calculated using a com-puter program that solves Maxwell’s equations forlight propagation in the graded-index structure.From the effective indices of the interacting modesthe QPM period needed for phase matching was cal-culated. The 2D model was tested by comparing thecalculated QPM periods for a given set of interactionwavelengths to the experimental QPM periods. For avariety of waveguides designed to produce outputwavelengths near 3.3 m by DFG, the model pre-dicted the phase-matching period to within 0.1 m.
C. Predictions of Broad Tuning: Bulk versus Waveguide
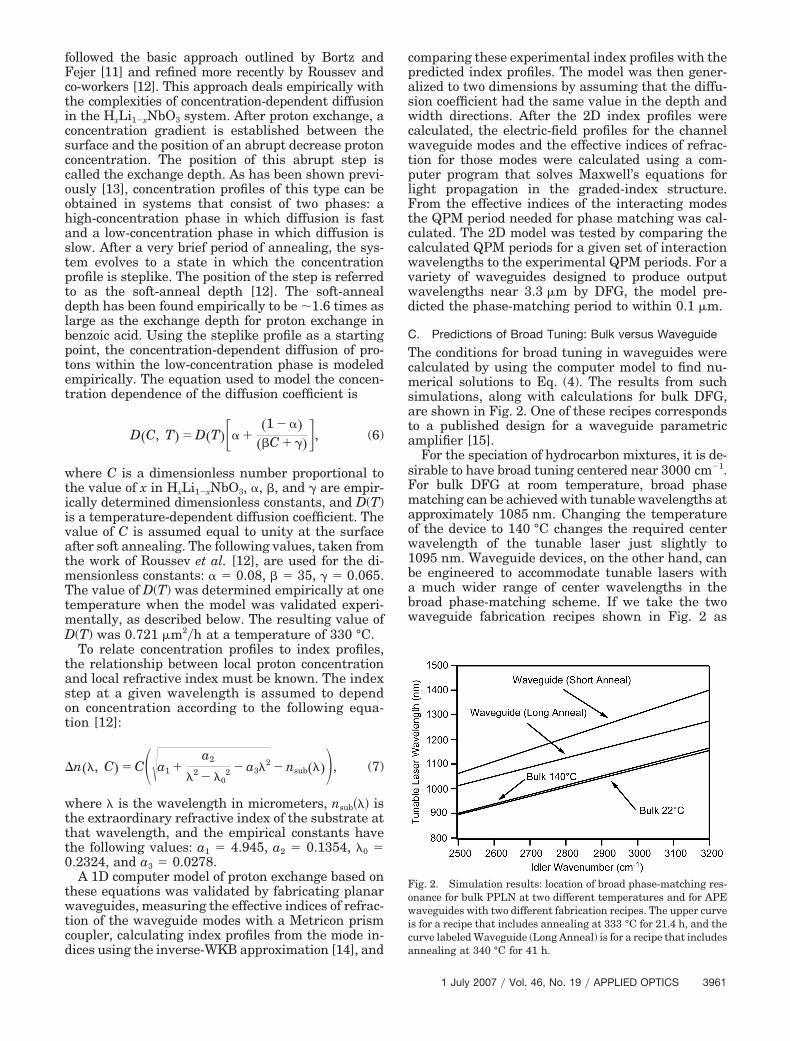
The conditions for broad tuning in waveguides werecalculated by using the computer model to find nu-merical solutions to Eq. (4). The results from suchsimulations, along with calculations for bulk DFG,are shown in Fig. 2. One of these recipes correspondsto a published design for a waveguide parametricamplifier [15].
For the speciation of hydrocarbon mixtures, it is de-sirable to have broad tuning centered near 3000 cm�1.For bulk DFG at room temperature, broad phasematching can be achieved with tunable wavelengths atapproximately 1085 nm. Changing the temperatureof the device to 140 °C changes the required centerwavelength of the tunable laser just slightly to1095 nm. Waveguide devices, on the other hand, canbe engineered to accommodate tunable lasers witha much wider range of center wavelengths in thebroad phase-matching scheme. If we take the twowaveguide fabrication recipes shown in Fig. 2 as
Fig. 2. Simulation results: location of broad phase-matching res-onance for bulk PPLN at two different temperatures and for APEwaveguides with two different fabrication recipes. The upper curveis for a recipe that includes annealing at 333 °C for 21.4 h, and thecurve labeled Waveguide (Long Anneal) is for a recipe that includesannealing at 340 °C for 41 h.
1 July 2007 � Vol. 46, No. 19 � APPLIED OPTICS 3961

boundary points, the tunable laser can be centered atany wavelength between 1150 and 1340 nm, depend-ing on the annealing time. To allow a commerciallyavailable telecommunications laser to be used as thetunable laser, a recipe that produced broad phasematching centered at 1300 nm was chosen for furtherdevelopment.
D. Waveguide Design
As was the case with earlier generations of wave-guide DFG devices [16], the waveguide channels in-cluded three design elements: a mode filter, taper,and mixing region. This geometry is shown schemat-ically in Fig. 3. Key design parameters shown in thisfigure include the width of the channel in the modefilter region, the width of the channel in the mixingregion, the length of the tapered structure, whichconnects these two regions, and the shape of the ta-pered structure. The width of the channel in the mix-ing region was chosen to produce a waveguide sectionthat supported a single mode at the idler wavelength.The width of the channel in the mode filter region waschosen to produce a waveguide section that supporteda single mode at the signal wavelength and that wasas close to supporting a single mode as possible at thepump wavelength. (In fact it supported three modes.)The length and shape of the taper were chosen em-pirically by fabricating waveguides with a variety oftaper lengths (from 2 to 10 mm) and a variety ofdifferent functional forms for the width of the openingas a function of position (linear, square root, qua-dratic, and cubic). The light from a tunable laser waslaunched into the waveguides, and the spatial pro-files of the waveguide modes were measured with aCCD camera. The performance of the taper was de-termined by observation of multimode excitation(manifested by changes in the spatial profile) as thelaser was tuned. The combination of a 5 mm longtaper with a cubic taper profile was found to producethe most robust single-mode excitation and wastherefore chosen for further development.
The geometric parameters for the final waveguidedevice are shown in Fig. 3. The fabrication recipe wasas follows: 12 h of proton exchange in benzoic acid ata temperature of 160 °C, leading to a soft-annealdepth of 1.22 m, followed by 24 h of annealing at atemperature of 330 °C. The calculated QPM periodfor phase matching (with pump, signal, and idlerwavelengths of 930, 1290, and 3333 nm, respectively)was 21.5 m. The periodic poling mask included grat-
ings with periods ranging from 20.1 to 21.9 m inincrements of 0.2 m.
The same computer model used to predict the phase-matching conditions was used to predict the nonlinearoptical performance of the device. When phase match-ing is achieved, in the limit of minimal pump depletionand negligible losses at any of the interacting wave-lengths, the output power of a waveguide DFG deviceis given by the following equation:
P1 � �norP2P3L2, (8)
where �nor is the normalized conversion efficiency,and L is the length of the mixing region. Anotherimportant parameter for waveguide DFG devices isthe device efficiency, �dev, which is equal to �norL
2. Thepredicted value of �nor was calculated by performingthe appropriate overlap integral for the electric-fieldprofiles of the TM00 modes at the pump, signal, andidler wavelengths. The effective nonlinear coefficientwas assumed to be equal to zero in a dead regionwhose depth was equal to the soft-anneal depth of1.22 m, and equal to the effective nonlinear coeffi-cient for bulk lithium niobate elsewhere. This calcu-lation yielded a prediction of 1.5%�W cm2 for �nor.Therefore the fabricated device, which had a mixingregion length of 1.85 cm, was expected to have a de-vice efficiency of 5%�W.
4. Description of Laser Experiments
A. Laser Spectrometer
The mid-infrared spectrometer is shown schemati-cally in Fig. 4. A 931.4 nm fixed-wavelength pumplaser (Sacher Lasertechnik Lynx series) was mixedwith a tunable, swept-wavelength signal laser tun-able between 1263 and 1343 nm (Thorlabs�Radians,Newton, New Jersey, Innova INTUN-T series). Thefiber-coupled outputs of the lasers were combinedin a fiber-optic coupler (Canadian Instrumentationand Research, Burlington, Ontario, Canada, using980 nm fiber), and the output fiber ferrule was but-tcoupled to the PPLN waveguide. All fibers werepolarization maintaining (PM) to preserve the polar-ization necessary for proper guiding in the waveguideand the connectors were of the angle-polished type(APC) to minimize backreflections. Prior to the gasanalysis experiments, the fiber was pigtailed to thewaveguide chip using UV-curing epoxy (NorlandOptical Adhesive 61, Cranbury, New Jersey). Toachieve proper phase matching, the PPLN chip washeated to 65 °C, and the resulting mid-infrared lightwas focused by a ZnSe lens and filtered by a broad-band mid-infrared pass filter. The light was thensent through a mechanical chopper, split into signaland reference beams by a ZnSe beam splitter anddetected using a pair of thermoelectrically cooledHgCdTe detectors (Judson J19, Montgomeryville,Pennsylvania) operated at �65 °C. The signal beampassed through a gas cell containing wedged, antire-flection coated ZnSe windows allowing differentialabsorption measurements. The optical path length
Fig. 3. Schematic showing the key elements of the waveguidemask design.
3962 APPLIED OPTICS � Vol. 46, No. 19 � 1 July 2007

was 4 cm. Ratiometric detection was used to minimizethe etalon effects from the tunable laser, PPLN chip,and other optics and to account for laser power andwavelength-dependent coupling efficiency variations.The signals from the detectors were sent to two lock-inamplifiers (Femto LIA-MVD-200-H), and the resultingvoltage signals were detected by a fast data acquisition(DAQ) board. The DAQ board was also used to send aswept analog signal to the tunable laser for tuning.
The acquisition speed and accuracy of the obtainedspectra were predicated on the tuning characteristicsof the analog swept-wavelength laser. The laser couldbe tuned at speeds up to 100 nm�s. Without any cor-rection, the frequency of the laser at any given timeduring a scan was accurate to within 0.15 cm�1 whenthe wavelength was assumed to be a linear functionof time. The accuracy of the laser frequency was fur-ther improved by acquiring a spectrum of methaneand using the known line positions [17] as frequencystandards for the construction of a calibration curve.By using a second-order polynomial for the calibra-tion curve, the accuracy of the laser frequency mea-surement at every point within a given scancalibrated in this way was improved to 0.05 cm�1.The repeatability of the starting frequency from onescan to another was 0.10 cm�1, which is less than thelinewidth of the narrowest lines in the spectra. A pro-gram written in LabVIEW controlled the coordinatedlaser scanning, linearity calibration, and simultaneousdata acquisition. The minimum achievable linewidthfor the spectrometer, determined by the convolvedline-shape functions of the pump and signal lasers,was �120 MHz. In practice, the linewidth was largerthan this because of the limitations imposed by thefinite DAQ rate. For example, a typical measurementscanning the entire tuning range of the instrument in�10 s yielded an effective linewidth of �0.01 cm�1.Trade-offs among scan range, resolution, and speedcould be made based on the measurement require-ments.
B. Setup for Measuring Phase-Matching Curves,Conversion Efficiencies, and Beam Profiles
To measure conversion efficiencies, the gas cell andbeam splitter were removed from the beam path, andall the mid-infrared radiation was focused onto asingle detector. After the mid-infrared power was re-corded, the collection lens was replaced by a micro-scope objective and used to create an image of thewaveguide exit facet. An aperture was used to filterout near-infrared light, which was not coupled intothe waveguide, and the near-infrared beam beingmeasured was coupled onto a thermal detector (Ophir3A-SH, Peabody, Massachusetts). To measure thespatial profiles of the waveguide modes, the outputfacet of the waveguide was imaged onto a CCD cam-era by two lenses, which formed a 44� telescope. Thecamera image was captured by a beam view programthat displayed a false color image of the beam profileand calculated the width in the x and y directions.The calibration of the beam size was done by trans-lating the waveguide with a calibrated micrometerand observing how many camera pixels correspondedto this motion.
C. Gas Analysis Procedures
The gas cell was filled by connecting it to a vacuummanifold equipped with a Baratron capacitance ma-nometer with a 1000 Torr head, with an accuracy of0.5%. Because the experiment was designed to spe-ciate a mixture containing methane, ethylene, andpropylene, the reference spectra for each of thesegases were acquired using the spectrometer. The ref-erence spectra used for the gas analysis were ac-quired using a 300 s scan time, over a period of 250min. The spectra of the calibrated mixture were thenacquired using a variety of scan times, over a timeperiod of 23 min. The time delay between the acqui-sition of the last reference spectrum and the acquisi-tion of the first gas mixture spectrum was 55 min. All
Fig. 4. Schematic of the mid-infrared laser spectrometer.
1 July 2007 � Vol. 46, No. 19 � APPLIED OPTICS 3963

the spectra were acquired using a lock-in choppingfrequency of 2 kHz. The lock-in time constant was100 ms for the reference spectra and ranged from 3 to100 ms (depending on the scan length) for the spectraof the calibrated mixture. At each of the 40,000 pointsin a scan, the natural logarithm of the ratio betweensignals in the signal and reference channels was re-corded to obtain a raw absorbance. A spectrum takenin the same way using an empty cell was used tocreate a look-up table showing the baseline absor-bance as a function of wavelength. The baseline ab-sorbance values were then subtracted from the rawexperimental absorbance values to obtain the cor-rected absorbance values. A single look-up table wasused for all the experiments described here. The rmsbaseline noise (in absorbance units) was 3.4% for alock-in time constant of 3 ms and 1.6% for a lock-intime constant of 100 ms.
The calculations of species mole fractions were car-ried out using a linear least-squares fitting routine,employing a single-value decomposition algorithm,implemented in LabVIEW. Using the spectra fromthe three pure components as a basis set, the fittingroutine produced a linear combination of these spec-tra that best fit the spectrum of the mixture. Thefitting procedure contained four adjustable parame-ters: a constant multiplier for each of the three basisfunctions and a baseline offset. The first three fittingparameters were then used to calculate the mole frac-tions for each of the components by using calibrationdata derived from the basis set. For each component,the measurement error (expressed as a percentageof the measured value) was calculated by assumingthat the calibration data provided by the manufac-turer of the gas mixture (Scott Specialty Gases,Plumsteadville, Pennsylvania) was correct.
5. Experimental Results
A. Waveguide Characterization
Figure 5 shows the refractive index profile for a pla-nar waveguide witness chip, fabricated alongside the
channel waveguide chip. This profile was measuredusing a Metricon prism coupler using the inverse-WKB method [14]. The fitted profile has an index stepat the surface of 0.032, which is significantly higherthen the surface index steps of 0.018–0.022 mea-sured for other waveguide recipes used in earlierwaveguide DFG devices [16]. This means that thepresent waveguide device is “underannealed” relativeto the earlier devices. Longer annealing times, lead-ing to smaller index steps at the surface, are desir-able because they ameliorate some of the harmfuleffects of the proton-exchange step, including highoptical losses and reduced nonlinear coefficient in theregion near the surface. However, in this case ahigher index step at the surface was needed to pro-duce a device with enough dispersion to place thebroad phase-matching resonance in the desired posi-tion.
Figure 6 shows the spatial profile as a function ofsignal wavelength for a waveguide on the chip thatwas used in the spectrometer. The shapes of thesespatial profiles, and the absence of any qualitativechange in shape as the laser was tuned, suggestedthat most of the input radiation was coupled into theTM00 mode.
Figure 7 shows the spatial profile at the pumpwavelength in the same chip. This mode profile is alsoconsistent with most of the radiation being coupledinto the TM00 mode. Figures 6 and 7, taken together,indicate that the mode filter and taper did an accept-
Fig. 5. Measured mode indices (symbols) at a wavelength of632.8 nm for a planar waveguide witness chip, which accompaniedthe channel waveguide chip through the steps of proton exchangeand anneal. An extraordinary step index profile (solid line) calcu-lated using the inverse WKB method is also shown.
Fig. 6. Mode profiles for a waveguide with a 3 m wide modefilter and 5 mm long taper. Each profile is taken at a differentexcitation wavelength, ranging from 1263 nm (upper left) to 1343nm (lower right).
Fig. 7. Mode profile for the same waveguide as in Fig. 6 at awavelength of 931.4 nm.
3964 APPLIED OPTICS � Vol. 46, No. 19 � 1 July 2007

able job of ensuring that most of the input pump andsignal radiation was launched into the TM00 mode,thus ensuring that the nonlinear conversion effi-ciency of the device would not be significantly com-promised by multimode excitation.
B. Broad Phase Matching
Figure 8 shows the relative mid-infrared power as afunction of idler wavenumber with the pump laserfixed at 931.4 nm and the signal laser tuned between1263 and 1343 nm. As predicted, broad phase match-ing is obtained with this combination of pump andsignal wavelengths because the phase mismatch is, toa first-order approximation, independent of the wave-length of the laser being tuned. The system had atuning range of 3046–3556 nm (3283–2812 cm�1),corresponding to 510 nm �471 cm�1� of mode-hop-freetuning. The phase-matching curve does show a double-peaked structure, which appears to be a consequenceof being slightly detuned from the condition at whichEq. (4) is satisfied exactly. In this case the phase-matching curve splits into two partially overlappingpeaks, which is desirable from the point of view of atunable laser source because an even wider tuningrange can be obtained. This phase-matching peak wasobserved in a QPM grating with a period of 21.5 m,which is identical to the predicted value of 21.5�m for this combination of wavelengths. No phase-matching peaks with comparable intensity could beseen in any of the QPM gratings with different peri-ods on this chip, thus lending confidence to the as-sertion that the observed phase-matching interactionis the expected one, with both the pump and thesignal beams in TM00 modes.
C. Conversion Efficiency
Table 1 summarizes the fiber-coupled pump and sig-nal powers, the powers launched into the waveguide,and the mid-infrared power generated. With 19 and2.0 mW launched into the waveguide, the idler powerwas 0.2 W. This corresponds to a device efficiency of0.5%�W, which is an order of magnitude smaller thanthe predicted device efficiency of 5%�W. After pigtail-ing, the output power decreased by a factor of 2,presumably because of misalignment during the cur-ing of the epoxy. All the spectra were acquired withthe waveguide in the nonpigtailed state.
D. Gas Analysis
The composition of the calibrated gas mixture, asreported by Scott Specialty Gases, is summarized inTable 2. The mole fractions of each component weremeasured during manufacture by weighing the gascylinder after the addition of each component. Nitro-gen was used as the buffer gas. In the hydrocarboncracking application, samples of the process gas,which have been cooled to slightly below room tem-perature, and which have total pressures slightlygreater than 1 atm, are readily available. Therefore ameasurement of this mixture at room temperatureand atmospheric pressure is a realistic test of theusefulness of the spectrometer for the hydrocarboncracking application.
The absorption spectra for the three pure compo-nents are shown in Figs. 9, 10, and 11. These spectraserved as the basis functions for the least-squaresanalysis of the mixture. These spectra illustrate thepotential usefulness of a broadly tunable source forspeciating mixtures of hydrocarbons because thebroad tunability ensures that the unique absorptionfeatures of each target molecule (including both thenarrow features characteristic of smaller moleculesand the broad features characteristic of larger mole-
Table 1. Power Budget for the Waveguide Device Prior to Pigtailing
Quantity Value
Mixing region length 18.5 mmPump power in fiber (931.4 nm) 50 mWPump power in waveguide (931.4 nm) 19 mWSignal power in fiber (1313 nm) 4.5 mWSignal power in waveguide (1313 nm) 2.0 mWIdler power in waveguide (3205 nm) 0.2 �WDevice efficiency 0.5%�W
Fig. 8. Relative mid-infrared power as a function of idler wave-number with the pump wavelength fixed at 931.4 nm.
Table 2. Composition of Calibrated Gas Mixture
Quantity Value
�methane,true 0.150 0.003�ethylene,true 0.396 0.004�propylene,true 0.245 0.002
Fig. 9. Absorption spectrum of methane (30.6 Torr, buffered withnitrogen to 804.4 Torr, 4 cm path length, 300 s scan time), recordedusing the experimental apparatus shown in Fig. 4.
1 July 2007 � Vol. 46, No. 19 � APPLIED OPTICS 3965

cules) can be captured in a single sweep. Figure 12shows two examples of spectra for the calibrated mix-ture, taken at two different scan times. To study theeffect of scan time in the accuracy of the measure-ment, scans were taken at five different scan times.The results of these measurements are summarizedin Table 3.
An rms measurement error for each scan can bedefined by the following equation:
The values of the quantity defined in Eq. (9) areshown as a function of measurement time in Fig. 13.There is a clear trend of increasing measurementerror as the measurement time is increased beyond30 s. Shorter measurement times yield better mea-surement results even though the signal-to-noise ra-tio in the absorption spectra, as shown in Fig. 12,appears to be worse. This result suggests that driftsin the system are causing systematic errors duringthe course of the slower scans. Instrument drifts onthese time scales are commonly seen in diode-laser-based gas sensing instruments [18].
6. Discussion
The broadly tunable mid-infrared spectrometer ap-pears capable of meeting the performance require-ments for speciation in petrochemical manufacturing.To be useful for real-time process control, an instru-ment must be capable of measuring the key compo-nents with an accuracy of 2% on a time scale, which is
comparable to the internal time constants of the sys-tem being regulated, between 10 s and 2 min. In itspresent form, the instrument has achieved this level ofaccuracy in a measurement time of 30 s. Further workmust be done to demonstrate the precision of thesemeasurements when carried out continuously overmany days of operation.
Several measures can be suggested to further im-prove the performance of the spectrometer. Moresophisticated data analysis schemes, which givemore weight to the parts of the spectrum that yieldthe most useful information, can be implemented toincrease the accuracy at a given measurement time,or to allow the same accuracy to be obtained in ashorter time. More detailed studies of measurementaccuracy as a function of scan time can be carriedout in conjunction with these software improve-ments to find the optimum scan time, as is com-monly done with diode-laser-based spectrometersdedicated to the measurement of a single species[18]. A laser source with more output power wouldimprove the signal-to-noise ratio at shorter data acqui-sition times. More output power can be obtained in astraightforward manner by using more powerful pumpand signal lasers. The normalized conversion efficiencyof the waveguide frequency converter can be improvedby adding another processing step to waveguide fabri-cation: reverse proton exchange (RPE), which creates a
��rms � 13���methane,true � �methane,meas
�methane,true�2
��ethylene,true � �ethylene,meas
�ethylene,true�2
��propylene,true � �propylene,meas
�propylene,true�2�. (9)
Fig. 11. Absorption spectrum of propylene (98.2 Torr, bufferedwith nitrogen to 800.7 Torr, 4 cm path length, 300 s scan time),recorded using the experimental apparatus shown in Fig. 4.
Fig. 12. Absorption spectra of the calibrated gas mixture with thecomposition shown in Table 2 (191.6 Torr of the mixture, bufferedwith nitrogen to 806.6 Torr, 4 cm path length), recorded using theexperimental apparatus shown in Fig. 4. Spectra with two differ-ent scan times are shown: 10 s (top) and 300 s (bottom).
Fig. 10. Absorption spectrum of ethylene (66 Torr, buffered withnitrogen to 794.7 Torr, 4 cm path length, 300 s scan time), recordedusing the experimental apparatus shown in Fig. 4.
3966 APPLIED OPTICS � Vol. 46, No. 19 � 1 July 2007

buried waveguide by replacing protons with lithiumions in a region near the surface. This minimizesthe asymmetry, which has a negative impact on thespatial overlap of waveguide modes at different wave-lengths. RPE devices engineered for telecommunica-tion wavelengths have been shown to have 2–4 timeshigher normalized conversion efficiency than APE de-vices [19], and similar improvement has recently beenseen for devices engineered for mid-infrared genera-tion [20]. An RPE device also offers another potential2–4 improvement in output power because morepower from the pump and signal lasers can be deliv-ered to the waveguide by a pigtailed fiber. This is aresult of the greater symmetry of the waveguidemodes, which makes it possible to optimize the cou-pling efficiencies for the pump and signal wavelengthssimultaneously. In the APE devices the peaks of theTM00 modes at the pump and signal wavelengths aredisplaced spatially from each other, making it impos-sible to achieve optimum coupling into both simulta-neously during pigtailing.
The lower than expected device efficiency for thewaveguide device used in this work deserves furthercomment. In the past, deviations from expected per-formance in APE devices have been attributed tomultimode excitation [16]. However, for the devicesfabricated in this work, the data in Figs. 6 and 7appear to rule out this explanation. One possible ex-planation for lower than expected conversion effi-ciency is the presence of absorption losses in thewaveguide at the idler wavelength [20]. If absorptionlosses at the idler wavelength are significant, thenthe equations of motion for the interacting wavesmust be modified to account for this loss, leading tothe following modified version of Eq. (8):
P1�L� � P2P3�DFG1 � exp���1L2 �
��1
2 � �2
, (10)
where �1 is the base-e power absorption coefficient atthe idler wavelength. An absorption coefficient of�3 cm�1 would explain the discrepancy between thecalculated and the observed conversion efficiencies.Devices with a 3.55 cm long mixing region, otherwiseidentical to the one used in the spectrometer, weremeasured to have the same device efficiency as theshorter device used in the spectrometer. This behav-ior is consistent with the hypothesis that absorp-tion is limiting the effective length of the device.Others have found evidence that optical absorption at3.3 m (caused by OH radicals in the protonated ma-terial) limits the effective length of APE and RPEdevices producing this wavelength to �1 cm [20]. Theabsorption coefficient should decrease with increas-ing annealing time as the OH radicals become moredilute; however, in our device a short annealing timewas required in order to place the broad phase-matching resonance in the desired location. If absorp-tion is the source of the problem, then the deviceefficiencies for APE or RPE devices with output wave-lengths near 3.3 m will never exceed a few percentper watt unless the absorption at that wavelengthcan be reduced significantly, e.g., by deuteration [21].Ridge waveguide devices, which have demonstrateddevice efficiencies of 40%�W for generation of radia-tion in the desired wavelength range [22], are a prom-ising alternative.
7. Summary and Conclusions
A mid-infrared spectrometer based on the DFG oftunable diode lasers in PPLN waveguides has beenconstructed. Through an appropriate choice of pumplaser wavelength, signal laser wavelength, andwaveguide fabrication recipe, this spectrometer hasbeen designed to have an unprecedented tuningrange of �400 cm�1 in the C–H stretching region ofthe spectrum. Tuning is achieved by varying a singleparameter, the wavelength of the signal laser. Theinstrument can be tuned over the entire tuning rangein less than 1 s. The wide tuning range has beencapitalized upon to perform speciation on a mixtureof three hydrocarbons (methane, ethylene, and pro-pylene), which are important to petrochemical man-
Table 3. Summary of Gas Analysis Results
ScanTime (s)
�methane,true � �methane,meas
�methane,true
�ethylene,true � �ethylene,meas
�ethylene,true
�propylene,true � �propylene,meas
�propylene,true
10 0.7% 1.3% 2.4%30 0.7% 1.3% 1.2%90 6.0% 1.8% 1.6%
300 8.7% 2.0% 5.7%900 5.3% 10.4% 4.9%
Fig. 13. Average measurement error, as defined by Eq. (9), as afunction of scan time.
1 July 2007 � Vol. 46, No. 19 � APPLIED OPTICS 3967

ufacturing. Each of these components was measuredwith an accuracy of less than 2% (where the error isdefined as a percentage of the measured value) in asingle 30 s long scan. The conditions under whichbroad phase-matching resonances can be observed(leading to wide tuning ranges) have been derived,thus making it possible to design a broadly tunablespectrometer centered at any mid-infrared wave-length within the transparency range of lithium nio-bate. The use of variable waveguide fabricationrecipes to change the position of the broad phase-matching resonances, allowing them to coincide withthe wavelengths of commercially available tunablenear-infrared diode lasers, has been demonstratedfor the first time. When optimized, the spectrometerhas the potential to meet both the performance re-quirements and the practical requirements for real-time process control in petrochemical manufacturing.
The authors thank Rosti Roussev of Stanford Uni-versity for useful discussions of waveguide modelingand waveguide design. This material is based onwork supported by the Department of Energy undergrant DE-FG02-03ER83851. Any opinions, findings,conclusions, or recommendations expressed in thismaterial are those of the authors and do not neces-sarily reflect the views of the Department of Energy.
References1. T. Töpfer, K. P. Petrov, Y. Mine, D. Jundt, R. F. Curl, and F. K.
Tittel, “Room-temperature mid-infrared laser sensor for tracegas detection,” Appl. Opt. 36, 8042–8049 (1997).
2. D. Richter, D. G. Lancaster, and F. K. Tittel, “Development ofan automated diode-laser-based multicomponent gas sensor,”Appl. Opt. 39, 4444–4450 (2000).
3. D. Richter and P. Weibring, “Ultra-high precision mid-IR spec-trometer I: design and analysis of an optical fiber pumpeddifference frequency generation source,” Appl. Phys. B 82,479–486 (2006).
4. G. J. Timmermans and H. Morgenstern, “Method and appara-tus for controlling severity of cracking operations by near-infrared analysis in the gas phase using fiber optics,” U.S.patent 6,512,156 (28 January 2003).
5. Y. Z. Friedman, “Advanced control of ethylene plants: whatworks, what doesn’t, and why,” Hydrocarbon Asia, July�August 1999, available at www.petrocontrol.com.
6. L. Goldberg, W. K. Burns, and R. W. McElhanon, “Wide ac-ceptance bandwidth difference frequency generation in quasi-phase-matched LiNbO3,” Appl. Phys. Lett. 67, 2910–2912(1995).
7. T. Yanagawa, H. Kanbara, O. Tadanage, M. Asobe, H. Suzuki,and J. Yumoto, “Broadband difference frequency generation
around phase-match singularity,” Appl. Phys. Lett. 86, 161106(2005).
8. D. H. Jundt, “Temperature-dependent Sellmeier equation forthe index of refraction, ne, in congruent lithium niobate,” Opt.Lett. 22, 1553–1555 (1997).
9. S. Field, L. Huang, K. Wolfe, D. Bamford, and D. Deacon,“Fabrication of bulk and waveguide PPLN for the generation ofwavelengths from 460 nm to 4.3 microns,” in Diode PumpedSolid State Lasers: Applications and Issues, M. W. Dowley, ed.(Optical Society of America, 1997), pp. 87–92.
10. J. L. Jackel, E. E. Rice, and J. J. Veselda, “Proton exchange forhigh index waveguide in LiNbO3,” Appl. Phys. Lett. 41, 607–609 (1982).
11. M. L. Bortz and M. M. Fejer, “Annealed proton exchangeLiNbO3 waveguides,” Opt. Lett. 16, 1844–1846 (1991).
12. R. Roussev, X. Xie, K. Parameswaran, M. M. Fejer, and J.Tian, “Accurate semi-empirical model for annealed proton ex-changed waveguides in z-cut lithium niobate,” IEEE Lasersand Electro-Optics Society Annual Meeting (IEEE 2003).
13. J. Crank, The Mathematics of Diffusion, 2nd ed. (Oxford U.Press, 1975), Chap. 13.
14. K. S. Chiang, “Construction of refractive-index profiles of pla-nar dielectric waveguides from the distribution of effectiveindexes,” J. Lightwave Technol. 3, 385–391 (1985).
15. R. Roussev, A. Sridharan, K. Urbanek, R. Byer, and M. Fejer,“Parametric amplification of 1.6 �m signal in anneal- andreverse-proton exchanged waveguides,” IEEE Lasers andElectro-Optics Society Annual Meeting (IEEE, 2003).
16. K. P. Petrov, A. P. Roth, T. L. Patterson, T. P. S. Thorns, L.Huang, A. T. Ryan, and D. J. Bamford, “Efficient difference-frequency mixing of diode lasers in lithium niobate channelwaveguides,” Appl. Phys. B 7, 777–782 (2000).
17. S. W. Sharpe, T. J. Johnson, R. L. Sams, P. M. Chu, G. C.Roderick, and P. A. Johnson, “Gas-phase databases for quan-titative infrared spectroscopy,” Appl. Spectrosc. 58, 1452–1461(2004).
18. P. Werle, R. Mücke, and F. Slemr, “The limits of signal aver-aging in atmospheric trace gas monitoring by tunable diode-laser absorption spectroscopy,” Appl. Phys. B 57, 131–139(1993).
19. K. R. Parameswaran, R. K. Route, J. R. Kurz, R. V. Roussev,M. M. Fejer, and M. Fujimura, “Highly efficient SHG in buriedwaveguides formed using annealed and reverse proton ex-change in PPLN,” Opt. Lett. 27, 179–181 (2002).
20. R. Roussev, S. Sinha, K. Urbanek, R. L. Byer, and M. M. Fejer,“Efficient mid-infrared difference-frequency generation in re-verse proton-exchanged PPLN waveguides,” Stanford Photon-ics Research Center Annual Meeting, Stanford, Calif. (2006).
21. C. E. Rice, J. L. Jackel, and W. L. Brown, “Measurement of thedeuterium concentration profile in a deuterium-exchangedLiNbO3 crystal,” J. Appl. Phys. 57, 4437–4440 (1985).
22. O. Tadanaga, T. Yanagawa, Y. Nishida, H. Miyazawa, K. Ma-gari, M. Asobe, and H. Suzuki, “Efficient 3-�m difference fre-quency generation using direct-bonded quasi-phase-matchedLiNbO3 ridge waveguides,” Appl. Phys. Lett. 88, 061101(2006).
3968 APPLIED OPTICS � Vol. 46, No. 19 � 1 July 2007