why superintendents turn over - vanderbilt university
TRANSCRIPT

1
Why Superintendents Turn Over
Jason A. Grissom Vanderbilt University
Stephanie Andersen
Washington University in St. Louis
***
Superintendent turnover can hurt reform efforts and district improvement, but little research has examined what factors predict superintendent exits in a large sample. This study identifies factors contributing to superintendent exits in California by matching original superintendent and school board survey data with administrative data and information hand-collected from news sources on why superintendents left and where they went. Among 215 superintendents studied beginning in 2006, 45% turned over within 3 years. Using multinomial logistic regression to separate retirements from other types of turnover, we find that while age is the primary driver of retirements, other factors, such as school board members’ assessments of how well the board functions or whether the superintendent was hired from within the district, are highly predictive of non-retirement exits. District test score growth, however, is uncorrelated. Moreover, we find that superintendents who move migrate toward larger, higher-paying districts in more urban locations.
***
The story of school superintendent turnover is a well-known one: energetic new leader
assumes position with plans for revitalization, only to clash with a dysfunctional school board or
impatient community and move on to greener pastures before the plan can be fully carried out,
leaving the district once again searching for the next great leader bearing the requisite
comprehensive reform plan. High-profile examples abound of reform-minded superintendents
whose tenures saw gains in student test scores but whose time in office was cut short by public
pressure and tumultuous school board relations: Arlene Ackerman in San Francisco, John
Thompson in Pittsburgh, Rudy Crew in Miami-Dade County, Stan Paz in Tucson (Buchanan,
2006; Cave & Almanzar, 2008). Often, the story goes, ousted superintendents move on to other
districts; Ackerman moved on to—and was then pushed out of—Philadelphia, Thompson was
terminated after a year in Clayton County (Georgia) Schools, Crew had already been chancellor

2
of New York City’s public school system, Paz had served in El Paso. This shuffling of
superintendents through school districts creates a kind of “revolving door” in the
superintendent’s office (Natkin et al., 2002), as witnessed by Kelvin Adams becoming St. Louis
Public Schools’ eighth superintendent in five years in 2008 or John Covington becoming Kansas
City Missouri School District’s twenty-fifth superintendent in forty years the next year (Taylor,
2008).1 With chronic turnover come expectations that turnover is inevitable, making the
superintendent turnover story one of short-term focus with insufficient investment in long-range
vision and infrastructure (Buchanan, 2006).
The trouble with this story is that it may not be true, at least not for the typical public
school district. The popular conception of the modern superintendent as a chronic mover in
continual public disharmony with a conflict-ridden school board is one developed from media
portrayals of prominent cases in the nation’s largest urban districts, whose experiences may not
be representative of those of the suburban and rural districts that make up the majority of local
school governments—or even of the average urban district. As Natkin et al. (2002) argue, this
potentially errant popular understanding has consequences for both for the practice of
superintendents—who become reluctant to take on major reform efforts—and the responsiveness
of principals and teachers, who may adopt a “this too shall pass” approach to superintendents’
priorities and directives.
Unfortunately, there is little systematic evidence with which to question this common
conception or issues of superintendent turnover more broadly, a puzzling situation given the
importance ascribed to superintendents in leading district improvement. As the school district’s
“chief executive,” superintendents oversee key aspects of district operations. Research suggests
that successful execution of central management functions such as staff recruitment, financial 1 Covington resigned from his Kansas City post in 2011.

3
management, leadership of instruction, and strategic planning helps create positive learning
environments within schools, which may indirectly impact student achievement (Alsbury, 2008;
Byrd, Drews, & Johnson, 2006; Petersen, 2002). Because instability in the superintendent’s
office disrupts these management functions, superintendent turnover may negatively impact
district performance, at least in the short term; research concluding that successful systemic
school reforms take five or more years of a superintendent’s focus suggests that negative impacts
of turnover could be felt even longer (Fullan & Stiegelbauer, 1991). The loss of a superintendent
may also negatively affect staff morale and satisfaction (Alsbury, 2008), which could have
“trickle-down” effects on principal and teacher turnover and performance.
The importance of the district superintendent and the potential consequences of
superintendent exits make understanding the factors that drive superintendent turnover a key
topic for empirical research. Lamentably, however, superintendent turnover lacks a well-
developed research base (Natkin et al., 2002). Existing research has primarily taken the form of
qualitative explorations of turnover motivations through case studies and interviews with
superintendents. Few studies have focused on empirically testing the relative strength of
associations between superintendent turnover and characteristics of the superintendents, districts,
and school boards with whom they work. Moreover, studies have not examined how these
predictors might vary with the type of turnover (e.g., retirement, resignation).
To address these gaps in the literature, this study pulls together existing research on
superintendent turnover alongside a complementary—and perhaps more well-developed—stream
of research on turnover among city managers to identify potential drivers of superintendents’
decisions to leave. Research on city managers is applicable because the job of the city manager
shares important characteristics (e.g., managing a complex organization, working closely with an

4
elected board) with that of the school superintendent. We develop a simple labor market
framework in which a superintendent’s continued employment in a district is determined by
employment decisions made by both superintendents and their school boards, then draw on the
superintendent and city manager turnover research to identify four classes of factors that
contribute to those decisions: characteristics of the district, school board, and superintendent
himself or herself, plus superintendent job performance.
To test the expectations our framework develops, we draw on original matched survey
data from superintendents and school board members in more than 100 randomly chosen
California school districts, which run the gamut from large urban bureaucracies to small rural
districts with few schools, to investigate these factors in depth. These survey data are
supplemented both with administrative data from the California Department of Education (CDE)
and the National Center for Education Statistics’ Common Core of Data (CCD) and with
additional information on superintendent turnover culled from newspapers and other public
sources. Employing logistic and multinomial logit regression to model superintendents’
probabilities of turning over within a three-year window, we examine a variety of potential
contributors to superintendent turnover, with attention to the differences between retirement and
other types of exits.
In the next section, we detail our conceptual framework, synthesizing the existing
literature on superintendent turnover and the complementary stream of literature on turnover
among city managers. We then describe the data and methods employed in the empirical section
of the paper before turning to first to the regression results and then to a descriptive look at
patterns in superintendent moves across districts. We conclude with implications of this analysis
and directions for future work.

5
Conceptualizing Superintendent Turnover
Scholars have been interested in the question of why superintendents leave their school
districts for at least four decades (see Iannaccone & Lutz, 1970). Though the question has been
recurrent in the literature over this time period, most data used to address it have come from case
studies, interviews and small-scale surveys, raising concerns that the conclusions drawn from
this research are not representative. This criticism echoes Yee and Cuban’s (1996) concern that
focusing on high-profile cases of superintendent resignations has resulted in a prevailing “myth”
that superintendents tend to last only two or three years when, in fact, average tenure is much
longer, detracting from the image of the superintendency and predisposing superintendent reform
efforts to failure (Natkin et al., 2002). Furthermore, studies that have used larger data sets
typically have not employed multivariate methods that allow them to rule out alternative
explanations for the associations they uncover. The result is a research base that is much leaner
than those examining other types of turnover in education (e.g., Guarino, Santibañez, & Daley,
2006). Researchers have also noted the need for studies of superintendent turnover using recent
data that allow consideration of the roles and relationships of superintendents and school boards
in the age of complex accountability systems and changing student demographic trends
(Fusarelli, 2005; Petersen & Fusarelli, 2008).
The deficiencies in this literature are also theoretical. Much of the early work that
addressed superintendent turnover was rooted in dissatisfaction theory. This theory suggests that
districts experience long stable periods of school board membership during which community
dissatisfaction with district performance gradually builds until reaching a tipping point, at which
time school board members are thrown out of office and their successors replace the

6
superintendent, completing a new regime (Hosman, 1990; Iannaccone & Lutz, 1970; Weninger
& Stout, 1989).2 Thus, dissatisfaction theory yields one prediction about superintendent
turnover: that school board turnover will lead to higher rates of turnover among superintendents.
But what about turnover during times of school board stability, a phenomenon that casual
observation suggests is frequent but about which dissatisfaction theory is silent?
Existing literature on superintendent turnover offers little theoretical leverage on this
important question. Ostensibly, superintendents leave their posts for many reasons other than
termination by a newly elected school board. For example, in one survey of superintendents who
had changed districts, four times as many respondents gave their reason for leaving as an
opportunity to move to a larger district as said that the move was due to a “changing
board/elections” (Glass, Bjork, & Brunner, 2000, 89), which suggests that career advancement is
a more important factor for superintendent turnover than are the regime changes dissatisfaction
theory predicts. Other studies have identified the stresses of difficult working conditions—
including school board disharmony, the pressures of accountability, and the increasing
complexity that accompanies changing student demographics—as reducing many
superintendents’ job tenures (e.g., McCurdy, 1992). To more fully conceptualize superintendent
turnover, a broader framework is needed that can incorporate both the kind of involuntary
turnover that dissatisfied communities may demand and the kind of voluntary turnover that
superintendents seeking more prestigious positions or better working conditions may create.
A Labor Market Perspective
2 Scholars have suggested that growing community apathy regarding school board elections and the increasing prevalence of single-issue board candidates have reduced the applicability of dissatisfaction theory to current school board and superintendent turnover (see Fusarelli, 2005).

7
We suggest that superintendent turnover might more prudently be conceptualized as an
outcome in the labor market for superintendents. Economic labor market models have been
widely applied to the study of turnover among teachers and school-level administrators (e.g.,
Baker, Punswick, & Belt, 2010; Guarino, Santibañez, & Daley, 2006). Applied to
superintendents, this framework views turnover or retention as the result of a two-sided decision.
On one side (labor supply), the superintendent weighs the costs and benefits of staying in his or
her current position against the value of the next best available alternative. The decision to exit
the district or not is a choice of which option provides the greater benefit-cost differential.
Importantly, costs and benefits of a given job are both pecuniary and non-pecuniary, meaning
that the superintendent considers not only salary and benefits but also working conditions, such
as the quality of the working relationship the superintendent has with the school board. Because
working conditions factor directly into job costs and benefits, differences in working conditions
across districts are predicted to affect a superintendent’s decision to stay or go. We refer to exits
driven by superintendents’ considerations of job costs and benefits as voluntary turnover.
On the other side (labor demand), districts similarly weigh the costs and benefits of
retaining the current superintendent against the alternative of letting the superintendent go in
favor of the next best available candidate. Benefits of hiring a new superintendent might include
finding someone who will perform at a higher level or be a better fit with community needs.
Costs might include monetary costs of early termination of the current superintendent’s contract,
the transactions costs of searching for a replacement, or the political or public relations costs of
removing a superintendent who enjoys support among a significant portion of the community. If
the district—or, more specifically, the school board—weighs the relevant costs and benefits and

8
decides that the next best alternative provides a more positive differential, the current
superintendent’s employment is terminated, which we refer to as involuntary turnover.
The main advantage of conceptualizing superintendent turnover through the lens of the
labor market is that it emphasizes that we can predict the factors that affect turnover by
identifying which factors are likely to affect the cost-benefit calculation made by either
superintendents or their school boards. On the side of superintendent considerations, this
perspective points us towards factors such as salary, the assorted components of superintendent
working conditions, and the availability of attractive alternatives, among other constructs. For
example, we might hypothesize that earning a high salary likely increases the benefit to a
superintendent of staying in his or her position relative to what could be earned in another
district, making voluntary turnover less likely.3 On the side of district or school board
considerations, it points us towards factors that might make alternative superintendent candidates
relatively more attractive, such as poor performance by the current superintendent. What this
lens makes explicit is the importance of considering forces that operate on both the
superintendent and his or her employer.
This perspective on superintendent turnover also offers flexibility. It can easily
incorporate workforce decisions other than moves to other districts, such as retirement, by
including those possibilities and their costs and benefits in the choice set that superintendents
consider in making the turnover decision. Moreover, it can accommodate dissatisfaction theory
by conceiving of community dissatisfaction as a factor that increases the political costs to the
3 Of course, a high salary might make involuntary turnover more likely if the school board believes it can better satisfy a tax-averse constituency with a less expensive alternative, which points out that some variables may differentially affect the superintendents’ and boards’ decision processes and lead to unclear predictions about net associations with overall turnover.

9
school board of retaining the superintendent relative to seeking a replacement, which in turn
increases the probability of involuntary turnover.4
A simple framework for understanding superintendent turnover based on these ideas is
illustrated in Figure 1. The framework shows that turnover can flow either from the school
board’s decision to terminate a superintendent or a superintendent’s decision to exit, which are
determined by the respective considerations of the relative costs and benefits of retaining the
superintendent (by the school board) and of staying in the district (by the superintendent). What
is left is to identify potential factors that inform these cost-benefit considerations.
Identifying these factors exclusively from prior studies of superintendent turnover is
difficult because of the small size of this research base. Thus, in identifying turnover predictors,
we expanded our literature search to include studies of city manager turnover, which has long
been a focus of scholars in the field of public administration. The numerous similarities between
the two positions make drawing on this literature appropriate. Like superintendents, city
managers are professional, well-educated career executives charged with overseeing the day-to-
day operations of a complex public organization. Both kinds of executives often are hired from
“within the ranks” of management positions with their organizations (Watson & Hassett, 2004).
Also, they are typically hired and then advised by a board of elected local trustees (i.e., the city
council) with whom they co-create policies for the organization, providing an apt parallel with
the relationship between superintendents and school boards (Zeigler, Kehoe, & Reisman, 1983).
Given these semblances, it is likely that the processes underlying city manager and
superintendent turnover share some common themes.5
4 Community dissatisfaction might also make the superintendent’s job less enjoyable, increasing the relative attractiveness of other opportunities and increasing the odds of voluntary turnover as well. 5 Of course, the analogy between superintendents and city managers is imperfect, so the application of the city manager turnover literature to superintendents will be as well. For example, as discussed by Ziegler, Kehoe, &

10
Our review of prior research on turnover among superintendents and city managers
identifies four broad categories of factors that may contribute to the two-sided turnover decision,
which are shown on the left side of Figure 1: characteristics of the school district; characteristics
of the school board, including the board’s relationship with the superintendent; characteristics of
the superintendent relevant to his or her employment opportunities or choices (e.g., experience);
and the superintendent’s job performance, both actual and perceived. In reality, these categories
overlap and inform one another in ways that the figure does not represent; the goal here is simply
to categorize groups of potential predictors of turnover as a basis for empirical examination. We
next discuss the research base supporting each of these four categories. Within each discussion,
we first highlight findings from the existing literature on superintendent turnover, then describe
relevant results from the related literature on turnover among city managers.
District Characteristics
Characteristics of the district in which the superintendent works can factor into both sides
(i.e., employer and employee) of the superintendent turnover decision. In general, because of the
emphasis on dissatisfaction theory in the literature, research has paid more attention to the
impact of these factors on school boards’ decisions to retain the superintendent or not. From this
perspective, district and community characteristics might factor into the board’s decision by
affecting the likelihood that community members will become discontented with the
superintendent and exercise their political power to pressure the school board to make a change
(Alsbury, 2003; Iannaccone & Lutz, 1970).
Reisman (1983), superintendents traditionally have been more insulated from politics, tend to have less disagreement with their boards over their respective roles, and spend less of their time in conflict with the board or community, among other differences.

11
Yet evidence that voluntary turnover in the superintendency occurs frequently—see for
example Byrd et al.’s (2006) finding that 62.5% of superintendents in their study of Texas
reported leaving their districts to pursue better opportunities6—suggests that the influence of
district characteristics should be considered from the superintendent’s side as well. From this
view, district characteristics are important because they help define the working conditions that
factor into the costs and benefits of remaining in the district versus taking other opportunities. Of
particular interest are characteristics that are associated with superintendent stress (Richardson,
1998). Location may be such a factor, as evidenced by case study findings that feelings of
professional isolation can contribute to rural superintendents’ decisions to move (Tallerico &
Burstyn, 1996). Another is the difficulty and complexity of the superintendent’s task
environment, which might be greater in districts that are larger, more heterogeneous, more
financially constrained, or more populated with disadvantaged students (Grissom, 2010; Glass et
al., 2000; Goldstein, 1992; Natkin et al., 2002).
Research on city manager turnover confirms the importance of considering place-based
characteristics. In these studies, city characteristics such as small size, affluence, and racial
homogeneity have been linked to lower rates of turnover (Feiock & Stream, 1998; McCabe,
Feiock, Clingermayer, & Stream, 2008; Watson & Hassett, 2003). This literature has also
recognized the importance of two additional factors in this category that contribute to the
decision to stay or go. The first is salary. Higher salaries yield clear tangible benefits, and salary
is one of the most frequent reasons for leaving cited by exiting city managers (Green, 1987).
Similarly, in Watson and Hassett’s (2003) study of long-serving city managers, respondents
identified salary as an important reason for staying put in the same job over time. The second is
6 These numbers are comparable to those for city managers, of whom half are estimated to leave primarily for professional advancement (DeHoog & Whitaker, 1990).

12
job prestige, which is most often associated with the size of the population served (Watson &
Hassett, 2004). Aside from salary, opportunities to advance their career and move to a larger
government were the most frequently provided reasons for exit in Green’s (1987) survey. Other
studies in this area have also found such moves to be common (Whitaker & DeHoog, 1991;
Barber, 1988).
Parker’s (1996) study of superintendent movers in Texas also identified salary and
prestige as important factors. Studying them empirically is a challenge, however. The highest-
paid jobs are typically the most prestigious (Watson & Hassett, 2004), making them difficult to
disentangle from one another. Also, while prestige and district size may be closely linked, large
districts come with major challenges (e.g., changing demographic trends, difficulties recruiting
personnel) that may offset turnover effects (Glass, Bjork, & Brunner, 2000). Moreover, salary
and turnover are likely endogenous because districts with traditionally high turnover rates may
use higher salaries as a means to attract and retain superintendents. Indeed, despite good
theoretical support that salary matters, one previous analysis of the association between
superintendent salary and turnover arrived at a null result (Byrd et al., 2006).
A related difficulty for analysis of these factors is that the potential impact of salary,
prestige, and other district characteristics must be considered in the context of other available
external opportunities. Low salaries might be particularly relevant to voluntary turnover if higher
salaries are available in districts to which the superintendent might consider moving. At the same
time, characteristics of the superintendent’s current job might influence the likelihood that an
external opportunity becomes available. For example, other districts might be more likely to hire
superintendents who have experience in larger or more diverse districts.
13
The School Board
The relationship between the superintendent and the school board that supervises him or
her is a central aspect of the superintendency. The school board is the superintendent’s statutory
employer and supervisor, and the two parties work together to co-create policy for the school
district. Thus it is little wonder that in case-based studies of superintendent turnover, difficulties
related to working with board members are typically the most frequently identified contributors
(Parker, 1996; Richardson, 1998; Tallerico & Burstyn, 1996). These difficulties include conflict
between the superintendent and board and the challenges of working with a board whose
members cannot cooperate with one another, which are often related (Grissom, 2012; Mountford,
2008). Reasons for poor relationships between superintendents and their school boards include
role confusion, tendencies among some board members to micromanage, and incompatible
approaches to decision-making (Danzberger et al., 1992; Kowalski, 1999; McCurdy 1992;
Mountford, 2008).
Despite evidence that positive board-superintendent relationships are the norm rather than
the exception (Glass, Bjork, & Brunner, 2000), findings from surveys of superintendents support
the conclusion from qualitative studies that conflict with the school board is often an important
factor in a superintendent exit. In surveys of superintendents who had left positions in Nebraska
and South Carolina by Grady and Bryant (1991) and Monteith and Hallums (1989), respectively,
board conflict or interference was cited by more than half of respondents as a contributor to their
departure. In Eaton and Sharp’s (1996) survey of superintendents to ask why their predecessor
left the district, board relationship conflict was identified as a similarly large factor. Though not
articulated in these studies, it is important to emphasize that intraboard conflict and a strained
14
relationship between the board and the superintendent can influence both the superintendent’s
decision to stay or go and the board’s decision to retain the superintendent or not.
The city manager turnover literature has similarly identified relationships among council
members and with the manager as major drivers of exits (e.g., Kammerer et al., 1962; DeHoog &
Whitaker, 1990). In a longitudinal study of city managers in Florida, Whitaker and DeHoog
(1991) found that conflict between council members accounted for a third of managerial
turnover, while conflict between manager and council accounted for just over another quarter of
turnover. Using data from a national sample of city managers, Kaatz et al. (1999) showed that
political conflict with council members increased feelings of burnout among city managers,
which in turn led managers to predict higher likelihoods they would quit. In contrast, respondents
in Watson and Hassett’s (2003) national study of city managers serving 20 or more years in the
same city all reported city councils supportive of the manager, of which 67 percent were “highly
supportive” (p. 75). Though the city manager literature has focused less on the underlying
mechanisms driving council-manager conflict, Svara (1999) finds similar issues of role
ambiguity and confusion among council members that superintendent-board research identifies.
Research has also examined institutional characteristics that might create political conflict or
other mediators that might in turn make superintendent turnover more likely. In particular,
scholars have investigated city council election type under the hypothesis that at-large (as
opposed to sub-district or ward) elections facilitate homogeneity and consensus (see Grissom,
2010, for a discussion). Some studies have found higher levels of city executive turnover in ward
elections (e.g., Clingermayer & Feiock, 1995), while others have found no association (Whitaker
& DeHoog, 1991).

15
Superintendent Characteristics
Personal characteristics of the superintendents themselves also are likely to impact
turnover, though a scarcity of studies means here means we must rely heavily on the city
manager literature. In research specific to superintendent turnover, scholars have suggested the
importance of such personal factors as race and gender (e.g., Tallerico & Burtsyn, 1996), though
other studies have not found effects of these variables on length of tenure (Natkin et al., 2002).
Parker (1996) notes that retirement is a common reason for superintendent exits, suggesting age
is a factor. Natkin et al. (2002) find that superintendents with more advanced degrees are less
likely to turn over, though again, other studies have found no degree effects (Byrd et al., 2006).
The difficulty of nailing down the impact on turnover of superintendent qualifications in
general is that there are potentially competing “push” and “pull” effects. Take the example of job
experience, the most studied personal characteristic in the city manager literature. On one hand,
more experienced managers become more settled and more invested in their communities,
making it less likely that they would want to move. On the other hand, external opportunities are
likely to pull harder on superintendents with more desirable characteristics, such as greater
experience, which may make moves more likely. In light of these countervailing forces, it is not
surprising that empirical results are mixed. Some studies find that inexperienced city managers
turn over at higher rates, particularly as they move for professional advancement (Barber, 1988;
DeHoog & Whitaker, 1990; Feiock & Stream, 1998; Green, 1987; Whitaker & DeHoog, 1991).
However, Whitaker and DeHoog (1991) reported that older, more experienced managers are
more likely to leave, not for advancement but for retirement. This result emphasizes the
importance of considering age alongside experience in examining turnover.

16
City manager research also has examined the role of other qualifications. One is
academic preparation. Despite the potential impact on external opportunities, studies of city
government generally have found that higher degree attainment is associated with lower turnover
(Feiock & Stream, 1998; Whitaker & DeHoog, 1991). Other studies find that “homegrown” city
managers—i.e., those hired from within the system rather than from outside—serve longer
tenures (Watson & Hassett, 2004).
Superintendent Performance
The final factor we identify as contributing to superintendent turnover is job
performance. How well the superintendent performs in the job is relevant to both the school
board’s and superintendent’s decisions about continuing employment. From the school board’s
perspective, the direction of the relationship between performance and this decision presumably
is clear. Low-performing superintendents are more likely to generate community or board
dissatisfaction, increasing the probability that the board chooses to let the superintendent go.
From the perspective of the superintendent, the direction is murkier. To the degree that strong
performance increases job satisfaction, performance and voluntary turnover may be negatively
correlated. At the same time, strong performance in one district may increase the pull from other
districts who seek to hire away an effective superintendent, in which case the probability that a
superintendent voluntarily leaves his or her current district might be greater for high performers.
Given these different forces, it is also possible that the overall relationship between performance
and turnover is nonlinear, with low-performers facing pressures that push them out of the district,
high-performers facing outside opportunities that draw them away from the district, and average
performers facing neither of these forces and thus showing greater propensities to stay.

17
Testing a relationship between turnover and performance assumes that a reasonable
measure of performance is available. Given the current test-based high-stakes accountability era,
student test scores are one candidate, though at least one prior empirical study questions the
assumption that superintendents affect student test scores, at least in the short term (Ehrenberg,
Chaykowski, & Ehrenberg, 1988). An alternative is subjective assessment of superintendent
performance by the public or school board, for example, which may have more direct relevance
for the superintendent’s continued employment.
Aside from appropriate specification and measurement of performance in an empirical
model, an additional challenge for identifying the link between this construct and superintendent
turnover is the interrelationship performance has with the other categories we have discussed.
For example, poor superintendent performance might be both a cause and effect of intra-board or
board-superintendent conflict. Moreover, a superintendent’s ability to perform at a high level
may be a function of the district environment or his or her own qualifications.
Though there is some evidence that districts consider performance in superintendent
hiring decisions (Hamidullah, Wilkins, & Meier, 2009), we identified no studies that tested the
role of prior performance on superintendent performance directly.7 Tests of this association for
city managers have led to mixed results. Measuring performance as economic growth in the
municipality, studies have suggested both that poor performance may push city managers out of
office and that managers capitalize on strong performance by moving on to more prestigious city
manager positions (see Feiock et al., 2001; McCabe et al., 2008).
A simple summary of the discussion in this section might be that research on the
superintendency and elsewhere in the public sector suggests that we can no longer frame 7 We do note that research on executives in other sectors have studied the link between performance and turnover extensively (e.g., Allgood & Farrell, 2000; Barro & Barro, 1990; Warner, Watts, & Wruck, 1988; Weisbach, 1988; as cited in Hamori, 2006).

18
superintendent turnover merely as a function of community and school board relations. A
complex set of factors weighed by multiple actors determine turnover decisions. In the next
section we evaluate a set of these factors in the context of superintendent turnover in California.
Data and Methods
The primary data for this study come from two original survey data collections. During
the 2005-06 academic year, one of the authors collected survey data from a stratified random
sample of school board members in California via mailed questionnaires (see Grissom, 2010).
The survey questioned respondents about the practices of their boards, their recent elections,
their attitudes about their work, and other areas pertaining to school board practice. A total of
1,110 board members on 222 school boards8 were surveyed, with 703 responding, a response
rate of 63%. At the same time, a shorter survey of superintendents in the 222 districts was also
conducted; the superintendent survey achieved a response rate of 71%. Survey data were merged
with administrative data obtained by the California Department of Education (CDE) and the
National Center for Education Statistics’ (NCES) Common Core of Data (CCD).
The independent variables included in the study cover each of the four categories of
predictor variables identified in the conceptual framework (Figure 1). The first is district
characteristics, all of which were gleaned from CDE and CCD administrative data for the same
year as the survey. To capture location, we included indicators for whether the district is urban or
rural (suburban omitted). As proxies for the complexity in the district environment, we included
the percentage of students in the district who are free or reduced price lunch eligible, a measure
of poverty; the percentages of the students in the district who are African American and
8 California has approximately 975 school districts, so information was obtained from nearly one-fourth of them.

19
Hispanic; per-pupil expenditures, which we adjusted by the NCES-supplied Comparable Wage
Index to account for regional cost differences (Taylor et al., 2001)9; and an indicator for whether
the district is unified, or contains all K-12 grades, as opposed to elementary or secondary only.
Superintendent salary came from CDE finance files. Finally, because prior research has closely
linked job prestige to district size (e.g., Parker, 1996), we included student enrollment.10 As
discussed below, we experimented with a number of operationalizations of this variable (e.g.,
natural log) because of the highly right-skewed distribution of district size across California
school districts.
The second category in the conceptual model is characteristics of the school board. Our
review of the literature suggested that it is important to include measures of how the school
board works together and how it works with the superintendent. Four such items were available
from the school board survey.11 These items, shown in Table 1, capture four aspects of school
board functioning: working together, communicating, governing effectively, and maintaining
good relations with the superintendent. As is apparent in the table, these items were all highly
correlated, suggesting that they measure one underlying latent performance factor (Cronbach’s α
= 0.87). That is, boards that work together well also work well with the superintendent, so
treating those variables as distinct would be potentially misleading and induce multicollinearity
in the empirical models. Instead, we conducted a factor analysis of the variables, which revealed
one underlying factor (Eigenvalue = 2.6). We label this factor school board function. Factor
scores for this trait were calculated for each district using the standard linear scoring method. To
confirm that the validity of this measure of school board as a measure of the board’s relationship
9 The Comparable Wage Index is a measure of systematic salary variations across regions, based on data from the U.S. Census and the Bureau of Labor Statistics. Because personnel costs are the largest line item in school district budgets, the index helps adjust district expenditures for the cost of doing business in that geographic area. 10 As previously discussed, district size also serves as a measure of district complexity. 11 Board member responses were averaged at the board level.

20
with the superintendent, a similar analysis was performed on a comparable set of items from the
superintendent survey, which also revealed one underlying factor (Cronbach’s α = 0.88). The
correlation between the two factored variables was 0.69, suggesting the two variables indeed
measure the same construct. We used the school board-derived measure in the multivariate
analysis to avoid bias from superintendents who plan to leave the district and thus rate their
school boards’ performance less highly.
City manager turnover studies also identify board election type as a potential contributor
predictor of board-superintendent decision-making and relationship quality (Clingermayer &
Feiock, 1995). Thus we also included an indicator variable for whether board members report
being elected in single-member (rather than at-large) elections.
The third category of independent variables is superintendent characteristics. Because
they are gleaned from the superintendent survey, we have these data for only a subset of the full
set of surveyed districts. For demographic characteristics, we included indicators for whether the
superintendent is female or nonwhite12, as well as age in years. Given the large number of city
manager turnover studies investigating experience, we included the number of years the
superintendent has held his or her current position. We also used three measures of qualifications
that may make the superintendent more desirable to their current (or another) district. The first
two measure academic preparation. The first is an indicator for whether the superintendent holds
a doctorate. The second is a measure of the competitiveness of the undergraduate institution from
which the superintendent graduated, which other studies have identified as a proxy for strength
of academic background (e.g., Ballou, 1996) and linked to greater mobility among school
principals (Baker, Punswick, & Belt, 2010). We operationalized this variable as an indicator for
12 Because of the small number of nonwhite superintendents in California, we did not decompose this variable by race or ethnicity.

21
attending a college at the level of “Competitive” or higher according to Barron’s ratings.13 Third,
we included an indicator for whether the superintendent reports having been promoted to his or
her position from within the school district, a relevant factor in other turnover studies (e.g.,
Watson & Hassett, 2004).
Lastly, we included two measures of superintendent performance. Assuming that
superintendents are evaluated—formally or informally—in part on student test score
performance in the last year, we included as an “objective” measure growth on the Academic
Performance Index (API) during the 2005-06 academic year. CDE calculates API growth for
accountability purposes for each school district in each year based on weighted growth in
standardized test score performance across grades and subjects.14 As a subjective measure, we
used school board members’ perceptions of superintendent performance in general, measured
with school board survey responses to the statement, “The superintendent of my district is doing
a good job. Responses employed a five-point Likert scale and were averaged at the district level.
Measuring Superintendent Turnover
Superintendent turnover was measured by whether the superintendents in the original
sampling frame of 222 school districts were still the superintendent in the district in January of
2009, approximately three years after the survey. To ascertain whether the surveyed
superintendent remained in his or her position, research assistants queried school district web
13 Respondents were asked what institution they obtained their undergraduate degree from; to these institutions we assign ratings of competitiveness using data on colleges from Barron’s Profiles of American Colleges in 1980, the closest year corresponding to the time at which the median-aged principal would have attended college that we could obtain. 14 In general, CDE changes the set of metrics and weights used to calculate the API from year to year, which prevents us from using the API to calculate long-run measures of district performance. Each year CDE does provide a one-year API growth measure based on a common set of metrics and weights to make consecutive year comparisons feasible; it is this growth measure that we utilize in our analysis.
22
sites and contacted district central offices. From this search, we created a binomial measure of
turnover coded as 1 if the superintendent had left the district after three years and 0 if not.
Once a list of superintendents who had left their districts had been compiled, we
attempted to identify the reason the superintendent left, first by searching for newspaper accounts
in Nexis, Factiva, and online archives of local newspapers, then by examining school board
meeting minutes on district web sites and by contacting current district office personnel. Among
the 99 superintendents identified as turning over, we were able to categorize turnover via
newspapers or district contacts for 93 of them. These categories, with counts and percentages in
parentheses, were: retirement (N = 37, 40%); termination (N = 2, 2%); resignation to take a job
in another district (N = 25, 27%); resignation for other or unapparent reasons (N = 17, 18%); or
the superintendent was in an interim position or in a position that was eliminated (N = 12,
13%).15 We make use of these categories in our multinomial analysis.
Modeling Superintendent Turnover
To investigate the factors contributing to superintendent turnover, we ran two types of
models. The first, which is the typical analysis employed in quantitative studies of employee
turnover, models the probability that a superintendent exits as a function of observable
characteristics. For this analysis, our dependent variable was the binary turnover indicator we
obtained for virtually all districts in the original sampling frame. Our independent variables were
the district, school board, superintendent, and performance measures described previously.
15 Nearly all of the turnover incidents were categorized from newspaper accounts, though in 8 cases we relied on calls to district offices. Because we cannot be sure that the sources for these categories are completely reliable, it is likely that we have introduced some measurement error into these turnover classifications that likely is not present to the same degree in the binary turnover measure, which only required knowledge of whether the superintendent was still in the district and in most cases was apparent from district web sites or other reliable sources.
23
Because of the binary nature of the response variable, these models were estimated via standard
logistic regression techniques (see Appendix for further description).
To extend the approach typically employed in the turnover literature, however, we next
utilized the data we obtained on why each superintendent exited. Here we separated turnover into
categories to test the possibility that some observable factors may predict some kinds of turnover
but not others. For this analysis, we considered retirement as one class of turnover and
resignations and terminations as another, which we label non-retirement exits.16 The 12
superintendents in interim or eliminated positions were dropped. We then estimated the
probability of falling into the categories of {stay, retirement, non-retirement exit} using
multinomial logistic regression (see Appendix). The same variables used in the binary analysis
were included as predictors.17
Results
Descriptive Analysis
Table 2 provides descriptive statistics for two samples: the full sample of districts from
which school board responses were obtained (which is almost every district to which the school
board and superintendent surveys were administered), and the subsample of districts for which
responses were obtained from the superintendents. Because the use of superintendent survey data
will impose a large restriction on the samples employed in some models, it is important to verify
that the two samples are similar on observable characteristics.
16 We chose to group terminations with resignations rather than consider them separately because we only recorded two terminations in the entire data set and because we could not be sure that some of the resignations were not de facto terminations themselves, which might occur if a superintendent resigned under pressure. Dropping the terminations makes little difference for the estimates. 17 Any measurement error in the categorical measures (see footnote 15) can result in inflated standard errors in the multinomial models, though given the groupings used, this concern is only relevant to the degree that we unreliably differentiate retirement from other forms of exit.
24
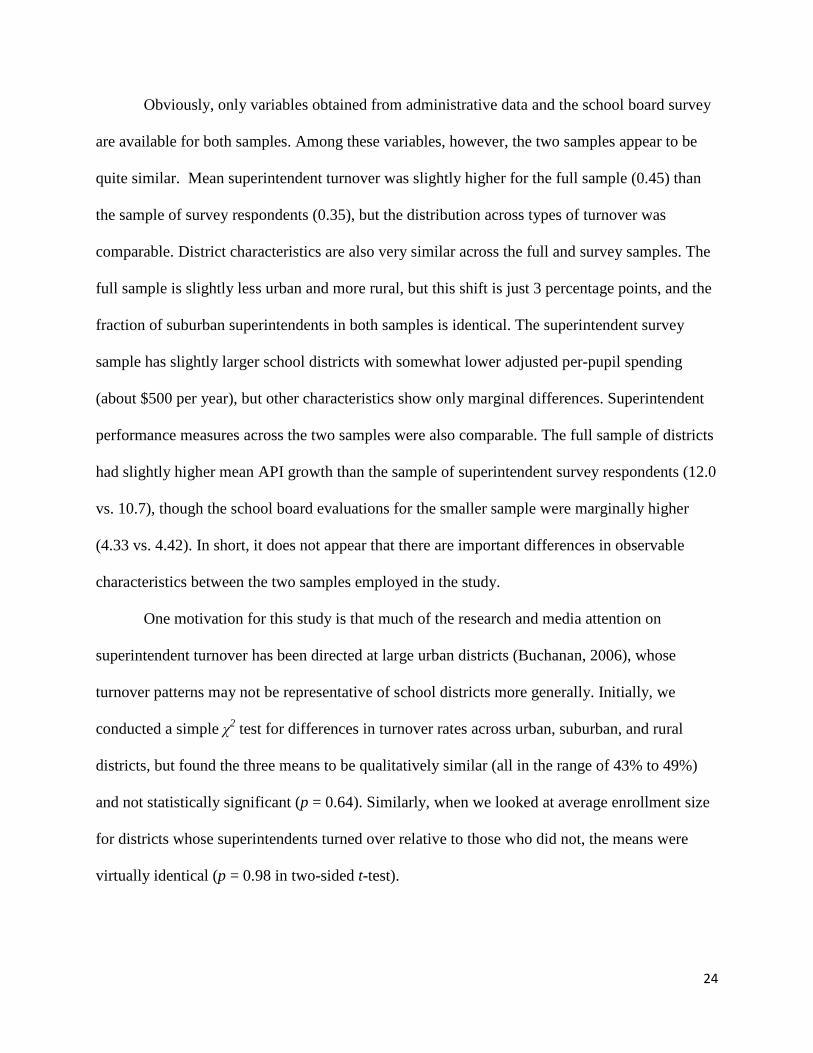
Obviously, only variables obtained from administrative data and the school board survey
are available for both samples. Among these variables, however, the two samples appear to be
quite similar. Mean superintendent turnover was slightly higher for the full sample (0.45) than
the sample of survey respondents (0.35), but the distribution across types of turnover was
comparable. District characteristics are also very similar across the full and survey samples. The
full sample is slightly less urban and more rural, but this shift is just 3 percentage points, and the
fraction of suburban superintendents in both samples is identical. The superintendent survey
sample has slightly larger school districts with somewhat lower adjusted per-pupil spending
(about $500 per year), but other characteristics show only marginal differences. Superintendent
performance measures across the two samples were also comparable. The full sample of districts
had slightly higher mean API growth than the sample of superintendent survey respondents (12.0
vs. 10.7), though the school board evaluations for the smaller sample were marginally higher
(4.33 vs. 4.42). In short, it does not appear that there are important differences in observable
characteristics between the two samples employed in the study.
One motivation for this study is that much of the research and media attention on
superintendent turnover has been directed at large urban districts (Buchanan, 2006), whose
turnover patterns may not be representative of school districts more generally. Initially, we
conducted a simple χ2 test for differences in turnover rates across urban, suburban, and rural
districts, but found the three means to be qualitatively similar (all in the range of 43% to 49%)
and not statistically significant (p = 0.64). Similarly, when we looked at average enrollment size
for districts whose superintendents turned over relative to those who did not, the means were
virtually identical (p = 0.98 in two-sided t-test).

25
A closer examination of the turnover-district size relationship revealed a striking pattern,
however, namely that superintendent turnover rates are very similar across the size distribution
except for the very largest districts. To illustrate, a plot of mean turnover rates by decile of
enrollment size is shown in Figure 2. Through the first nine deciles, the average three-year
turnover rate is 45%. For the largest 10% of districts, however, this rate is 71%. A t-test of this
difference shows it to be statistically significant (p = 0.01). Note that the smallest district in this
highest decile, which has a mix of suburban and urban districts, enrolls approximately 29,000
students; the largest two enroll more than 100,000 students. From these observations we draw
two conclusions. First, there is a suggestion that indeed turnover in the largest districts may
differ from that in other districts, with district size more relevant than simply being urban.
Second, care should be taken in the operationalization of district size in the multivariate models.
Logistic Regression Results: Binary Turnover Measure
Our first multivariate analysis models the binary turnover indicator as a function of
observable characteristics using logistic regression. Because of initial issues with
multicollinearity, it was necessary to drop superintendent salary from the models due to its high
correlation with the district size (r ranged from 0.70 to 0.83, depending on whether district size
was entered in natural log form). After dropping salary, models were again tested for
multicollinearity problems by calculating variance inflation factors (VIF); despite moderately
high correlations among some remaining variables (e.g., rural and district size: r = -0.64; percent

26
Hispanic and percent free/reduced lunch: r = 0.66), no variable had an individual VIF above 4.0,
and the mean VIF was just 1.8, suggesting multicollinearity concerns were no longer present.18
The logistic regression results are shown in Table 3. Coefficients are displayed as odds
ratios. The first model includes only district-level characteristics. As in the descriptive analysis,
there is no association evident between the location variables (urban and rural) and turnover. For
student demographic characteristics, student poverty is positively statistically associated with
higher turnover, which is consistent with our expectations. Percent Hispanic is negatively
associated and percent African American shows no significant association. These patterns hold
across all five columns.19 The results regarding student race and ethnicity characteristics are
surprising given studies of turnover among school administrators, which have found rates to be
higher in districts with larger numbers of minority students (e.g., Baker, Punswick, & Belt,
2010). Neither per-pupil spending nor unified status is associated with higher turnover in column
1, though note that unified status is positive and significant once superintendent characteristics
are added to the model (column 3).
Column 1 also shows no evidence that student enrollment size is associated with higher
turnover. This variable is entered in natural log form to reduce undue influence from outliers,
though a similar result holds if the log is not taken. We saw in Figure 2, however, that the largest
districts do seem to have higher turnover rates, so in column 2 we dropped the natural log of
enrollment size in favor of an indicator for being in the top decile of enrollment to see if this
18 Aside from the correlations mentioned, few pairwise correlations among independent variables were above 0.30. District size (ln) was the variable most consistently moderately correlated with other variables in the models, including with urban (0.51), percent African American (0.44), and adjusted spending (-0.49). 19 This pattern also holds in a model that is not conditional on any other factors. It is important to note that the percent Hispanic coefficient conditions on student poverty, and the two are highly correlated (r = 0.6), so we would not conclude that the average district with more Hispanic students has lower superintendent turnover. In fact, if free and reduced price lunch is dropped from the model, percent Hispanic becomes statistically insignificant.

27
effect holds after conditioning on the other variables in the model.20 Indeed, the top 10% of
districts according to enrollment size appear to have much higher turnover rates than the bottom
90% (the odds are 4.5 times higher), even accounting for other district characteristics.21
Columns 3, 4, and 5 add school board characteristics, superintendent characteristics, and
the two together. The results in columns 3 and 4 are very similar to those in column 5, so we
focus on column 5 in the discussion. For school board characteristics, column 5 shows that the
survey-based measure of how well the school board functions, which includes the relationship
with the superintendent, is a significant predictor. For a one standard deviation increase in the
function variable, the model predicts a 37% decrease in the odds that a superintendent turns over.
That is, districts with high-functioning school boards tend to have much less superintendent
turnover. School board election type shows no evidence of an association.
Lastly, we examine superintendent characteristics. The measures of fit increase
significantly when these characteristics are added, suggesting that superintendent-level measures
have substantial power to explain who will leave their jobs. Though the gender and race/ethnicity
variables are insignificant, column 5 shows the important role of age: superintendents are much
more likely to exit as they get older. This finding is consistent with the descriptive observation
made above that retirements constitute a large portion of exits. We also tested whether there were
nonlinear patterns for age by entering age in quintiles rather than linearly, but we found no
evidence of nonlinearity (not tabulated). We performed a similar exercise for experience but
found neither linear (as shown in column 5) nor nonlinear (not shown) associations for this
variable. Among other qualifications, we find no evidence that superintendents with doctorates
20 We also experimented with other ways to operationalize this variable. Including indicator variables for all of the deciles (excluding the first) created problems with multicollinearity. Using quintiles instead reduced multicollinearity, but none of the quintiles was statistically significant, nor were either terms significant if we used enrollment size and size squared. 21 This variable is still significant if substituted for ln(Enrollment) in the full model in column 5.

28
turn over at different rates. However, attending a more competitive college appears to be
associated with significant lower turnover (p < 0.10 in column 4, p = 0.12 in column 5),
providing evidence that superintendents with stronger academic preparation are more likely to
stay. Superintendents who were promoted from within the district are similarly likely to remain
in their positions. Odds ratios suggest reductions in odds of leaving of approximately 70% are
associated with these two variables.
Table 4 adds the three performance measures. All of the variables from Table 3, column
5 are included, though because their coefficients remained largely unchanged, they are omitted
from the table for brevity. Column 1 shows the result of adding only short-term API growth, for
which we find no evidence of an association.22 Model 2 instead adds school board members’
subjective evaluations of superintendent performance. Here, the effect is large, with higher
evaluations associated, as expected, with much lower turnover odds. A one-point move in the
evaluation, which is equivalent to a move from approximately the 25th to the 75th percentile for
this variable, is associated with a reduction in the odds of superintendent turnover of
approximately 75%. Column 3 includes both measures together; the patterns are unchanged.23
Clearly, there is a role for superintendent performance in the turnover process, but this role is
better captured by the subjective assessment of the superintendent’s employer than in the state’s
test-based assessment of short-term school district performance.
22 An alternative approach would be to include 2004-05 API level, either separate from or in addition to API growth, to control for district performance status. We took this approach initially. However, because of the high correlation between API level and the percentage of students eligible for free and reduced price lunch (r = 0.75), we dropped API level from the models. 23 Perhaps unexpectedly, API growth is uncorrelated with either the board measure of superintendent performance or the school board function factor. The correlation between the superintendent performance and board function measures is moderate (r = 0.26), suggesting that high-functioning school boards indeed have higher-performing superintendents (creating the function variable from superintendent survey responses instead shows that this correlation is in fact not merely a function of common source bias). While this correlation is logical, the performance of the two groups is not as highly correlated as one might expect, given the role of school boards in hiring and often managing the responsibilities of the superintendent.

29
Multinomial Logistic Regression Results: Separating Retirements from Other Turnover
The logit results suggest that a more nuanced examination of superintendent turnover
than the typical binomial approach is appropriate. The relationship between turnover and age, in
particular, suggests that retirements should be separated from other forms of turnover. Thus, we
next ran multinomial logistic regressions that estimated the probability of superintendent
retirement and non-retirement exit separately relative to staying put, which was the base
category. Since including the superintendent characteristics reduced the analytic sample size,
Table 5 displays models including and excluding those variables. Relative risk ratios are
reported.
The first important observation from Table 5 is that very few variables consistently
predict superintendent retirements. Only percent Hispanic (negatively) predicts retirements in
both models; API growth is statistically significant in model 1 but not model 2, and unified
district status is significant in model 2 but not model 1. Among superintendent characteristics,
only superintendent age is statistically significant, and, as expected, it strongly positively
predicts retirement probability (odds ratio = 1.77, p < 0.01).
In contrast, while superintendent age is not associated with non-retirement exits (i.e.,
resignations and terminations), most other factors shown to be associated with turnover in the
logistic regression models show up as significant only for the non-retirement exits. Because the
patterns are consistent across models, we focus on model 2. Among district characteristics,
student poverty is associated with higher probabilities of non-retirement exits, while percent
Hispanic is again associated with lower probabilities. Unified district status has a large positive

30
coefficient, though its p-value misses conventional cutoffs for statistical significance (p =
0.14).24
Higher school board function is associated with much lower rates of non-retirement exit
(odds ratio = 0.29, p < 0.10). There is also evidence that school board’s subjective evaluation of
superintendent performance is negatively associated with non-retirement turnover. The
coefficient is statistically significant at the 0.05 level in model 1, and although no longer
statistically significant at conventional levels in model 2, the odds ratio is virtually unchanged,
suggesting that insignificance results from the smaller sample size (and resulting larger standard
error) in model 2 rather than attenuation of the association. Among superintendent
characteristics, none are meaningfully associated with non-retirement exit probability, with the
exception of being hired from within, which is much more likely to be a characteristic of stayers
than exiters (odds ratio = 0.03, p = 0.02).
Overall, the findings from the multinomial logit models suggest that kind of turnover
should be considered in studies of superintendent turnover. Different turnover types are
associated with different predictors. In particular, retirement appears to be largely a function of
age, whereas other factors—including district characteristics and how the school board
functions—matter for other kinds of turnover decisions.
Analysis of Superintendent Moves
24 The natural log of district enrollment is not statistically significant. Entering this variable as an indicator for “top decile” in model 1 results in statistically significant odds ratios of approximately 5 for both retirement and non-retirement. This coefficient cannot be estimated in model 2 because of the small number of top decile districts with superintendent survey respondents. If “top quintile” is used instead, the variable is only significant for non-retirement exits (odds ratio = 23, p = 0.10). Clearly, the relationship between district size and superintendent turnover is a complicated one in these data.

31
Thus far, we have considered characteristics of superintendents and their present work
environments that predict turnover. The theoretical discussion setting up this analysis, however,
suggested that external factors matter in turnover decisions, as when superintendents leave to
pursue more attractive opportunities (higher pay, better working conditions) in other school
districts. Becuase testing directly for the impact of such outside factors on turnover is difficult
given limitations on our data, we instead conducted a descriptive analysis of superintendent
moves to provide suggestive evidence. The idea underlying this analysis is that differences in the
“sending” and “receiving” districts for superintendents who change jobs might tell us about how
superintendents think about potential alternative employment opportunities. If superintendent
moves mirror those of principals, for example, we might expect superintendents to tend to move
towards districts with fewer low-income and minority students and higher achievement (e.g.,
Clotfelter, Ladd, Vigdor, & Wheeler, 2007). If superintendents move to increase job prestige, we
might expect moves towards larger districts and larger budgets.
For this investigation, we compared the 2005-06 characteristics of former and new school
districts among superintendents we observe moving to new superintendent positions between
2006 and 2009. Information about the new employer of superintendent movers was captured
from local news sources and, in some cases, direct contact with the school district. Among the 25
superintendents we classified as being “hired away” above, 13 became superintendents in other
California districts, and 9 took other leadership positions within California school districts, such
as positions as assistant superintendents, and one took an undetermined position. We grouped
these together. Two additional superintendents took positions outside California, so we excluded
them from our analysis. The average distance of a move, calculated as the distance between the
administrative offices for the two school districts, was 94 miles (s.d. = 59).

32
Because of the small sample size, we conducted simple non-parametric comparisons of
the district-level characteristics. For interval-level variables, we conducted Sign Tests of the null
hypothesis that median difference between the former and new district is zero on each
characteristic (see Snedecor & Cochran, 1989). For binary variables, we conducted McNemar
Exact Tests for equality of the proportions for the former and new districts. The results are
shown in Table 6.
In interpreting these results, it is important to remember that statistical power is relatively
weak. Still, two important results stick out. The first is that there is no evidence that
superintendents tend to sort towards districts with fewer traditionally disadvantaged students. In
fact, median differences suggest that superintendents tend to move towards districts with more
African American and Hispanic students, though neither of these differences is statistically
distinguishable from zero. Similarly, there is no evidence in Table 6 that superintendents move to
districts with higher achievement levels or achievement growth.
The table does, however, give an indication of some significant trends in superintendent
moves. Consistent with the hypothesis that superintendents tend to move to more prestigious
positions, we find that superintendent moves typically result in a relatively large increases in
enrollment size. At the median, this difference is approximately 2,300 students, statistically
significant at the 0.01-level. Not surprisingly, the move to larger districts coincides both to much
larger total budgets25 and to differences in geography, with superintendents tending to move
from rural districts to suburban ones. Among movers, 57% were initially employed in rural
districts, but, after moving, only 9% were, a statistically significant difference (p < 0.01). In
contrast, only 39% of superintendent movers initially worked in suburban districts, compared to 25 Interestingly, in per-pupil terms, superintendent moves tend to correspond to reductions ($7,726 to $6,628, at the median, p = 0.09); total budget differences appear to be due entirely to increases in district size, not by higher spending per student.

33
76% after moving (p < 0.05). There was also a positive trend in the fraction running urban
districts (4% to 13%), but this difference cannot be distinguished significantly from zero given
the lack of statistical power. The other trend is that superintendents systematically move towards
higher-paying districts, with an average salary differential of about $21,000, at the median (p <
0.01).26
Discussion and Conclusions
This study makes several contributions. First, it introduces the idea of considering
superintendent turnover in the context of the broader superintendent labor market—in which
decisions made both by school boards and superintendents are important—allowing for
consideration of a broader set of factors than in most prior literature on the topic. Second, it
draws on insights from a longer public administration literature on city manager turnover to help
frame turnover among superintendents, whose positions are similar to those of city managers
along key dimensions. Third, it evaluates the contributions of factors prior superintendent
turnover research has suggested as important, such as the role of the school board, alongside
factors that have previously gone unexamined, such as evaluations of superintendent
performance. Fourth, it separates retirements from other kinds of moves empirically to provide a
more precise assessment of how different factors contribute differentially to those turnover
decisions. Finally, it sheds light on patterns in superintendents’ moves across districts, pointing
toward a potentially fruitful area for further empirical inquiry.
26 Because we use 2005-06 values, the median salary difference is not the same as the pay jump the superintendent receives. We cannot calculate this number directly because we cannot always pinpoint from our sources the precise year that the superintendent changed districts. We also do not know the characteristics (e.g., experience) of the superintendent who held the superintendent’s job in the receiving district previously, so we cannot be sure that the salary represents the salary a new superintendent with different characteristics would receive.

34
The results paint a complex picture of superintendent turnover and one that questions
some commonly held assumptions. We introduced this study with the idea that much of what we
know collectively about superintendent turnover comes from cases of turnover in the largest
school districts (e.g., Buchanan, 2006). Considered alongside a representative set of school
districts of other sizes, however, those districts appear atypical; three-year superintendent
turnover rates in the top decile of enrollment size are approximately 30 percentage points higher
than in the rest of the distribution, highlighting the need to expand our frame beyond case studies
of urban districts if we wish to understand superintendent turnover more generally. Even
controlling for district size and urban status, superintendent turnover is associated with other
markers of a challenging district environment, such as a greater instance of student poverty. The
inverse association between wealth and turnover—observed in turnover studies for other
positions in school systems, including school administrators (e.g., Gates et al., 2006)—is
potentially troubling, showing that turnover is higher in the districts that potentially might benefit
most from stability at the top and the opportunities for sustained reform that come with it
(McAdams, 1997).
Our results also question the assumption that community dissatisfaction—a dominant
construct in this literature since Iannaccone and Lutz (1970)—plays a central role in most exits.27
In our data, clear terminations of superintendents are very rare, though we do not discount the
likelihood that some of the exits we coded as resignations were instances of superintendents
being pushed out by dissatisfied school boards, which may not have been evident from the
sources we consulted. Also, we do find that superintendents leave more often when the school
board views their job performance less positively. Still, consistent with other studies concluding 27 Importantly, given data constraints, our study does not directly test one of the main tenets of dissatisfaction theory—that superintendent turnover is often driven by turnover among school boards—so we cannot assess its explanatory power relative to other factors we consider. This avenue would be a fruitful one for future work.

35
that most superintendent turnover is in fact apolitical (Alsbury, 2003), we both document the
importance of retirement as a frequent source of turnover (more than a third of those we observe)
and provide evidence that superintendents often move for career advancement. Despite the
apparent challenges associated with positions in larger urban districts that later induce high
turnover, superintendents tend to move towards positions in those districts, perhaps because such
moves increase pay and prestige (Parker, 1996). Similar patterns regarding moves for
professional advancement have been observed among city managers (DeHoog & Whitaker,
1990; Glass et al., 2000). The importance of career advancement as a driver of superintendent
turnover is consistent with our argument that turnover should be considered as an outcome in a
labor market in which better external opportunities can attract superintendents away from their
positions.
The pronounced trend for movers away from rural districts raises the question of whether
such districts are used by some superintendents as “stepping stones” to more desirable positions.
Studies have documented this phenomenon among other public sector workers in rural areas,
including police officers (Wood, 2001), city managers (Watson & Hassett, 2004), and school
administrators (Dlugosh, 1994). Although average turnover rates are not statistically higher in
rural districts, the trend we observe suggests that rural districts have less success in hiring
experienced superintendents than their more urban counterparts when turnover occurs. It also
illustrates that the “pull” of career advancement must be considered alongside the “push” of
difficulties in the current work environment as an important contributor to superintendent exit.
Adding further complexity, evidence suggests that these two forces can operate on the same
superintendent simultaneously. For example, even when a superintendent move sends him or her

36
to a larger district with better pay, the superintendent often leaves behind a school board with
whom the working relationship was poor (Chance & Capps, 1992).
These poor relationships with the board—pegged to board operational ineffectiveness and
conflict more generally—are important predictors of superintendent exits in our study, echoing
findings from prior work (e.g., Danzberger et al., 1992). Although a key predictor, in most
districts both the school board and the superintendent rate the board as high-functioning and their
mutual relationship as positive in our survey data; for example, the average response to the item
rating the school board-superintendent working relationship was 4.4 (on a 5-point scale) in the
school board survey data and 4.5 for the superintendents (see also Glass et al., 2000).
Unfortunately, high-conflict school boards with poor superintendent relationships are more likely
in (already turnover-prone) large, low-income districts (Danzberger et al., 1992; McCurdy, 1992;
Grissom, 2010), compounding the likelihood that superintendents (or the board) become
dissatisfied with their current employment situation and increasing the likelihood of turnover in
those districts (Whitaker & DeHoog, 1991). If board dysfunction drives this sort of voluntary
turnover, or if board dysfunction creates dynamics that makes them more likely to push out
superintendents involuntarily, efforts to improve how well the school board works together and
with the superintendent via board training or professional development may pave the way for
greater leadership stability (Mountford, 2008; Grissom, 2012).
Hiring “homegrown” superintendents rather than seeking district leadership from outside
may also help counteract drivers of superintendent instability. Superintendents promoted from
within the district are much less likely to leave, perhaps because, as Carlson (1961) found, they
are more committed to the community. Yet Carlson (1961) also found that leaders hired from
inside the organization are oriented towards maintenance of the status quo and are less likely to
37
develop new policies that “prepare the organization for new ways of functioning” (p. 226), which
suggests that increased leadership stability can come at the expense of district reform. Under-
performing school districts may in fact be better off seeking innovative leaders from outside the
district even if it means a shorter tenure is likely.
The study faces a number of important limitations. First, the data we used were drawn
exclusively from California. While its diversity and size—it educates one-eighth of the nation’s
students—make California a useful setting for this examination, they also set the state apart.
School districts in California tend to be more racially and economically heterogeneous and have
less flexibility over resource use than districts in other states. Though the structure of
superintendent and school board positions are similar to those elsewhere, we cannot be sure that
our results directly generalize outside the state.
A second limitation for the study is its inability to adequately tease apart voluntary and
involuntary superintendent turnover and the factors that differentially predict them. In part, this
was a sample size problem; we identified too few instances of involuntary turnover to examine it
separately. This inability to identify cases, however, may have reflected our data collection
approach. Involuntary superintendent turnover can be a politicized, controversial affair, and both
participants and observers may have conflicting views of whether a superintendent is being
pushed out or is resigning for other reasons. Formally, the superintendent may characterize a
resignation as personal (e.g., to spend more time with family) or as facilitating other employment
opportunities when it was, in fact, driven by board disagreement or an inevitable firing. Calls to
districts, news accounts, or minutes from school board meetings may reflect only the formal
story in this case, distorting our attempt to categorize. Future studies of superintendent turnover
might attempt to triangulate the reasons for turnover using a combination of approaches,

38
including surveys of multiple stakeholders, key informant interviews, media accounts, and other
sources. Such data would allow deeper examination of our conceptual model.
Future analysis in this area would also benefit from longitudinal data. The data employed
here are cross-sectional, which have little power to identify causal relationships. In a cross-
section, we cannot be sure that the association between turnover and school board function, for
example, is not driven by some unobserved characteristic of the school district (e.g., low social
capital) that predicts both variables. Panel data can facilitate more rigorous analytic approaches
(e.g., district fixed effects) that can help deal with such concerns. Data on superintendent
employment over time would also facilitate other modeling approaches—i.e., survival analysis or
a competing risks hazard model that allows for different kinds of exit—with more power to
uncover the predictors of turnover at different stages in a superintendent’s tenure. Panel data can
also provide means for dealing with the kinds of endogeneity that arise between turnover and
variables such as salary. Though salary was a component of our conceptual model, limitations on
the empirical model prevented us from treating it appropriately, though we do uncover
suggestive evidence from a descriptive relationship between salary and mobility. Because salary
is an obvious potential policy lever districts may pull in attempting to prevent superintendent
turnover, future work that rigorously identifies the salary-turnover relationship would make a
useful contribution to the literature.
Another relationship for which this study only scratched the surface was that between
turnover and superintendent job performance. School board members’ subjective evaluations of
the superintendent’s performance predicted turnover, but district performance did not. Perhaps
superintendents are not held accountable for short-term school district test performance, which
may be appropriate if, as some studies suggest, superintendents can have little effect on test

39
scores (Ehrenberg et al., 1988). In this case, better identification of the outcome variables
superintendents do affect would be a useful addition. In addition, future studies should employ
strategies to account for the potential endogeneity that may arise if superintendent turnover and
district performance each predict one another.
Ultimately, our analysis illustrates that superintendents exit positions for numerous
reasons. As our conceptual emphasis on the two-sided nature of turnover decisions in the labor
market predicts, some turnover is driven by factors that inform school boards’ decisions about
future employment (e.g., superintendent performance) while other turnover comes from
superintendents’ decisions to leave, which is informed by other factors (e.g., working conditions,
external opportunities). Still other turnover is the result of retirement decisions, which appear to
be primarily determined by age. Practically, school districts might use this results to improve
superintendent retention by focusing attention or resources on its antecedents. For example, they
might select candidates differently or work to build supports for superintendents faced with
increased administrative complexity, such as that in unified school districts. From a research
perspective, the framework and results we present point towards several new avenues for future
work.

40
Appendix
This appendix provides a technical description of the models estimated in the tables in the
main text. Tables 3 and 4 present estimates from logistic regression models of the binary
turnover decision. These models are estimates of an equation of the form:
Pr (𝑦 = 1|𝑋) = 𝑒𝑋𝛽
1+𝑒𝑋𝛽 (1)
where y is a turnover variable set equal to 0 if a superintendent stays and 1 if not, X contains
values of each of the independent variables included in the models, and β is a vector containing
the coefficients for each of these variables.
In Table 5, we analyze turnover not as a binary variable but as a categorical variable that
differentiates exits into retirements and non-retirements, yielding a three-category variable that
can take on values of stay, retire, or other exit. For this analysis, the following equation is
estimated via multinomial logistic regression:
Pr (𝑦 = 𝑚|𝑋) = 𝑒𝑋𝛽𝑚|𝑏
∑ 𝑋𝛽𝑚|𝑏𝐽𝑗=1
(2)
The difference in equation 2 is that now we are estimating the probability that the categorical
turnover variable y results in any of J = 3 outcomes m, where m = {stay, retire, other exit}. The
subscript on β indicates that a separate vector of coefficients is estimated for each of the outcome
categories in reference to the base category b, which in our case is stay. Thus, the estimate of
equation 2 results in 2 vectors of coefficients, one corresponding to the probability that a
superintendent retires (relative to staying) and one corresponding to the probability that a
superintendent experiences a non-retirement exit (relative to staying). Further information
regarding the estimation of logistic and multinomial logistic regression is available in Long and
Freese (2006).

41
References
Alsbury, T. L. (2008). School board member and superintendent turnover and the influence on student achievement: An application of the dissatisfaction theory. Leadership and Policy in Schools, 7(2), 202–229.
Alsbury, T. L. (2003). Superintendent and school board member turnover: Political versus apolitical turnover as a critical variable in the application of the dissatisfaction theory. Educational Administration Quarterly, 39(5), 667–698.
Alsbury, T. L. (2002). Political and apolitical school board and superintendent turnover: Revisiting critical variables in the dissatisfaction theory of American democracy. In G. J. Petersen & L. D. Fusarelli (Eds.), The politics of leadership: Superintendents and school boards in changing times (pp. 135–155). Greenwich, CT: Information Age Publishing.
Baker, B.D., Punswick, E., & Belt, C. 2010. School leadership stability, principal moves, and departures: Evidence from Missouri. Educational Administration Quarterly, 46(4), 523-557.
Ballou, D. (1996). Do public schools hire the best applicants? Quarterly Journal of Economics, 111(1), 97-133.
Barber, D. M. (1988). Newly promoted city managers. Public Administration Review, 48(3), 694–699.
Buchanan, B. (2006). Turnover at the top: Superintendent vacancies and the urban school. Lanham, MD: Rowman & Littlefield Education.
Byrd, J.K., Drews, C., & Johnson, J. (2006). Factors impacting superintendent turnover: Lessons from the field. Paper presented at the annual meeting of the University Council of Educational Administration
Cahuc, P., & Zylberberg, A. (2004). Labor Economics. MIT Press.
Carlson, R. O. (1961). Succession and performance among school superintendents. Administrative Science Quarterly, 6(2), 210–227.
Cave, D., & Almanzar, Y. (2008, September 9). Miami schools chief to leave amid discord. New York Times, p. A21.
Chance, E. W., & Capps, J. L. (1992). Superintendent instability in small/rural schools: The school board perspective. Retrieved from ERIC database. (ED350121)
Chance, E. W., & Capps, J. L. (1990). Administrator stability in rural schools: The school board factor. Presented at the 82nd annual meeting of the National Rural Education Association, Colorado Springs, CO.

42
Clingermayer, J., & Feiock. R. (1995). Institutional constraints and policy choice: An exploration of local governance. Albany, NY: SUNY Press.
Clotfelter, C., Ladd, H.F., Vigdor, J., & Wheeler, J. (2007). High poverty schools and the distribution of teachers and principals. North Carolina Law Review, 85, 1345-1378.
Cooper, B. S., Fusarelli, L. D., Carella, V. A., & American Association of School Administrators. (2000). Career crisis in the school superintendency?: The results of a national survey. Arlington, VA: American Association of School Administrators.
Cuban, L. (1974). Urban superintendents: Vulnerable experts. Phi Delta Kappan, 56(4), 279–282.
Danzberger, J., Kirst, M. W., & Usdan, M. D. (1992). Governing public schools: New times, new requirements. Washington, D.C.: Institute for Educational Leadership.
DeHoog, R. H., & Whitaker, G. P. (1990). Political conflict or professional advancement: Alternative explanations of city manager turnover. Journal of Urban Affairs, 12(4), 361–377.
Dlugosh, L. (1994). Why administrators move: Factors contributing to the turnover of school administrators in Nebraska. Retrieved from ERIC database. (ED375505)
Eaton, W. E., & Sharp, W. L. (1996). Involuntary turnover among small-town superintendents. Peabody Journal of Education, 71(2), 78–85.
Ehrenberg, R. G., Chaykowski, R. P., & Ehrenberg, R. A. (1988). Determinants of the compensation and mobility of school superintendents. Industrial and Labor Relations Review, 41(3), 386–401.
Feiock, R. C., Clingermayer, J. C., Stream, C., McCabe, B. C., & Ahmed, S. (2001). Political conflict, fiscal stress, and administrative turnover in American cities. State and Local Government Review, 33(2), 101–108.
Feiock, R. C., & Stream, C. (1998). Explaining the tenure of local government managers. Journal of Public Administration Research and Theory, 8(1), 113–130.
Feiock, R. C., & Stream, C. (2002). The implications of local government structure for manager turnover and policy choice. In H. G. Frederickson & J. Nalbandian (Eds.), The future of local government administration: A tribute to William Hansell. Washington, DC: International City/County Management Association.
Fusarelli, L. D. (2005). Future research directions and policy implications for superintendent-school board relations. In G. J. Petersen & L. D. Fusarelli (Eds.), The politics of leadership: Superintendents and school boards in changing times (pp. 181–195). Greenwich, CT: Information Age Publishing.

43
Gates, S. M., Ringel, J. S., Santibañez, L., Guarino, C., Ghosh-Dastidar, B., & Brown, A. (2006). Mobility and turnover among school principals. Economics of Education Review, 25(3), 289–302.
Glass, T. E., Björk, L., & Brunner, C. C. (2000). The study of the American school superintendency: A look at the superintendent of education in the new millennium. Arlington, VA: American Association of School Administrators.
Grady, M. L., & Bryant, M. T. (1991). School board turmoil and superintendent turnover: What pushes them to the brink? School Administrator, 48(2), 19–26.
Green, R. E. (1987). Local government managers: Styles and challenges. Baseline Data Report (Vol. 19, 2). Washington, DC: International City/County Management Association.
Grissom, J. A. (2010). The determinants of conflict on governing boards in public organizations: The case of California school boards. Journal of Public Administration Research and Theory, 20(3), 601-627.
Grissom, J. A. (2012). Is Discord Detrimental? Using Institutional Variation to Identify the Impact of Public Governing Board Conflict on Outcomes. Working paper.
Guarino, C. M., Santibañez, L., & Daley, G. A. (2006). Teacher recruitment and retention: A review of the recent empirical literature. Review of Educational Research, 76(2), 173–208.
Hamidullah, M. F., Wilkins, V. M., & Meier, K. J. (2008). Looking for their Dick Vermeil: How prior performance influences the selection decision. Public Organization Review, 9(1), 1–14.
Hamori, M. (2006). Executive career advancement in career moves across employers: The role of organization-level predictors. The International Journal of Human Resource Management, 17(6), 1129–1151.
Hanushek, E. A., Kain, J. F., & Rivkin, S. G. (2004). Why public schools lose teachers. Journal of Human Resources, 39(2), 326–354.
Hess, F. M. (2002). School boards at the dawn of the 21st century: Conditions and challenges of district governance. Washington, DC: National School Boards Association.
Hosman, C. M. (1990). Superintendent selection and dismissal: A changing community defines its values. Urban Education, 25(3), 350–369.
Iannaccone, L., & Lutz, F. W. (1970). Politics, power and policy: The governing of local school districts. Columbus, OH: Charles E. Merrill.
Kaatz, J. B., French, P. E., & Prentiss-Cooper, H. (1999). City council conflict as a cause of psychological burnout and voluntary turnover. State and Local Government Review, 31(3), 162–172.

44
Kammerer, G. M., Farris, C. D., DeGrove, J. M., & Clubok, A. B. (1962). City managers in politics: An analysis of manager tenure and termination. Gainesville, FL: University of Florida Press.
Kowalski, T. J. (1999). The school superintendent: Theory, practice, and cases. Columbus, OH: Merrill.
Long, J. S., & Freese, J. (2006). Regression models for categorical dependent variables using Stata (2nd ed.). College Station, TX: Stata Press.
McAdams, R.P. (1997). A systems approach to school reform. Phi Delta Kappan, 79(2), 138-142.
McCabe, B. C., Feiock, R. C., Clingermayer, J. C., & Stream, C. (2008). Turnover among city managers: The role of political and economic change. Public Administration Review, 68(2), 380–386.
McCurdy, J. (1992). Building better board-administrator relations. (D. L. Hymes, Ed.) AASA Critical Issues Report. Arlington, VA: American Association of School Administrators.
Monteith, D. S., & Hallums, M. B. (1989). The exodus of South Carolina superintendents. Retrieved from ERIC database. (ED311531)
Mountford, M. (2008). Historical and current tensions among board-superintendent teams: Symptoms or cause? In T. L. Alsbury (Ed.), The future of school board governance: Relevancy and revelation (pp. 81-114). Rowman & Littlefield Press.
Mountford, M., & Ylimaki, R. (2005). Conceptions of power held by educational leaders: The impact on collaborative decision-making processes. Journal of School Leadership, 15, 407–432.
National School Boards Association. (2001). CUBE survey report: Superintendent tenure. Alexandria, VA: Author. Retrieved from http://www. nsba.org/cube/supt_tenure.pdf
Natkin, G., Cooper, C., Fusarelli, L., Alborano, J., Padilla, A., & Ghosh, S. (2002). Myth of the revolving-door superintendency: Contrary to perception, tenure runs much longer than most believe, a research review finds. School Administrator, 59(5), 28–31.
Parker, P. (1996). Superintendent vulnerability and mobility. Peabody Journal of Education, 71(2), 64–77.
Petersen, G. J. (2002). Singing the same tune: Principals’ and school board members’ perceptions of the superintendent’s role as instructional leader. Journal of Educational Administration, 40(2), 158–171.
Petersen, G. J., & Fusarelli, L. D. (2008). Systemic leadership amidst turbulence: Superintendent-school board relations under pressure. In T. L. Alsbury (Ed.), The future

45
of school board governance: Relevancy and revelation (pp. 115-134). Lanham, MD: Rowman & Littlefield Press.
Richardson, L. M. (1998). Stress in the superintendency: Implications for achieving excellence. Presented at the annual meeting of the University Council for Educational Administration, St. Louis, MO.
Snedecor, G. W., & Cochran, W. G. (1989). Statistical methods (8th ed.). Ames, IA: Iowa State University Press.
Svara, J. H. (1999). The shifting boundary between elected officials and city managers in large council-manager cities. Public Administration Review, 59(1), 44–53.
Tallerico, M., & Burstyn, J. N. (1996). Retaining women in the superintendency: The location matters. Educational Administration Quarterly, 32(1 Suppl), 642–664.
Taylor, L. L., Glander, M., and Fowler, W. J. (2007). Documentation for the NCES Comparable Wage Index Data File, 2005 (EFSC 2007-397). National Center for Education Statistics, Institute of Education Sciences, U.S. Department of Education. Washington, DC.
Taylor, B. (2008, September 8). Urban school superintendents hard to hang onto. The Associated Press.
Thomas, J. Y. (2001). The public school superintendency in the twenty-first century: The quest to define effective leadership. Baltimore, MD: Center for Research on the Education of Students Placed At Risk, Johns Hopkins University. Retrieved from http://www.csos.jhu.edu/crespar/techReports/Report55.pdf
Watson, D. J., & Hassett, W. L. (2004). Career paths of city managers in America’s largest council-manager cities. Public Administration Review, 64(2), 192–199.
Watson, D. J., & Hassett, W. L. (2003). Long-serving city managers: Why do they stay? Public Administration Review, 63(1), 71–78.
Weller, L. D., Brown, C. L., & Flynn, K. J. (1991). Superintendent turnover and school board member defeat: A new perspective and interpretation. Journal of Educational Administration, 29(2), 61–71.
Weninger, T. A., & Stout, R. T. (1989). Dissatisfaction theory: Policy change as a function of school board member-superintendent turnover. Educational Administration Quarterly, 25(2), 162–180.
Whitaker, G. P., & DeHoog, R. H. (1991). City managers under fire: How conflict leads to turnover. Public Administration Review, 51(2), 156–164.
Williams, C. R., & Livingstone, L. P. (1994). Another look at the relationship between performance and voluntary turnover. Academy of Management Journal, 37(2), 269–298.
46
Yee, G., & Cuban, L. (1996). When is tenure long enough? A historical analysis of superintendent turnover and tenure in urban school districts. Educational Administration Quarterly, 32(1 Suppl), 615–641.
Zeigler, H., Kehoe, E., & Reisman, J. (1983). The political power of professionalism: A study of school superintendents and city managers. Washington, DC: National Institute of Education.

47
FIGURE 1: A Framework for Understanding Superintendent Turnover
Turnover
Superintendent Characteristics• Age and other demographics• Experience• Qualifications (e.g., degrees)
District Characteristics• Location• Level of challenge/complexity• Salary offered• Prestige
School Board Characteristics• Board functioning• Relationship with superintendent• Election type
Observe in data
Superintendent Consideration of Relative Costs and Benefits
of Continued Employment(e.g., salary and working
conditions in another position)
School Board Consideration of Relative Costs and Benefits
of Continued Employment(e.g., political costs, potential effects of new superintendent)
Do not observe in data
School Board’s Decision to Terminate
Superintendent’s Decision to Exit
Observe in dataPartially observe in data
Superintendent Performance• Objective• Subjective/Perceptual

48
FIGURE 2: Superintendent Turnover by District Size
Notes: Mean turnover for each decile of district enrollment size plotted (unconditional). Vertical lines indicate confidence intervals for each mean.
0.2
.4.6
.81
Pr(
Sup
erin
tend
ent T
urns
Ove
r With
in 3
Yea
rs)
1 2 3 4 5 6 7 8 9 10Deciles of District Size
Probablity of Superintendent Turnover by District Size

49
TABLE 1: Correlation Matrix for School Board Function Variables (1) (2) (3) (4) (1) My school board works together well almost always. 1
(2) My school board governs effectively. 0.72 1
(3) My school board communicates well with one another almost always. 0.86 0.65 1
(4) My school board has a good working relationship with
the district superintendent. 0.55 0.50 0.53 1 All correlations significant at the 0.01-level.

50
TABLE 2: Descriptive Statistics
Full Sample
Superintendent Survey Sample
(N = 211)
(N = 106)
Mean S.D.
Mean S.D.
Superintendent Turnover 0.45
0.35 Retired 0.17
0.14
Non-Retirement Exit (Resigned, Hired Elsewhere, Terminated) 0.19
0.15 Excluded Exit (Interim, Position Eliminated) 0.09
0.06
District Characteristics
Urban 0.18
0.21 Suburban (omitted category) 0.45
0.45
Rural 0.37
0.34 Percent district free/reduced lunch 42.3 25.21
42.83 24.08
Percent African American 3.89 5.63
4.14 5.72 Percent Hispanic 32.29 25.85
36.65 25.44
Per-pupil spending (CWI adjusted dollars) 8277 3990
7785 2782 Unified district 0.38
0.42
Superintendent salary (in dollars) 131832 49325
134029 41656 ln(Enrollment) 7.45 2.05
7.8 1.72
School Board Characteristics School board functioning (factor) 0 1
-0.07 1.05
Single-member (ward) election type 0.12 0.31
0.08 0.26 Superintendent Characteristics
Female
0.28 Nonwhite
0.15
Age
55.48 5.23 Years as superintendent
4.23 3.63
Holds a doctorate
0.32 Attended a competitive college or university
0.89
Promoted from within district
0.35 Performance Variables
API growth, 2005-2006 11.95 19.29
10.69 17.04 School board evaluation of superintendent performance 4.33 0.6
4.42 0.51

51
TABLE 3: Logistic Regression of Probability That Superintendent Turns Over within Three Years (1) (2) (3) (4) (5) District Characteristics
Urban 0.91 0.68 0.37 0.76 0.31
(0.39) (0.31) (0.30) (0.34) (0.26)
Rural 1.03 0.97 1.09 0.86 0.84
(0.40) (0.36) (0.84) (0.35) (0.66)
Percent district free/reduced lunch 1.02* 1.02* 1.05** 1.02** 1.05***
(0.01) (0.01) (0.02) (0.01) (0.02)
Percent African American 1.01 1.00 0.97 1.00 0.96
(0.03) (0.03) (0.05) (0.03) (0.05)
Percent Hispanic 0.98** 0.98** 0.95*** 0.98** 0.95***
(0.01) (0.01) (0.02) (0.01) (0.02)
Per-pupil spending (CWI adjusted dollars) 1.00 1.00 1.00 1.00 1.00
(0.00) (0.00) (0.00) (0.00) (0.00)
Unified district 1.38 1.24 5.51** 1.38 5.91**
(0.50) (0.41) (4.08) (0.52) (4.54)
ln(Enrollment) 1.08
1.18 1.01 1.06
(0.14)
(0.36) (0.14) (0.33)
In top decile of enrollment
4.46**
(2.77)
School Board Characteristics School board function (factor)
0.69**
0.63*
(0.11)
(0.17)
Single-member (ward) election type
0.85
0.65
(0.43)
(0.80)
Superintendent Characteristics Female
0.45 0.50
(0.29) (0.33)
Nonwhite
0.81 0.71
(0.66) (0.63)
Age
1.18*** 1.18***
(0.07) (0.07)
Years as superintendent
1.03 1.04
(0.07) (0.08)
Holds a doctorate
0.63 0.62
(0.41) (0.43)
Attended a competitive college or university
0.25* 0.29
(0.21) (0.23)
Promoted from within district
0.29** 0.26**
(0.18) (0.17)
Observations 215 215 211 106 106 Pseudo R2 0.037 0.057 0.051 0.275 0.296 Percent correctly classified 63% 65% 63% 81% 82% Odds ratios shown. Standard errors in parentheses. * p<0.10, ** p<0.05, *** p<0.01.

52
TABLE 4: Logistic Regression of Probability That Superintendent Turns Over within Three Years, Including Performance Measures (1) (2) (3) API growth, 2005-2006 0.98
0.99
(0.02)
(0.02) School board evaluation of superintendent performance
0.23** 0.25**
(0.14) (0.15) Observations 106 106 106 Pseudo R2 0.303 0.342 0.346 Percent correctly classified 83% 84% 80% Odds ratios shown. Standard errors in parentheses. * p<0.10, ** p<0.05, *** p<0.01. All models include the full set of district, school board, and superintendent characteristics.

53
TABLE 5: Multinomial Logit Analysis of Superintendent Turnover (1)
(2)
Base Category = No Turnover Retirement
Non-Retirement
Exit
Retirement
Non-Retirement
Exit District Characteristics
Urban 0.55 0.45
0.50 0.01
(0.35) (0.31)
(0.68) (0.03)
Rural 1.32 0.86
1.57 0.55
(0.84) (0.53)
(2.49) (0.76)
Percent district free/reduced lunch 1.02 1.03**
1.06 1.06*
(0.01) (0.01)
(0.05) (0.03)
Percent African American 0.98 1.02
1.00 1.01
(0.04) (0.04)
(0.08) (0.09)
Percent Hispanic 0.97** 0.97**
0.92* 0.91***
(0.01) (0.01)
(0.04) (0.03)
Per-pupil spending (CWI adjusted dollars) 1.00 1.00
1.00 1.00
(0.00) (0.00)
(0.00) (0.00)
Unified district 1.58 1.93
10.86* 12.24
(0.87) (1.07)
(14.74) (21.07)
ln(Enrollment) 1.40 1.04
0.93 1.22
(0.29) (0.22)
(0.51) (0.82)
School Board Characteristics School board function (factor) 1.07 0.64**
2.86 0.29*
(0.27) (0.14)
(2.01) (0.19) Single-member (ward) election type 1.33 1.36
0.71 0.74
(0.91) (0.91)
(1.34) (2.93)
Superintendent Characteristics Female
0.12 1.46
(0.16) (1.70)
Nonwhite
2.42 0.16
(3.59) (0.27)
Age
1.77*** 0.91
(0.34) (0.11)
Years as superintendent
1.04 1.07
(0.14) (0.23)
Holds a doctorate
1.08 0.82
(1.36) (1.11)
Attended a competitive college or university
0.13 0.66
(0.19) (1.06)
Promoted from within district
0.92 0.03**
(1.13) (0.05)
Superintendent Performance API growth, 2005-2006 1.04** 1.01
1.00 1.06
(0.02) (0.01)
(0.05) (0.04) SB evaluation of superintendent performance 0.60 0.45**
0.22 0.41
(0.23) (0.16)
(0.23) (0.43)
Observations 189 100 Pseudo R2 0.121 0.517 Relative risk ratios shown. Standard errors in parentheses. * p<0.10, ** p<0.05, *** p<0.01. Interim superintendents and superintendents whose positions were eliminated are excluded from the analysis.

54
TABLE 6: Comparison of Characteristics of Former and New Districts for Superintendents Who Move
Variable (2005-06 values) Former District
New District
Difference (New - Former) p-value
Medians
Percent African American 1% 2% 1% 0.17 Percent Hispanic 13% 14% 1% 0.38 Percent district free/reduced lunch 38% 38% 0% 0.52 Enrollment 605 2905 2300 0.003*** Total budget size (in $100,000s) 46.9 205.1 158.2 0.003*** Academic Performance Index level (2005) 751 743 -8 0.19 Academic Performance Index growth, 2005-2006 17.00 9.50 -7.50 0.12 Superintendent salary 109761 131110 21349 0.004***
Proportions Urban 0.04 0.13 0.09 0.63
Suburban 0.39 0.78 0.39 0.04** Rural 0.57 0.09 -0.48 0.003*** Unified district 0.48 0.61 0.13 0.45
N = 23. p-value given for the interval-level variables is from a Sign Test of Difference in Medians. p-value for the binary variables is from a McNemar Exact Test. * p<0.10, ** p<0.05, *** p<0.01.