why should the corps of engineers be interested in arc hydro? –watershed planning –reservoir...
TRANSCRIPT

• Why should the Corps of Engineers be interested in Arc Hydro?– Watershed planning– Reservoir operations– Flood damage
reduction– Ecosystem restoration
Arc Hydro: GIS for Water ResourcesDavid R. Maidment, University of Texas at Austin

Hydrologic Information System
Hydrologic Modeling
Arc Hydro Geodatabase

1996 Texas Drought
• George W. Bush, (then Governor of Texas) asked: “Tell me how much water we have, how much water we’re using and how much water we need”
• State water officials did not have adequate answers

Texas Water Planning
• 1997 Texas Legislature passed Senate Bill 1 which provided for– State-wide geospatial data development
(topography, hydrography, land use, soils and orthophotos)
– Water planning in 14 regions rather than state-wide
– Assessment of water availability for all water permits
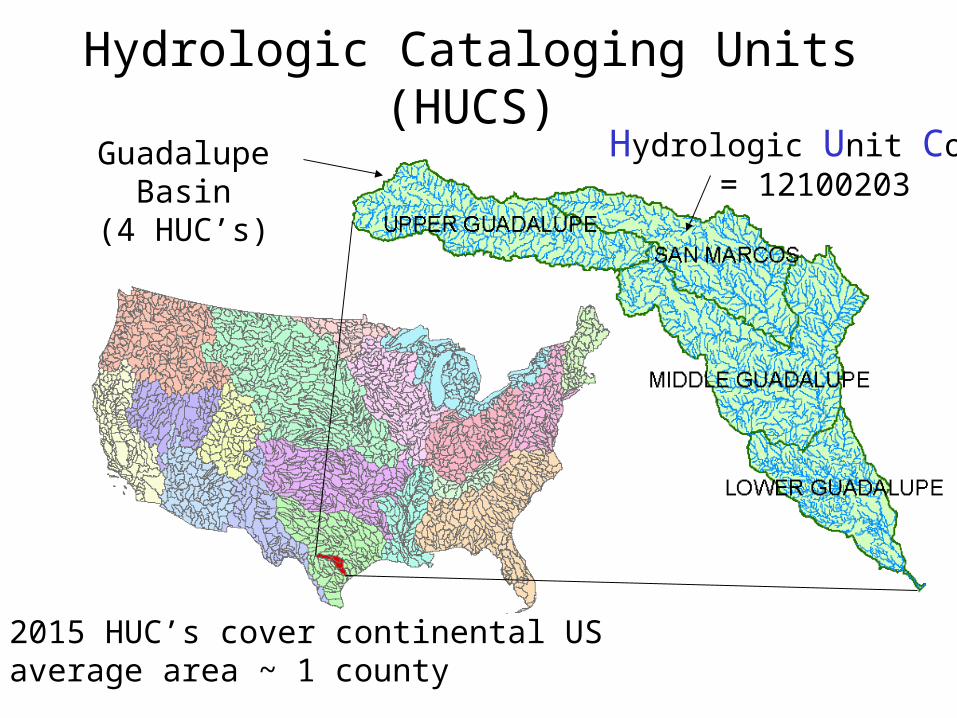
Hydrologic Cataloging Units (HUCS)
Guadalupe Basin(4 HUC’s)
Hydrologic Unit Code = 12100203
• 2015 HUC’s cover continental US• average area ~ 1 county
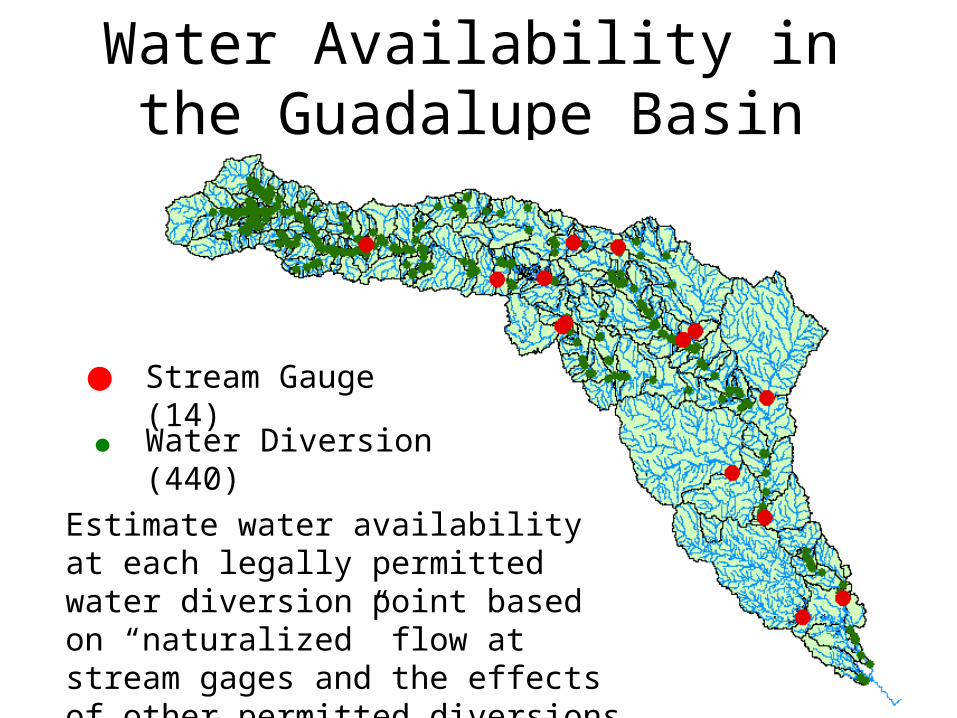
Water Availability in the Guadalupe Basin
Stream Gauge (14)
Water Diversion (440)
Estimate water availability at each legally permitted water diversion point based on “naturalized” flow at stream gages and the effects of other permitted diversions
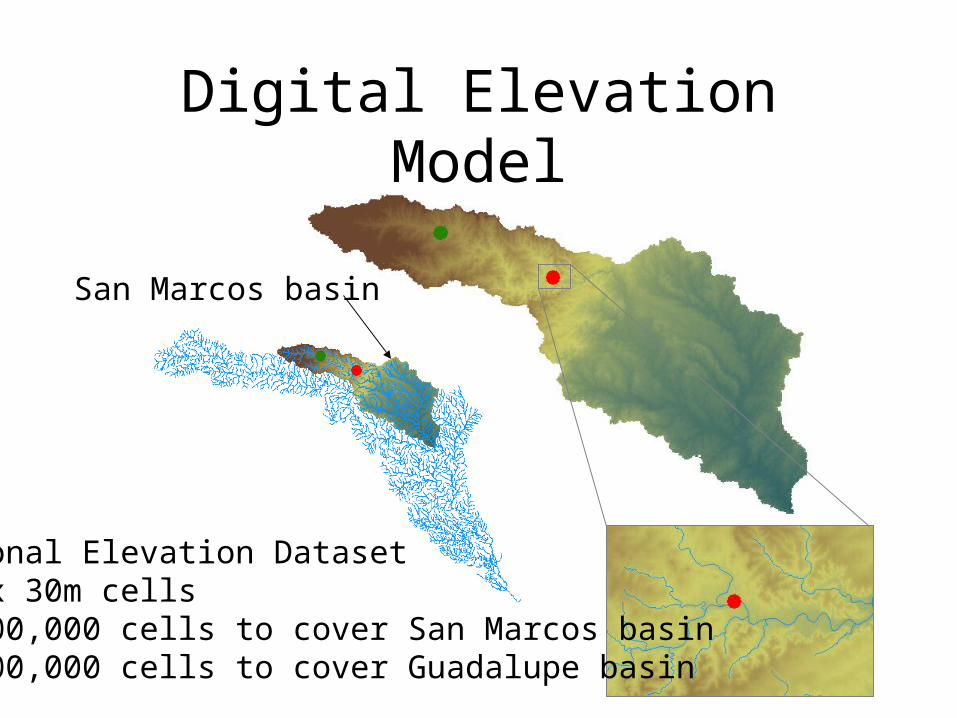
Digital Elevation Model
National Elevation Dataset30m x 30m cells11,000,000 cells to cover San Marcos basin70,000,000 cells to cover Guadalupe basin
San Marcos basin

Drainage Area Delineated from the Digital Elevation Model
Arc Hydro attribute DrainArea

Estimating Naturalized Flow at Diversion Points
Qd
Qf
Ad
Af
Qd = Qf
Ad
Af
Naturalized flow record at stream gage (50 years of monthly flows)
Estimated flow record at diversion point

Length Downstream
D
F
Flow distance (D to F) = Length Downstream (D)
– Length Downstream (F)
Length Downstream (D)
Length Downstream (F)
F
D
Arc Hydro attribute LengthDown
Seepagelosses
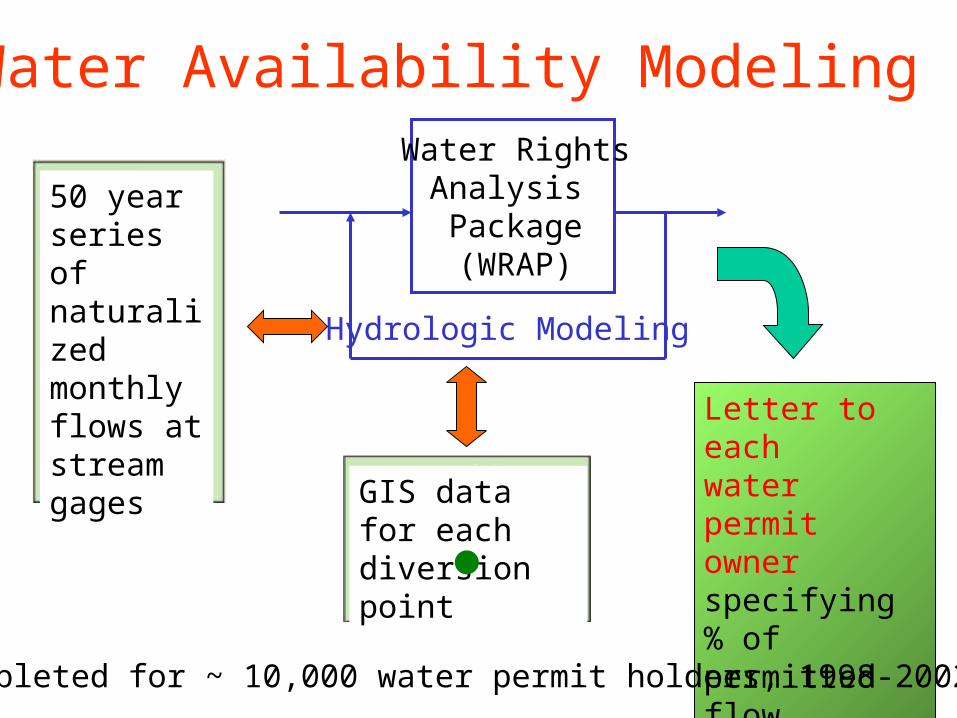
Water Availability Modeling
Hydrologic Modeling
Water RightsAnalysis Package(WRAP)
50 yearseries ofnaturalizedmonthly flows atstream gages
GIS data for each diversion point
Letter to eachwater permitowner specifying % of permitted flow available during a drought
Completed for ~ 10,000 water permit holders, 1998-2002

Letter to eachwater permitowner specifying % of permitted flow available during a drought
Geospatial data developmentby Center for Research in Water Resources, Univ. of Texas
Texas Natural ResourcesConservation Commission
Hydrologic modeling byengineering consultants
Water Availability Assessment(completed for ~ 10,000 permit holders, 1998-2001)

Accomplishments
• Arc Hydro data model design completed and published on web (http://www.crwr.utexas.edu/giswr)
• Arc Hydro book in production at ESRI Press
• Arc Hydro toolset v. 1.0 in beta testing

CD-ROM at back of book
Arc Hydro
UML diagrams, Repository,Example Geodatabases,
Toolset, Tutorials

Arc Hydro Toolset Ver 1.0
Provides tools for processing raster and vector dataand populating the attributes of the Arc Hydro data model

GIS in Water Resources Consortium
Bringing together these two communities by using a common geospatial data model
http://www.crwr.utexas.edu/giswr
GIS
CRWRCRWR
Water Resources
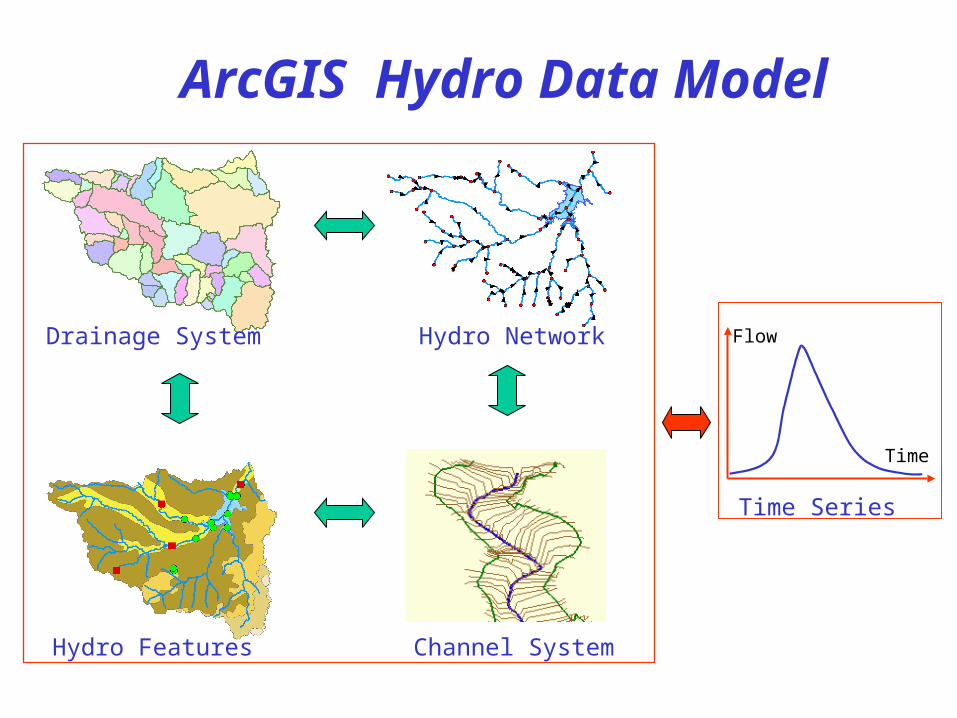
Flow
Time
Time Series
Hydro Features
Hydro Network
Channel System
Drainage System
ArcGIS Hydro Data Model


ArcGIS Hydro Data Model
Hydrography Hydrology

Streams
Drainage Areas
Hydrography
Channels
Terrain Surfaces
Rainfall Response
Digital Orthophotos
Data Model Based on Inventory

Data Model Based on BehaviorFollow a drop of water from where it falls on the land, to the stream, and all the way to the ocean.
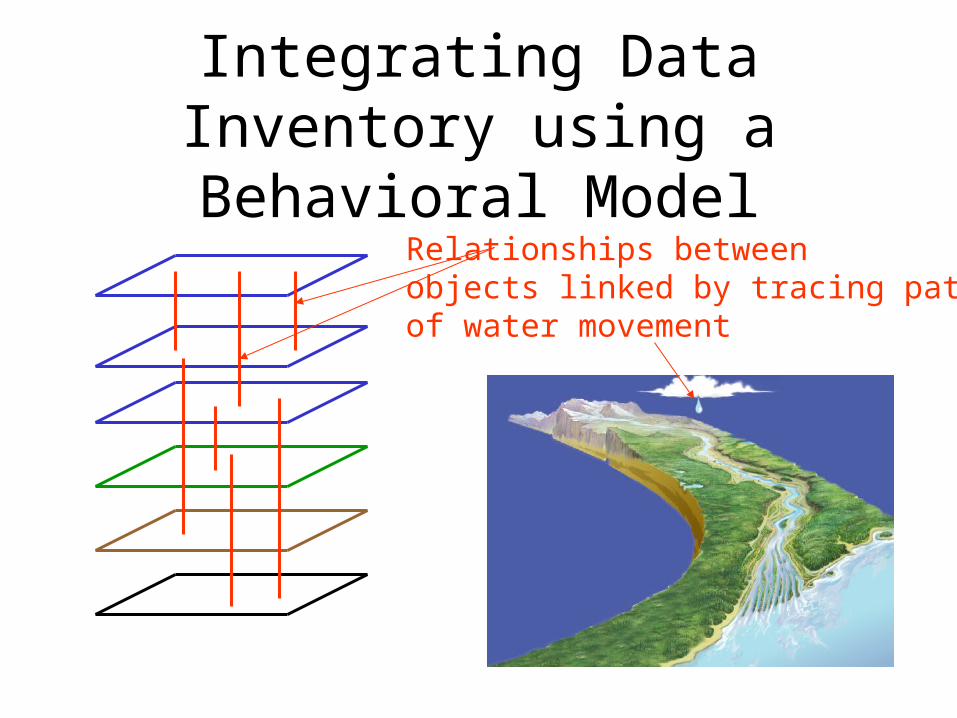
Integrating Data Inventory using a Behavioral Model
Relationships betweenobjects linked by tracing pathof water movement

Streams
Watersheds Waterbody
HydroPoints
Arc Hydro Framework Input Data

!(
!(
!(!(
!( !(!( !(!( !(!(
!(!(
!(!(
!(!( !(!( !(
!( !(
!( !(!(!( !(!(
!(
!(
!(
!( !(!(!( !(
!(!(
!(!( !(!(!( !( !(!(!( !(!(
!( !(!(!( !(!(
!(!(
!(!(!(
!(
!(!(
!(
!(
!(!(
!(
!(
!(
!(!(!(
!(
Feature
Waterbody
HydroIDHydroCodeFTypeNameAreaSqKmJunctionID
HydroPoint
HydroIDHydroCodeFTypeNameJunctionID
Watershed
HydroIDHydroCodeDrainIDAreaSqKmJunctionIDNextDownID
ComplexEdgeFeature
EdgeType
Flowline
Shoreline
HydroEdge
HydroIDHydroCodeReachCodeNameLengthKmLengthDownFlowDirFTypeEdgeTypeEnabled
SimpleJunctionFeature
1HydroJunction
HydroIDHydroCodeNextDownIDLengthDownDrainAreaFTypeEnabledAncillaryRole
*
1
*
HydroNetwork
*
HydroJunction
HydroIDHydroCodeNextDownIDLengthDownDrainAreaFTypeEnabledAncillaryRole
HydroJunction
HydroIDHydroCodeNextDownIDLengthDownDrainAreaFTypeEnabledAncillaryRole
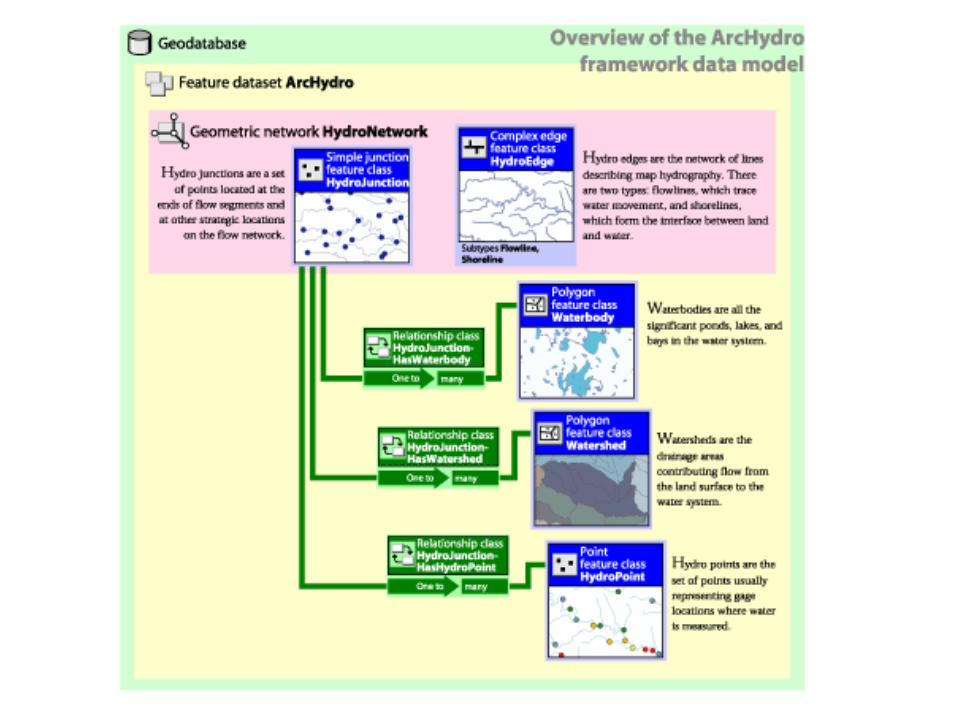
Arc Hydro Framework
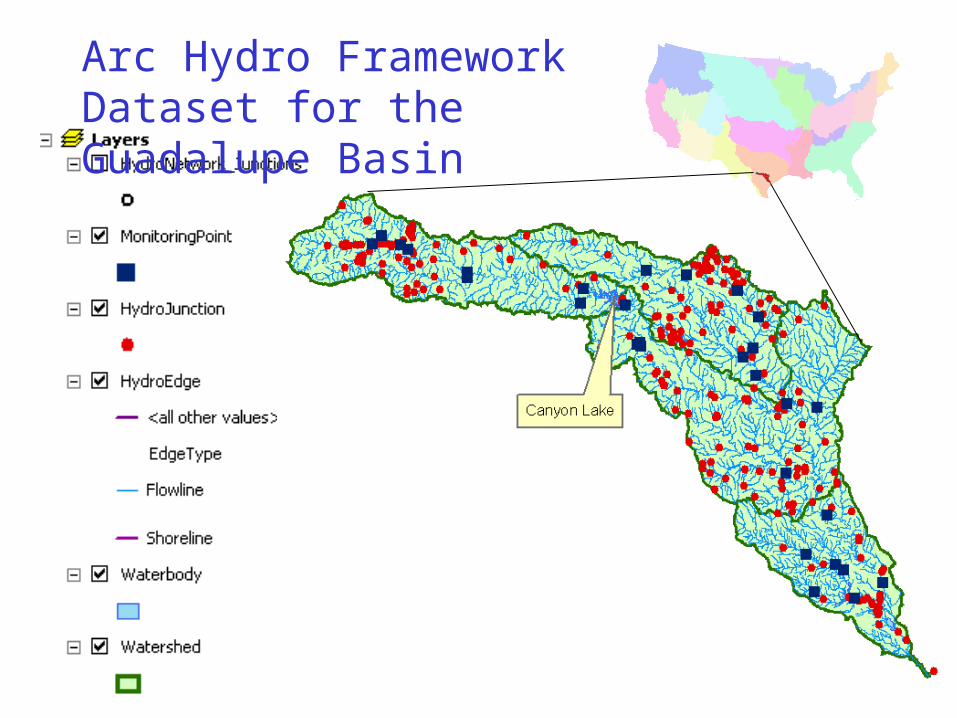
Arc Hydro Framework Dataset for the Guadalupe Basin

HydroNetwork through Canyon Lake
Generic Junction (for topological connection of edges)
Flowlines through water body

HydroJunction has Waterbody Relationship

Scales of representation of Drainage Systems
Basins – drainage areas for water resources management
Catchments – subdivision of Basin into elementary drainage areas by physical rules
Digital Elevation Model – land surface terrain grid cells
Watersheds – subdivision of Basinfor a particular hydrologic purpose

NWS forecast Watersheds(flooding)
EPA TMDL Segments(water quality)
TNRCC water availability points(water supply)
GuadalupeHydroNetwork
Watersheds of the Guadalupe Basin

Catchments, DrainageLines and DrainagePoints
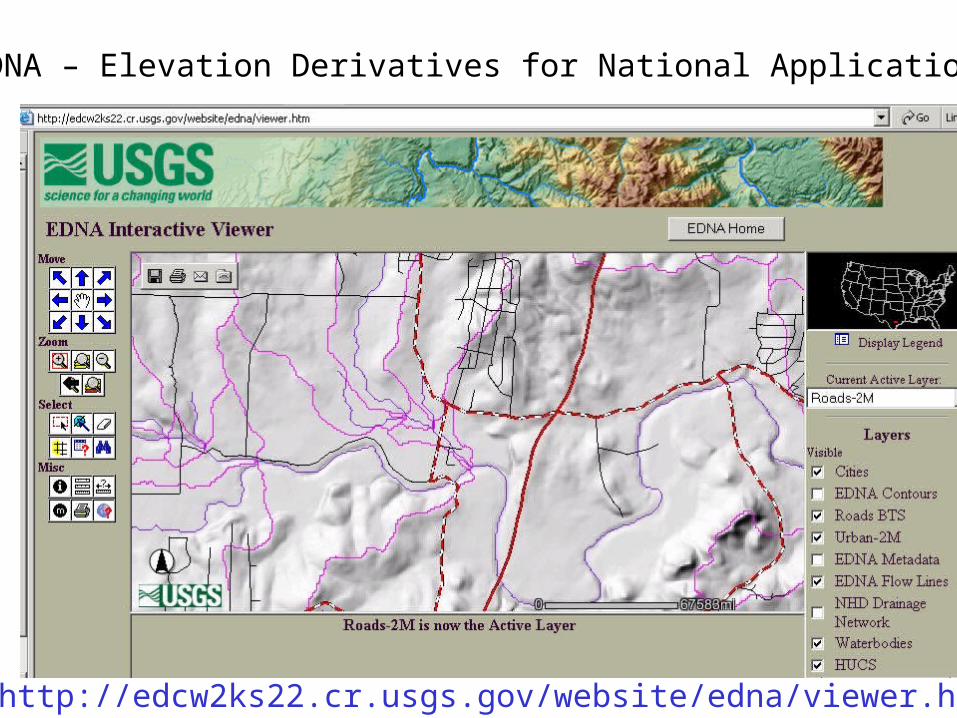
http://edcw2ks22.cr.usgs.gov/website/edna/viewer.htm
EDNA – Elevation Derivatives for National Application
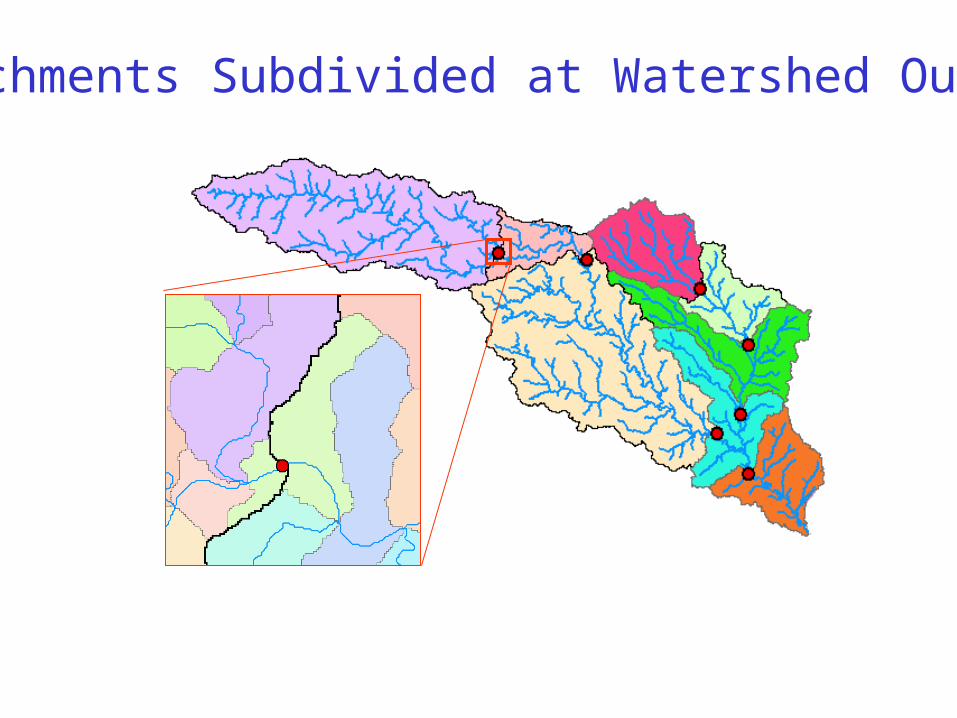
Catchments Subdivided at Watershed Outlet

Regional Analysis
HydroNetwork to provide connectivity of flow through large regions
Digital elevation modelfor terrain analysis withinbasins


Michael SchultzNWS River Forecast CenterFort Worth, Texas
1998 GuadalupeFlood


Cross-Sections developedusing HEC-GeoRAS andNational Elevation Dataset

Hydrologic simulationUsing NWS Fldwav model

Guadalupe Network
Study area only 1.4 km!
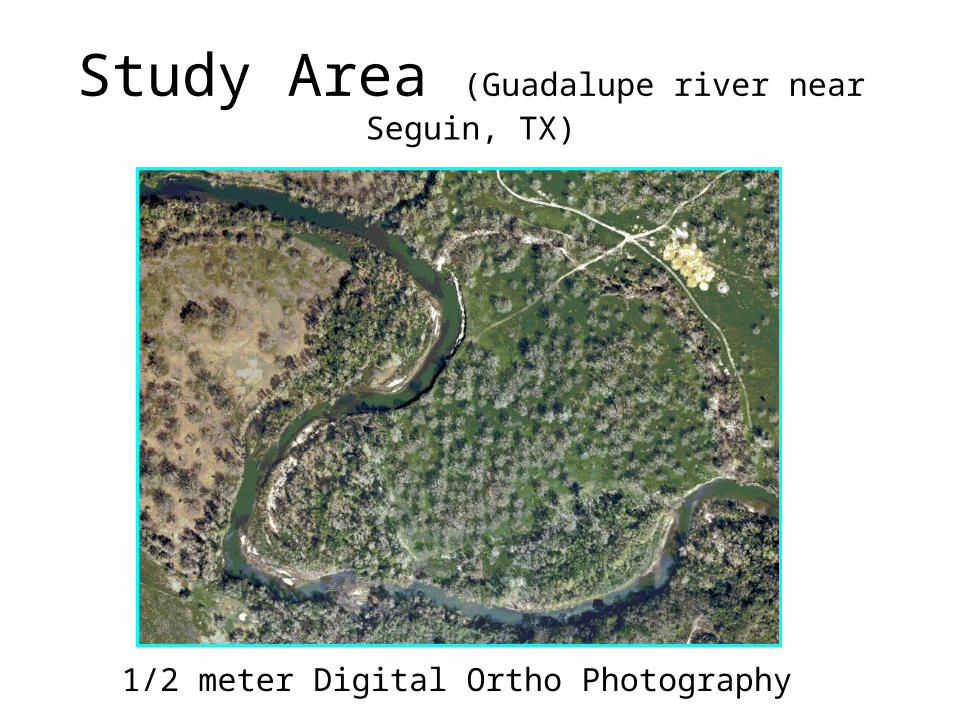
1/2 meter Digital Ortho Photography
Study Area (Guadalupe river near Seguin, TX)

Boat setup for data collection
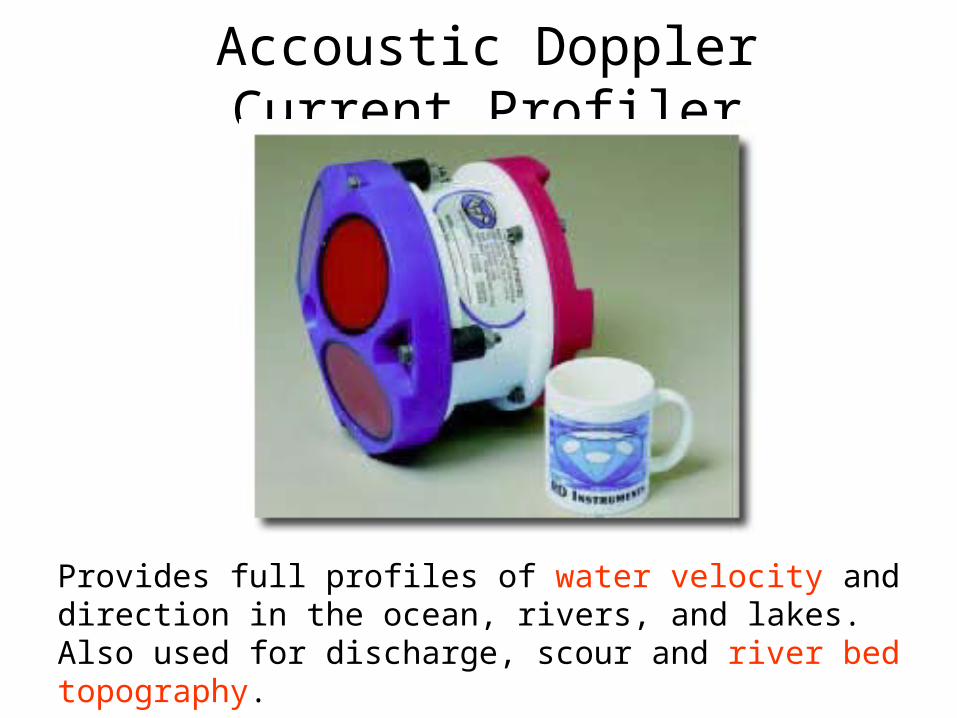
Accoustic Doppler Current Profiler
Provides full profiles of water velocity and direction in the ocean, rivers, and lakes. Also used for discharge, scour and river bed topography.

The electronic depth sounder operates in a similar way to radar It sends out an electronic pulse which echoes back from the bed. The echo is timed electronically and transposed into a reading of the depth of water.
Depth Sounder (Echo Sounder)

Differential GPS: Bank to Boat
GPS gives the location of each point collected in terms of latitude and longitude. Two locations for differential GPS.

Channel Data
Each point has (x,y,z)

Interpolation
Points are interpolated in ArcMap to produce a continuous surface.

FishNet (2D)
FishNet is generated in ArcMap using FishNet tool in ArcGIS.

3D Visualization in ArcScene
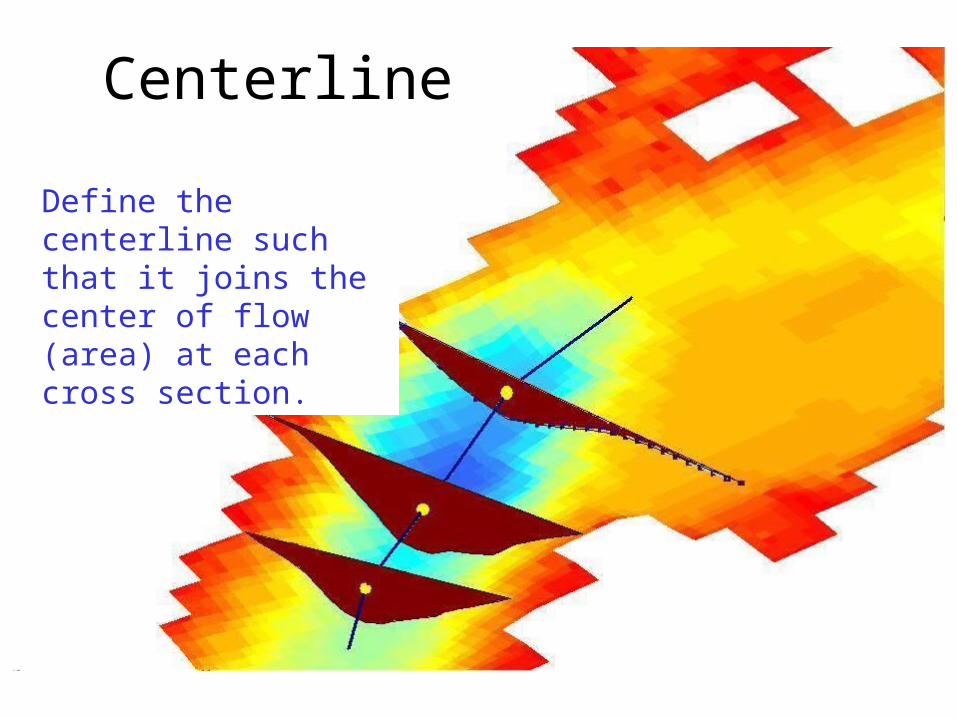
Centerline
Define the centerline such that it joins the center of flow (area) at each cross section.

Measure in ArcGIS
054.37 154.41
281.36
A PolylineM can store m-values at each vertex along with x and y coordinates.
Measures are assigned in meters

Coordinate Transformation
m is measure along the centerline
r is distance across the river from the centerline
Sinuous river becomes straight when transformed into (m,r) co-ordinates.

Coordinate Transformation
Sinuous river
Profile line and cross-sections
Straightened river
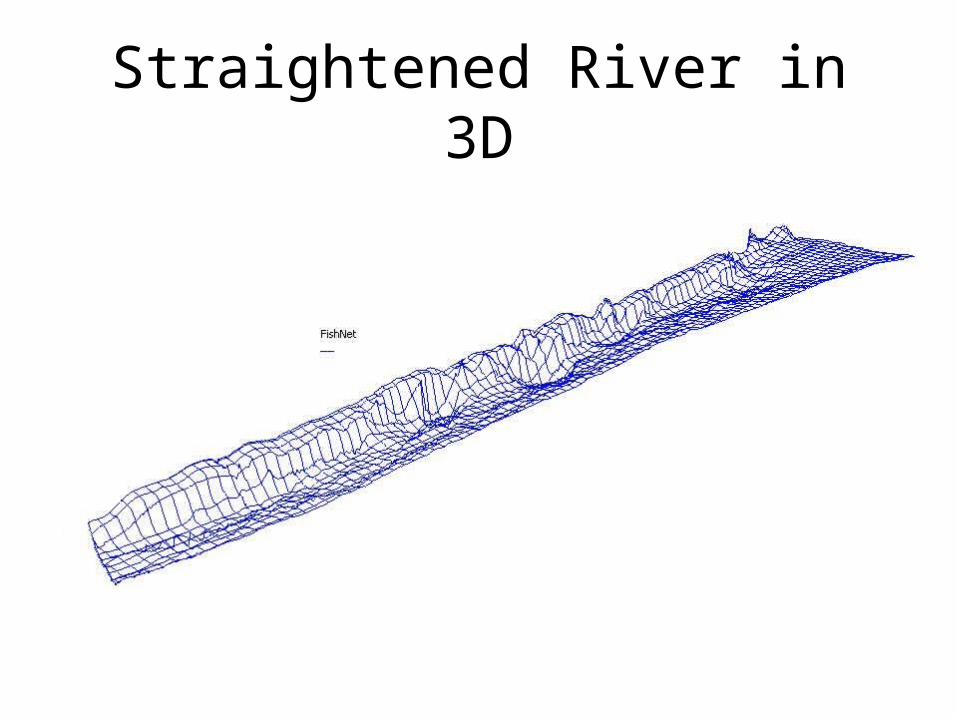
Straightened River in 3D

Data back to x,y coordinates
Original river in X,Y Profile lines and cross-sections in (x,y) created using FishNet in (m,r).

Profile Lines and Cross Sections in 3D
Bird’s eye view!

National Water Information System
Web access to USGS water resources data in real time

Space
Historical dailymean discharge
Streamflow statistics
Real Time data
Streamflow Information in Space and Time
Time
At Gages Anywhere on a Stream
Future PossibilitiesCurrent
Streamstats
TSDateTime
FeatureID
TSType
TSValue
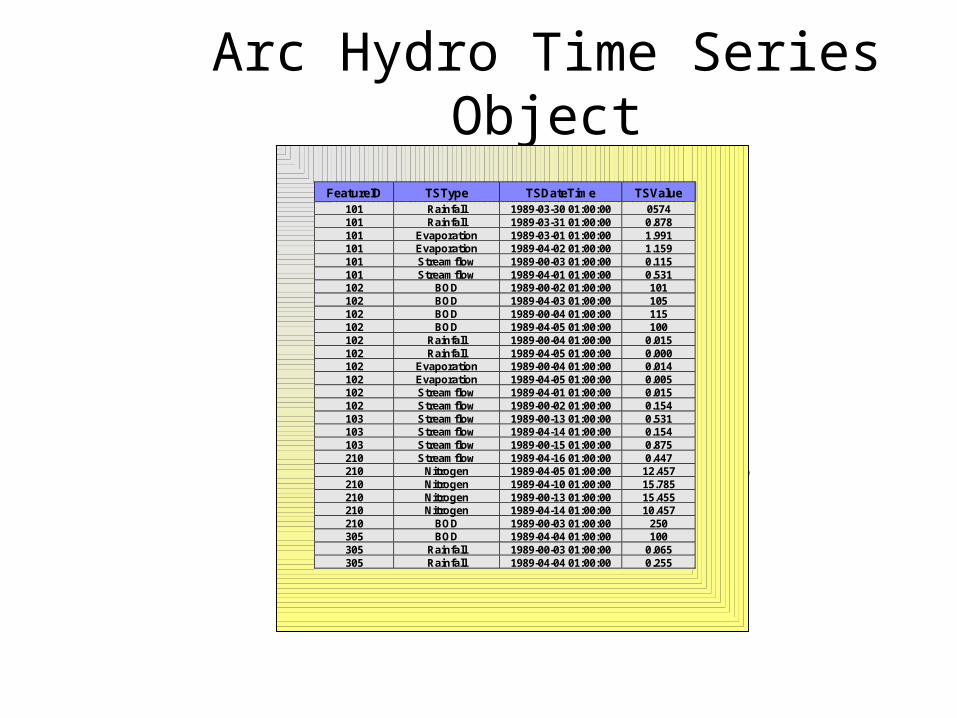
Arc Hydro Time Series Object
FeatureID TSType TSDateTime TSValue 101 Rainfall 1989-03-30 01:00:00 0574 101 Rainfall 1989-03-31 01:00:00 0.878 101 Evaporation 1989-03-01 01:00:00 1.991 101 Evaporation 1989-04-02 01:00:00 1.159 101 Streamflow 1989-00-03 01:00:00 0.115 101 Streamflow 1989-04-01 01:00:00 0.531 102 BOD 1989-00-02 01:00:00 101 102 BOD 1989-04-03 01:00:00 105 102 BOD 1989-00-04 01:00:00 115 102 BOD 1989-04-05 01:00:00 100 102 Rainfall 1989-00-04 01:00:00 0.015 102 Rainfall 1989-04-05 01:00:00 0.000 102 Evaporation 1989-00-04 01:00:00 0.014 102 Evaporation 1989-04-05 01:00:00 0.005 102 Streamflow 1989-04-01 01:00:00 0.015 102 Streamflow 1989-00-02 01:00:00 0.154 103 Streamflow 1989-00-13 01:00:00 0.531 103 Streamflow 1989-04-14 01:00:00 0.154 103 Streamflow 1989-00-15 01:00:00 0.875 210 Streamflow 1989-04-16 01:00:00 0.447 210 Nitrogen 1989-04-05 01:00:00 12.457 210 Nitrogen 1989-04-10 01:00:00 15.785 210 Nitrogen 1989-00-13 01:00:00 15.455 210 Nitrogen 1989-04-14 01:00:00 10.457 210 BOD 1989-00-03 01:00:00 250 305 BOD 1989-04-04 01:00:00 100 305 Rainfall 1989-00-03 01:00:00 0.065 305 Rainfall 1989-04-04 01:00:00 0.255

View 1: Time Series for a Spatial Feature
TSDateTime
FeatureID
TSType
101
FeatureID TSType TSDateTime TSValue101 2000-07-01 01:00:00Rainfall 0.055101 2000-07-02 01:00:00Rainfall 0.041101 2000-07-01 12:00:00Rainfall 0.000101
2000-07-02 12:00:00
0.001101 0.014101 0.004101 6.11101 6.31101 477.00101 465.00
EvaporationEvaporationEvaporationDischargeDischargeDischargeDischarge
2000-07-01 01:00:002000-07-02 01:00:002000-07-01 12:00:002000-07-01 01:00:002000-07-02 01:00:002000-07-01 12:00:00


View 2: Time Series of a Particular Type
TSDateTime
FeatureID
TSType
Evaporation
FeatureID TSType TSDateTime TSValue 101 Evaporation 1989-04-01 01:00:00 0.015 101 Evaporation 1989-00-02 01:00:00 0.154 103 Evaporation 1989-04-03 01:00:00 2.124 103 Evaporation 1989-00-04 01:00:00 0.015 103 Evaporation 1989-04-05 01:00:00 0.001 103 Evaporation 1989-04-10 01:00:00 0.015 103 Evaporation 1989-00-11 01:00:00 0.457 105 Evaporation 1989-04-12 01:00:00 0.115 105 Evaporation 1989-00-13 01:00:00 0.531 201 Evaporation 1989-04-14 01:00:00 0.154 201 Evaporation 1989-00-15 01:00:00 0.875 201 Evaporation 1989-04-16 01:00:00 0.447
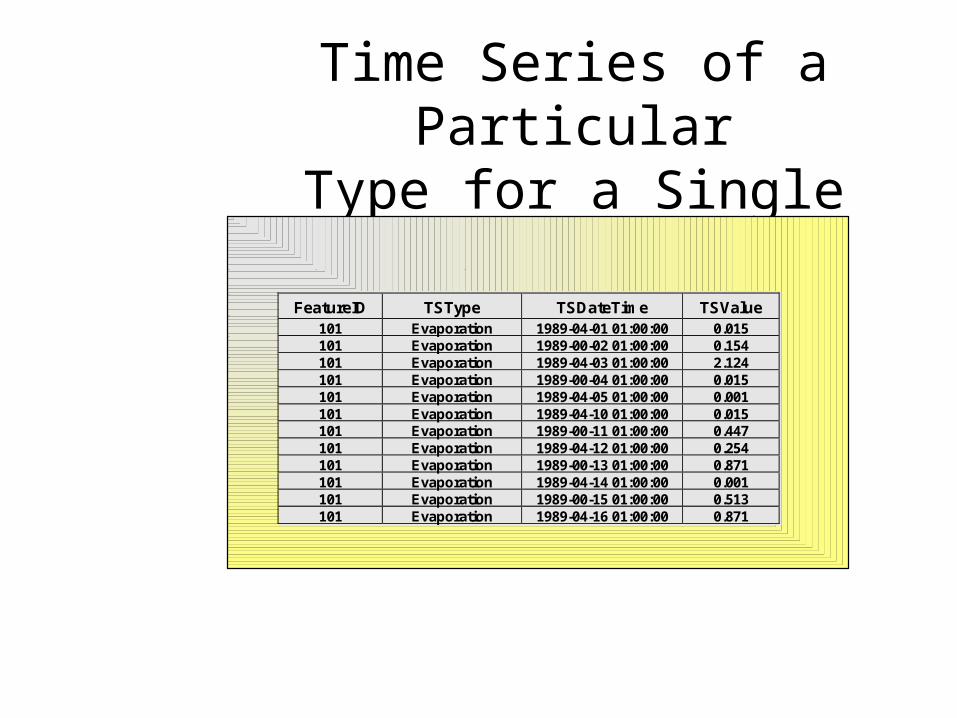
View 3: Time Series of a ParticularType for a Single Feature
TSDateTime
FeatureID
TSType
Evaporation
FeatureID TSType TSDateTime TSValue 101 Evaporation 1989-04-01 01:00:00 0.015 101 Evaporation 1989-00-02 01:00:00 0.154 101 Evaporation 1989-04-03 01:00:00 2.124 101 Evaporation 1989-00-04 01:00:00 0.015 101 Evaporation 1989-04-05 01:00:00 0.001 101 Evaporation 1989-04-10 01:00:00 0.015 101 Evaporation 1989-00-11 01:00:00 0.447 101 Evaporation 1989-04-12 01:00:00 0.254 101 Evaporation 1989-00-13 01:00:00 0.871 101 Evaporation 1989-04-14 01:00:00 0.001 101 Evaporation 1989-00-15 01:00:00 0.513 101 Evaporation 1989-04-16 01:00:00 0.871


HRAP Cells for Nexrad Data
Average area = 14.5 km2
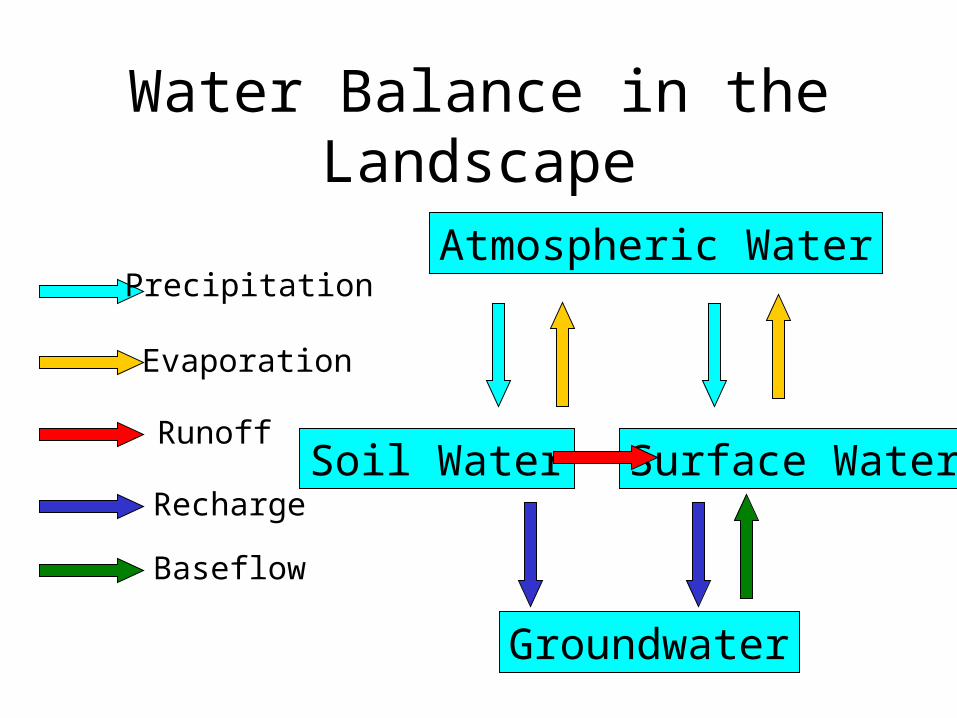
Water Balance in the Landscape
Atmospheric Water
Soil Water Surface Water
Groundwater
Precipitation
Evaporation
Runoff
Recharge
Baseflow

National Hydro Data Programshttp://www.crwr.utexas.edu/giswr/nhdconf/nationalhydro.html
National Elevation Dataset (NED)
National Hydrography Dataset(NHD)
Watershed Boundary DatasetElevation Derivatives forNational Application (EDNA)

EDNA Catchments
Average area = 7.5 km2

Modflow Groundwater Cells
Average area = 2.6 km2
Modflow Model of theEdwards-Trinity
aquifer
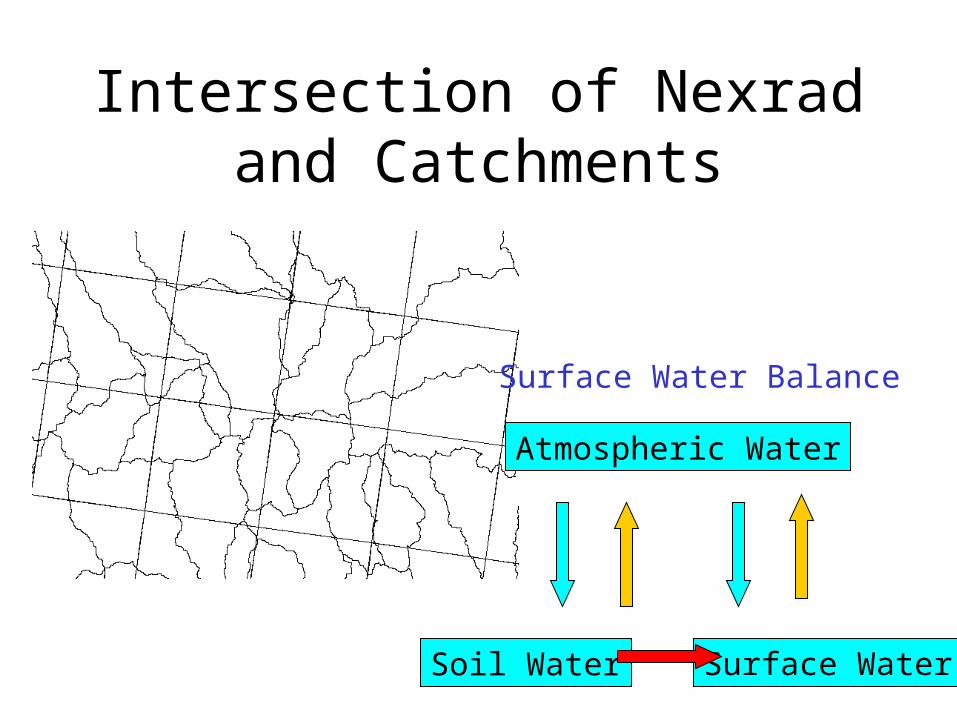
Intersection of Nexrad and Catchments
Atmospheric Water
Soil Water Surface Water
Surface Water Balance
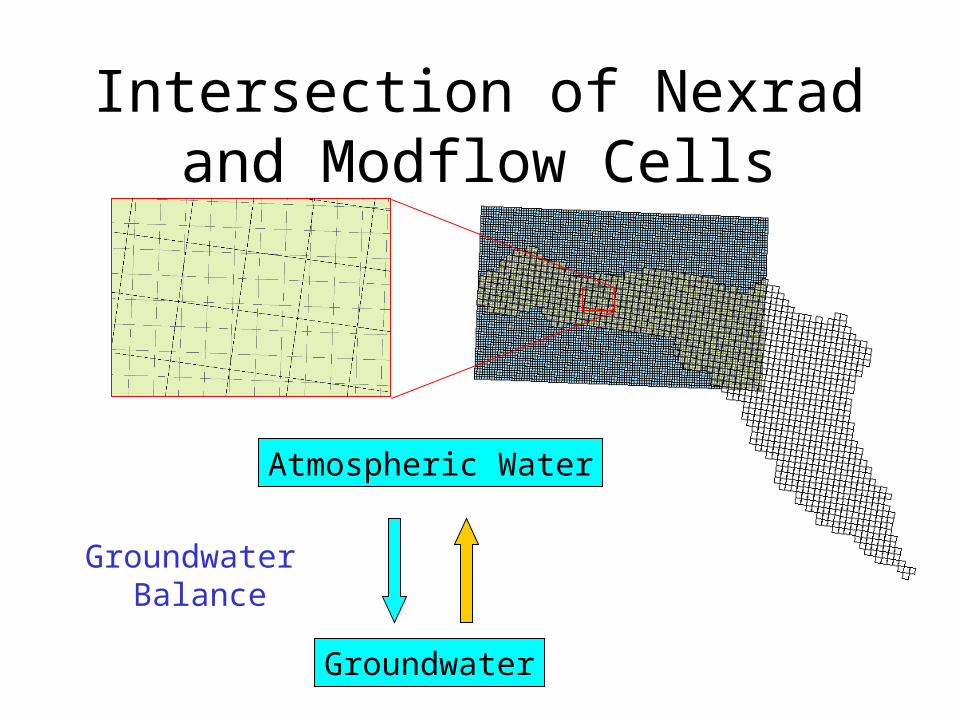
Intersection of Nexrad and Modflow Cells
Atmospheric Water
Groundwater
Groundwater Balance

Intersection of Nexrad, Catchments and Modflow
Atmospheric Water
Soil Water Surface Water
Groundwater
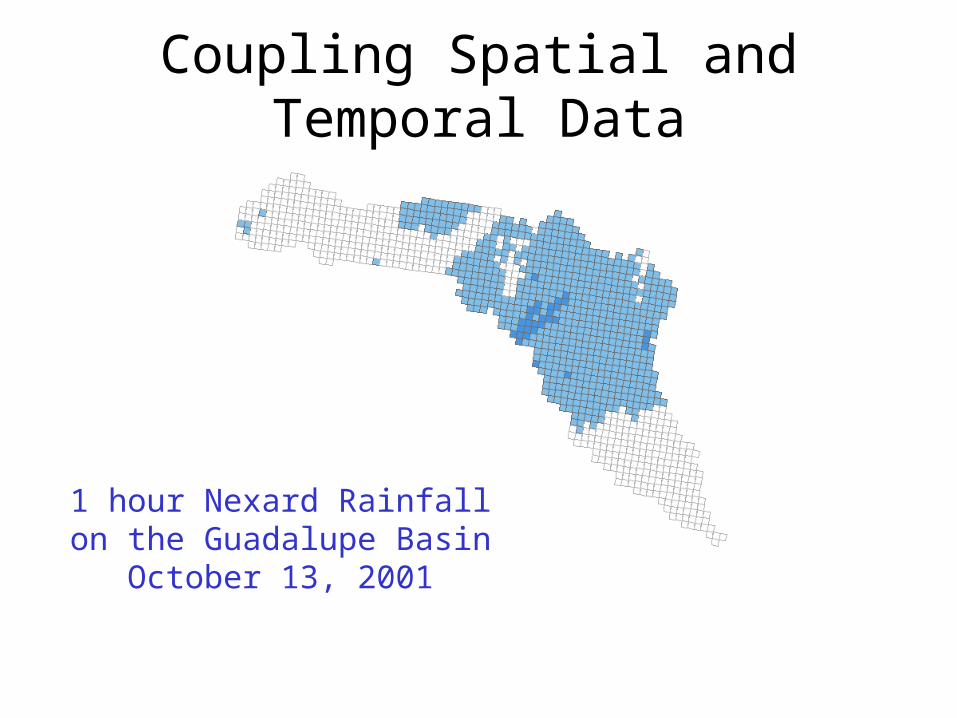
Coupling Spatial and Temporal Data
1 hour Nexard Rainfallon the Guadalupe Basin
October 13, 2001


Arc Hydro and Modeling
• Intrinsic Modeling – within a particular application eg Excel, ArcGIS
• Dynamic Linked Library – tightly coupled package of functions (e.g. LibHydro from HEC)
• Independent Modeling – separate hydrologic model with data exchange

Dynamic Linked Library
Can haveFortransubroutinesin a DLL
Muskingumflow routing

Independent Hydrologic Model
VB progam reads and writestext files
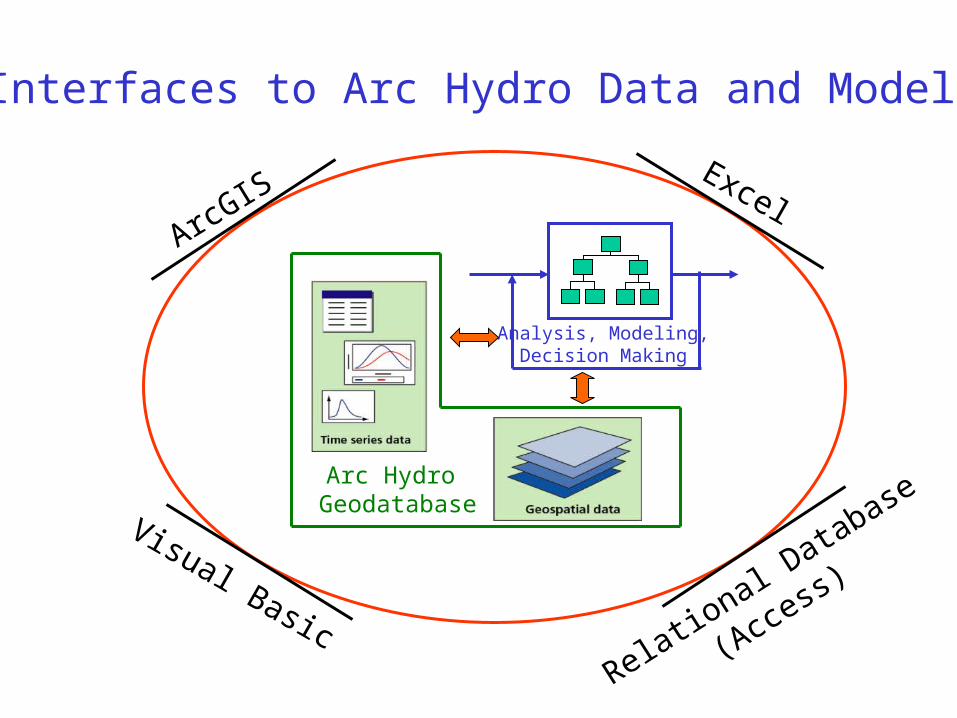
Analysis, Modeling,Decision Making
Arc Hydro Geodatabase
Visual Basic
ArcGIS
Relational D
atabase
(Access)
Excel
Interfaces to Arc Hydro Data and Models
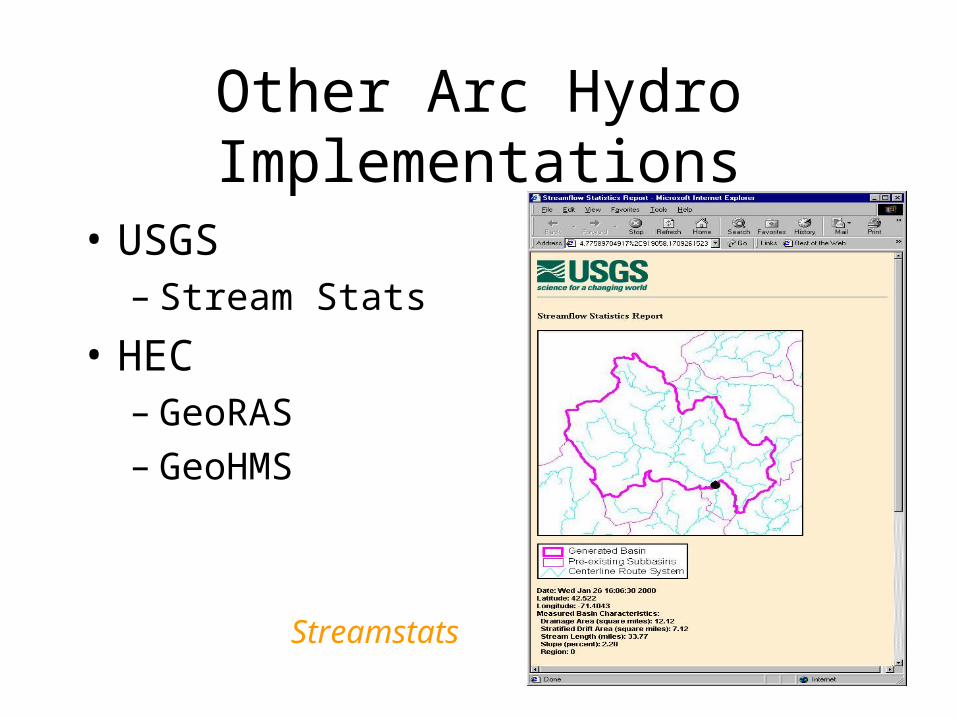
Other Arc Hydro Implementations
• USGS– Stream Stats
• HEC– GeoRAS– GeoHMS
Streamstats

• Why should the Corps of Engineers be interested in Arc Hydro?– Watershed planning– Reservoir operations– Flood damage
reduction– Ecosystem restoration
Arc Hydro: GIS for Water ResourcesDavid R. Maidment, University of Texas at Austin