why missing data should not be ignored and bayesian methods are … · missing data bayesian...
TRANSCRIPT

Missing Data Bayesian Analysis HAMD example Summary
Why missing data should not be ignoredand Bayesian methods are good
Alexina Mason
with thanks to my PhD supervisors, Nicky Best, Sylvia Richardson and Ian Plewis,and the BIAS team
8 April 2011
Missing Data Bayesian Analysis HAMD example Summary
Outline
Why missing data should not be ignored
Why Bayesian methods are good
Antidepressant Clinical Trial Example

Missing Data Bayesian Analysis HAMD example Summary
Introduction
• Missing data are common
• But usually handled inadequately
• Potentially distort scientific investigation
• Many methods of dealing with missing data exist
• The usefulness/validity of these methods depends on:• the cause of the missing data (missing data mechanism)• the pattern and extent of the missingness• whether outcomes or explanatory variables are missing
We now introduce missing data ideas using a clinical trial example

Missing Data Bayesian Analysis HAMD example Summary
Motivating example: antidepressant clinical trial• 6 centre clinical trial, comparing 3 treatments of depression
• 367 subjects randomised to one of 3 treatments
• Subjects rated on Hamilton depression score (HAMD) on 5weekly visits
• week 0 before treatment• weeks 1-4 during treatment
• HAMD score takes values 0-50• the higher the score, the more severe the depression
• Subjects drop out from week 2 onwards (246 complete cases)
• Data were previously analysed by Diggle and Kenward (1994)
Study objective: are there any differences in the effects of the 3treatments on the change in HAMD score over time?

Missing Data Bayesian Analysis HAMD example Summary
HAMD example: implications of drop-out
• Before analysing the data, we should consider
• Why did some subjects drop out of the study?
• Do the subjects who dropped out have similar characteristics toindividuals who remained in the study?
• How many subjects dropped out of the study each week?
• Is the level and pattern of drop out consistent across treatments?
• Simple tables and plots can help elucidate
• Experts may provide background information and rationale

Missing Data Bayesian Analysis HAMD example Summary
HAMD example: missingness level and pattern
Percentage of missingness by treatment and week
treat. 1 treat. 2 treat. 3 all treatmentsweek 0 0.0 0.0 0.0 0.0week 1 0.0 0.0 0.0 0.0week 2 11.7 22.0 9.3 14.2week 3 19.2 29.7 16.3 21.5week 4 36.7 35.6 27.1 33.0
• By the end of the study, one third of subjects drop-out
• Fewer subjects drop out of treatment 3
• Drop-out occurs earlier for treatment 2

Missing Data Bayesian Analysis HAMD example Summary
Complete Case analysis (CC)• If we had complete data, we could just fit an appropriate
regression model
• However, the missing data complicates this analysis
• One approach is to• discard individuals with incomplete information• analyse complete cases only
• Advantage: simple
• Disadvantages:• loss of precision, as not using all available information• often introduces bias (see below)
• Many computer packages do this by default
• Frequently used

Missing Data Bayesian Analysis HAMD example Summary
HAMD example: complete cases
0 1 2 3 4
010
2030
40
50 Individual Profiles
week
HA
MD
sco
re
treatment 1treatment 2treatment 3
0 1 2 3 4
010
2030
40
Mean Response Profiles
week
HA
MD
sco
re
treatment 1treatment 2treatment 3

Missing Data Bayesian Analysis HAMD example Summary
HAMD example: all cases
Mean response profiles by drop-out pattern
0 1 2 3 4
05
1015
2025
treatment 1
week
HA
MD
sco
re
complete cases
dropout at wk 4
dropout at wk 3
dropout at wk 2
0 1 2 3 4
05
1015
2025
treatment 2
week
HA
MD
sco
recomplete cases
dropout at wk 4
dropout at wk 3
dropout at wk 2
0 1 2 3 4
05
1015
2025
treatment 3
week
HA
MD
sco
re
complete cases
dropout at wk 4
dropout at wk 3
dropout at wk 2
• Individuals allocated to treatments 1 and 3 generally have higherprofiles if they dropped out rather than remained in the study.
• But the drop-out and CC profiles are similar for treatment 2

Missing Data Bayesian Analysis HAMD example Summary
HAMD example: is CC sensible?
• CC loses valuable information from 33% of individuals
• The plots suggest drop-out more likely for treatments 1 and 3 ifthe score is high
• Hence if we only analyse complete cases we will overestimatethe effectiveness of the treatment
• In general, with regression analysis on data with missingoutcomes, CC is biased (misleading) if
• the missingness is related to the outcome values
If CC is not sensible, what are the alternatives?

Missing Data Bayesian Analysis HAMD example Summary
Last observation carried forward (LOCF)
• Widely used in clinical trial settings
• But makes strong and unrealisticassumptions
• Assumption: all unseen measurements =last seen measurement
0 1 2 3 4
05
1525
treatment 2
week
HA
MD
sco
re
• In the HAMD example• If the treatment is working but individuals drop out early, we will
underestimate the treatment effect• LOCF changes the shape of the profile, as drop-outs likely to have
improved at least a little• This effect will vary by treatment, and hence inference about
treatment difference will be misleading
• Also, LOCF overestimates precision as information is ‘made up’with no acknowledgement of the uncertainty

Missing Data Bayesian Analysis HAMD example Summary
CC and LOCF not recommended
To quote Molenberghs et al. (2004)LOCF typically produces bias of which the direction andmagnitude depend on the true but unknown treatment effects
andwe have used both formal derivations and case studies to showthat there is little justification for analyzing incompletedata from longitudinal clinical trials by means of such simplemethods as LOCF and CC
Or as Carpenter (2004) succinctly puts it, we have
the bad - CC; the ugly - LOCF
So what is the good?

Missing Data Bayesian Analysis HAMD example Summary
Good methods for missing data• CC and LOCF are examples of ‘ad hoc’ methods
• ‘ad hoc’ methods are frequently used but not recommended
• Good methods are ‘statistically principled’
• In contrast to ad-hoc methods, principled methods are:• based on a well-defined statistical model for the complete data
and explicit assumptions about the missing value mechanism• the subsequent analysis, inferences and conclusions are valid
under these assumptions• does not mean the assumptions are necessarily true, but it does
allow the dependence of the conclusions on these assumptions tobe investigated
• Principled methods include multiple imputation and Bayesian fullprobability modelling
We now introduce Bayesian analysis

Missing Data Bayesian Analysis HAMD example Summary
Schools of inference
• There are 3 major schools of inference• Frequentist (Neyman-Pearson)• Likelihood (Fisher)• Bayesian (Thomas Bayes)
• The first two are often combined and the theory taught in basicstatistics courses (‘classical’ statistics)
• Historically, philosophical debates between classical andBayesian statisticians have sometimes been heated

Missing Data Bayesian Analysis HAMD example Summary
Bayesian inference
• Bayesian inference distinguishes between• observable quantities, i.e. observed data• unobserved quantities (e.g. statistical parameters, missing data)
• Unobserved quantities are viewed as unknown with anassociated probability distribution
• So Bayesian methods are a very natural way of handling missingdata
• a probability distribution is estimated for each missing value• allows uncertainty to be adequately captured
• The reverse viewpoint is that the data is random, but thegenerating process is fixed and unknown
• cannot make probability statements about parameters

Missing Data Bayesian Analysis HAMD example Summary
Credibility vs confidence intervals
• Bayesian inference uses credible intervals to provide a measureof the variability of a parameter (e.g. regression coefficient, θ)
• A 95% credible interval for θ is interpreted as:The probability that θ lies in this interval is 95%
• Tells us what we want to know
• By contrast a typical description of a 95% confidence intervalfrom a classical textbook is:If we were able to reproduce the experiment under the exactsame conditions a large number of times, then the true value of θwould be included in this interval 95% of the time
• Difficult to interpret!

Missing Data Bayesian Analysis HAMD example Summary
3 components of Bayesian inference
• The prior distribution• reflects the plausibility of different values of the unknowns before
the data is seen• often referred to as the prior
• The likelihood• expresses support for different values of the unknowns based
solely on the data• also used in classical inference
• The posterior distribution• combines information in the prior distribution with the likelihood
using Bayes theorem• is the basis of all Bayesian inference• expresses uncertainty about the unknowns after seeing the data
Missing Data Bayesian Analysis HAMD example Summary
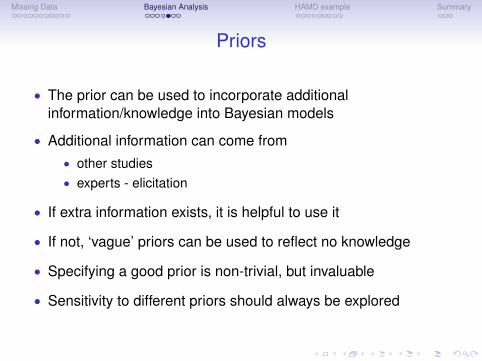
Priors
• The prior can be used to incorporate additionalinformation/knowledge into Bayesian models
• Additional information can come from• other studies• experts - elicitation
• If extra information exists, it is helpful to use it
• If not, ‘vague’ priors can be used to reflect no knowledge
• Specifying a good prior is non-trivial, but invaluable
• Sensitivity to different priors should always be explored
Missing Data Bayesian Analysis HAMD example Summary
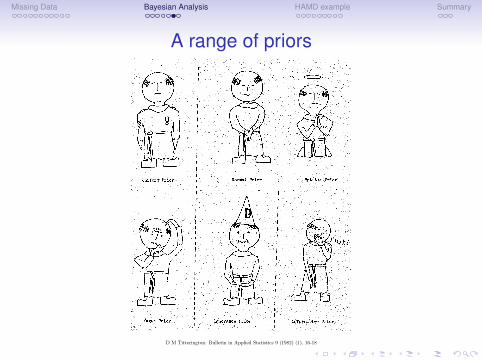
A range of priors
D M Titterington. Bulletin in Applied Statistics 9 (1982) (1), 16-18
1

Missing Data Bayesian Analysis HAMD example Summary
Combining the prior and likelihood• Suppose we are at an early stage of investigating a new drug
• We can use experience with similar compounds, which suggestresponse rates between 0.2 and 0.6 are feasible, to create aninformative prior
• We then treat 20 volunteers with the new drug and observe 15positive responses
• For a larger trial (200 individuals), the prior will have less effect
probability of response0.0 0.2 0.4 0.6 0.8 1.0
prior

Missing Data Bayesian Analysis HAMD example Summary
Combining the prior and likelihood• Suppose we are at an early stage of investigating a new drug
• We can use experience with similar compounds, which suggestresponse rates between 0.2 and 0.6 are feasible, to create aninformative prior
• We then treat 20 volunteers with the new drug and observe 15positive responses
• For a larger trial (200 individuals), the prior will have less effect
probability of response0.0 0.2 0.4 0.6 0.8 1.0
priorlikelihood

Missing Data Bayesian Analysis HAMD example Summary
Combining the prior and likelihood• Suppose we are at an early stage of investigating a new drug
• We can use experience with similar compounds, which suggestresponse rates between 0.2 and 0.6 are feasible, to create aninformative prior
• We then treat 20 volunteers with the new drug and observe 15positive responses
• For a larger trial (200 individuals), the prior will have less effect
probability of response0.0 0.2 0.4 0.6 0.8 1.0
priorlikelihoodposterior
probability of response0.0 0.2 0.4 0.6 0.8 1.0
priorlikelihoodposterior

Missing Data Bayesian Analysis HAMD example Summary
HAMD example: recap
0 1 2 3 4
010
2030
40
50 Individual Profiles (all cases)
week
HA
MD
sco
re
treatment 1treatment 2treatment 3
• Clinical trial, comparing 3treatments of depression
• Study objective: are there anydifferences in the effects of the3 treatments on the change inHAMD score over time?
• Subjects drop out from week 2onwards

Missing Data Bayesian Analysis HAMD example Summary
HAMD example: analysis model
• To investigate the study objective, we need to regress the HAMDscore against week
• For the purposes of exposition, we use a simple model that• assumes a linear relationship• uses different slope parameters for each treatment• takes account of the repeated structure in the data
• Options for allowing for the repeated structure include:• incorporating random effects• modelling the autocorrelation between weekly visits directly
• The covariates (week and treatment) are fully observed
• Only the outcome, HAMD score, has missing values

Missing Data Bayesian Analysis HAMD example Summary
HAMD example: model of missingness• The specification of the model of missingness depends on our
assumptions about the missingness mechanism
• We could assume that the probability of drop-out depends on:1. HAMD score in the previous week2. current HAMD score3. change in the HAMD score between previous and current week
• Option 1 depends only on observed data• this is ignorable missingness
• Options 2 and 3 depend on observed and missing data• this is non-ignorable missingness• now we must include a model of missingness - model the HAMD
score missingness indicator
• Further variants can be created by allowing different parametersfor each treatment

Missing Data Bayesian Analysis HAMD example Summary
HAMD example: how the Bayesian approach helps
• Although we are not using informative priors in this example, theBayesian approach still has advantages
• The analysis model and model of missingness are fittedsimultaneously as a joint model, ensuring
• estimation is internally consistent• uncertainty is properly taken into account
• Adapting the model to test different assumptions is easy
• All this is possible in the classical framework, but harder

Missing Data Bayesian Analysis HAMD example Summary
HAMD example: interpretation of results
• Study objective: are there any differences in the effects of the 3treatments on the change in HAMD score over time?
• So we are particularly interested in the differences in the slopeparameters
• we will call these contrasts
• Interpretation of contrast for treatment A v treatment B:• negative values favour treatment A• positive values favour treatment B
Missing Data Bayesian Analysis HAMD example Summary
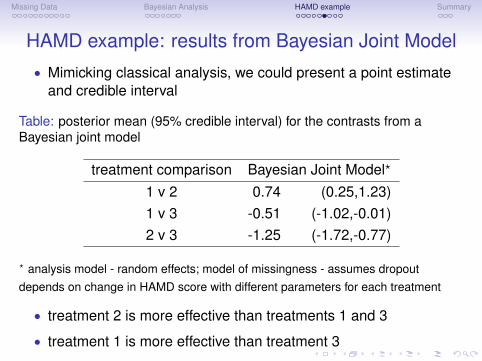
HAMD example: results from Bayesian Joint Model
• Mimicking classical analysis, we could present a point estimateand credible interval
Table: posterior mean (95% credible interval) for the contrasts from aBayesian joint model
treatment comparison Bayesian Joint Model?
1 v 2 0.74 (0.25,1.23)1 v 3 -0.51 (-1.02,-0.01)2 v 3 -1.25 (-1.72,-0.77)
? analysis model - random effects; model of missingness - assumes dropoutdepends on change in HAMD score with different parameters for each treatment
• treatment 2 is more effective than treatments 1 and 3
• treatment 1 is more effective than treatment 3

Missing Data Bayesian Analysis HAMD example Summary
HAMD example: results from Bayesian Joint Model• However, the reporting of Bayesian analysis is not restricted to
point estimates and credible intervals
• A complete probability distribution for each quantity of interestcan be presented
Bayesian Joint Model
0.0 0.5 1.0 1.5
0.0
0.5
1.0
1.5
Contrast for 1 v 2
Den
sity
−1.5 −0.5 0.0 0.5
0.0
0.5
1.0
1.5
Contrast for 1 v 3D
ensi
ty
−2.0 −1.5 −1.0 −0.50.
00.
51.
01.
5
Contrast for 2 v 3
Den
sity

Missing Data Bayesian Analysis HAMD example Summary
HAMD example: results from Bayesian Joint Model• However, the reporting of Bayesian analysis is not restricted to
point estimates and credible intervals
• A complete probability distribution for each quantity of interestcan be presented
Bayesian Joint Model
contrasts (treatment Comparisons)−3 −2 −1 0 1 2
1 v 2
1 v 3
2 v 3
1 v 2
1 v 3

Missing Data Bayesian Analysis HAMD example Summary
HAMD example: results from Bayesian Joint Model
We can also directly calculate the probability that one treatment isbetter than another
• Probability treatment 2 more effective than treatment 1 = 0.999
• Probability treatment 1 more effective than treatment 3 = 0.977
• Probability treatment 2 more effective than treatment 3 = 1.000

Missing Data Bayesian Analysis HAMD example Summary
HAMD example: does the model make a difference?The Good (Bayesian Joint Model), Bad (CC) and Ugly (LOCF)
contrasts (treatment Comparisons)−3 −2 −1 0 1 2
1 v 2 − GOOD
1 v 2 − BAD
1 v 2 − UGLY
1 v 3 − GOOD
1 v 3 − BAD
1 v 3 − UGLY
2 v 3 − GOOD
2 v 3 − BAD
2 v 3 − UGLY

Missing Data Bayesian Analysis HAMD example Summary
Summary
• Ignoring missing data and performing CC implies strong (usuallyunrealistic) assumptions
• Think carefully about the missing data process
• Bayesian methods provide a natural way of incorporating realisticassumptions
• Missing data adds uncertainty - acknowledge this by presentingresults from a range of models based on plausible assumptions
Useful website on missing data:www.missingdata.org.uk
For recent research on Bayesian methods for missing data:www.bias-project.org.uk/research.htm

Missing Data Bayesian Analysis HAMD example Summary
Sequel
How to deal with missingexplanatory variables:
application to low birth weight data

Missing Data Bayesian Analysis HAMD example Summary
References
I Carpenter, J. (2004).LOCF - time to stop carrying it forward.www.missingdata.org.uk.Talk given given to PSI scientific meeting on missing data, London, 20th October 2004.
I Daniels, M. J. and Hogan, J. W. (2008).Missing Data In Longitudinal Studies Strategies for Bayesian Modeling and Sensitivity Analysis. Chapman & Hall.
I Diggle, P. and Kenward, M. G. (1994).Informative Drop-out in Longitudinal Data Analysis (with discussion).Journal of the Royal Statistical Society, Series C (Applied Statistics), 43, (1), 49–93.
I Little, R. J. A. and Rubin, D. B. (2002).Statistical Analysis with Missing Data, (2nd edn). John Wiley and Sons.
I Molenberghs, G. and Kenward, M. G. (2007).Missing Data in Clinical Studies, (1st edn). John Wiley and Sons.
I Molenberghs, G., Thijs, H., Jansen, I., Beunckens, C., Kenward, M. G., Mallinckrodt, C., and Carroll, R. J. (2004).Analysing incomplete longitudinal clinical trial data.Biostatistics, 5, (3), 445–64.