why is every 4th indian hungry?
TRANSCRIPT
Navdanya
Authors
Vandana Shiva
Kunwar Jalees
Why is Every 4th Indian Hungry?The Causes and Cures
for Food Insecurity
Why is Every 4th Indian Hungry? The Causes and Cures for Food Insecurity
© Navdanya, 2009
Authors: Vandana Shiva Kunwar Jalees
Published by : Navdanya A-60, Hauz Khas New Delhi - 110 016, India Tel: 91-11-2653 5422, 2696 8077 Fax: 91-11-2685 6795 E-mail: [email protected] Website: www.navdanya.org
Designed & Printed by : Systems Vision [email protected]
Contents
1. Introduction: Globalisation and the Food Crisis ............................................................. 1
2. India: The Emerging Capital of Hunger in the “Emerging Economic Superpower” ................................................................................. 10
3. Declining Food Availability, Increasing Food Insecurity ............................................ 18
4. States and Regions with the Worst Malnutrition, Social Exclusion and Hunger ............................................................................................ 31
5. Dismantling the Public Distribution System (PDS) ...................................................... 49
6. Programmes for Children’s Nutrition ............................................................................. 64
7. Nutritional Transition to Unhealthy and Unsafe Food ............................................... 75
8. Eco-Nutrition : How Biodiverse Organic Farming Addresses Hunger and Malnutrition .............................................................................. 78
9. Food Sovereignty (Anna Swaraj) ..................................................................................... 85
References .................................................................................................................................... 95

1
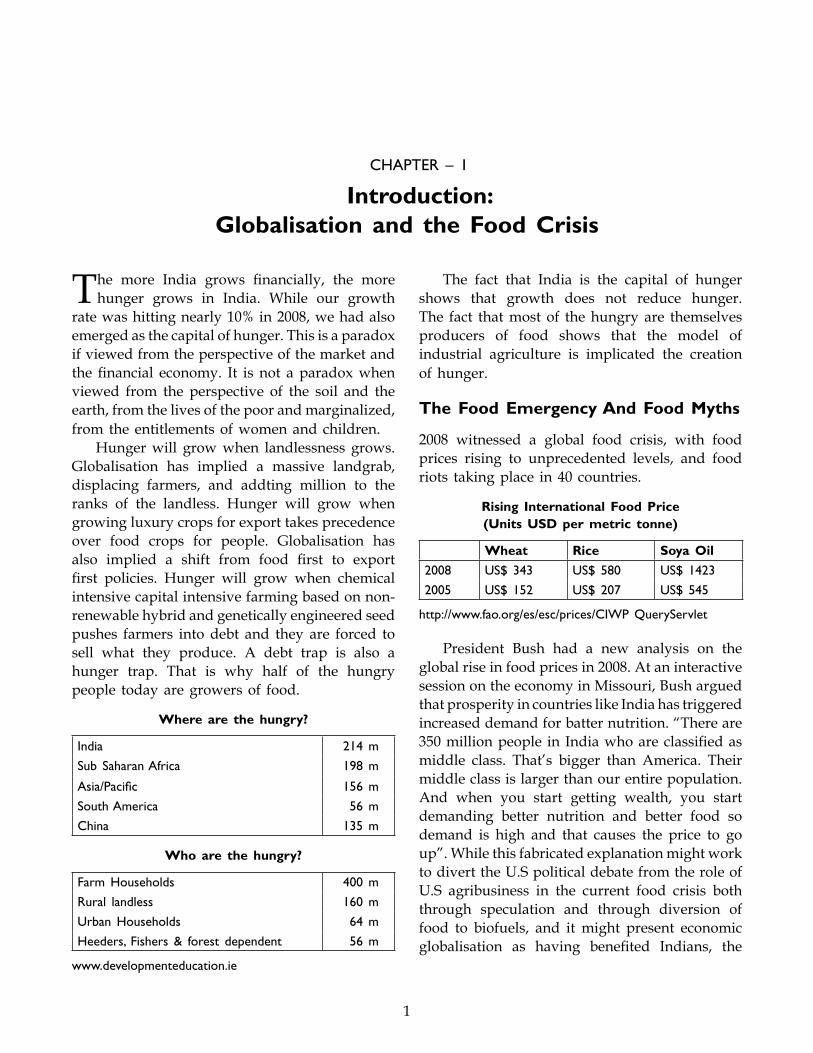
The more India grows financially, the more hunger grows in India. While our growth
rate was hitting nearly 10% in 2008, we had also emerged as the capital of hunger. This is a paradox if viewed from the perspective of the market and the financial economy. It is not a paradox when viewed from the perspective of the soil and the earth, from the lives of the poor and marginalized, from the entitlements of women and children.
Hunger will grow when landlessness grows. Globalisation has implied a massive landgrab, displacing farmers, and addting million to the ranks of the landless. Hunger will grow when growing luxury crops for export takes precedence over food crops for people. Globalisation has also implied a shift from food first to export first policies. Hunger will grow when chemical intensive capital intensive farming based on non-renewable hybrid and genetically engineered seed pushes farmers into debt and they are forced to sell what they produce. A debt trap is also a hunger trap. That is why half of the hungry people today are growers of food.
Where are the hungry?
India 214 m
Sub Saharan Africa 198 m
Asia/Pacific 156 m
South America 56 m
China 135 m
Who are the hungry?
Farm Households 400 m
Rural landless 160 m
Urban Households 64 m
Heeders, Fishers & forest dependent 56 m
www.developmenteducation.ie
The fact that India is the capital of hunger shows that growth does not reduce hunger. The fact that most of the hungry are themselves producers of food shows that the model of industrial agriculture is implicated the creation of hunger.
The Food Emergency And Food Myths
2008 witnessed a global food crisis, with food prices rising to unprecedented levels, and food riots taking place in 40 countries.
Rising International Food Price (Units USD per metric tonne)
Wheat Rice Soya Oil
2008 US$ 343 US$ 580 US$ 1423
2005 US$ 152 US$ 207 US$ 545
http://www.fao.org/es/esc/prices/CIWP QueryServlet
President Bush had a new analysis on the global rise in food prices in 2008. At an interactive session on the economy in Missouri, Bush argued that prosperity in countries like India has triggered increased demand for batter nutrition. “There are 350 million people in India who are classified as middle class. That’s bigger than America. Their middle class is larger than our entire population. And when you start getting wealth, you start demanding better nutrition and better food so demand is high and that causes the price to go up”. While this fabricated explanation might work to divert the U.S political debate from the role of U.S agribusiness in the current food crisis both through speculation and through diversion of food to biofuels, and it might present economic globalisation as having benefited Indians, the
CHAPTER – 1
Introduction: Globalisation and the Food Crisis
2
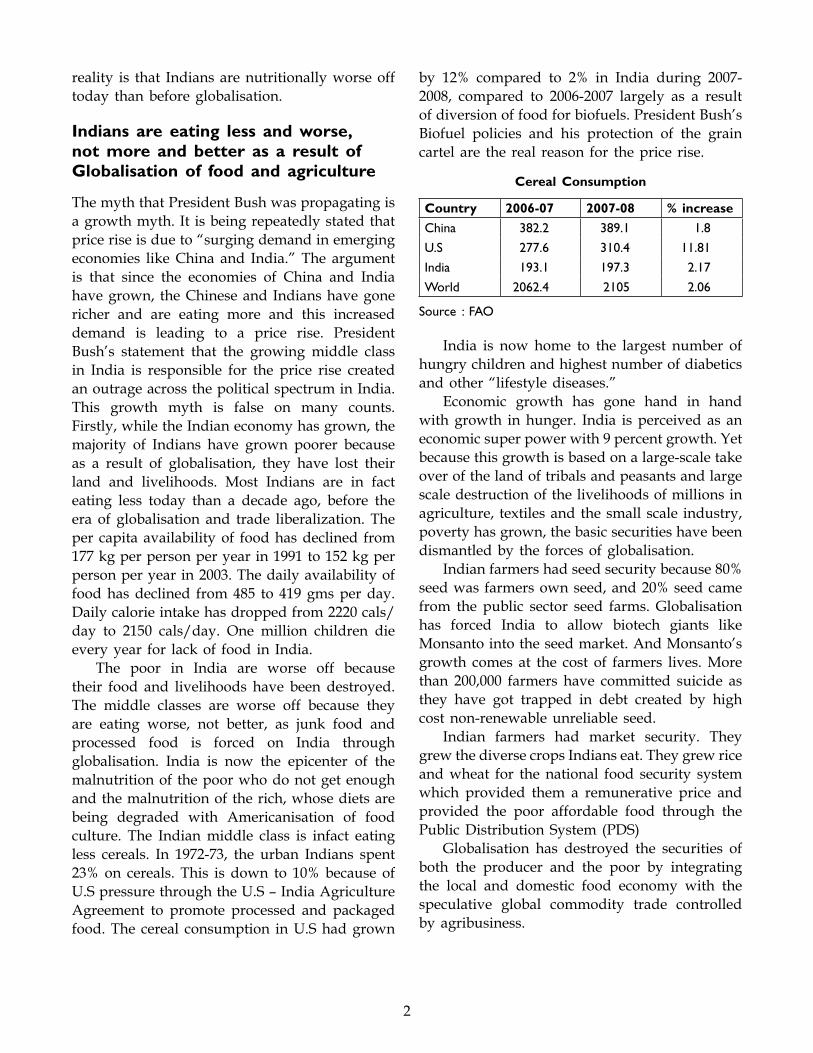
reality is that Indians are nutritionally worse off today than before globalisation.
Indians are eating less and worse, not more and better as a result of Globalisation of food and agriculture
The myth that President Bush was propagating is a growth myth. It is being repeatedly stated that price rise is due to “surging demand in emerging economies like China and India.” The argument is that since the economies of China and India have grown, the Chinese and Indians have gone richer and are eating more and this increased demand is leading to a price rise. President Bush’s statement that the growing middle class in India is responsible for the price rise created an outrage across the political spectrum in India. This growth myth is false on many counts. Firstly, while the Indian economy has grown, the majority of Indians have grown poorer because as a result of globalisation, they have lost their land and livelihoods. Most Indians are in fact eating less today than a decade ago, before the era of globalisation and trade liberalization. The per capita availability of food has declined from 177 kg per person per year in 1991 to 152 kg per person per year in 2003. The daily availability of food has declined from 485 to 419 gms per day. Daily calorie intake has dropped from 2220 cals/day to 2150 cals/day. One million children die every year for lack of food in India.
The poor in India are worse off because their food and livelihoods have been destroyed. The middle classes are worse off because they are eating worse, not better, as junk food and processed food is forced on India through globalisation. India is now the epicenter of the malnutrition of the poor who do not get enough and the malnutrition of the rich, whose diets are being degraded with Americanisation of food culture. The Indian middle class is infact eating less cereals. In 1972-73, the urban Indians spent 23% on cereals. This is down to 10% because of U.S pressure through the U.S – India Agriculture Agreement to promote processed and packaged food. The cereal consumption in U.S had grown
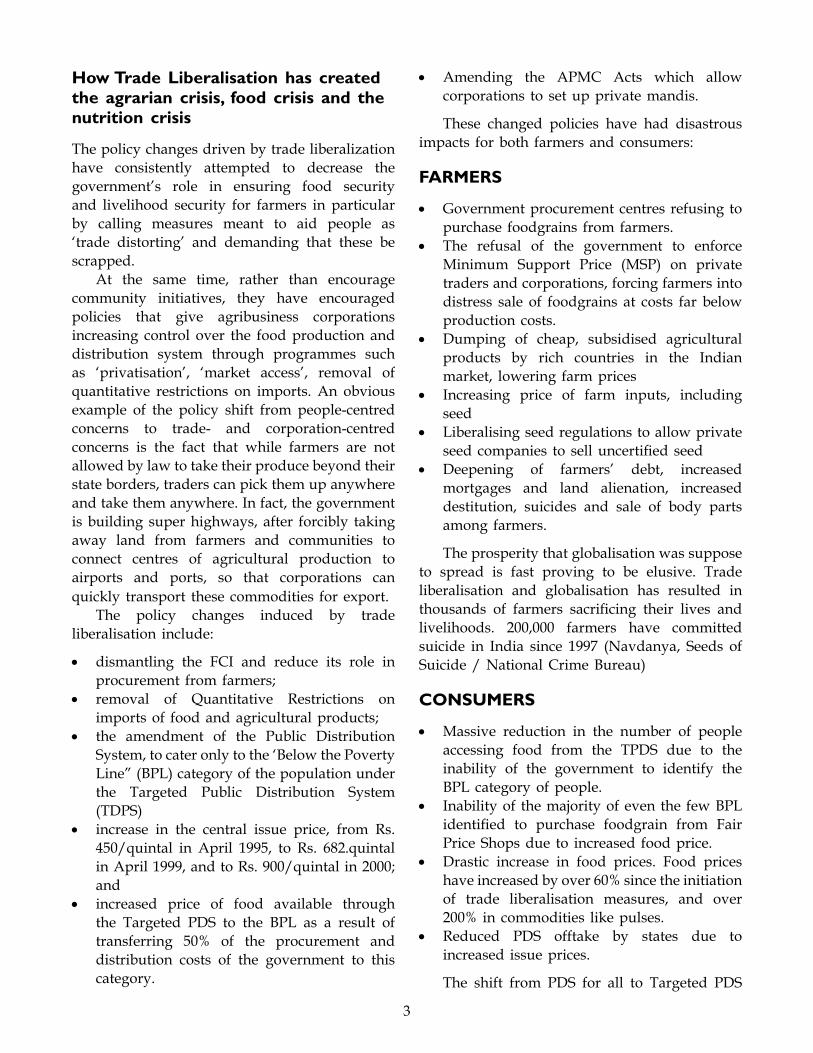
by 12% compared to 2% in India during 2007-2008, compared to 2006-2007 largely as a result of diversion of food for biofuels. President Bush’s Biofuel policies and his protection of the grain cartel are the real reason for the price rise.
Cereal Consumption
Country 2006-07 2007-08 % increase
China 382.2 389.1 1.8
U.S 277.6 310.4 11.81
India 193.1 197.3 2.17
World 2062.4 2105 2.06
Source : FAO
India is now home to the largest number of hungry children and highest number of diabetics and other “lifestyle diseases.”
Economic growth has gone hand in hand with growth in hunger. India is perceived as an economic super power with 9 percent growth. Yet because this growth is based on a large-scale take over of the land of tribals and peasants and large scale destruction of the livelihoods of millions in agriculture, textiles and the small scale industry, poverty has grown, the basic securities have been dismantled by the forces of globalisation.
Indian farmers had seed security because 80% seed was farmers own seed, and 20% seed came from the public sector seed farms. Globalisation has forced India to allow biotech giants like Monsanto into the seed market. And Monsanto’s growth comes at the cost of farmers lives. More than 200,000 farmers have committed suicide as they have got trapped in debt created by high cost non-renewable unreliable seed.
Indian farmers had market security. They grew the diverse crops Indians eat. They grew rice and wheat for the national food security system which provided them a remunerative price and provided the poor affordable food through the Public Distribution System (PDS)
Globalisation has destroyed the securities of both the producer and the poor by integrating the local and domestic food economy with the speculative global commodity trade controlled by agribusiness.
3
How Trade Liberalisation has created the agrarian crisis, food crisis and the nutrition crisis
The policy changes driven by trade liberalization have consistently attempted to decrease the government’s role in ensuring food security and livelihood security for farmers in particular by calling measures meant to aid people as ‘trade distorting’ and demanding that these be scrapped.
At the same time, rather than encourage community initiatives, they have encouraged policies that give agribusiness corporations increasing control over the food production and distribution system through programmes such as ‘privatisation’, ‘market access’, removal of quantitative restrictions on imports. An obvious example of the policy shift from people-centred concerns to trade- and corporation-centred concerns is the fact that while farmers are not allowed by law to take their produce beyond their state borders, traders can pick them up anywhere and take them anywhere. In fact, the government is building super highways, after forcibly taking away land from farmers and communities to connect centres of agricultural production to airports and ports, so that corporations can quickly transport these commodities for export.
The policy changes induced by trade liberalisation include:
• dismantling the FCI and reduce its role in procurement from farmers;
• removal of Quantitative Restrictions on imports of food and agricultural products;
• the amendment of the Public Distribution System, to cater only to the ‘Below the Poverty Line” (BPL) category of the population under the Targeted Public Distribution System (TDPS)
• increase in the central issue price, from Rs. 450/quintal in April 1995, to Rs. 682.quintal in April 1999, and to Rs. 900/quintal in 2000; and
• increased price of food available through the Targeted PDS to the BPL as a result of transferring 50% of the procurement and distribution costs of the government to this category.
• Amending the APMC Acts which allow corporations to set up private mandis.
These changed policies have had disastrous impacts for both farmers and consumers:
FARMERS
• Government procurement centres refusing to purchase foodgrains from farmers.
• The refusal of the government to enforce Minimum Support Price (MSP) on private traders and corporations, forcing farmers into distress sale of foodgrains at costs far below production costs.
• Dumping of cheap, subsidised agricultural products by rich countries in the Indian market, lowering farm prices
• Increasing price of farm inputs, including seed
• Liberalising seed regulations to allow private seed companies to sell uncertified seed
• Deepening of farmers’ debt, increased mortgages and land alienation, increased destitution, suicides and sale of body parts among farmers.
The prosperity that globalisation was suppose to spread is fast proving to be elusive. Trade liberalisation and globalisation has resulted in thousands of farmers sacrificing their lives and livelihoods. 200,000 farmers have committed suicide in India since 1997 (Navdanya, Seeds of Suicide / National Crime Bureau)
CONSUMERS
• Massive reduction in the number of people accessing food from the TPDS due to the inability of the government to identify the BPL category of people.
• Inability of the majority of even the few BPL identified to purchase foodgrain from Fair Price Shops due to increased food price.
• Drastic increase in food prices. Food prices have increased by over 60% since the initiation of trade liberalisation measures, and over 200% in commodities like pulses.
• Reduced PDS offtake by states due to increased issue prices.
The shift from PDS for all to Targeted PDS
4
was justified on grounds of reducing government expenditure. However, with trade liberalisation, the PDS costs to government have risen from Rs.5,166 crores in the mid ’90s to Rs. 9300 in 1999-2000.10 and Rs. 32,667 crores in 2008-09. While the government blames farmers for this increased expenditure, the primary reason is the increased cost of food to consumers as a result of policy changes, resulting in a drastic rise in market prices of food and a decline in purchases from the Fair Price Shops.
• Unchecked availability of hazardous and potentially hazardous food.
• Overflowing godowns and massive starvation.
Declining food production
Agricultural policies that push the small farmer to destitution on the one hand, and promote cash cropping on the other, have resulted in lowered food production. There has been a steady decline in food production since the early ’90s, as a result of the thrust towards export-oriented agriculture. The collapse of domestic support for food production (through dismantling the MSP, rising costs of inputs, crop failure due to uncertified seeds) in the late 90s has intensified this shift, as farmers are desperate to recover their losses. The country is already facing a decline in food production to the order of 12.8% in just one year.
Declining Food Consumption
A major impact of trade liberalisation policies has been a general lowering of food consumption. The per capita cereal consumption has declined from 17kg per capita per month in the 1950s to 13.5 kg per capita per month in the 1990s. The National Nutrition Monitoring Bureau 1997 data shows a declining trend in consumption in Rural India, particularly in cereal and millets, the main source of energy for the poor, from 1990 to 1995. The most important reasons for this decline are:
• rising food prices• destruction of livelihoods• destruction of the PDS system• shift to export oriented agriculture
Trade liberalisation links to a decline in food consumption are even more evident in the sub-Saharan region of Africa. As a result of loan conditional adjustment and export thrust, five of the six most populous countries of this region (which together comprise 60% of the total population of the region) have experienced a decline in calorie intake per head even after taking account of net food aid inflows.
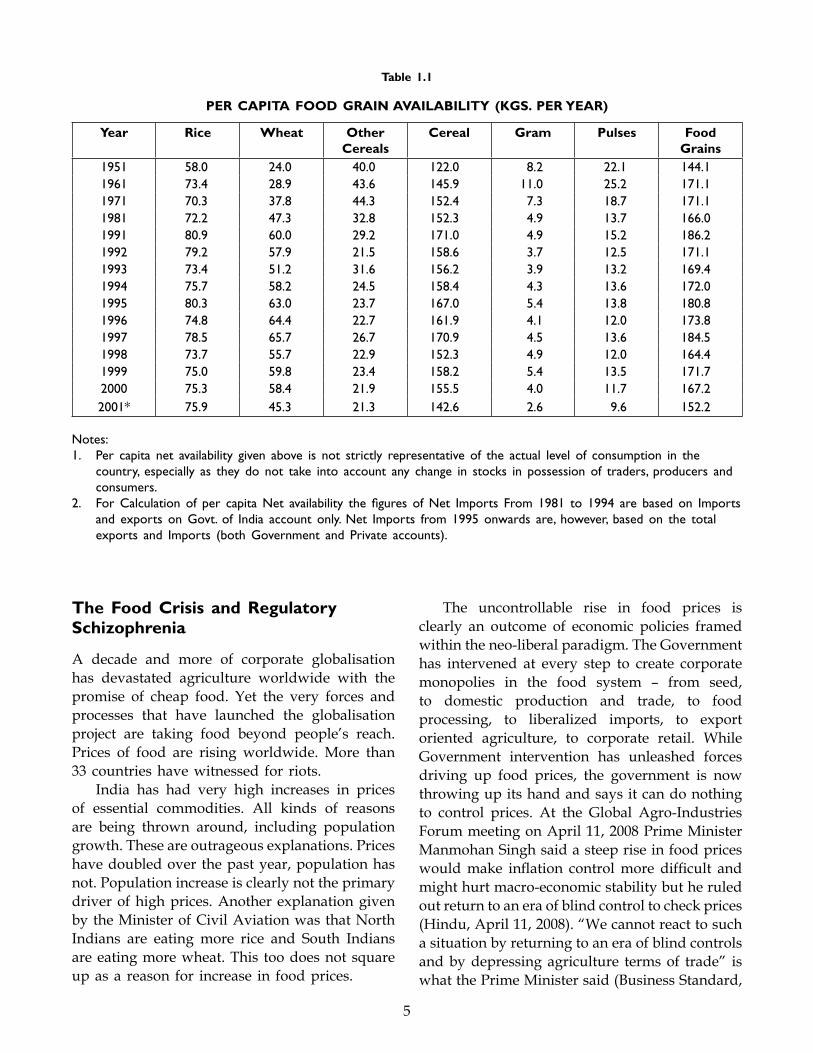
In India, it is evident from the Table 1.1 that the per capita food grain availability has been seriously declining since 1995, when WTO’s rules started being implemented. In fact, National Sample Survey (NSS) rounds starting from the 38th round have documented the decline in cereal consumption following the implementation of SAPs.
The reduced consumption on the one hand, and the decline in agricultural production and procurement on the other are directly linked though the Food and Agricultural policies of the government. Colonialism had destroyed the food sovereignty of the country, forcing changes in cropping from food for local and regional food security to commercial crops. Rice particularly had become a commercial crop even within the country. The emphasis on foreign trade had resulted in large scale famines in the country, forcing Cornelius Walford to comment in 1879 in The Famines of the World - ~ “it is an anomaly that, with her famines on hand, India is able to supply food for other parts of the world.”
Following independence, the Government’s priority was to ensure that farmers would produce food – and thus government procurement (to ensure both that farmers produced food, and got just prices for it) and the public distribution system (to ensure that consumers got adequate food at affordable prices) was designed. The need for government involvement in food production and distribution became even more necessary with the Green Revolution that firstly, destroyed regional food security based on diverse cereals and replaced it with just wheat and rice; secondly, concentrated the production of these cereals in just two states – Punjab and Haryana; and thirdly, forced the farmer into the vicious treadmill of costly input (seeds, chemicals, water) intensive agriculture.
5
The Food Crisis and Regulatory Schizophrenia
A decade and more of corporate globalisation has devastated agriculture worldwide with the promise of cheap food. Yet the very forces and processes that have launched the globalisation project are taking food beyond people’s reach. Prices of food are rising worldwide. More than 33 countries have witnessed for riots.
India has had very high increases in prices of essential commodities. All kinds of reasons are being thrown around, including population growth. These are outrageous explanations. Prices have doubled over the past year, population has not. Population increase is clearly not the primary driver of high prices. Another explanation given by the Minister of Civil Aviation was that North Indians are eating more rice and South Indians are eating more wheat. This too does not square up as a reason for increase in food prices.
The uncontrollable rise in food prices is clearly an outcome of economic policies framed within the neo-liberal paradigm. The Government has intervened at every step to create corporate monopolies in the food system – from seed, to domestic production and trade, to food processing, to liberalized imports, to export oriented agriculture, to corporate retail. While Government intervention has unleashed forces driving up food prices, the government is now throwing up its hand and says it can do nothing to control prices. At the Global Agro-Industries Forum meeting on April 11, 2008 Prime Minister Manmohan Singh said a steep rise in food prices would make inflation control more difficult and might hurt macro-economic stability but he ruled out return to an era of blind control to check prices (Hindu, April 11, 2008). “We cannot react to such a situation by returning to an era of blind controls and by depressing agriculture terms of trade” is what the Prime Minister said (Business Standard,
Table 1.1
PER CAPITA FOOD GRAIN AVAILABILITY (KGS. PER YEAR)
Year Rice Wheat Other Cereals
Cereal Gram Pulses Food Grains
1951 58.0 24.0 40.0 122.0 8.2 22.1 144.11961 73.4 28.9 43.6 145.9 11.0 25.2 171.11971 70.3 37.8 44.3 152.4 7.3 18.7 171.11981 72.2 47.3 32.8 152.3 4.9 13.7 166.01991 80.9 60.0 29.2 171.0 4.9 15.2 186.21992 79.2 57.9 21.5 158.6 3.7 12.5 171.11993 73.4 51.2 31.6 156.2 3.9 13.2 169.41994 75.7 58.2 24.5 158.4 4.3 13.6 172.01995 80.3 63.0 23.7 167.0 5.4 13.8 180.81996 74.8 64.4 22.7 161.9 4.1 12.0 173.81997 78.5 65.7 26.7 170.9 4.5 13.6 184.51998 73.7 55.7 22.9 152.3 4.9 12.0 164.41999 75.0 59.8 23.4 158.2 5.4 13.5 171.72000 75.3 58.4 21.9 155.5 4.0 11.7 167.22001* 75.9 45.3 21.3 142.6 2.6 9.6 152.2
Notes:1. Per capita net availability given above is not strictly representative of the actual level of consumption in the
country, especially as they do not take into account any change in stocks in possession of traders, producers and consumers.
2. For Calculation of per capita Net availability the figures of Net Imports From 1981 to 1994 are based on Imports and exports on Govt. of India account only. Net Imports from 1995 onwards are, however, based on the total exports and Imports (both Government and Private accounts).
6
13.4.08). After having shaped an economy which is leading to high cost food for the poor, the Prime Minister has said he believes in running a “hands off economy”. This is putting the economy on autopilot for corporate control of food systems.
The Science & Technology Minister, Kapil Sibal said the Government had no role in the price rise and there was no magic wand to bring down prices, even though the government has repeatedly used the “magic wand” on behalf of corporations to drive up the food prices (Hindu, 13.4.08 and Indian Express 12.4.08). “Prices touch three year high, no magic wand says Government” (Hindustan Times, 12.4.08).
This is regulatory Schizophrenia. Government intervention is good desirable and necessary if it is on behalf of corporate profits, it is bad and undesirable if it is on of the food and nutrition rights of the poor and livelihoods rights of poor peasants.
There are nine factors driving food prices upwards.• The first is the integration of India’s food
economy with global commodity trade under pressure of WTO and the bilateral U.S – India Agriculture Agreement.The Government was importing wheat from
Cargill at more than $400/tonne, while it refuses to increase the MSP to farmers above Rs. 1000- tonnes on grounds that this will create inflation. Is inflation created by Rs. 1000/- domestic wheat or Rs. 16000/- imported wheat?
The Commerce Minister reduced import of edible oil duties to zero. And the Finance Minister announced import of one million tones of edible oil by Government to be sold with Rs. 15/litre subsidy. He also announced import of 1.5 million tones of pulses. This will further destabilise domestic production and further erode food security.
• The second is the integration of the food economy with the volatile, speculation based financial economy driven by agribusiness, hedge funds and investment banks.
• The third is a major diversion of land and food to produce industrial biofuels. India plans to put 11 million hectares under Jatropha for biodesel. The sugar industry is
all set to convert sugarcane to ethanol, which would mean another 4 million ha out of food production. And Tata’s has just set up a sweet sorghum based ethanol plant in Maharashtra. The Finance Minister, at the Washington meeting of World Bank/ IMF has said governments of rich countries should stop providing biofuels. He should also apply this prescription to himself and stop subsidizing jatropha cultivation on farms that grow paddy in Chattisgarh and grazing lands that provide fodder for livestock in Rajasthan.
• The fourth is climate extremes caused by climate change which has led to crop damage in Australia and Bundelkhand due to extended drought, and crop damage in Kerala’s rice bowl, Kuttanad with extensive rains. Twenty five percent of all greenhouse gases including N2O, CH4 and CO2 come from green revolution agriculture, which is being proposed as a solution to the food crisis in Africa. More CHG’s mean more drought. More drought means less food.
• The fifth is large scale diversion of food growing land to export oriented cash crops. 8 million hectares of area under food grains has been diverted to export crops under the trade liberalization policies. Agriculture export zones are part of a “control command economy” directing the farmers to give up food grain production and go in for export crops of vegetables, fruits and flowers. This is also part of the perceived division of labour under globalisation, where the rich North grows food staples for the South, and the South grows luxury products for the North.
In the early days of globalisation, the then Agriculture Secretary had said “Food Security is not food in the godowns but dollars in the pocket”. Tragically, the dollar is collapsing in the financial meltdown, and the food we were expected to buy is being diverted to produce biofuel to run cars. This model of food security no longer works.
We have witnessed what importing food is doing to our food security.
Imports are no longer affordable, and a model based on import dependency might be in the
7
interest of Cargill, or the U.S Government which has always used food as a weapon. It is definitely not in the interest of India’s food sovereignty, nor in the interest of the 70% of India already denied access to adequate food. • A sixth reason for price rise is the dismantling
of the universal PDS system which kept prices under control and its replacement by the targeted PDS which has failed to serve the poor or failed to bring down costs.
Food stamps is not a solution. It is a corporate recipe which denies farmers their livelihoods through their role as food producers and food providers. In any case, in the context of constantly rising prices, food stamps will only be pieces of paper, not food in hungry stomachs.
A seventh driver of price rise is the entry of giant corporations like Cargill, AWB, Conagro, ITC, Levers, in procurement through creation of private mandis by changing the APMC Acts and by opening up food retail to corporate giants like Reliance, Metro, Walmart as well as promoting industrial processing through the Food Safety Act. The Monoponistic conditions these big corporations create leads to a scarcity in the low cost open market economy based on small traders and small retailers.
Ironically, while the government is legalizing hoarding in private mandis and giant warehouses of giant corporations, it has unleashed a reign of terror gainst small traders in the name of preventing hoarding, using the food crisis to further dismantle India’s food democracy and food sovereignty, and further strengthen food monopolies. Food trade includes storage. Storage is not hoarding. Holding back supplies for speculation is. And that is what the private mandis are doing.
• The eighth driver of the food crisis is large-scale diversion of fertile farm land for Special Economic Zones and the constant refrain that farmers must be removed from the land for industrialization.
This government intervention on behalf of corporations must be reversed if India’s food security is to not be irreversibly compromised.
In a period of high cost food and looming food scarcity, the first priority must be protecting our farmers and our fertile soils.
• The ninth driver of the food crisis is a false model of “productivity” increase based on fossil fuels, high cost inputs, such as patented GMO seeds and chemical fertilizers. These industrial farming models use more energy than they produce as food, and they produce less food than biodiverse, eological farms. To overcome the food crisis, we need to maximize nutrition per acre while minimizing fossil fuel input. The green revolution and the second green revolution fail on both counts. They do not maximize nutrition output, and they are dependent on fossil fuels which are becoming more costly and also contributing to climate change which is threatening food security.
Unfortunately, the government is offering the disease as the cure. It is using the food crisis to further impose non-sustainable models on farmers which are trapping them in debt and denying them the potential to use their lands to produce healthy and nutritious crops.
As the Prime Minister stated, the rising food prices needs “a second green revolution” (creative solutions needed to combat current food crisis, Business Standard, 13.4.08). The second green revolution refers to genetically engineered seeds added to the green revolution package of intensive chemicals and water use.
Farmers suicides in the G.M Bt. Cotton belt, especially Vidharbha, shows that genetic engineering is not a “magic wand”, it is not a “creative” solution to the agrarian crisis or the food crisis. The creative solution is biodiverse ecological farming which is increasing food output while lowering costs of production.
The government must end its regulatory schizophrenia of making laws and policies to benefit corporate monopolies, and pretending it cannot intervene in the “market” of corporate monopolies which it has created and maintained through regulation and policy. The government needs to undo the harm it has done to farmers by driving them to suicide and to the poor by driving up food prices.
8
Force Feeding is not Free Trade
While Indians are eating less, India is definitely buying more soya and wheat on the international market as a result of forced imports. Imports have been forced on India by U.S agribusiness, aided by the pressure of WTO rules and U.S Government. These imports were not necessary because India was self sufficient in wheat and edible oils.
This is not “demand” from India, it is “dumping” bad food on India. In 1998, India was forced to import soya even though we had adequate edible oils. With nearly $200/tonne of subsidies these imports amounted to dumping. Millions of India’s coconut, mustard, sesame, linseed, groundnut farmers lost their market, their incomes and their livelihoods. And India’s healthy edible oils were replaced by unhealthy genetically engineered soya oil and palm oil, industrial oils that have not been eaten traditionally in any culture.
In 2005 India was forced to import wheat as part of the U.S – India agreement on agriculture even though India had 74 mt. of wheat production and there was no need for imports. These are forced imports, designed to destroy domestic production to create markets for U.S agribusiness. This is force-feeding not free trade. The U.S wheat was declared unfit for eating but the U.S arm-twisted India to dilute health standards to import bad wheat. The U.S has always used food as a weapon. If Mr. Bush had had his way, he would have totally destroyed India’s food security systems. India currently grows 76 million tones of Wheat, while our domestic demand is 72 million tonnes. We grow 96 million tonnes of rice, and have a domestic demand of 91 million tonnes. It is this self-sufficiency and self-reliance in food that U.S policies aim at destroying. Destruction of domestic production worldwide can only result in food scarcity and food insecurity and when food moves into the hands of global agribusiness who see profits through price fixing and speculation, a food emergency is inevitable.
We are seeing the serious consequences of the forced integration of the worlds food systems into a global commodity economy through the market access rules of “free trade” system controlled by agribusiness. The rules of the Agreement of
Agriculture (AoA) of the WTO were drafted by Cargill. The rules of the Trade Related Intellectual Property Rights Agreement (TRIPS) of WTO were drafted by Monsanto and other global corporations. The perturbations this is causing in local food systems are serious. Production everywhere is getting destabilized by speculative trade, creating both an absolute decline in local food production capacity and a relative decline in the entitlement of the poor because of the rising food prices.
The absolute decline in food production arises from three factors. Firstly, the transformation of ecological biodiverse systems to chemical monocultures which produce more commodities but less food and nutrition for the household and for local economies.
Secondly, the shift from food crops to cash crops for exports.
Thirdly, the vulnerabilities created by climate change to which industrial farming and globalised food systems make a significant contribution.
The relative decline in food availability is due to destruction of livelihoods and rising food prices.
Food security requires a strengthening of local and domestic food economies, the defense of rural livelihoods and small farmers, and the reigning in of the global grain giants and their price fixing. We need an anti trust action against the agribusiness corporations which are at the heart of the current food crisis.
GMO’s are a Problem for Food Security, not a Solution
There is also increasing reference to new seeds and GMO’s as a solution to the food crisis. When the FAO organized an Emergency Summit at the peak of the food crisis in 2008, chemical fertilizers and GMO’s were offered as a solution. The Bush initiated U.S – India Agriculture Agreement focuses on biotechnology. On its board sit Monsanto, Walmart and Archer-Daniel-Midlands. However GMO’s are part of the food crisis. Bt. Cotton has destroyed food production in India and has pushed farmers to suicide. Cotton used to be grown as an intercrop with food crops. Now it is a monoculture. And with high costs of
9
production and low prices of produce, farmers are trapped in debt and hunger. In any case, GMOs do not produce more food. There are only two traits commercialized in twenty years – herbicide resistant crops, and bt. toxin crops. Neither is a yield trait. In fact research shows a yield drag in GM crops. And in India we see high risks of crop failure with average yields of Bt. Cotton at 300 – 400 kg / acre not the 1500 kg/acre advertised by Monsanto.
The present crisis is in part a consequence of transforming biodiverse systems to monocultures of globally traded commodities, leaving less food for farming families and local food economies, while increasing trade in commodities. However, commodities get transformed to feed and fuel, creating an absolute shrinkage in food availability. Unless food sovereignty is put back in the equation, the crisis will continue to deepen. One myth responsible for spreading the food crisis is the myth that industrial, chemical agriculture produces more food. Industrial monocultures produce more commodities, not more food or nutrition. This is good for Cargill, ADM and Conagra. It is bad for farmers, the poor and the planet.
Food Sovereignty is the answer to the Food Emergency
The current food emergency is a result of half a century of farming non-sustainably and one and a half decades of trading unfairly in food. The United Nations had called an emergency meeting in early June in 2008 to address the food emergency. Even the World Bank called for an urgent response.
Will the response intensify non-sustainability and injustice, or will the global community use the crisis to strengthen sustainability, justice and fairness?
There are already signals that global agribusiness which has created the crisis; both historically and currently, will use it to increase its stranglehold on the world food system. Lowering import duties has been one response of Governments to deal with rising food prices. But lowering import duties encourages destruction of domestic markets and domestic production, thus aggravating the agrarian crisis, pushing more farmers into poverty, and leading to overall decline of food production. The crisis of rising food prices is a direct result of countries being forced by World Bank, WTO and regional and bilateral agreements to import food from U.S agribusiness they did not need. Mexico was forced to import corn. India has been forced to import soya oil and wheat.
The World Bank’s call to increase contributions to the World Food Programme by $500 million and President Bush’s call to Congress to add $770 million in food aid could become another subsidy to Cargill and ADM, if the procurement is not based on creating fair markets for farmers at the local and regional level. Emergency food aid cannot correct the distortions, unfairness and non-sustainability of the food system as it is currently organised. The rules of trade need changing and the paradigm of food production needs changing.
The globalised system under corporate control is a guaranteed recipe for food disasters and food famines. We can either stop the damage through food democracy and rebuild food sovereignty by strengthening local economies and sustainable agriculture or the corporate powers that have created the emergency will use it to deepen and expand their profits and control while billions are condemned to starvation and death, and while they use political leaders like Bush to give a false spin on the causes of the food crisis.
10
In the Bal Adhikar Samvad convention held on December 19, 2007 at New Delhi, Nobel prize
laureate and eminent welfare economist Prof Amartya Sen said “It is now clearly established reality that even after gaining high growth rate and increasing per capita income, we have failed to protect our children from hunger and diseases. I feel the question of resources is not the biggest one, a lot of money is being spent but the situation is not improving in accordance with the expenditure because our delivery systems are worst, unaccountable and non-responsive towards the most marginalized like children”. And in response Vice-Chairman of Planning Commission of India, Montek Singh Ahluwalia acknowledged the facts pointed out by Amartya Sen and said that there is need to change the system and develop the sense of responsibility towards children. (Central Chronicle, 2007)
India has creditable achievements to trumpet on a number of counts. These include high rates of economic growth lasting over a decade, reduction in infant mortality rates and increase in life expectancy at birth. But her position in terms of taking proper care of her children, is however, nothing to write home about. Actually, India has the highest proportion of undernourished children in the world along with Nepal, Ethiopia and Bangladesh. The number of Indian children below the age of three who are underweight is a mind-boggling, 37 million children below the age of three are underweight. This is despite official claims that the well-being of children has been a priority and an integral part of the country’s development planning since 1951.
Planners, implementers and academics all agree that the prevalence of malnutrition seriously
obstructs economic growth. Dozens of global studies testify that children’s malnutrition upsets their life long productivity, disease resistance and cognitive abilities. For low-income countries, the annual cost of mal nutrition is 3-4 percent of their GDP, cautions an ADB-UNICEF study of seven Asian nations including India. With 47 percent of its below-five population malnourished, India tops the ignominious global chart of underweight children. (Mudgal, 2007)
According to UNICEF, Malnutrition limits development and capacity to learn. It also costs lives, about 50% of all childhood deaths are attributed to malnutrition. A nutritious diet is a fundamental need of the human body and this must not be ignored when formulating poverty line.
A recent study of malnourished children in India is of the view that without a major shake up in policy and an improvement in the effectiveness of its implementation, the attainment of the Millinium Development Goal (MDGs) in this regard by India looks extremely unlikely.
Children need extra care because they are our supreme assets as the children of today form the human resource of tomorrow. This is all the more so because the role of the human element is becoming more and more crucial in this age, which has witnessed sky-rocketing progress in robotics and electronic convergence. The provision of adequate facilities for children to realize their full potential in both mental and physical development is therefore the least that the world can do to assure not only a good present but also a good future for its people. Hence, it is hardly surprising that one of the millennium development goals (MDGs), agreed
CHAPTER – 2
India: The Emerging Capital of Hunger in the “Emerging Economic Superpower”
11
upon by countries of the world is to reduce the proportion of underweight children by half by the year 2015. (Nair 2007)
In NSSO (Report No. 405). The minimum (threshold) food-energy requirement was taken as 1,800 kcal/person/day for rural households and 1,575 kcal for the urban households. It represented 75 per cent of the recommended values, 2,400 kcal/person/day for rural and 2,100 kcal/person/day for urban. An intake below this threshold was considered not sufficient for maintaining health and body weight and carrying out light physical activity. The threshold level of food-protein intake was taken as 48 g/person/day for an average Indian. The households consuming below this level were treated as malnourished. The threshold level for fat was taken as 16 g/person/day. (Kumar et al 2007)
Adequate Nutrition : A Basic Need and Fundamental Right
An Indian Council of Medical Research (ICMR) book on dietary guidelines for Indians specifies: “The body needs energy (calories are the primary source of this) for maintaining body temperature, metabolic activity, supporting growth and physical work. Proteins provide amino acids for the synthesis of body. In the adult, dietary protein is essential to synthesise new proteins.
Fat is a concentrated source of energy.. and also helps in the absorption of beta-carotene and other fat-soluble vitamins. Minerals that are important in human nutrition are calcium, phosphorous and magnesium and the electrolytes, sodium and potassium Iron is important because iron deficiency anaemia is widespread in our country, the prevalence varying from 45% in male adults to 70% or more in women or children. Vitamins are accessory food factors, which carry out diverse functions in the body.”
Out of all the nutritional requirements mentioned above, the present poverty line only fulfils the minimum protein requirement of 50 gm per day. This is mainly because 75% of total protein is derived from cereals. However, to ensure adequate consumption of all the essential nutrients, a FOOD basket should be formulated that includes a minimum diet of cereals, pulses, oils, vegetables, fruits, etc. Thereafter, the cost of this diet should be calculated and included when constructing the poverty line. This will ensure that if someone is above this renewed poverty line, he or she will have the capability to consume a nutritious diet.
Even in Chandigarh more than half of the school going children have been found to be seriously undernourished. The distressing figures, are driven by rising levels of junk food and packaged snack. In a comprehensive
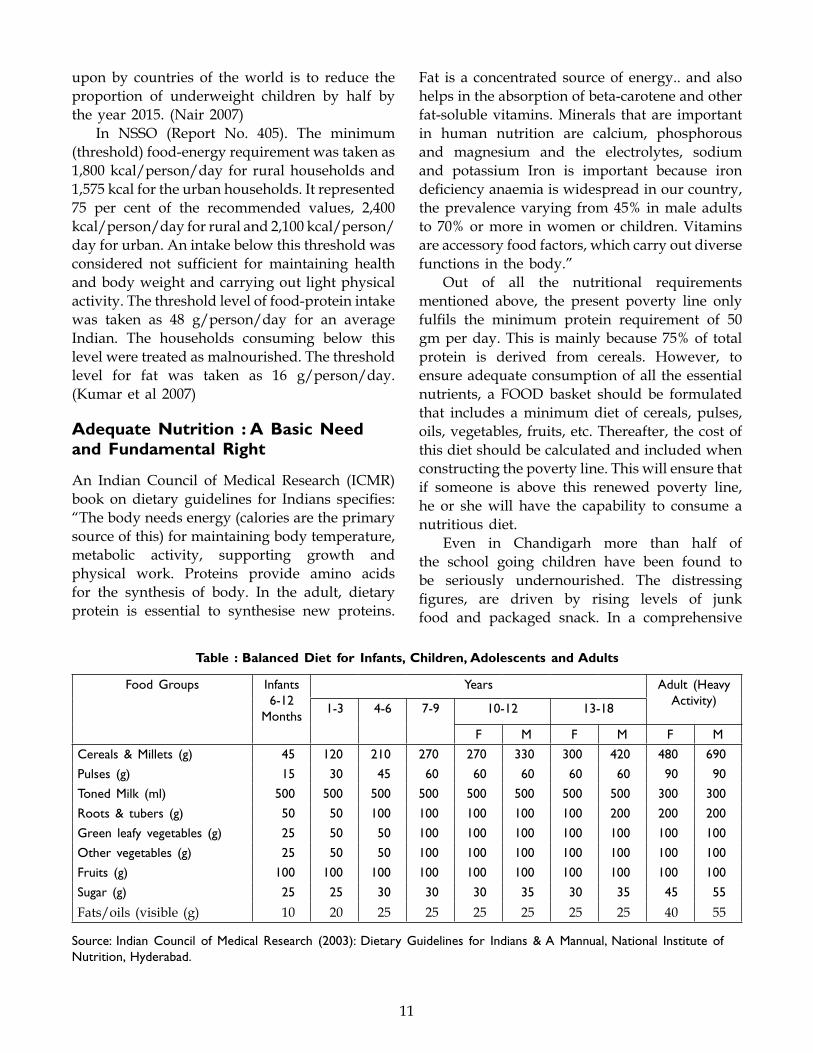
Table : Balanced Diet for Infants, Children, Adolescents and Adults
Food Groups Infants 6-12
Months
Years Adult (Heavy Activity)
1-3 4-6 7-9 10-12 13-18
F M F M F M
Cereals & Millets (g) 45 120 210 270 270 330 300 420 480 690
Pulses (g) 15 30 45 60 60 60 60 60 90 90
Toned Milk (ml) 500 500 500 500 500 500 500 500 300 300
Roots & tubers (g) 50 50 100 100 100 100 100 200 200 200
Green leafy vegetables (g) 25 50 50 100 100 100 100 100 100 100
Other vegetables (g) 25 50 50 100 100 100 100 100 100 100
Fruits (g) 100 100 100 100 100 100 100 100 100 100
Sugar (g) 25 25 30 30 30 35 30 35 45 55
Fats/oils (visible (g) 10 20 25 25 25 25 25 25 40 55
Source: Indian Council of Medical Research (2003): Dietary Guidelines for Indians & A Mannual, National Institute of Nutrition, Hyderabad.
12
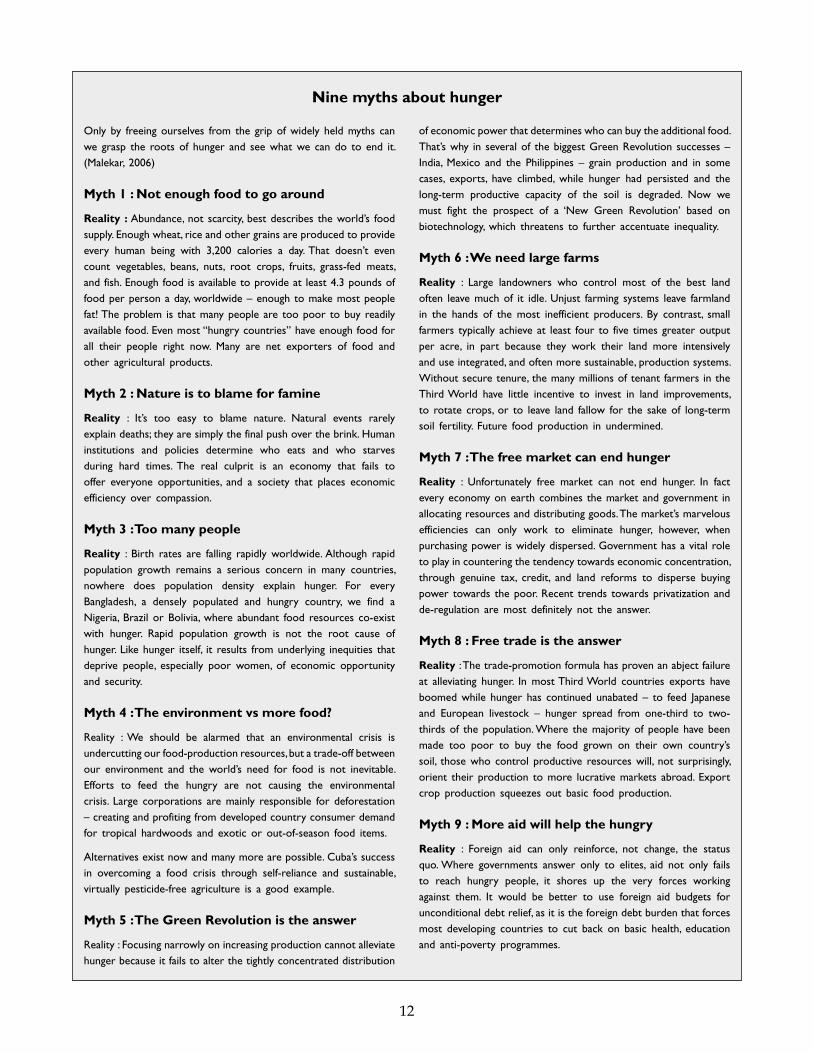
Only by freeing ourselves from the grip of widely held myths can we grasp the roots of hunger and see what we can do to end it. (Malekar, 2006)
Myth 1 : Not enough food to go around
Reality : Abundance, not scarcity, best describes the world’s food supply. Enough wheat, rice and other grains are produced to provide every human being with 3,200 calories a day. That doesn’t even count vegetables, beans, nuts, root crops, fruits, grass-fed meats, and fish. Enough food is available to provide at least 4.3 pounds of food per person a day, worldwide – enough to make most people fat! The problem is that many people are too poor to buy readily available food. Even most “hungry countries” have enough food for all their people right now. Many are net exporters of food and other agricultural products.
Myth 2 : Nature is to blame for famine
Reality : It’s too easy to blame nature. Natural events rarely explain deaths; they are simply the final push over the brink. Human institutions and policies determine who eats and who starves during hard times. The real culprit is an economy that fails to offer everyone opportunities, and a society that places economic efficiency over compassion.
Myth 3 : Too many people
Reality : Birth rates are falling rapidly worldwide. Although rapid population growth remains a serious concern in many countries, nowhere does population density explain hunger. For every Bangladesh, a densely populated and hungry country, we find a Nigeria, Brazil or Bolivia, where abundant food resources co-exist with hunger. Rapid population growth is not the root cause of hunger. Like hunger itself, it results from underlying inequities that deprive people, especially poor women, of economic opportunity and security.
Myth 4 : The environment vs more food?
Reality : We should be alarmed that an environmental crisis is undercutting our food-production resources, but a trade-off between our environment and the world’s need for food is not inevitable. Efforts to feed the hungry are not causing the environmental crisis. Large corporations are mainly responsible for deforestation – creating and profiting from developed country consumer demand for tropical hardwoods and exotic or out-of-season food items.
Alternatives exist now and many more are possible. Cuba’s success in overcoming a food crisis through self-reliance and sustainable, virtually pesticide-free agriculture is a good example.
Myth 5 : The Green Revolution is the answer
Reality : Focusing narrowly on increasing production cannot alleviate hunger because it fails to alter the tightly concentrated distribution
of economic power that determines who can buy the additional food. That’s why in several of the biggest Green Revolution successes – India, Mexico and the Philippines – grain production and in some cases, exports, have climbed, while hunger had persisted and the long-term productive capacity of the soil is degraded. Now we must fight the prospect of a ‘New Green Revolution’ based on biotechnology, which threatens to further accentuate inequality.
Myth 6 : We need large farms
Reality : Large landowners who control most of the best land often leave much of it idle. Unjust farming systems leave farmland in the hands of the most inefficient producers. By contrast, small farmers typically achieve at least four to five times greater output per acre, in part because they work their land more intensively and use integrated, and often more sustainable, production systems. Without secure tenure, the many millions of tenant farmers in the Third World have little incentive to invest in land improvements, to rotate crops, or to leave land fallow for the sake of long-term soil fertility. Future food production in undermined.
Myth 7 : The free market can end hunger
Reality : Unfortunately free market can not end hunger. In fact every economy on earth combines the market and government in allocating resources and distributing goods. The market’s marvelous efficiencies can only work to eliminate hunger, however, when purchasing power is widely dispersed. Government has a vital role to play in countering the tendency towards economic concentration, through genuine tax, credit, and land reforms to disperse buying power towards the poor. Recent trends towards privatization and de-regulation are most definitely not the answer.
Myth 8 : Free trade is the answer
Reality : The trade-promotion formula has proven an abject failure at alleviating hunger. In most Third World countries exports have boomed while hunger has continued unabated – to feed Japanese and European livestock – hunger spread from one-third to two-thirds of the population. Where the majority of people have been made too poor to buy the food grown on their own country’s soil, those who control productive resources will, not surprisingly, orient their production to more lucrative markets abroad. Export crop production squeezes out basic food production.
Myth 9 : More aid will help the hungry
Reality : Foreign aid can only reinforce, not change, the status quo. Where governments answer only to elites, aid not only fails to reach hungry people, it shores up the very forces working against them. It would be better to use foreign aid budgets for unconditional debt relief, as it is the foreign debt burden that forces most developing countries to cut back on basic health, education and anti-poverty programmes.
Nine myths about hunger
13
medical survey of nearly 10,000 children across 35 schools located in both rural and urban belts of Chandigarh, an alarming 56 percent of urban children and over 62 percent of rural children displayed district signs of undernourishment. Anaemia has assumed almost epidemic proportions afflicting 39 percent urban and 21 percent rural children. (Jolly, 2007)
Even in this day and age, around one in four Indians is malnourished. The consequences of such a plight are devastating, as nutrition is the most important need of a human being after water. Presently, 47% of Indian children below the age of 5 are underweight for their age. UNICEF reports that one in every three malnourished children in the world is in India.
However, it is not as if the government is not in the know about the importance of balanced nutrition because the National Institute of Nutrition (NIN) under the aegis of the ICMR itself recommends what it considers is a nutritious diet for healthy living. The NIN has also published a balanced diet for Indians, reproduced in the table alongside.
In fact, the apathy of the government is quite evident from the fact that despite having sponsored detailed studies on nutrition in India, it still adopts a norm that only sees poverty in terms of calories. (Guruswamy and Abraham, 2006)
According to the World Food Programme, nearly 50 per cent of the world’s hungry live in India. About 35 per cent of India’s population – over 350 million – is food-insecure, consuming less than 80 per cent of the minimum energy requirement. Nearly nine out of 10 pregnant women between 15 and 49 years are malnourished and anaemic. Anaemia in pregnant women causes 20 per cent of infant mortality. Of every 1,000 babies born, 67 die before the age of one. (Hindustan Times, 2006)
Who are the Hungry?
Hunger may be long-term, or it may be transitory. Long-term hunger is pervasive among people caught in the trap of poverty. Although not all poor people are hungry, almost all hungry people are poor. The great majority – 75 percent – of the chronically underfed live in rural areas
of developing countries. They are landless, frequently unemployed or employed at very low wages. Or they are farmers with small land holdings and limited access to other assets, credit and agricultural necessities such as fertilizers and crop protection. They are orphans and other individuals without families. They are usually invisible to decision makers in the societies where they reside, and the term “silent hunger” describes their condition poignantly.
Transitory hunger caused by natural or human-made disasters such as droughts, floods, earthquakes, conflicts or bad policies tends not to be silent. Most of us have seen haunting images of the starvation that occurs during such famines. And the world has demonstrated its generosity in helping the victims of transitory hunger, although they represent only a small part – roughly 10 percent – of the world’s hungry. Like the chronically hungry, they are usually found in rural areas. (Andersen and Cheng 2007)
Hunger, unbalanced energy intake and vitamin and mineral deficiency account for more than half the world’s disease burden. (FAO)
Where are the underweight Children?
Total (in millions) : 146
• 57 India• 8 Bangladesh• 8 Pakistan• 7 China• 6 Nigeria• 6 Ethiopia• 6 Indonesia• 48 Rest of world
(Andersen and Cheng, 2007)
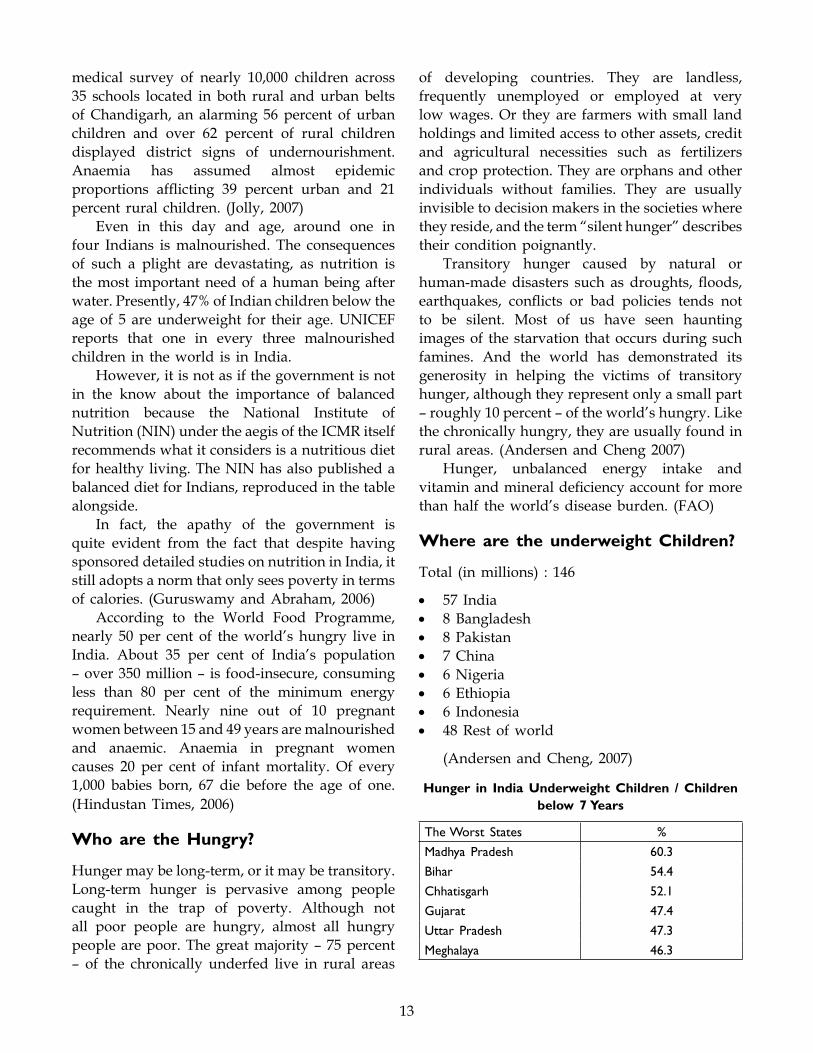
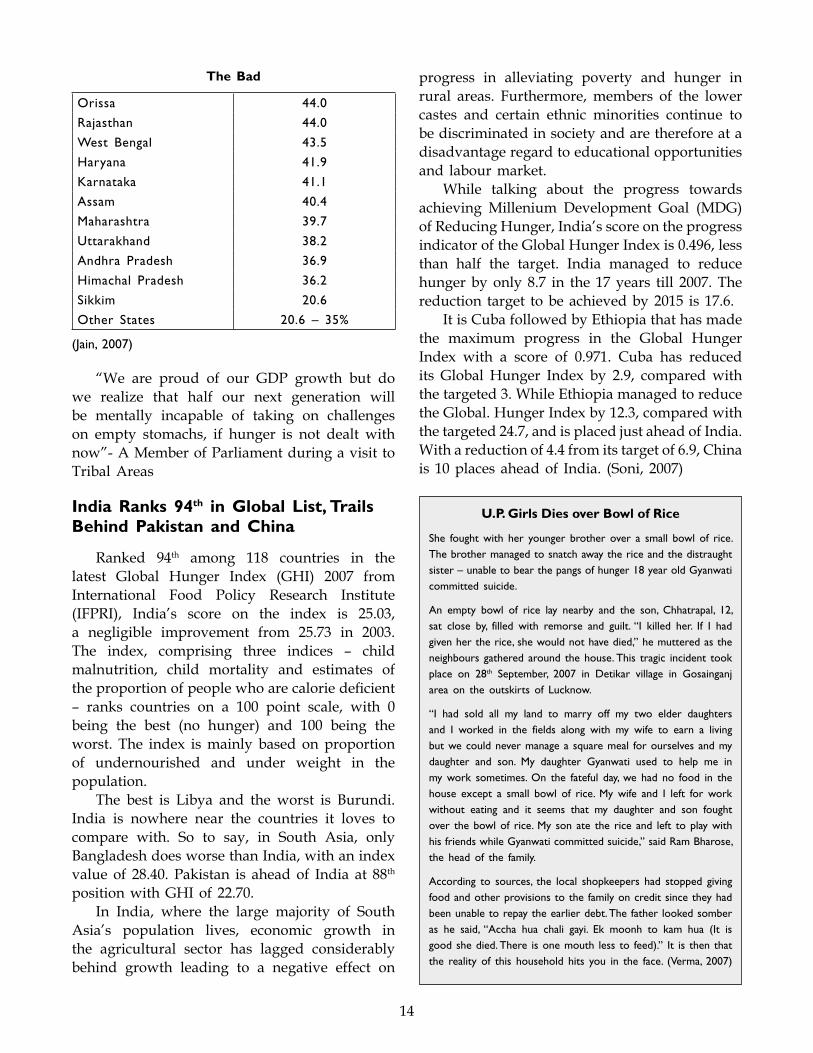
Hunger in India Underweight Children / Children below 7 Years
The Worst States %
Madhya Pradesh 60.3
Bihar 54.4
Chhatisgarh 52.1
Gujarat 47.4
Uttar Pradesh 47.3
Meghalaya 46.3
14
The Bad
Orissa 44.0
Rajasthan 44.0
West Bengal 43.5
Haryana 41.9
Karnataka 41.1
Assam 40.4
Maharashtra 39.7
Uttarakhand 38.2
Andhra Pradesh 36.9
Himachal Pradesh 36.2
Sikkim 20.6
Other States 20.6 – 35%
(Jain, 2007)
“We are proud of our GDP growth but do we realize that half our next generation will be mentally incapable of taking on challenges on empty stomachs, if hunger is not dealt with now”- A Member of Parliament during a visit to Tribal Areas
India Ranks 94th in Global List, Trails Behind Pakistan and China
Ranked 94th among 118 countries in the latest Global Hunger Index (GHI) 2007 from International Food Policy Research Institute (IFPRI), India’s score on the index is 25.03, a negligible improvement from 25.73 in 2003. The index, comprising three indices – child malnutrition, child mortality and estimates of the proportion of people who are calorie deficient – ranks countries on a 100 point scale, with 0 being the best (no hunger) and 100 being the worst. The index is mainly based on proportion of undernourished and under weight in the population.
The best is Libya and the worst is Burundi. India is nowhere near the countries it loves to compare with. So to say, in South Asia, only Bangladesh does worse than India, with an index value of 28.40. Pakistan is ahead of India at 88th position with GHI of 22.70.
In India, where the large majority of South Asia’s population lives, economic growth in the agricultural sector has lagged considerably behind growth leading to a negative effect on
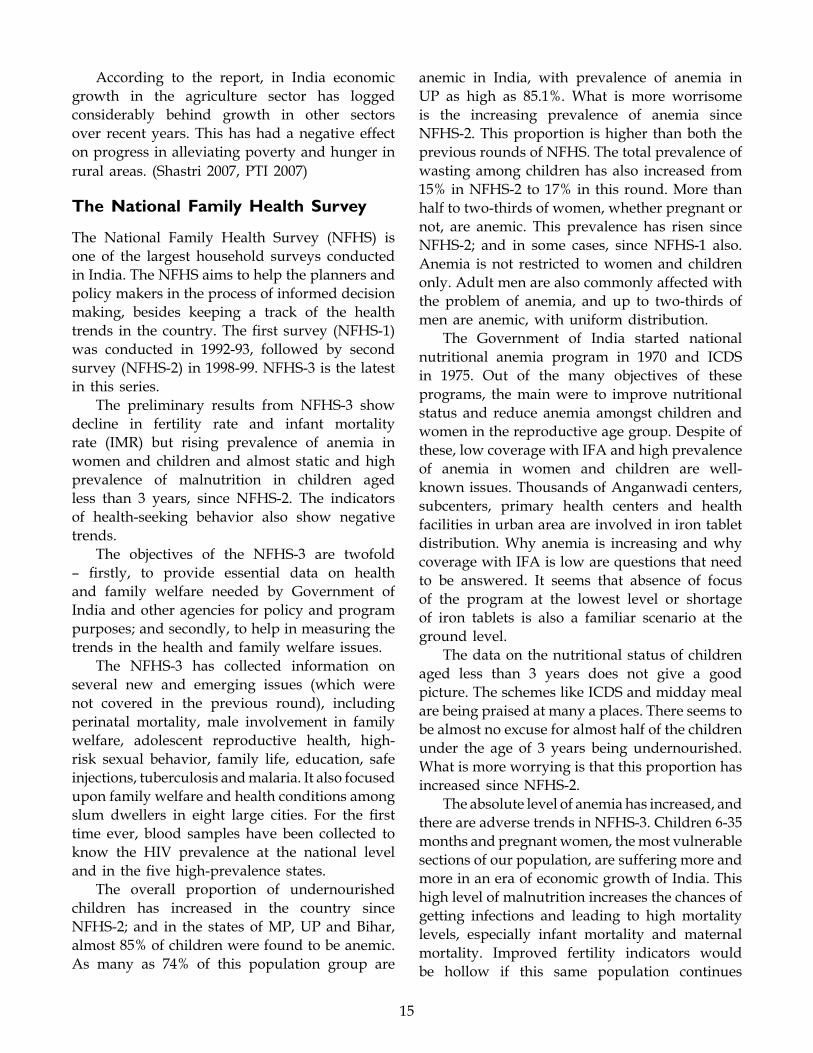
U.P. Girls Dies over Bowl of Rice
She fought with her younger brother over a small bowl of rice. The brother managed to snatch away the rice and the distraught sister – unable to bear the pangs of hunger 18 year old Gyanwati committed suicide.
An empty bowl of rice lay nearby and the son, Chhatrapal, 12, sat close by, filled with remorse and guilt. “I killed her. If I had given her the rice, she would not have died,” he muttered as the neighbours gathered around the house. This tragic incident took place on 28th September, 2007 in Detikar village in Gosainganj area on the outskirts of Lucknow.
“I had sold all my land to marry off my two elder daughters and I worked in the fields along with my wife to earn a living but we could never manage a square meal for ourselves and my daughter and son. My daughter Gyanwati used to help me in my work sometimes. On the fateful day, we had no food in the house except a small bowl of rice. My wife and I left for work without eating and it seems that my daughter and son fought over the bowl of rice. My son ate the rice and left to play with his friends while Gyanwati committed suicide,” said Ram Bharose, the head of the family.
According to sources, the local shopkeepers had stopped giving food and other provisions to the family on credit since they had been unable to repay the earlier debt. The father looked somber as he said, “Accha hua chali gayi. Ek moonh to kam hua (It is good she died. There is one mouth less to feed).” It is then that the reality of this household hits you in the face. (Verma, 2007)
progress in alleviating poverty and hunger in rural areas. Furthermore, members of the lower castes and certain ethnic minorities continue to be discriminated in society and are therefore at a disadvantage regard to educational opportunities and labour market.
While talking about the progress towards achieving Millenium Development Goal (MDG) of Reducing Hunger, India’s score on the progress indicator of the Global Hunger Index is 0.496, less than half the target. India managed to reduce hunger by only 8.7 in the 17 years till 2007. The reduction target to be achieved by 2015 is 17.6.
It is Cuba followed by Ethiopia that has made the maximum progress in the Global Hunger Index with a score of 0.971. Cuba has reduced its Global Hunger Index by 2.9, compared with the targeted 3. While Ethiopia managed to reduce the Global. Hunger Index by 12.3, compared with the targeted 24.7, and is placed just ahead of India. With a reduction of 4.4 from its target of 6.9, China is 10 places ahead of India. (Soni, 2007)
15
According to the report, in India economic growth in the agriculture sector has logged considerably behind growth in other sectors over recent years. This has had a negative effect on progress in alleviating poverty and hunger in rural areas. (Shastri 2007, PTI 2007)
The National Family Health Survey
The National Family Health Survey (NFHS) is one of the largest household surveys conducted in India. The NFHS aims to help the planners and policy makers in the process of informed decision making, besides keeping a track of the health trends in the country. The first survey (NFHS-1) was conducted in 1992-93, followed by second survey (NFHS-2) in 1998-99. NFHS-3 is the latest in this series.
The preliminary results from NFHS-3 show decline in fertility rate and infant mortality rate (IMR) but rising prevalence of anemia in women and children and almost static and high prevalence of malnutrition in children aged less than 3 years, since NFHS-2. The indicators of health-seeking behavior also show negative trends.
The objectives of the NFHS-3 are twofold – firstly, to provide essential data on health and family welfare needed by Government of India and other agencies for policy and program purposes; and secondly, to help in measuring the trends in the health and family welfare issues.
The NFHS-3 has collected information on several new and emerging issues (which were not covered in the previous round), including perinatal mortality, male involvement in family welfare, adolescent reproductive health, high-risk sexual behavior, family life, education, safe injections, tuberculosis and malaria. It also focused upon family welfare and health conditions among slum dwellers in eight large cities. For the first time ever, blood samples have been collected to know the HIV prevalence at the national level and in the five high-prevalence states.
The overall proportion of undernourished children has increased in the country since NFHS-2; and in the states of MP, UP and Bihar, almost 85% of children were found to be anemic. As many as 74% of this population group are
anemic in India, with prevalence of anemia in UP as high as 85.1%. What is more worrisome is the increasing prevalence of anemia since NFHS-2. This proportion is higher than both the previous rounds of NFHS. The total prevalence of wasting among children has also increased from 15% in NFHS-2 to 17% in this round. More than half to two-thirds of women, whether pregnant or not, are anemic. This prevalence has risen since NFHS-2; and in some cases, since NFHS-1 also. Anemia is not restricted to women and children only. Adult men are also commonly affected with the problem of anemia, and up to two-thirds of men are anemic, with uniform distribution.
The Government of India started national nutritional anemia program in 1970 and ICDS in 1975. Out of the many objectives of these programs, the main were to improve nutritional status and reduce anemia amongst children and women in the reproductive age group. Despite of these, low coverage with IFA and high prevalence of anemia in women and children are well-known issues. Thousands of Anganwadi centers, subcenters, primary health centers and health facilities in urban area are involved in iron tablet distribution. Why anemia is increasing and why coverage with IFA is low are questions that need to be answered. It seems that absence of focus of the program at the lowest level or shortage of iron tablets is also a familiar scenario at the ground level.
The data on the nutritional status of children aged less than 3 years does not give a good picture. The schemes like ICDS and midday meal are being praised at many a places. There seems to be almost no excuse for almost half of the children under the age of 3 years being undernourished. What is more worrying is that this proportion has increased since NFHS-2.
The absolute level of anemia has increased, and there are adverse trends in NFHS-3. Children 6-35 months and pregnant women, the most vulnerable sections of our population, are suffering more and more in an era of economic growth of India. This high level of malnutrition increases the chances of getting infections and leading to high mortality levels, especially infant mortality and maternal mortality. Improved fertility indicators would be hollow if this same population continues
16
to be anemic and malnourished. The infant mortality rate (IMR) continues to remain higher than it should. It is as high as 100 per 1,000 live births in Chhattisgarh and although Punjab has an IMR of 42 and Maharashtra of 38, both below the national average of 66, they are still some way from the target set by the National Population Policy (2000) of achieving an IMR of 30 by 2010. (Sharma, 2006)
Similarly, the percentage of children below three who are underweight is disturbing; for instance Madhya Pradesh with 60 percent, Bihar with 58 percent, Jharkhand with 59 percent and Chhatisgarh 52 percent. In several of these states, the proportion of underweight children actually increased between 1996-97 and 2005-06. In Bihar, it went up from 54 to 58 percent. In Jharkhand from 54 to 59 percent. (Ghosh, 2007)
The more surprising fact is that such degeneration was not confined to the poorer and more backward States, but happened even in some of the more prosperous States. Thus, in Gujarat, which is one of the richest States and has shown one of the highest rates of economic growth over this period, the proportion of underweight children increased from 45 to 47 per cent.
Health problems relating to prosperity, such as obesity, are also noticed now and ironically, women are more affected by obesity as well as undernourishment than men. In Punjab, for instance, 38 per cent of the women are obese as compared to 30 per cent of men. Similarly, in Gujarat 20 per cent of women are obese compared to 15 per cent men.
The percentage of children between six and 35 months who are anemic has also increased in Gujarat from 75 per cent in NFHS-2 to 80 per cent today and in Orissa from 72 t 74 per cent. In Punjab it is 80 per cent and remains unchanged. It is the highest in Chhattisgarh at 81 per cent. (Sharma, 2006)
In some states like Assam, Andhra Pradesh, Gujarat, Karnataka, Kerala and Rajasthan substantial increase of over 10 per cent points indicate the drastic fall in nutritional intake. A quarter of adult men too had lower than normal Body Mass Index (BMI) a ratio of weight to height
– a measure of nutritional availability. (Time of India, 2006)
Even such a big survey does not provide district-wise data (because the sample size does not permit generalizing at the district level); this is one great weakness. India’s incredible diversity makes district data an absolute necessity to get at reality. At a time when decentralization has become a buzzword, state level data have limited value. The district level data may be useful for planning and also for monitoring and assessing the impact of numerous developmental programs at the local level. The Union Ministry of health and Family Welfare had started such useful district level surveys, initially called reproductive and child health (RCH) surveys and now called district level household surveys (DLHS), in the year 2002. The data generated by these surveys are far more useful than NFHS data, but these are hardly discussed and used. The state-level data are good and give a large picture of the states. What is equally required is the district-level health information so that necessary action may be taken at the right place. The DLHS should be done in the inter-NFHS period to make NFHS data more useful. These surveys can be a difficult and massive exercise. Initially, this exercise may be restricted to poorly performing states as per NFHS.
Malnutrition and anemia are two major health problems in the country. Fourteen years have elapsed since the National Nutrition Policy was formed, but the specific targets of this policy have definitely not been met and the scenario is the same. The National Health Policy still does not have any indicators on anemia. It is not that both the policies should have indicators on anemia and nutrition, but it is about having a mechanism for achieving a common goal through coordination, which does not seem to exist.
The findings of NFHS-3 point out that there has been almost no improvement in the health status of women and children in India for the last 15 years, and in some cases their condition has even deteriorated. The most probable reason is that the results of these successive surveys are not being utilized for the stated objective of taking corrective measures in the programs. The NFHS-3 should act as a trigger for a new beginning.
17
The dependence on the private health sector continues to be quite high. According to the survey. “The private medical sector remains the primary source of the health care for the majority of households in both urban (70 percent) and rural areas (63 percent). Overall, the private medical sector dominates health care delivery in the country and the use of private doctors and private clinics is the primary source of health care among the rich and poor alike (Rajalakshmi, 2007).
And surprisingly with all the shocking performance, Madhya Pradesh government received a certificate of appreciation for achieving Millinium Development Goals. (Jain, 2007)
But by destroying the means of livelihood, displacing people living and depending on Jungles, inviting multinational companies in agriculture and there by rendering farm labour and farmers landless and as a result increasing pressure on cities, how can the Millinium Development Goal be achieved.
18
Food security has been identified as a key area for policy and programme intervention
within the overall focus on poverty alleviation, gender equity and sustainable development. Food security would be meaningful in terms of adequate production and distribution of food to all both during normal times and in times of crisis.
According to a well-researched article captioned, ‘Feasting and Fasting’, written by Prof. Utsa Patnaik of the JNU, the following picture of food security in India emerges : (Mishra 2007)
• per capita absorption of food in 1950=152 kg;
• per capita absorption of food in 1991=178 kg;• per capita absorption of food in 2002–03 = 155
kg;• in 2000-01 an average Indian family of
four members was absorbing 93 kg less of foodgrains;
• the fall is unprecedented entailing a fall in the average daily intake of 64 gms per head or a fall in calorie intake by 2050 calories from foodgrains;
• there is unprecedented decline in purchasing power in the rural areas;
• there is a difference of nearly 20 kg per head between output, availability and absorption of foodgrains;
• this difference goes by way of net addition to stocks held at increasing cost and into exports;
• eight million hectares of foodgrains growing land has been diverted to exportable crops between 1991 and 2001;
• the yield has not risen enough to compensate leading to a sharp decline of the annual output of growth;
• about seven per cent of rural households and three per cent urban households do not have access to two square meals a day; several of them go to bed hungry every night;
• over 47 per cent of the children in the 0-6 age group are victims of acute malnutrition;
• the overall situation is one of sharp and mindboggling contrast inasmuch as the average per capita income is rising but the average foodgrains availability and absorption is declining.
Prof. Patnaik puts the question to the policy formulators: ‘How can we talk of decline in rural poverty when there is decline in purchasing power, falling per head grain intake and a rise in the absolute and relative numbers in nutritional deficit?’
The National Sample Survey Organization of the Government of India published a report entitled “Perceived Adequacy of Food Consumption in Indian Households 2004-2005”. This is based on NSS 61st Round, July 2004-June 2005. This report has made some damaging disclosures regarding non-availability of food to the rural households throughout the year in various States of the country. It has made a very short and pithy analysis of the food availability status of different States.
It has observed: “The percentage of rural household not getting enough food every day in some months of the year was the highest in West Bengal (10.6 per cent) followed by Orissa (4.8 per cent) and the least affected by food inadequacy were Haryana and Rajasthan. The proportion of those households who did not get enough food every day in any month of the year was highest in the State of Assam (3.6 per cent) followed by Orissa and West Bengal (1.3 per cent each).” If we get the
CHAPTER – 3
Declining Food Availability, Increasing Food Insecurity
19
two figures together – of food inadequacy in some months of the year and every day in every month of the year – West Bengal’s will be the highest with 12 per cent of the rural households facing occasional or continuous hunger and starvation followed by acute morbidity and mortality. The comparable figures of the other two poor States of India, that is to say, Assam and Orissa are six per cent and seven per cent respectively. (Bandyopadhya, 2007)
When large numbers of people die of starvation, it occasionally captures the media’s attention and there is transient public outrage. Government officials in every part of the country then hotly deny the existence of chronic hunger and deaths due to starvation. They claim that the deaths result from illness; some even quibble that people were just chronically malnourished, but not starving.
The invisibility of starvation and destitution in the debates about food security derives in part from the problematic and narrow definition of starvation. Few people die directly and exclusively of starvation. They live with severe food deficits for long periods, and tend to succumb to diseases that they would have survived if they were well nourished. The government does not recognize these as conditions of starvation and insists that the deaths were caused by the proximate precipitating factor of infection. (Mander, 2006)
Indian as well as international agencies typically do not keep records of the numbers of people living with or dying of starvation. The same denial underlines the work of official research agencies. India’s government agencies at both the central and state levels seem to have trouble seeing the massive hunger that characterizes the country. Highly technical research on nutrients often avoids facing the problem, which is deeply political, not technical. There is no hope of solving the problem of hunger if the India State refuses to see the acute distress.
We have to extrapolate from data to assess the extent of hunger in India. UNICEF estimates that in the year 2000, about 2,420,000 children in India died before reaching the age of five. It estimates that about half of these deaths of children under five are associated with malnutrition. We can thus estimate that more than a million children
die in India each year from causes associated with malnutrition.
The number of adults who live and die under conditions of starvation is relatively unknown. The Planning Commission estimates that 8% of Indians do not get two adequate meals a day and in some pockets severe under-nutrition takes a toll. One estimate says that more than 200 million people go hungry and about 50 million are on the brink of starvation. The Food Insecurity Atlas of Urban India published by the M S Swaminathan Research Foundation and the World Food Programme, found that average urban calorie intake is lower than average rural calorie intake has marginally declined in rural and urban areas in the last three decades.
Many micro-studies confirm the persistence of intra-family inequities; women not only eat the least and last, but in situations of absolute household food insecurity they may not eat at all.
This means not just a feminization of poverty, but also of hunger. Women bear a disproportionately large part of the cruel burden of hunger. This is particularly ironical because women play a major role in ensuring the food security of their households by procuring, storing and cooking food not just for children but also for all members of the family. Their capacity to fulfil this role is hampered by other responsibilities, such as collecting fuel and water, which in turn has implications for household food insecurity.
The importance of women’s status for child nutrition in developing countries; have shown that more income in the hands of women tends to lead to higher nutrition for children. However, women who are themselves trapped in poor nutrition and health have to secure the nutrition and health of their families, which they frequently do at the cost of their own health and nutrition.
Between the early-1990s when economic reforms began, and the present, taking three-year averages, the annual absorption of foodgrain per head has come down from 177 kg to 155 kg. Such low absorption levels were last seen in the initial years of World War II – from where they had fallen further still. This steep and unprecedented fall in foodgrain absorption has entailed a sharp increase in the number of people in hunger,
20
particularly in rural areas, and for very many it has meant starvation. A large segment of the rural masses in India with a much lower foodgrain absorption than the average, has already been reduced to the nutritional status of sub-Saharan Africa (SSA).
The 50 years of a dying colonial rule before Independence had seen a decline of annual foodgrain availability per head by a quarter, from 199 kg to 148.5 kg. The war years included the terrible Bengal famine with a mortality of at least 3 million. Although the proximate cause of the famine was the inflationary burden of financing the war which was unjustly placed on India, the actual toll in the Bengal famine would not have been so large without the preceding three decades of declining nutrition in Bengal which had seen a much larger than average drop in per capita foodgrain availability, by nearly 40% between 1911 and 1947. (Patnaik, 2006)
Many who had seen the Bengal famine before their eyes, and in particular P Mahalanobis, had an important role in formulating post-Independence
policy: the goal of attaining food security, at least in the limited sense of foodgrain self-sufficiency, was given priority, and we saw a rise, albeit a painfully slow one, in foodgrain availability per head from 152 kg during 1950-55 to 177 kg by 1989-91. while the new agricultural strategy and Green Revolution no doubt had many drawbacks as regards sustainability of production equity of distribution, the average rise in per head output of rice and wheat and availability was a major achievement which should not be under-rated.
But 40 years of effort have been lost in the last decade of neo-liberal economic reforms, with over four-fifths of the loss taking place in 1998-2003 alone.
The reasons for declining rural mass effective demand from the 1990s onwards are many, and are all connected with deflationary neo-liberal reforms combined with trade liberalization. First, public rural development expenditures which averaged 14.5% of GDP during 1985-90, before reforms, were reduced to 8% of GDP by the early-‘90s as part of the deflationary policies advised
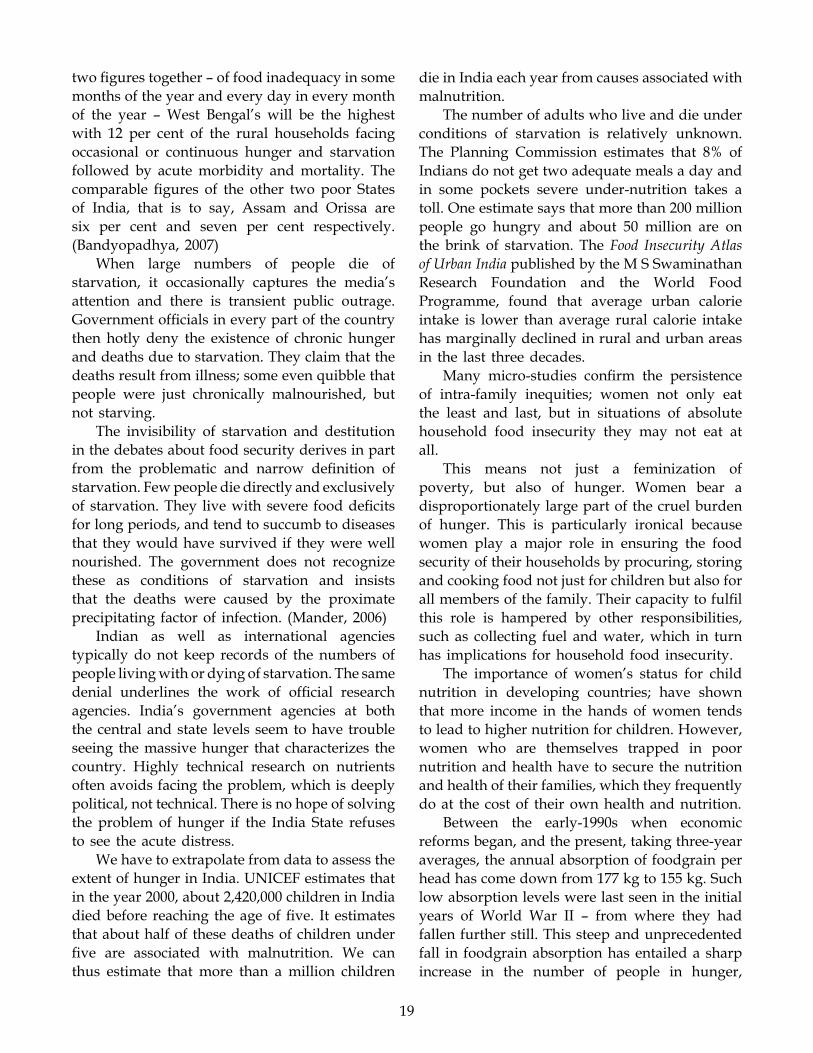
Table 3.1
Per Thousand Distribution of Households by availability of two Square Meals a Day in a year
Members of Households getting two square meals a day
State Through out the Year
Only some Months of the Year
Not getting through out the
Year
Not getting Col 2 + 3
Andhra Pradesh 966.00 17.00 12.00 29.00
Assam 901.00 61.00 30.00 91.00
Bihar 928.00 51.00 15.00 66.00
Gujarat 976.00 9.00 4.00 13.00
Haryana 992.00 8.00 0.00 8.00
Karnataka 960.00 27.00 8.00 35.00
Kerala 910.00 74.00 4.00 78.00
Madhya Pradesh 970.00 25.00 3.00 28.00
Maharashtra 954.00 41.00 4.00 45.00
Orissa 844.00 149.00 5.00 154.00
Punjab 999.00 1.00 0.00 1.00
Rajasthan 985.00 6.00 0.00 6.00
Tamil Nadu 969.00 15.00 9.00 24.00
Uttar Pradesh 963.00 29.00 5.00 34.00
West Bengal 856.00 111.00 30.00 141.00
All India 945.00 42.00 9.00 51.00
(M.S.S.R.F., 2004)
21
by the Bretton Woods Institutions (BWI). Since 1998 they have been reduced further, averaging less than 6% of GDP and in some years failing to less than 5%. In real terms there has been a reduction of about Rs 30,000 crore annually in development expenditure on average compared to the pre-reform period.
At the very same time that unemployment was growing and real earnings of the rural masses falling owing to deflationary policies, the government, years before it was required to do so under the WTO, bending to the pressures of advanced countries, removed all quantitative restrictions on trade by April 2001 and exposed our farmers to unfair trade.
As shown in Table 3.1 at an average about 945 out of 1000 person get two square a meal in a year. Orissa is reported to have minimum number of people receiving two squares a meal through out the year.
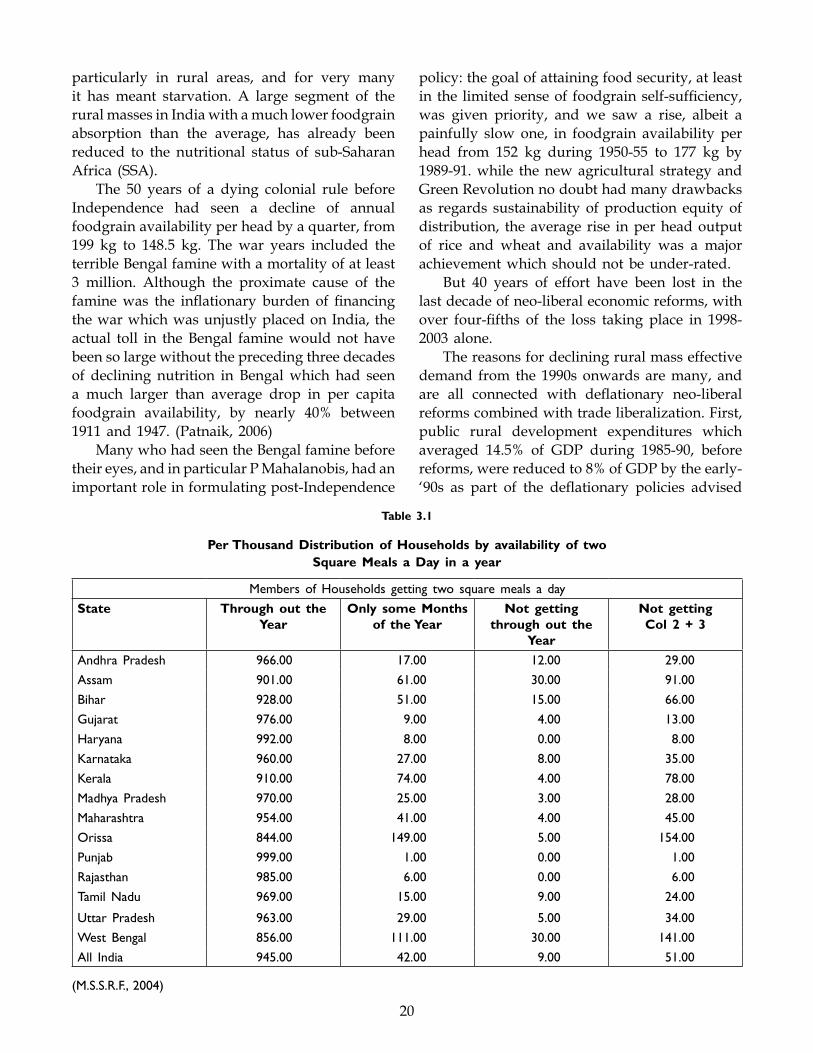
According to a study by M.S. Swaminathan Research Foundation, there are 16 persons per thousand reporting zero meal in rural India in a year. (Table 3.2)
Table 3.2
Number of Persons Consuming Zero Meals
State No. of Persons Reporting Zero Meals Per 1000 Persons All Classes
Andhra Pradesh 12.00
Assam 9.00
Bihar 11.00
Gujarat 18.00
Haryana 19.00
Himachal Pradesh 17.00
Karnataka 12.00
Kerala 6.00
Madhya Pradesh 19.00
Maharashtra 17.00
Orissa 14.00
Punjab 11.00
Rajasthan 18.00
Tamil Nadu 13.00
Utter Pradesh 23.00
West Bengal 14.00
All India 16.00
(M.S.S.R.F., 2004)
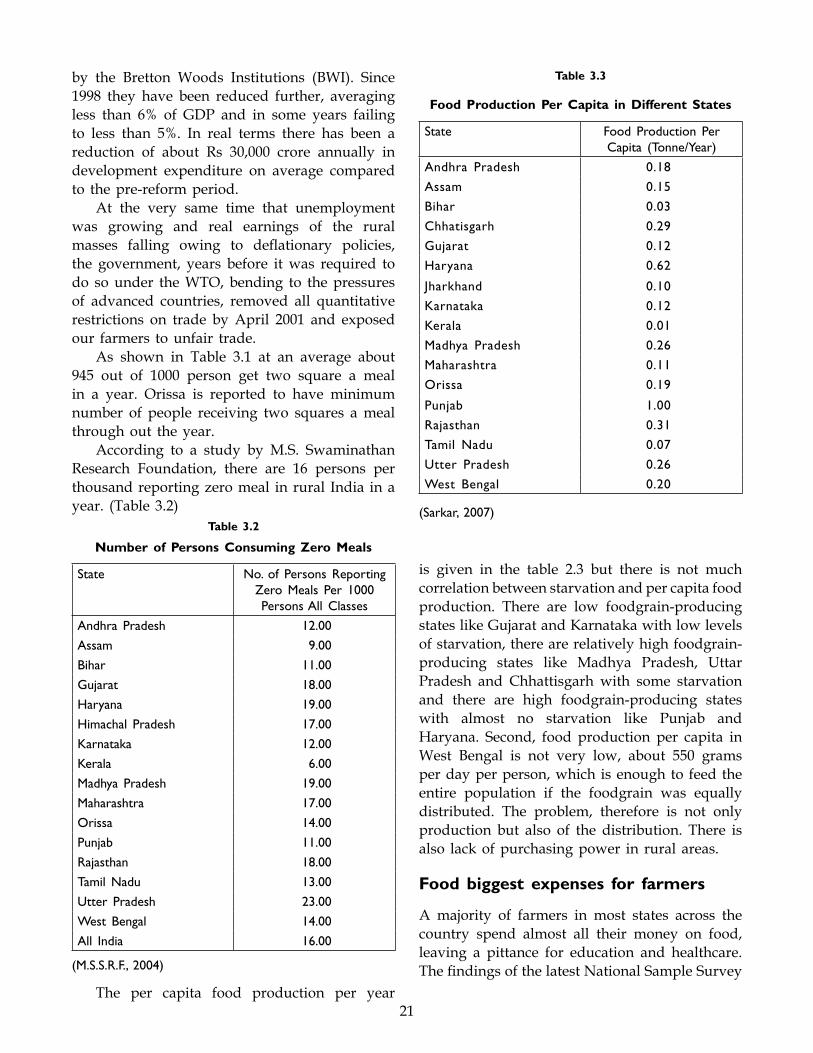
The per capita food production per year
is given in the table 2.3 but there is not much correlation between starvation and per capita food production. There are low foodgrain-producing states like Gujarat and Karnataka with low levels of starvation, there are relatively high foodgrain-producing states like Madhya Pradesh, Uttar Pradesh and Chhattisgarh with some starvation and there are high foodgrain-producing states with almost no starvation like Punjab and Haryana. Second, food production per capita in West Bengal is not very low, about 550 grams per day per person, which is enough to feed the entire population if the foodgrain was equally distributed. The problem, therefore is not only production but also of the distribution. There is also lack of purchasing power in rural areas.
Food biggest expenses for farmers
A majority of farmers in most states across the country spend almost all their money on food, leaving a pittance for education and healthcare. The findings of the latest National Sample Survey
Table 3.3
Food Production Per Capita in Different States
State Food Production Per Capita (Tonne/Year)
Andhra Pradesh 0.18
Assam 0.15
Bihar 0.03
Chhatisgarh 0.29
Gujarat 0.12
Haryana 0.62
Jharkhand 0.10
Karnataka 0.12
Kerala 0.01
Madhya Pradesh 0.26
Maharashtra 0.11
Orissa 0.19
Punjab 1.00
Rajasthan 0.31
Tamil Nadu 0.07
Utter Pradesh 0.26
West Bengal 0.20
(Sarkar, 2007)
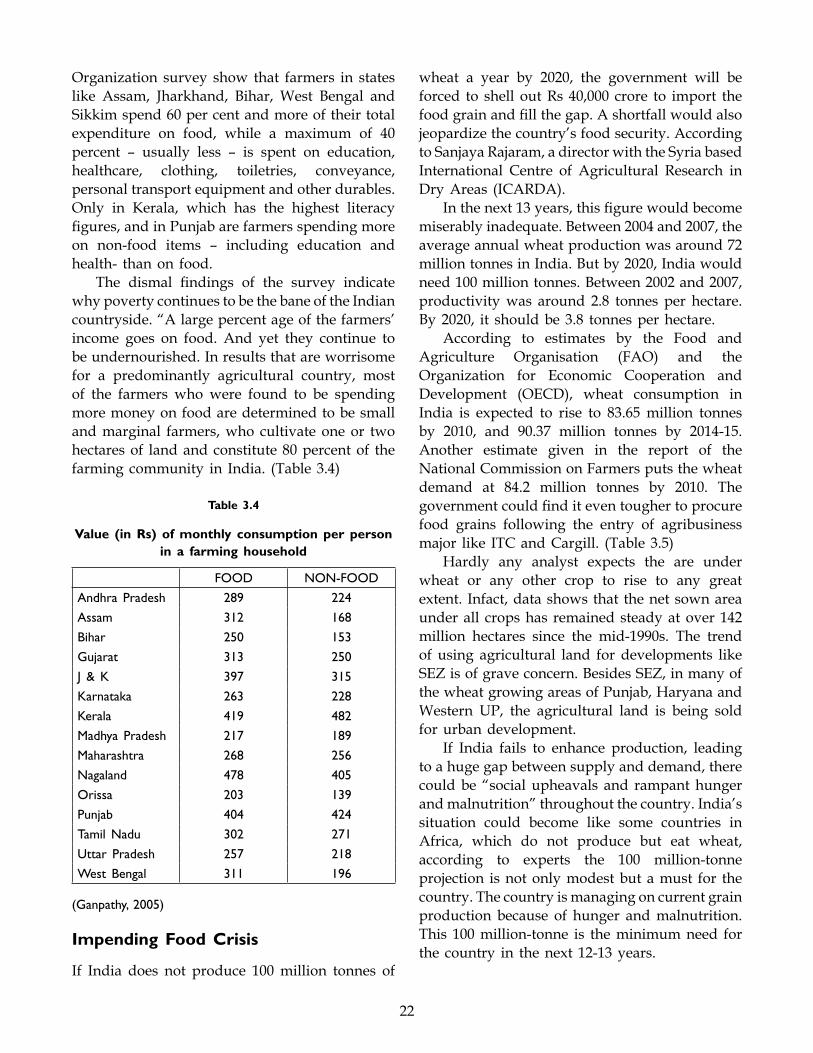
22
Organization survey show that farmers in states like Assam, Jharkhand, Bihar, West Bengal and Sikkim spend 60 per cent and more of their total expenditure on food, while a maximum of 40 percent – usually less – is spent on education, healthcare, clothing, toiletries, conveyance, personal transport equipment and other durables. Only in Kerala, which has the highest literacy figures, and in Punjab are farmers spending more on non-food items – including education and health- than on food.
The dismal findings of the survey indicate why poverty continues to be the bane of the Indian countryside. “A large percent age of the farmers’ income goes on food. And yet they continue to be undernourished. In results that are worrisome for a predominantly agricultural country, most of the farmers who were found to be spending more money on food are determined to be small and marginal farmers, who cultivate one or two hectares of land and constitute 80 percent of the farming community in India. (Table 3.4)
Table 3.4
Value (in Rs) of monthly consumption per person in a farming household
FOOD NON-FOOD
Andhra Pradesh 289 224
Assam 312 168
Bihar 250 153
Gujarat 313 250
J & K 397 315
Karnataka 263 228
Kerala 419 482
Madhya Pradesh 217 189
Maharashtra 268 256
Nagaland 478 405
Orissa 203 139
Punjab 404 424
Tamil Nadu 302 271
Uttar Pradesh 257 218
West Bengal 311 196
(Ganpathy, 2005)
Impending Food Crisis
If India does not produce 100 million tonnes of
wheat a year by 2020, the government will be forced to shell out Rs 40,000 crore to import the food grain and fill the gap. A shortfall would also jeopardize the country’s food security. According to Sanjaya Rajaram, a director with the Syria based International Centre of Agricultural Research in Dry Areas (ICARDA).
In the next 13 years, this figure would become miserably inadequate. Between 2004 and 2007, the average annual wheat production was around 72 million tonnes in India. But by 2020, India would need 100 million tonnes. Between 2002 and 2007, productivity was around 2.8 tonnes per hectare. By 2020, it should be 3.8 tonnes per hectare.
According to estimates by the Food and Agriculture Organisation (FAO) and the Organization for Economic Cooperation and Development (OECD), wheat consumption in India is expected to rise to 83.65 million tonnes by 2010, and 90.37 million tonnes by 2014-15. Another estimate given in the report of the National Commission on Farmers puts the wheat demand at 84.2 million tonnes by 2010. The government could find it even tougher to procure food grains following the entry of agribusiness major like ITC and Cargill. (Table 3.5)
Hardly any analyst expects the are under wheat or any other crop to rise to any great extent. Infact, data shows that the net sown area under all crops has remained steady at over 142 million hectares since the mid-1990s. The trend of using agricultural land for developments like SEZ is of grave concern. Besides SEZ, in many of the wheat growing areas of Punjab, Haryana and Western UP, the agricultural land is being sold for urban development.
If India fails to enhance production, leading to a huge gap between supply and demand, there could be “social upheavals and rampant hunger and malnutrition” throughout the country. India’s situation could become like some countries in Africa, which do not produce but eat wheat, according to experts the 100 million-tonne projection is not only modest but a must for the country. The country is managing on current grain production because of hunger and malnutrition. This 100 million-tonne is the minimum need for the country in the next 12-13 years.
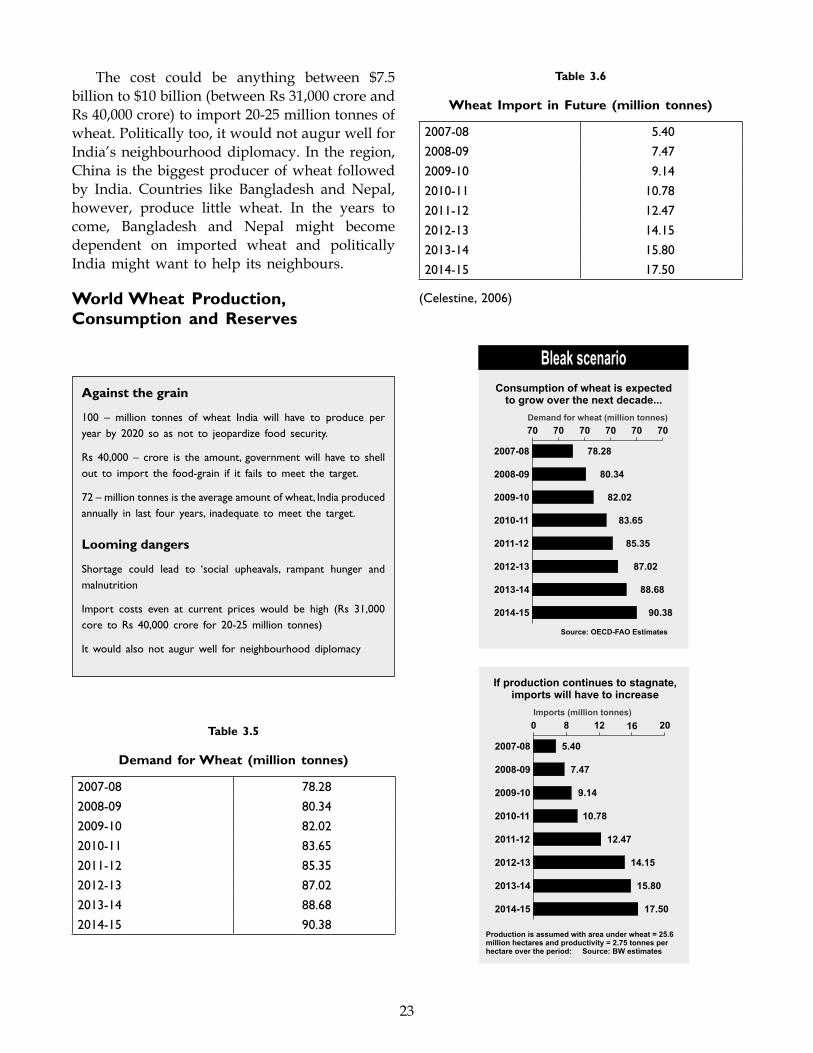
23
The cost could be anything between $7.5 billion to $10 billion (between Rs 31,000 crore and Rs 40,000 crore) to import 20-25 million tonnes of wheat. Politically too, it would not augur well for India’s neighbourhood diplomacy. In the region, China is the biggest producer of wheat followed by India. Countries like Bangladesh and Nepal, however, produce little wheat. In the years to come, Bangladesh and Nepal might become dependent on imported wheat and politically India might want to help its neighbours.
World Wheat Production, Consumption and Reserves
Against the grain
100 – million tonnes of wheat India will have to produce per year by 2020 so as not to jeopardize food security.
Rs 40,000 – crore is the amount, government will have to shell out to import the food-grain if it fails to meet the target.
72 – million tonnes is the average amount of wheat, India produced annually in last four years, inadequate to meet the target.
Looming dangers
Shortage could lead to ‘social upheavals, rampant hunger and malnutrition
Import costs even at current prices would be high (Rs 31,000 core to Rs 40,000 crore for 20-25 million tonnes)
It would also not augur well for neighbourhood diplomacy
Table 3.5
Demand for Wheat (million tonnes)
2007-08 78.28
2008-09 80.34
2009-10 82.02
2010-11 83.65
2011-12 85.35
2012-13 87.02
2013-14 88.68
2014-15 90.38
Table 3.6
Wheat Import in Future (million tonnes)
2007-08 5.40
2008-09 7.47
2009-10 9.14
2010-11 10.78
2011-12 12.47
2012-13 14.15
2013-14 15.80
2014-15 17.50
(Celestine, 2006)
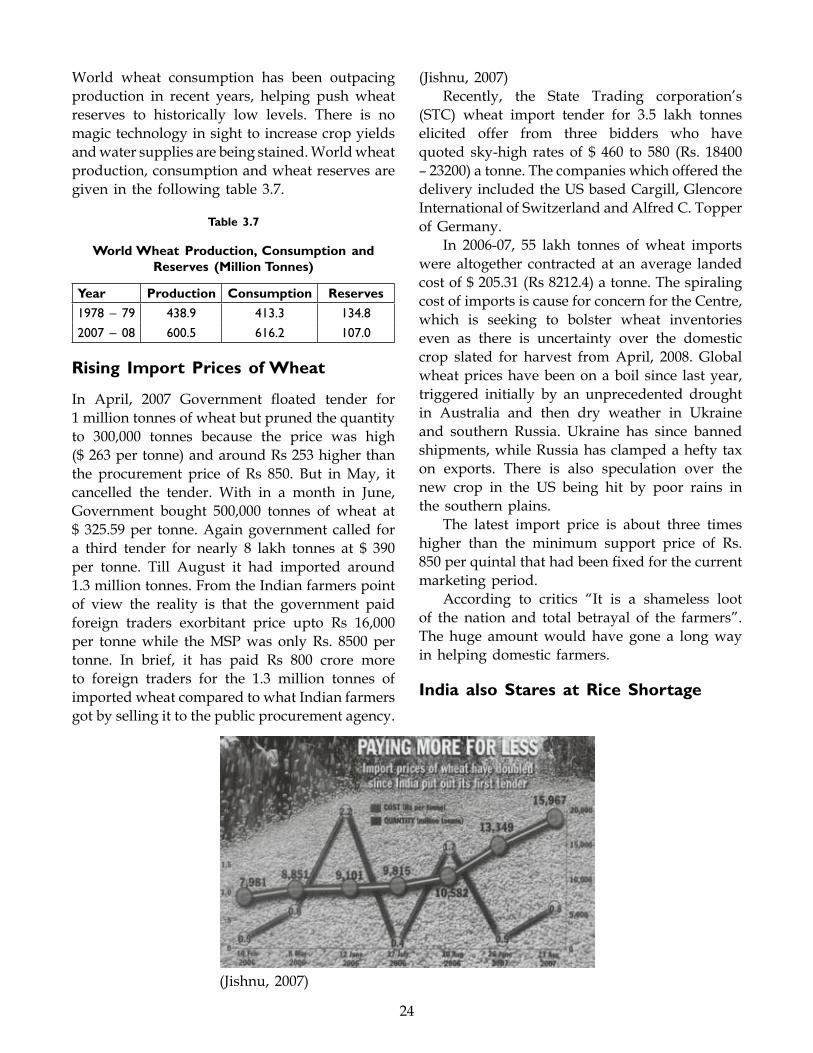
24
World wheat consumption has been outpacing production in recent years, helping push wheat reserves to historically low levels. There is no magic technology in sight to increase crop yields and water supplies are being stained. World wheat production, consumption and wheat reserves are given in the following table 3.7.
Table 3.7
World Wheat Production, Consumption and Reserves (Million Tonnes)
Year Production Consumption Reserves
1978 – 79 438.9 413.3 134.8
2007 – 08 600.5 616.2 107.0
Rising Import Prices of Wheat
In April, 2007 Government floated tender for 1 million tonnes of wheat but pruned the quantity to 300,000 tonnes because the price was high ($ 263 per tonne) and around Rs 253 higher than the procurement price of Rs 850. But in May, it cancelled the tender. With in a month in June, Government bought 500,000 tonnes of wheat at $ 325.59 per tonne. Again government called for a third tender for nearly 8 lakh tonnes at $ 390 per tonne. Till August it had imported around 1.3 million tonnes. From the Indian farmers point of view the reality is that the government paid foreign traders exorbitant price upto Rs 16,000 per tonne while the MSP was only Rs. 8500 per tonne. In brief, it has paid Rs 800 crore more to foreign traders for the 1.3 million tonnes of imported wheat compared to what Indian farmers got by selling it to the public procurement agency.
(Jishnu, 2007)Recently, the State Trading corporation’s
(STC) wheat import tender for 3.5 lakh tonnes elicited offer from three bidders who have quoted sky-high rates of $ 460 to 580 (Rs. 18400 – 23200) a tonne. The companies which offered the delivery included the US based Cargill, Glencore International of Switzerland and Alfred C. Topper of Germany.
In 2006-07, 55 lakh tonnes of wheat imports were altogether contracted at an average landed cost of $ 205.31 (Rs 8212.4) a tonne. The spiraling cost of imports is cause for concern for the Centre, which is seeking to bolster wheat inventories even as there is uncertainty over the domestic crop slated for harvest from April, 2008. Global wheat prices have been on a boil since last year, triggered initially by an unprecedented drought in Australia and then dry weather in Ukraine and southern Russia. Ukraine has since banned shipments, while Russia has clamped a hefty tax on exports. There is also speculation over the new crop in the US being hit by poor rains in the southern plains.
The latest import price is about three times higher than the minimum support price of Rs. 850 per quintal that had been fixed for the current marketing period.
According to critics “It is a shameless loot of the nation and total betrayal of the farmers”. The huge amount would have gone a long way in helping domestic farmers.
India also Stares at Rice Shortage
(Jishnu, 2007)
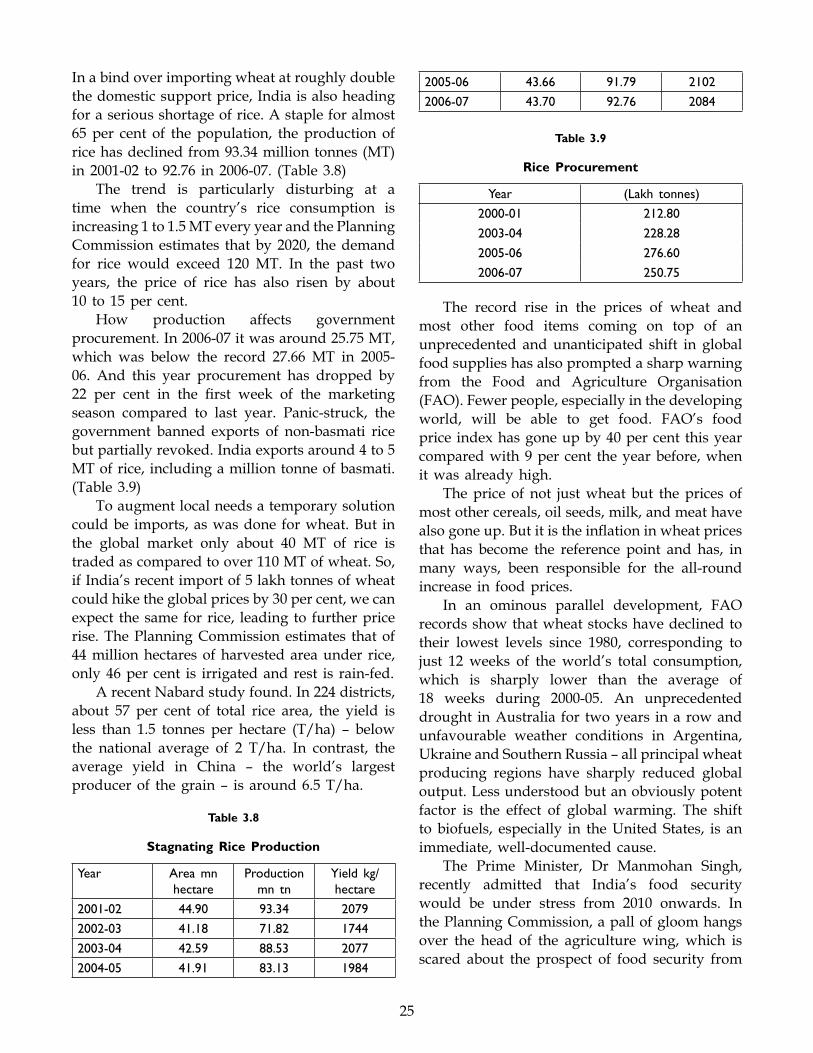
25
In a bind over importing wheat at roughly double the domestic support price, India is also heading for a serious shortage of rice. A staple for almost 65 per cent of the population, the production of rice has declined from 93.34 million tonnes (MT) in 2001-02 to 92.76 in 2006-07. (Table 3.8)
The trend is particularly disturbing at a time when the country’s rice consumption is increasing 1 to 1.5 MT every year and the Planning Commission estimates that by 2020, the demand for rice would exceed 120 MT. In the past two years, the price of rice has also risen by about 10 to 15 per cent.
How production affects government procurement. In 2006-07 it was around 25.75 MT, which was below the record 27.66 MT in 2005-06. And this year procurement has dropped by 22 per cent in the first week of the marketing season compared to last year. Panic-struck, the government banned exports of non-basmati rice but partially revoked. India exports around 4 to 5 MT of rice, including a million tonne of basmati. (Table 3.9)
To augment local needs a temporary solution could be imports, as was done for wheat. But in the global market only about 40 MT of rice is traded as compared to over 110 MT of wheat. So, if India’s recent import of 5 lakh tonnes of wheat could hike the global prices by 30 per cent, we can expect the same for rice, leading to further price rise. The Planning Commission estimates that of 44 million hectares of harvested area under rice, only 46 per cent is irrigated and rest is rain-fed.
A recent Nabard study found. In 224 districts, about 57 per cent of total rice area, the yield is less than 1.5 tonnes per hectare (T/ha) – below the national average of 2 T/ha. In contrast, the average yield in China – the world’s largest producer of the grain – is around 6.5 T/ha.
Table 3.8
Stagnating Rice Production
Year Area mn hectare
Production mn tn
Yield kg/hectare
2001-02 44.90 93.34 2079
2002-03 41.18 71.82 1744
2003-04 42.59 88.53 2077
2004-05 41.91 83.13 1984
2005-06 43.66 91.79 2102
2006-07 43.70 92.76 2084
Table 3.9
Rice Procurement
Year (Lakh tonnes)
2000-01 212.80
2003-04 228.28
2005-06 276.60
2006-07 250.75
The record rise in the prices of wheat and most other food items coming on top of an unprecedented and unanticipated shift in global food supplies has also prompted a sharp warning from the Food and Agriculture Organisation (FAO). Fewer people, especially in the developing world, will be able to get food. FAO’s food price index has gone up by 40 per cent this year compared with 9 per cent the year before, when it was already high.
The price of not just wheat but the prices of most other cereals, oil seeds, milk, and meat have also gone up. But it is the inflation in wheat prices that has become the reference point and has, in many ways, been responsible for the all-round increase in food prices.
In an ominous parallel development, FAO records show that wheat stocks have declined to their lowest levels since 1980, corresponding to just 12 weeks of the world’s total consumption, which is sharply lower than the average of 18 weeks during 2000-05. An unprecedented drought in Australia for two years in a row and unfavourable weather conditions in Argentina, Ukraine and Southern Russia – all principal wheat producing regions have sharply reduced global output. Less understood but an obviously potent factor is the effect of global warming. The shift to biofuels, especially in the United States, is an immediate, well-documented cause.
The Prime Minister, Dr Manmohan Singh, recently admitted that India’s food security would be under stress from 2010 onwards. In the Planning Commission, a pall of gloom hangs over the head of the agriculture wing, which is scared about the prospect of food security from
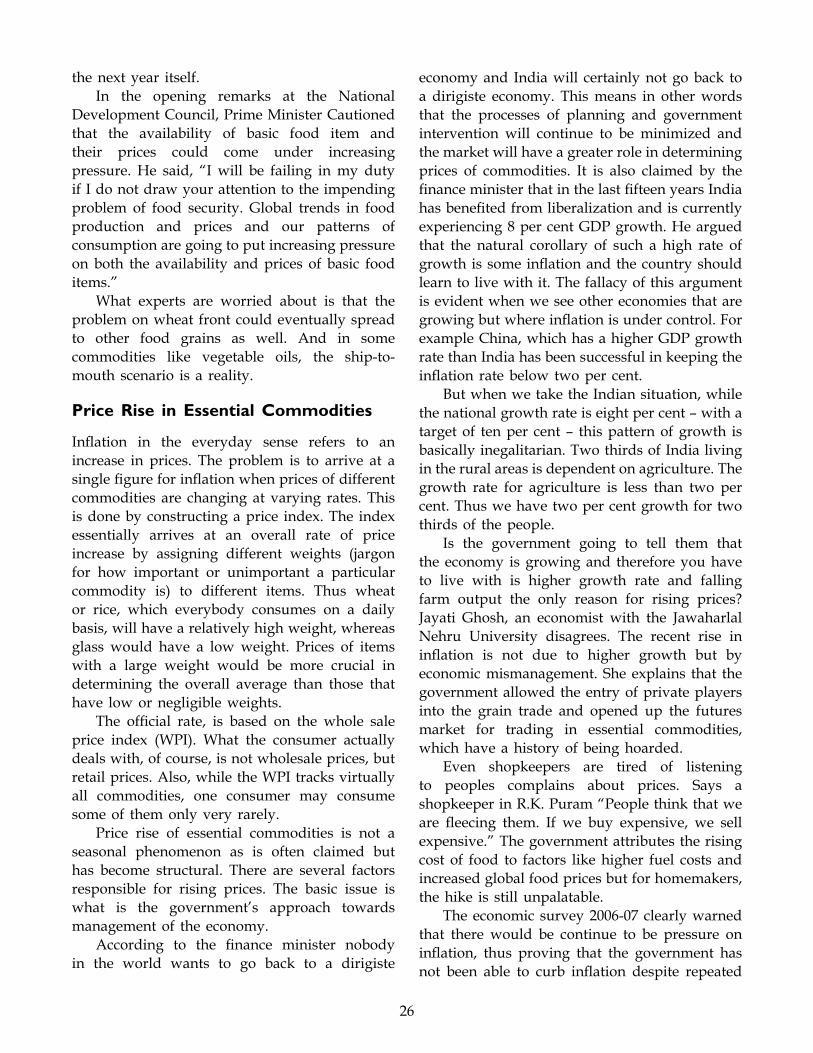
26
the next year itself.In the opening remarks at the National
Development Council, Prime Minister Cautioned that the availability of basic food item and their prices could come under increasing pressure. He said, “I will be failing in my duty if I do not draw your attention to the impending problem of food security. Global trends in food production and prices and our patterns of consumption are going to put increasing pressure on both the availability and prices of basic food items.”
What experts are worried about is that the problem on wheat front could eventually spread to other food grains as well. And in some commodities like vegetable oils, the ship-to-mouth scenario is a reality.
Price Rise in Essential Commodities
Inflation in the everyday sense refers to an increase in prices. The problem is to arrive at a single figure for inflation when prices of different commodities are changing at varying rates. This is done by constructing a price index. The index essentially arrives at an overall rate of price increase by assigning different weights (jargon for how important or unimportant a particular commodity is) to different items. Thus wheat or rice, which everybody consumes on a daily basis, will have a relatively high weight, whereas glass would have a low weight. Prices of items with a large weight would be more crucial in determining the overall average than those that have low or negligible weights.
The official rate, is based on the whole sale price index (WPI). What the consumer actually deals with, of course, is not wholesale prices, but retail prices. Also, while the WPI tracks virtually all commodities, one consumer may consume some of them only very rarely.
Price rise of essential commodities is not a seasonal phenomenon as is often claimed but has become structural. There are several factors responsible for rising prices. The basic issue is what is the government’s approach towards management of the economy.
According to the finance minister nobody in the world wants to go back to a dirigiste
economy and India will certainly not go back to a dirigiste economy. This means in other words that the processes of planning and government intervention will continue to be minimized and the market will have a greater role in determining prices of commodities. It is also claimed by the finance minister that in the last fifteen years India has benefited from liberalization and is currently experiencing 8 per cent GDP growth. He argued that the natural corollary of such a high rate of growth is some inflation and the country should learn to live with it. The fallacy of this argument is evident when we see other economies that are growing but where inflation is under control. For example China, which has a higher GDP growth rate than India has been successful in keeping the inflation rate below two per cent.
But when we take the Indian situation, while the national growth rate is eight per cent – with a target of ten per cent – this pattern of growth is basically inegalitarian. Two thirds of India living in the rural areas is dependent on agriculture. The growth rate for agriculture is less than two per cent. Thus we have two per cent growth for two thirds of the people.
Is the government going to tell them that the economy is growing and therefore you have to live with is higher growth rate and falling farm output the only reason for rising prices? Jayati Ghosh, an economist with the Jawaharlal Nehru University disagrees. The recent rise in inflation is not due to higher growth but by economic mismanagement. She explains that the government allowed the entry of private players into the grain trade and opened up the futures market for trading in essential commodities, which have a history of being hoarded.
Even shopkeepers are tired of listening to peoples complains about prices. Says a shopkeeper in R.K. Puram “People think that we are fleecing them. If we buy expensive, we sell expensive.” The government attributes the rising cost of food to factors like higher fuel costs and increased global food prices but for homemakers, the hike is still unpalatable.
The economic survey 2006-07 clearly warned that there would be continue to be pressure on inflation, thus proving that the government has not been able to curb inflation despite repeated
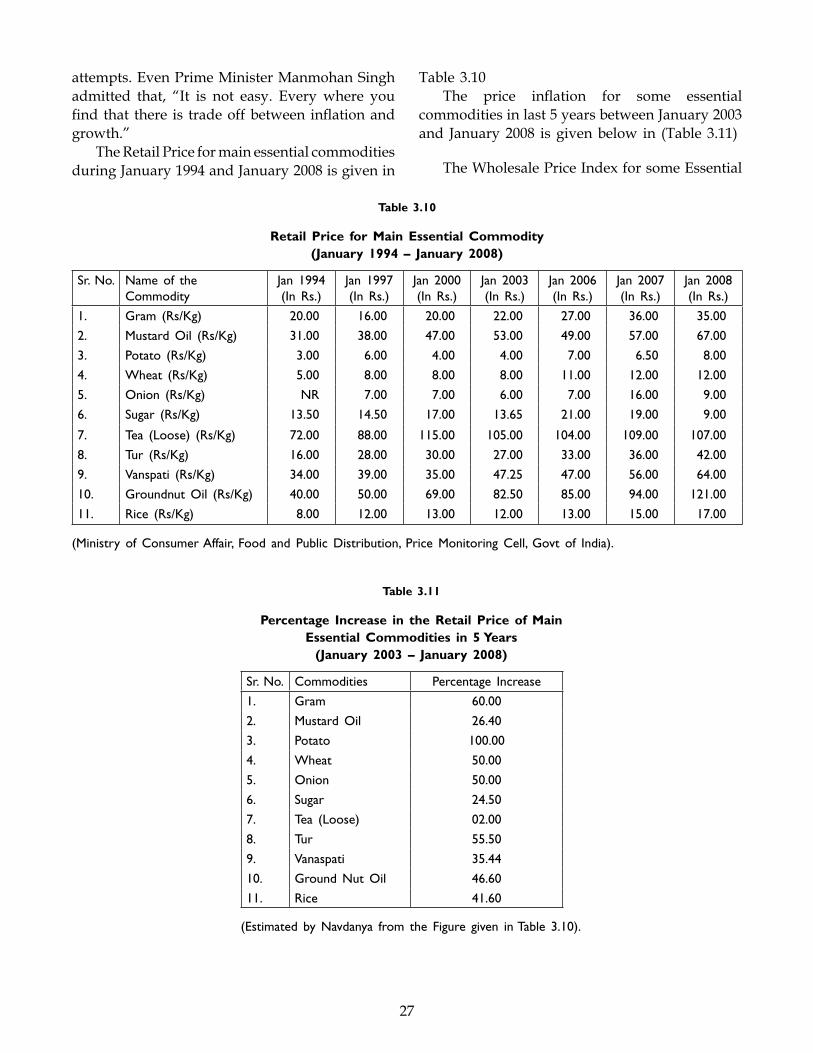
27
attempts. Even Prime Minister Manmohan Singh admitted that, “It is not easy. Every where you find that there is trade off between inflation and growth.”
The Retail Price for main essential commodities during January 1994 and January 2008 is given in
Table 3.10The price inflation for some essential
commodities in last 5 years between January 2003 and January 2008 is given below in (Table 3.11)
The Wholesale Price Index for some Essential
Table 3.10
Retail Price for Main Essential Commodity (January 1994 – January 2008)
Sr. No. Name of the Commodity
Jan 1994 (In Rs.)
Jan 1997 (In Rs.)
Jan 2000 (In Rs.)
Jan 2003 (In Rs.)
Jan 2006 (In Rs.)
Jan 2007 (In Rs.)
Jan 2008 (In Rs.)
1. Gram (Rs/Kg) 20.00 16.00 20.00 22.00 27.00 36.00 35.00
2. Mustard Oil (Rs/Kg) 31.00 38.00 47.00 53.00 49.00 57.00 67.00
3. Potato (Rs/Kg) 3.00 6.00 4.00 4.00 7.00 6.50 8.00
4. Wheat (Rs/Kg) 5.00 8.00 8.00 8.00 11.00 12.00 12.00
5. Onion (Rs/Kg) NR 7.00 7.00 6.00 7.00 16.00 9.00
6. Sugar (Rs/Kg) 13.50 14.50 17.00 13.65 21.00 19.00 9.00
7. Tea (Loose) (Rs/Kg) 72.00 88.00 115.00 105.00 104.00 109.00 107.00
8. Tur (Rs/Kg) 16.00 28.00 30.00 27.00 33.00 36.00 42.00
9. Vanspati (Rs/Kg) 34.00 39.00 35.00 47.25 47.00 56.00 64.00
10. Groundnut Oil (Rs/Kg) 40.00 50.00 69.00 82.50 85.00 94.00 121.00
11. Rice (Rs/Kg) 8.00 12.00 13.00 12.00 13.00 15.00 17.00
(Ministry of Consumer Affair, Food and Public Distribution, Price Monitoring Cell, Govt of India).
Table 3.11
Percentage Increase in the Retail Price of Main Essential Commodities in 5 Years
(January 2003 – January 2008)
Sr. No. Commodities Percentage Increase
1. Gram 60.00
2. Mustard Oil 26.40
3. Potato 100.00
4. Wheat 50.00
5. Onion 50.00
6. Sugar 24.50
7. Tea (Loose) 02.00
8. Tur 55.50
9. Vanaspati 35.44
10. Ground Nut Oil 46.60
11. Rice 41.60
(Estimated by Navdanya from the Figure given in Table 3.10).
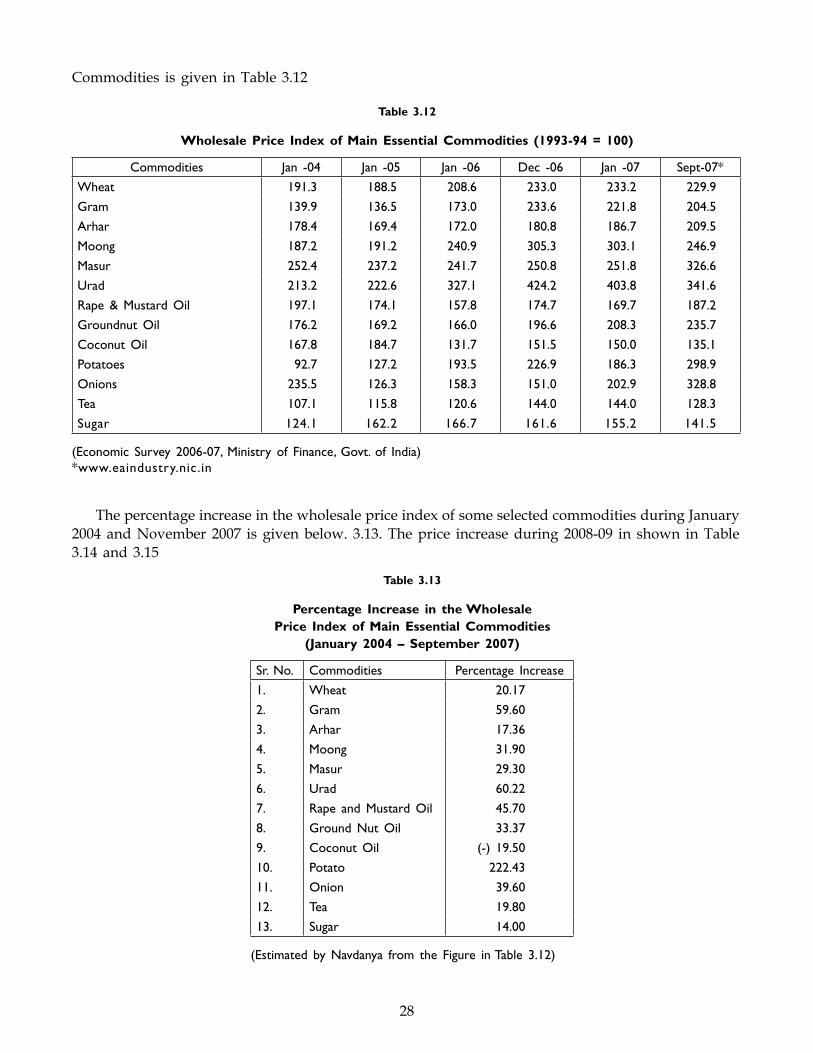
28
Table 3.12
Wholesale Price Index of Main Essential Commodities (1993-94 = 100)
Commodities Jan -04 Jan -05 Jan -06 Dec -06 Jan -07 Sept-07*
Wheat 191.3 188.5 208.6 233.0 233.2 229.9
Gram 139.9 136.5 173.0 233.6 221.8 204.5
Arhar 178.4 169.4 172.0 180.8 186.7 209.5
Moong 187.2 191.2 240.9 305.3 303.1 246.9
Masur 252.4 237.2 241.7 250.8 251.8 326.6
Urad 213.2 222.6 327.1 424.2 403.8 341.6
Rape & Mustard Oil 197.1 174.1 157.8 174.7 169.7 187.2
Groundnut Oil 176.2 169.2 166.0 196.6 208.3 235.7
Coconut Oil 167.8 184.7 131.7 151.5 150.0 135.1
Potatoes 92.7 127.2 193.5 226.9 186.3 298.9
Onions 235.5 126.3 158.3 151.0 202.9 328.8
Tea 107.1 115.8 120.6 144.0 144.0 128.3
Sugar 124.1 162.2 166.7 161.6 155.2 141.5
(Economic Survey 2006-07, Ministry of Finance, Govt. of India)*www.eaindustry.nic.in
Table 3.13
Percentage Increase in the Wholesale Price Index of Main Essential Commodities
(January 2004 – September 2007)
Sr. No. Commodities Percentage Increase
1. Wheat 20.17
2. Gram 59.60
3. Arhar 17.36
4. Moong 31.90
5. Masur 29.30
6. Urad 60.22
7. Rape and Mustard Oil 45.70
8. Ground Nut Oil 33.37
9. Coconut Oil (-) 19.50
10. Potato 222.43
11. Onion 39.60
12. Tea 19.80
13. Sugar 14.00
(Estimated by Navdanya from the Figure in Table 3.12)
Commodities is given in Table 3.12
The percentage increase in the wholesale price index of some selected commodities during January 2004 and November 2007 is given below. 3.13. The price increase during 2008-09 in shown in Table 3.14 and 3.15
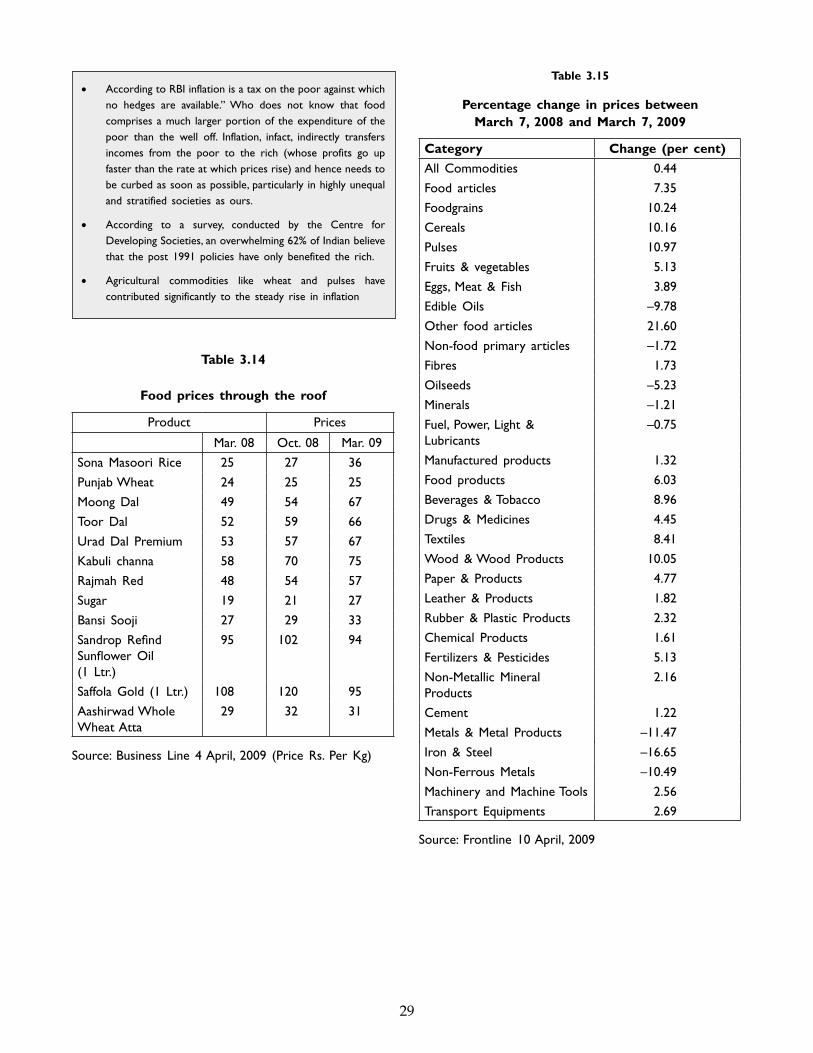
29
• According to RBI inflation is a tax on the poor against which no hedges are available.” Who does not know that food comprises a much larger portion of the expenditure of the poor than the well off. Inflation, infact, indirectly transfers incomes from the poor to the rich (whose profits go up faster than the rate at which prices rise) and hence needs to be curbed as soon as possible, particularly in highly unequal and stratified societies as ours.
• According to a survey, conducted by the Centre for Developing Societies, an overwhelming 62% of Indian believe that the post 1991 policies have only benefited the rich.
• Agricultural commodities like wheat and pulses have contributed significantly to the steady rise in inflation
Table 3.14
Food prices through the roof
Product Prices
Mar. 08 Oct. 08 Mar. 09
Sona Masoori Rice 25 27 36
Punjab Wheat 24 25 25
Moong Dal 49 54 67
Toor Dal 52 59 66
Urad Dal Premium 53 57 67
Kabuli channa 58 70 75
Rajmah Red 48 54 57
Sugar 19 21 27
Bansi Sooji 27 29 33
Sandrop Refind Sunflower Oil (1 Ltr.)
95 102 94
Saffola Gold (1 Ltr.) 108 120 95
Aashirwad Whole Wheat Atta
29 32 31
Source: Business Line 4 April, 2009 (Price Rs. Per Kg)
Table 3.15
Percentage change in prices between March 7, 2008 and March 7, 2009
Category Change (per cent)
All Commodities 0.44
Food articles 7.35
Foodgrains 10.24
Cereals 10.16
Pulses 10.97
Fruits & vegetables 5.13
Eggs, Meat & Fish 3.89
Edible Oils –9.78
Other food articles 21.60
Non-food primary articles –1.72
Fibres 1.73
Oilseeds –5.23
Minerals –1.21
Fuel, Power, Light & Lubricants
–0.75
Manufactured products 1.32
Food products 6.03
Beverages & Tobacco 8.96
Drugs & Medicines 4.45
Textiles 8.41
Wood & Wood Products 10.05
Paper & Products 4.77
Leather & Products 1.82
Rubber & Plastic Products 2.32
Chemical Products 1.61
Fertilizers & Pesticides 5.13
Non-Metallic Mineral Products
2.16
Cement 1.22
Metals & Metal Products –11.47
Iron & Steel –16.65
Non-Ferrous Metals –10.49
Machinery and Machine Tools 2.56
Transport Equipments 2.69
Source: Frontline 10 April, 2009
30
The inflation rate during the first quarter of 2009 has dropped to almost zero, but the prices that one has to pay for food continues to remain high, especially for essentially such as rice, sugar and pulses. The only food category for which prices have fallen is edible oils, which reflects the decline in oilseed prices as world prices have crashed. Other food articles prices have increased
by more than one fifth during last one year. So people wonder how inflation could be falling when they keep facing higher prices when they go to the market. This is particularly true in the case of food items. And this obviously affects household budge, especially among the poor for whom food still accounts for more than half of the total household expenditure.
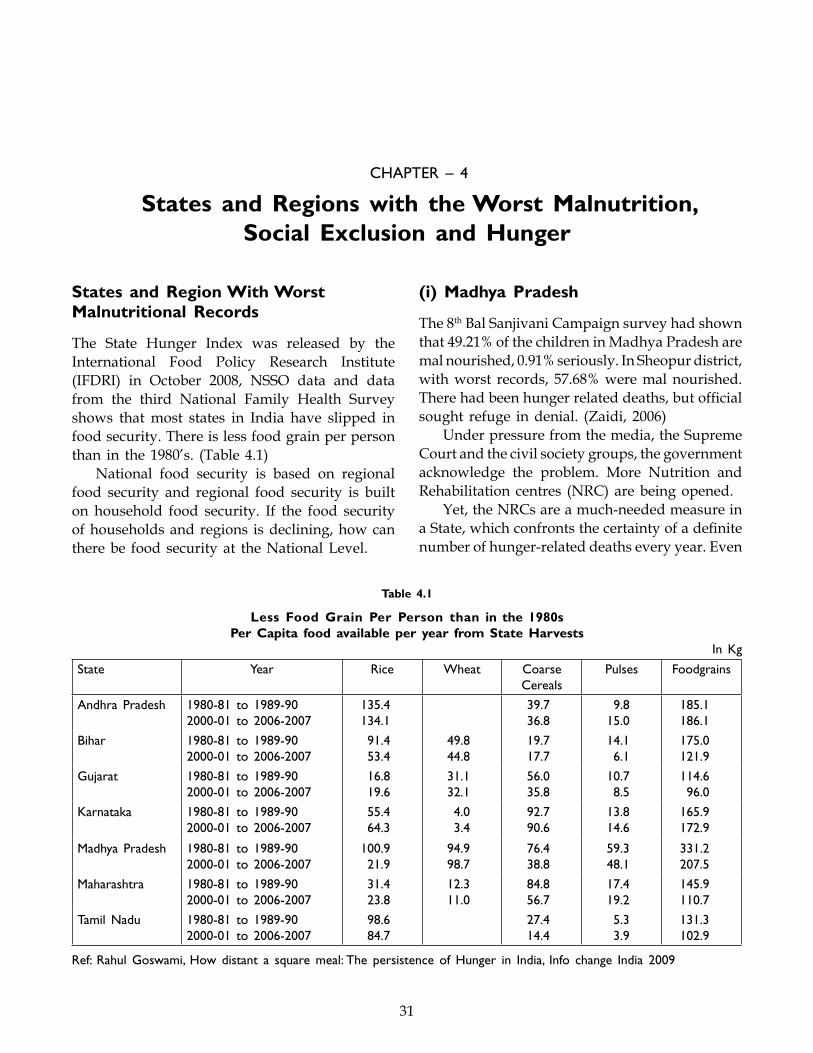
31
CHAPTER – 4
States and Regions with the Worst Malnutrition, Social Exclusion and Hunger
States and Region With Worst Malnutritional Records
The State Hunger Index was released by the International Food Policy Research Institute (IFDRI) in October 2008, NSSO data and data from the third National Family Health Survey shows that most states in India have slipped in food security. There is less food grain per person than in the 1980’s. (Table 4.1)
National food security is based on regional food security and regional food security is built on household food security. If the food security of households and regions is declining, how can there be food security at the National Level.
(i) Madhya Pradesh
The 8th Bal Sanjivani Campaign survey had shown that 49.21% of the children in Madhya Pradesh are mal nourished, 0.91% seriously. In Sheopur district, with worst records, 57.68% were mal nourished. There had been hunger related deaths, but official sought refuge in denial. (Zaidi, 2006)
Under pressure from the media, the Supreme Court and the civil society groups, the government acknowledge the problem. More Nutrition and Rehabilitation centres (NRC) are being opened.
Yet, the NRCs are a much-needed measure in a State, which confronts the certainty of a definite number of hunger-related deaths every year. Even
Table 4.1
Less Food Grain Per Person than in the 1980sPer Capita food available per year from State Harvests
In Kg
State Year Rice Wheat Coarse Cereals
Pulses Foodgrains
Andhra Pradesh 1980-81 to 1989-90 2000-01 to 2006-2007
135.4 134.1
39.7 36.8
9.8 15.0
185.1 186.1
Bihar 1980-81 to 1989-90 2000-01 to 2006-2007
91.4 53.4
49.8 44.8
19.7 17.7
14.1 6.1
175.0 121.9
Gujarat 1980-81 to 1989-90 2000-01 to 2006-2007
16.8 19.6
31.1 32.1
56.0 35.8
10.7 8.5
114.6 96.0
Karnataka 1980-81 to 1989-90 2000-01 to 2006-2007
55.4 64.3
4.0 3.4
92.7 90.6
13.8 14.6
165.9 172.9
Madhya Pradesh 1980-81 to 1989-90 2000-01 to 2006-2007
100.9 21.9
94.9 98.7
76.4 38.8
59.3 48.1
331.2 207.5
Maharashtra 1980-81 to 1989-90 2000-01 to 2006-2007
31.4 23.8
12.3 11.0
84.8 56.7
17.4 19.2
145.9 110.7
Tamil Nadu 1980-81 to 1989-90 2000-01 to 2006-2007
98.6 84.7
27.4 14.4
5.3 3.9
131.3 102.9
Ref: Rahul Goswami, How distant a square meal: The persistence of Hunger in India, Info change India 2009
32
if the situation is improving slowly, it still looks very bad once you translate percentages into numbers. According to the 10th survey of the Bal Sanjivani Abhiyan in the State, 47.5 per cent of children under six are malnourished, of whom 0.67 per cent suffer from severe malnourishment.
This is down by 0.11 per cent from the ninth survey, but, with an average rate of 30 per cent mortality (for the severely malnourished), this means that hundreds of children will die in the current year. In Sheopur district [which accounts for 2.56 per cent of the severe category], upto 600 children could die.
It is a frightening fact that, despite the best efforts of concerned groups and recent policy changes, within a year, 600 children in a single district will have died because there was not enough food to eat. (Zaidi, 2007)
The State has been trying. From only daliya or panjeeri, the menu at anganwadis now includes poha, laddoo and halwa-puri. The process is also decentralized, with the money for supplies being sent directly to a joint account between the anganwadi worker and the local mothers’ committee. Pockets of chronic malnutrition will be allotted Rs. 6 a child, instead of Rs. 2, whereby children will get three meals at the anganwadi. The worker and helper will also be paid extra.
Many changes over the past decade have pushed villagers who once had enough to eat into a spiral of food insecurity and the uncertain arms of the public distribution system (PDS). There appears to be a direct link between access to forests and hunger in tribal hamlets. Madhya Pradesh has 29 national parks and reserved forest areas, and each of them has meant displacement and deprivation for the tribal people.
Take Balharpur village in Shivpuri for instance, less than an hour’s drive from Shivpuri town. About eight years ago, its residents, most of them belonging to the Sahariya tribe, were moved out of the Madhav National Park and dumped upon a stony, non-irrigated tract of land near the highway. Earlier, they had lived close to a river and had water for both farming and drinking.
During the non-farming season, they collected and sold tendu leaves herbs and honey to be able to buy things needed to supplement their diet. Each family had cows and goats. Today, the
village has neither fields, nor cattle nor jobs. People almost entirely depends on subsidized PDS rations. Everybody does not have a yellow card, the Antyodaya ration card which marks the Sahariyas as the poorest of the poor. The Sahariyas are entitled to these cards, being a Primitive Tribal Group. Not surprisingly, malnutrition amongst the children is plain to see, even to the untrained eye.
Recently, Madhya Pradesh has launched ‘The Shaktiman’ project in the heavily forested Kesla block of Hoshangabad district TV Star Mukesh Khanna who played the popular role of Shaktiman in a serial by the same was present at the time of launching the scheme. The project would initially cover 1000 villages in 38 development blocks of 19 districts. The project is the first of its kind in the country. (Hindu, 2007)
The enquiry committee constituted in the first week of October, 2006 by Commissioners of Supreme Court to investigate the hunger and malnutrition deaths, while their visit to the most backward primitive tribal group saheriya dominated villages of Sheopur district of Madhya Pradesh found four children in Ranipur village – Bansi, Sonu, Sukhlal and Kiran as severely malnourished.
The truth is bitter for the State as since the State was getting awards and recognition for progress and development, the National Family Health Survey III highlighted the fact that during last eight years (1998-2006), the per cent of malnourished children had increased by five per cent. Owing to dearth of nutritious food, health facilities and family food insecurity, the per cent of malnutrition (underweight) increased from 54% to 60.3%.
The report also says that only 14% children under the age of 3 years breastfed within one hour of birth and 82.6% of children between the age of 6-35 months, the most critical period of life for mental and physical development; On the other hand, on the basis of their own data, the State has been claiming that the ratio of undernourished has come down to somewhere around 49% but field realities in Sheopur do not support the State cause. It is sad that only 23 percent children in State are registered in anganbadis, which means that let alone reaching common children; the
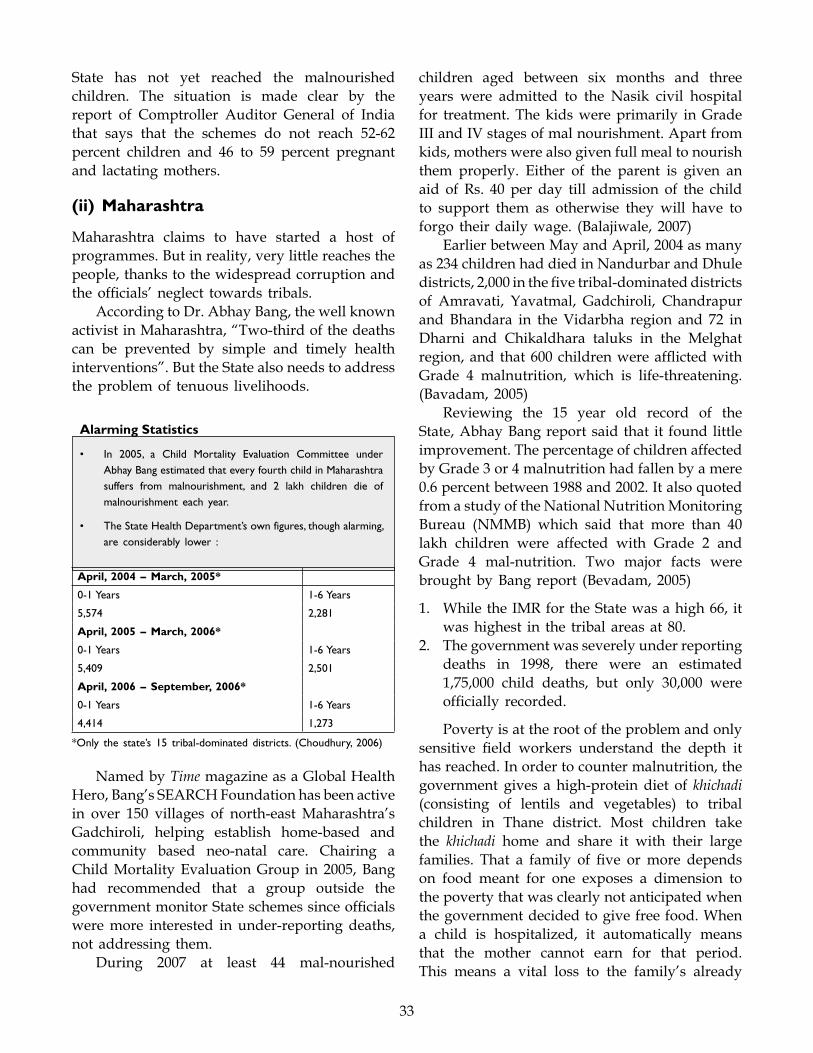
33
State has not yet reached the malnourished children. The situation is made clear by the report of Comptroller Auditor General of India that says that the schemes do not reach 52-62 percent children and 46 to 59 percent pregnant and lactating mothers.
(ii) Maharashtra
Maharashtra claims to have started a host of programmes. But in reality, very little reaches the people, thanks to the widespread corruption and the officials’ neglect towards tribals.
According to Dr. Abhay Bang, the well known activist in Maharashtra, “Two-third of the deaths can be prevented by simple and timely health interventions”. But the State also needs to address the problem of tenuous livelihoods.
Alarming Statistics
• In 2005, a Child Mortality Evaluation Committee underAbhay Bang estimated that every fourth child in Maharashtra suffers from malnourishment, and 2 lakh children die of malnourishment each year.
• TheStateHealthDepartment’sownfigures,thoughalarming,are considerably lower :
April, 2004 – March, 2005*
0-1 Years 1-6 Years
5,574 2,281
April, 2005 – March, 2006*
0-1 Years 1-6 Years
5,409 2,501
April, 2006 – September, 2006*
0-1 Years 1-6 Years
4,414 1,273
*Only the state’s 15 tribal-dominated districts. (Choudhury, 2006)
Named by Time magazine as a Global Health Hero, Bang’s SEARCH Foundation has been active in over 150 villages of north-east Maharashtra’s Gadchiroli, helping establish home-based and community based neo-natal care. Chairing a Child Mortality Evaluation Group in 2005, Bang had recommended that a group outside the government monitor State schemes since officials were more interested in under-reporting deaths, not addressing them.
During 2007 at least 44 mal-nourished
children aged between six months and three years were admitted to the Nasik civil hospital for treatment. The kids were primarily in Grade III and IV stages of mal nourishment. Apart from kids, mothers were also given full meal to nourish them properly. Either of the parent is given an aid of Rs. 40 per day till admission of the child to support them as otherwise they will have to forgo their daily wage. (Balajiwale, 2007)
Earlier between May and April, 2004 as many as 234 children had died in Nandurbar and Dhule districts, 2,000 in the five tribal-dominated districts of Amravati, Yavatmal, Gadchiroli, Chandrapur and Bhandara in the Vidarbha region and 72 in Dharni and Chikaldhara taluks in the Melghat region, and that 600 children were afflicted with Grade 4 malnutrition, which is life-threatening. (Bavadam, 2005)
Reviewing the 15 year old record of the State, Abhay Bang report said that it found little improvement. The percentage of children affected by Grade 3 or 4 malnutrition had fallen by a mere 0.6 percent between 1988 and 2002. It also quoted from a study of the National Nutrition Monitoring Bureau (NMMB) which said that more than 40 lakh children were affected with Grade 2 and Grade 4 mal-nutrition. Two major facts were brought by Bang report (Bevadam, 2005)
1. While the IMR for the State was a high 66, it was highest in the tribal areas at 80.
2. The government was severely under reporting deaths in 1998, there were an estimated 1,75,000 child deaths, but only 30,000 were officially recorded.
Poverty is at the root of the problem and only sensitive field workers understand the depth it has reached. In order to counter malnutrition, the government gives a high-protein diet of khichadi (consisting of lentils and vegetables) to tribal children in Thane district. Most children take the khichadi home and share it with their large families. That a family of five or more depends on food meant for one exposes a dimension to the poverty that was clearly not anticipated when the government decided to give free food. When a child is hospitalized, it automatically means that the mother cannot earn for that period. This means a vital loss to the family’s already
34
meager income. In an effort to counter this, the government gives Rs. 40 a day to the family while the child undergoes treatment. While the link between employment, livelihood and health has been accepted this has not been factored in appropriately in working out counter-measures.
There is almost a direct correlation between malnutrition-related deaths and the monsoon. If the rains are timely and pleantiful, there are fewer malnourished children. But, as happened in 2002, when the monsoon was delayed there was a high incidence of fatality among children. The majority of tribal families in Thane are landless. Those that do own land hold less than 0.8 hectare. Food shortage is common and people rely heavily on the Employment Guarantee Scheme (EGS) for work and money.
Though the days of large scale starvation deaths are not there, instead we now keep people miserably alive as undernourished citizens. Unlike the killer Aids, mal nutrition might not cause deaths. It compromises immunity and increases the vulnerability to fatal ailments. This leaves room for government and public health officials to argue that the cause of death was not mal nutrition but poor hygiene, contaminated water and harmful cultural practices. (Bhatia, 2005)
How Scales Are Tipped Against Addressing Mal Nutrition
In Maharashtra malnourishment has two sets of data. One, released by the government. The other, computed by the UNICEF. One, which says there’s nothing to worry and the other, which describes a horror story.
The weighing is a simple method but, if not done with accuracy, can cause mistakes which can be drastic. The kid who is malnourished can fall into a safer group due to faults either in the weighing methods or the weighing scale. A team comprising medical experts from UNICEF and MPs, which visited three anganwadis in Wada, Thane district, found the scales used to weigh children to check for malnutrition were faulty and, hence, sent up wrong readings. Two year old Krutik was recorded to have weighed 11.5 kg in September of this year. But after few days when medical experts re-weighed him using UNICEF
scales, he weighed 9.5 kg.Medical expert who weighed Krutik, said:
“According to the faulty scales, the child weighed 2 kg more, giving the impression that he was suffering from a less severe case of malnutrition. This can cause problems as the child is shown to be a healthy one, when in fact he is malnourished.”
When questioned, the anganwadi workers produced another weighing scale, which they claimed was the one they used to weigh Krutik. The scale was a local brand – not the ones donated to the anganwadis by UNICEF, and which they were required to use. When the child was re-weighed using the local scales, he weighed 12 kg. (Aikara and Kolhatkar, 2007)
It wasn’t just the weighing scales that came under scrutiny either. Medical experts who accompanied the team stated that children who suffered grade 4 malnutrition (the most serious form and defined as being life-threatening), were termed as “lost records” by anganwadi workers, which meant they had no information about their current whereabouts.
The records showed 13 children from three anganwadis were suffering from grade 3 and grade 4 malnutrition, and when the medical team questioned the workers as to the whereabouts of the 13 children, the workers claimed they didn’t know. Even though UNICEF experts claim that every one of the four grades suggests malnutrition – the only difference being the level of severity – anganwadi workers state that only grade 3 and grade 4 can count as malnourished. Records showed that out of the 382,341 children at anganwadis in Maharashtra, 157,991 suffered from grade 1 malnutrition, 55,037 were grade 2,692 were grade 3 and 106 were grade 4.
In 2004 the Maharastra government announced these very same regions have no malnourished children. Later, the Chief Justice set up a committee to evaluate child mortality rates in Maharashtra. From April, 2005 to April, 2006, 1,700 children had died due to malnutrition. The team was surprised to find that the weight and height records of children maintained by the anganwadi workers were written in pencil and could be forged.
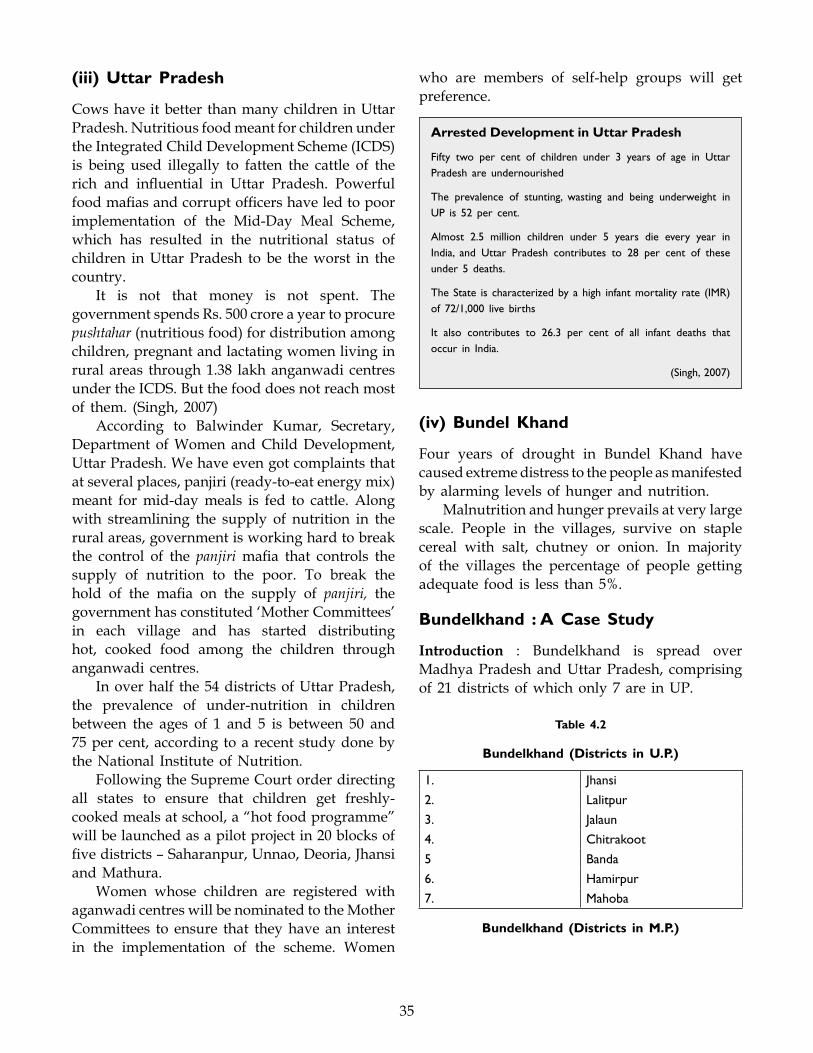
35
(iii) Uttar Pradesh
Cows have it better than many children in Uttar Pradesh. Nutritious food meant for children under the Integrated Child Development Scheme (ICDS) is being used illegally to fatten the cattle of the rich and influential in Uttar Pradesh. Powerful food mafias and corrupt officers have led to poor implementation of the Mid-Day Meal Scheme, which has resulted in the nutritional status of children in Uttar Pradesh to be the worst in the country.
It is not that money is not spent. The government spends Rs. 500 crore a year to procure pushtahar (nutritious food) for distribution among children, pregnant and lactating women living in rural areas through 1.38 lakh anganwadi centres under the ICDS. But the food does not reach most of them. (Singh, 2007)
According to Balwinder Kumar, Secretary, Department of Women and Child Development, Uttar Pradesh. We have even got complaints that at several places, panjiri (ready-to-eat energy mix) meant for mid-day meals is fed to cattle. Along with streamlining the supply of nutrition in the rural areas, government is working hard to break the control of the panjiri mafia that controls the supply of nutrition to the poor. To break the hold of the mafia on the supply of panjiri, the government has constituted ‘Mother Committees’ in each village and has started distributing hot, cooked food among the children through anganwadi centres.
In over half the 54 districts of Uttar Pradesh, the prevalence of under-nutrition in children between the ages of 1 and 5 is between 50 and 75 per cent, according to a recent study done by the National Institute of Nutrition.
Following the Supreme Court order directing all states to ensure that children get freshly-cooked meals at school, a “hot food programme” will be launched as a pilot project in 20 blocks of five districts – Saharanpur, Unnao, Deoria, Jhansi and Mathura.
Women whose children are registered with aganwadi centres will be nominated to the Mother Committees to ensure that they have an interest in the implementation of the scheme. Women
who are members of self-help groups will get preference.
Arrested Development in Uttar Pradesh
Fifty two per cent of children under 3 years of age in Uttar Pradesh are undernourished
The prevalence of stunting, wasting and being underweight in UP is 52 per cent.
Almost 2.5 million children under 5 years die every year in India, and Uttar Pradesh contributes to 28 per cent of these under 5 deaths.
The State is characterized by a high infant mortality rate (IMR) of 72/1,000 live births
It also contributes to 26.3 per cent of all infant deaths that occur in India.
(Singh, 2007)
(iv) Bundel Khand
Four years of drought in Bundel Khand have caused extreme distress to the people as manifested by alarming levels of hunger and nutrition.
Malnutrition and hunger prevails at very large scale. People in the villages, survive on staple cereal with salt, chutney or onion. In majority of the villages the percentage of people getting adequate food is less than 5%.
Bundelkhand : A Case Study
Introduction : Bundelkhand is spread over Madhya Pradesh and Uttar Pradesh, comprising of 21 districts of which only 7 are in UP.
Table 4.2
Bundelkhand (Districts in U.P.)
1. Jhansi
2. Lalitpur
3. Jalaun
4. Chitrakoot
5 Banda
6. Hamirpur
7. Mahoba
Bundelkhand (Districts in M.P.)
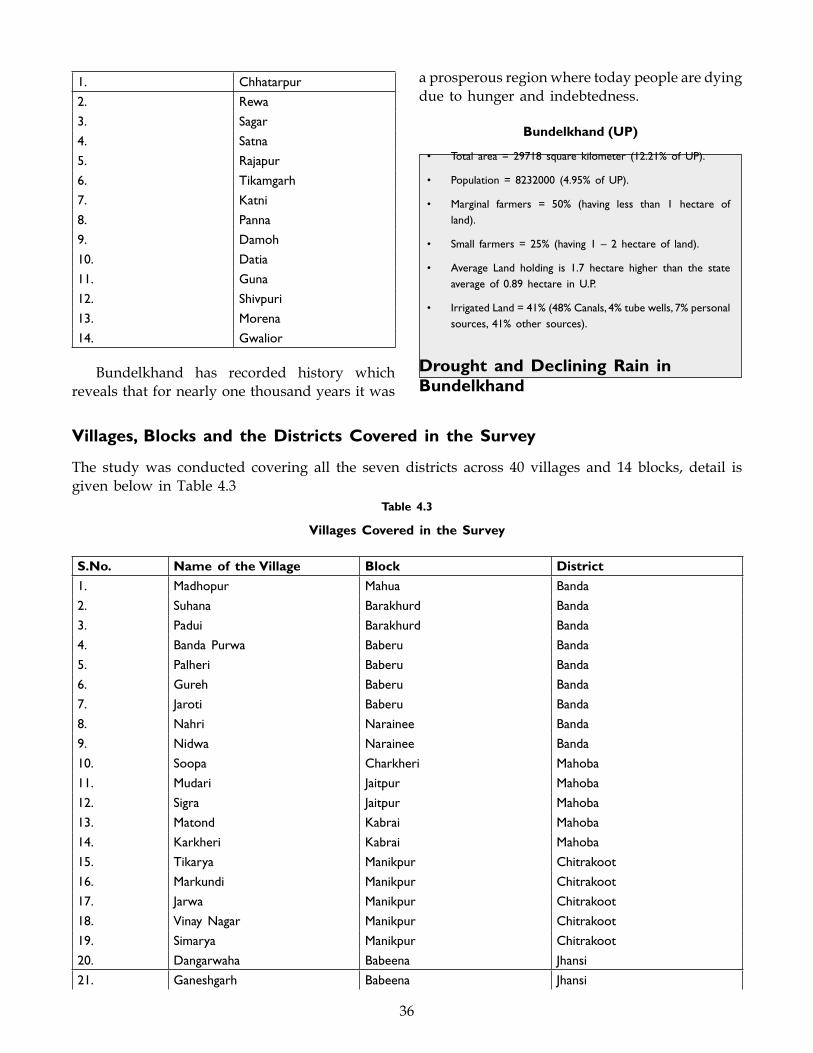
36
1. Chhatarpur
2. Rewa
3. Sagar
4. Satna
5. Rajapur
6. Tikamgarh
7. Katni
8. Panna
9. Damoh
10. Datia
11. Guna
12. Shivpuri
13. Morena
14. Gwalior
Bundelkhand has recorded history which reveals that for nearly one thousand years it was
a prosperous region where today people are dying due to hunger and indebtedness.
Bundelkhand (UP)
• Total area= 29718 square kilometer (12.21%ofUP).
• Population= 8232000 (4.95%ofUP).
• Marginal farmers = 50% (having less than 1 hectare ofland).
• Small farmers= 25% (having 1 – 2 hectare of land).
• Average Land holding is 1.7 hectare higher than the stateaverage of 0.89 hectare in U.P.
• IrrigatedLand=41%(48%Canals,4%tubewells,7%personalsources, 41% other sources).
Drought and Declining Rain in Bundelkhand
Villages, Blocks and the Districts Covered in the Survey
The study was conducted covering all the seven districts across 40 villages and 14 blocks, detail is given below in Table 4.3
Table 4.3
Villages Covered in the Survey
S.No. Name of the Village Block District
1. Madhopur Mahua Banda
2. Suhana Barakhurd Banda
3. Padui Barakhurd Banda
4. Banda Purwa Baberu Banda
5. Palheri Baberu Banda
6. Gureh Baberu Banda
7. Jaroti Baberu Banda
8. Nahri Narainee Banda
9. Nidwa Narainee Banda
10. Soopa Charkheri Mahoba
11. Mudari Jaitpur Mahoba
12. Sigra Jaitpur Mahoba
13. Matond Kabrai Mahoba
14. Karkheri Kabrai Mahoba
15. Tikarya Manikpur Chitrakoot
16. Markundi Manikpur Chitrakoot
17. Jarwa Manikpur Chitrakoot
18. Vinay Nagar Manikpur Chitrakoot
19. Simarya Manikpur Chitrakoot
20. Dangarwaha Babeena Jhansi
21. Ganeshgarh Babeena Jhansi
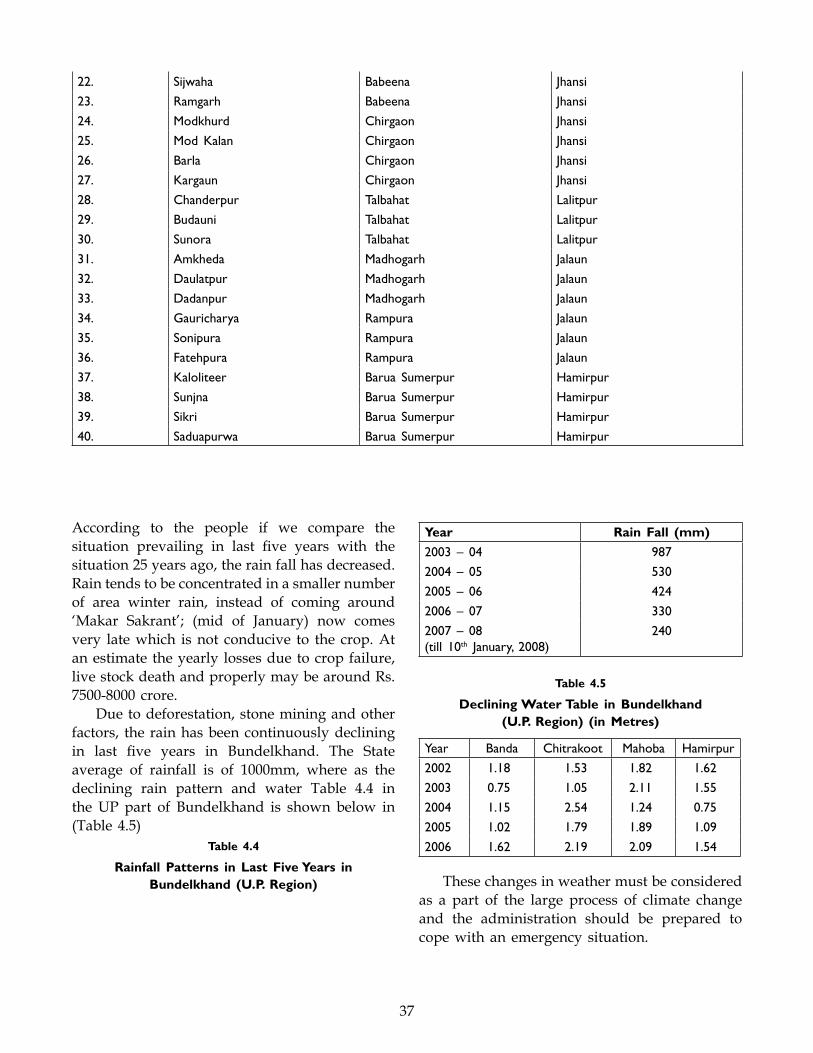
37
According to the people if we compare the situation prevailing in last five years with the situation 25 years ago, the rain fall has decreased. Rain tends to be concentrated in a smaller number of area winter rain, instead of coming around ‘Makar Sakrant’; (mid of January) now comes very late which is not conducive to the crop. At an estimate the yearly losses due to crop failure, live stock death and properly may be around Rs. 7500-8000 crore.
Due to deforestation, stone mining and other factors, the rain has been continuously declining in last five years in Bundelkhand. The State average of rainfall is of 1000mm, where as the declining rain pattern and water Table 4.4 in the UP part of Bundelkhand is shown below in (Table 4.5)
Table 4.4
Rainfall Patterns in Last Five Years in Bundelkhand (U.P. Region)
Year Rain Fall (mm)
2003 – 04 987
2004 – 05 530
2005 – 06 424
2006 – 07 330
2007 – 08(till 10th January, 2008)
240
Table 4.5
Declining Water Table in Bundelkhand (U.P. Region) (in Metres)
Year Banda Chitrakoot Mahoba Hamirpur
2002 1.18 1.53 1.82 1.62
2003 0.75 1.05 2.11 1.55
2004 1.15 2.54 1.24 0.75
2005 1.02 1.79 1.89 1.09
2006 1.62 2.19 2.09 1.54
These changes in weather must be considered as a part of the large process of climate change and the administration should be prepared to cope with an emergency situation.
22. Sijwaha Babeena Jhansi
23. Ramgarh Babeena Jhansi
24. Modkhurd Chirgaon Jhansi
25. Mod Kalan Chirgaon Jhansi
26. Barla Chirgaon Jhansi
27. Kargaun Chirgaon Jhansi
28. Chanderpur Talbahat Lalitpur
29. Budauni Talbahat Lalitpur
30. Sunora Talbahat Lalitpur
31. Amkheda Madhogarh Jalaun
32. Daulatpur Madhogarh Jalaun
33. Dadanpur Madhogarh Jalaun
34. Gauricharya Rampura Jalaun
35. Sonipura Rampura Jalaun
36. Fatehpura Rampura Jalaun
37. Kaloliteer Barua Sumerpur Hamirpur
38. Sunjna Barua Sumerpur Hamirpur
39. Sikri Barua Sumerpur Hamirpur
40. Saduapurwa Barua Sumerpur Hamirpur
38
Mining
The biggest single factor which played havoc with the ecology of Bundelkhand causing irreversible damage, continuous drought and change in rain fall pattern is both legal and illegal mining. The catastrophic dimension of the mining can be gauged by the fact that in Bundelkhand government has permitted the legal mining worth of Rs. 50 crore per year at the rate of Rs. 45 per cubic meter which means nearly 11110000 cubic metre stone is extracted legally. If not more, atleast same amount could be extracted illegally. This way 22220000 cubic metre stone is extracted every year. With this rate with in few years nothing will be left for mining.
According to conventional wisdom, hills in Bundelkhand acted as a barrier to stop warm winds and facilitated the cloud formation and normal rainfall, filling ponds and lakes, Keeping water table high and agriculture to survive even in arid land. Once the hills gone forever, drought and hunger will be a permanent feature.
Besides, causing drought and change in rainfall, mining and stone crashers also affects the vegetation and agricultural productivity in the surrounding areas. Dust emanating from stone crashing and mining is found to affect the agriculture productivity upto 10-12 km. Dust causes poor photosynthesis, leaves become yellow or dry.
Stone crashing and mining also causes serious health problems. According to Dr. R.K. Bhatnagar an eye specialist nearly 15 years at Karbai, one of the largest stone crashing and mining centre, he used to get atleast one patient with major eye injury. “In Karbai, there may be atleast 2-3 cases related to eye injury because other doctor may also be receiving such cases. That time there were 50 crashers now there are atleast 109 crashes,” says Dr. Bhatnagar.
70 - 80% workers are T.B. patient. Kidney stone or other stone formation is also common. These workers do not have money for treatment and die pre mature death.
There must be water spraying when crasher is operating. The crasher must be away from road and human settlement.
Stone mining and crashing, in brief
(i) Causes irreversible ecological damage.(ii) Affects rain fall pattern(iii) Depletes Water table(iv) Reduces agriculture productivity(v) and causes serious health implications.
According to the regulations, there should be no sand mining with in the radius of 1km from the river bridge. This, however has been violated blatantly by the mining mafia, posing a threat to the bridge on Betwa in Hamirpur.
Indebtedness, Tractors Loan and Bank Fraud
Due to consecutive drought and crop failure, indebtedness in the villages has reached to a level from where there is no hope to return it. Apart from the expenses for agriculture, people take loan for the marriages of their daughter or the treatment of their family members. In case of unavailability of bank loan, people are forced to go to money lenders who charge the exorbitant rate 3-5% per month (30-60% per annum). In many cases these money lenders also acts as the input supplier who sell the seeds, fertilizer or pesticide at the higher rate and buy the agriculture produce at the cheaper rate. Farmer has to suffer huge loss in all three way, first paying exorbitant rate of interest, second buying inferior input at the higher price, third selling his produce at the cheaper rate.
“My husband had borrowed Rs. 80000 from a bank few years ago. He had also borrowed from money lenders” says Shobha Devi, whose husband Kishori Sahu hanged himself from a tree in Pandui Village on January 10, 2007 Pratap Singh a farmer himself killed in Matondh an adjoining village. He owned four bighas of land and carried a burden of Rs. 45,000. He had no money to repay the loan.
The drought has led to rare desperate measures. Lured by the tractor agency owners, hundreds of villagers in Bundelkhand have purchased tractors hypothecated by the nationalized banks by mortgaging their agricultural lands. Hit by four consecutive droughts, most of the agriculture lands are lying
39
vacant. Hence tractors too are stranded due to which majority of the farmers failed to pay instalments. Consequently, tractors have been seized by the banks through hired musclemen. “I was never interested to buy a tractor but few agents lured me”, says Nathu Balmiki of Sohana Village in Banda.
He adds, “I have been threatened to pay the hypothecated amount immediately.”
Similar is the case of Ayodha Prasad and Kalli of Nidwa Village, in Narainee Block. “My tractor was forcibly taken by the bank agents. There was no diesel, I even paid for the diesel” says Ayodha Prasad. Kalli’s tractor was taken away when his son had gone to petrol pump.
There may be more than 1000 cases involving tractors. In Mahoba district alone, the banks have seized more than 300 tractors. In Soopa Village at Charkhari Road, there are more than 40 farmers who are in difficult position to repay the loan. Their tractors may be taken by the bank any time. In Mudari Village in the Jaitpur block about 20 farmers have taken loan for the tractors. According to Pundit Pyarelal, the village is little fortunate as no bank agent has come so far for the recovery.
Debt has forced several farmers to switch to daily wage jobs. Ramesh, a farmer in Jalaun says that I have a large family to feed and can not afford to sell my land.
Apart from drought and crop failure, farmers in Bundelkhand are being cheated through Kisan Credit Cards (KCC) which is also known as green cards. Bank officials in connivance with some agents procure the land records of the farmers, sanction the loan and transfer it in KCC and thereafter clandestinely with draws the money. Farmers come to know only when they get the notice for the bank recovery. Sometime even KCC is obtained through fictious ways.
Jamuna Prasad, a farmer of Bhadrokhi village in Urai committed suicide on receiving a notice of bank recovery, amounting Rs. 1.5 lakh.
Farmers Suicides and Hunger Deaths
Drought and inability to repay bank loans has left only two options for scores of farmers, suicides or hunger deaths. Government, as usual, continues
to look the other way. Villages in Bundelkhand are following in ‘Vidharbhas’ footsteps. Farmers says if government does not wakeup, the villages will soon see spate of distress deaths.
According to local activists last year atleast 2-3 people either committed due to indebtedness or crop failure or died because of hunger. In other words 750-1000 killed them selves in 2007. Banda is the worst affected district recording more than 400 deaths.
A hunger death means that chronic under nutrition and malnutrition have played an important role in the death as the weakened body also becomes vulnerable to many ailments. Some of the suicides and hunger death are reported below.
Padui Village
Padui is a village in Banda where a number of people died due to hunger or committed suicide. Some of them are mentioned below.
• Babli : The case of Babli is an example how the people may commit suicide due to helplessness and frustration. He committed suicide as he could not pay the small amount for the stitching of his clothes. He felt so depressed that he hanged himself. Later on, his father also committed suicide as he could not bear the agony.
• Jag Bandey : He migrated to Hyderabad in the search of work. There he failed to find work. He had no money to return back. He committed suicide.
• Bindeshwar Yadav : He owned Rs 2500 of Kirana shops and he was finding it difficult to clear to pay, he stole the money from the pocket of his father; who had borrowed it from some money lender. Bindeshwar felt the guilty and committed suicide.
• Kishori Sahu : He died as minor irrigation facility became defunct. He had borrowed Rs 80,000 from Bank which he could not return. He had also borrowed from money lender.
• Chunwad : Chunwad was cheated by the bank agent. When Chunwad called the meeting of villagers, agent assured that he would return the money which he never returned.
40
Chunwad used to visit the Bank every day and in the process he could not attend his daily work for livelihood and died due to hunger.
Banda Purwa Village
• Badoli Raidas : Raidas died due to hunger. He had no meal for almost two weeks. His widow is also struggling to survive. One of his son is mental case and severely malnourished.
• Ram Asre : He died due to hunger. He has left widow and three children. One of his sons is migrated to New Delhi. Whatever money he sends, is used to returns the interest on the loan. Even the funeral procession was performed by the contribution.
• Kalli : Her 15 year old son died due to hunger and starvation, another son Rajesh is severely under nourished. He is also suffering from fever and cough but Kalli has no money for medicine. Bank sanctioned Rs. 10 thousand in Kisan credit cards (KCC) but paid only Rs. 2.5 thousand. His husband was sanctioned Rs. 40 thousands by Tulsi Grameen Bank but was paid only Rs. 10 thousands, rest of the money was adjusted in earlier loan. Kalli says, “I feel disgusted as I have no money to buy even sari. My sari is torn at several places”. She is surviving by wood collecting and with great difficulty manages only Rs. 12-15 per day. She is worried if she becomes ill no body will be there to feed her children. Her husband remains ill.
Tikarya Village (Chitrakoot): In Tikarya Village in Manikpur block, Vishram Koli, Boonda Koli and Hiralal Mawasi died in a short span of time. All of them were tribals and died due to hunger.
Kulpahar (Mahoba) : In Kulpahar in Mahoba district, Paramlal died due to hunger and T.B. His father could not arrange money for the treatment. Even his last funeral rites was performed by the donation of neighbours.
Chanderpur (Lalitpur) : In Chanderpur, Dinesh committed suicide due to indebtedness. He was married recently. His wife is handicapped. She has no income to survive.
Barla (Jhansi) : In Barla of Chirgaon block,
Krishan Kumar committed suicide due to Bank loan. He had taken loans of nearly 1 lac from the bank. Part of the loan was taken for the treatment of his brother who met with an accident. Krishan Kumar consumed ‘salphos tablets’ and died.
Prolonged drought in Bundelkhand has led to the crisis of marrying the girls. Farmers who are already indebted are not in a position to bear wedding expenses. Marriages are put off year after year in the hope of better times. In Bundelkhand, if the girl becomes of 18, parents start getting worried.
Shocking Malnutrition :
Four years of drought have caused extreme distress to the people as manifested by alarming levels of hunger and nutrition.
Malnutrition and hunger prevails at very large scale. People in the villages, survive on staple cereal with salt, chutney or onion. In majority of the villages the percentage of people getting adequate food is less than 5%.
The consumption of vegetables, pulses and dairy item has vanished. A large number of them do not have enough of even roti. Some of them get only one time meal. Village after village people repeat the same story.
Koli, Saharya and Mawasi tribals face the worst kind of malnutrition and die slow death. Another unfortunate part is that the children of these tribals do not attend school so they do not even get mid-day meal.
Hunger is severe during January – February and July – August. The prevailing condition due to drought has also reduced the availability of minor produce like mahuwa, and amla which are good source of nutrition.
Earlier people used to get ‘Chhach’ in plenty. But today, the situation is totally changed. Now due to the scarcity of fodder few people own milching animals like cow or buffalo. Even when milching animals are owned, people are forced to sell the entire milk because of pressing cash needs and this higher sale of milk has badly affected the freely availability of chhach; a good source of nutrition.
Vinay Nagar in Manikpur block of Chitrakoot is inhabitated by the Koli tribals. A woman who
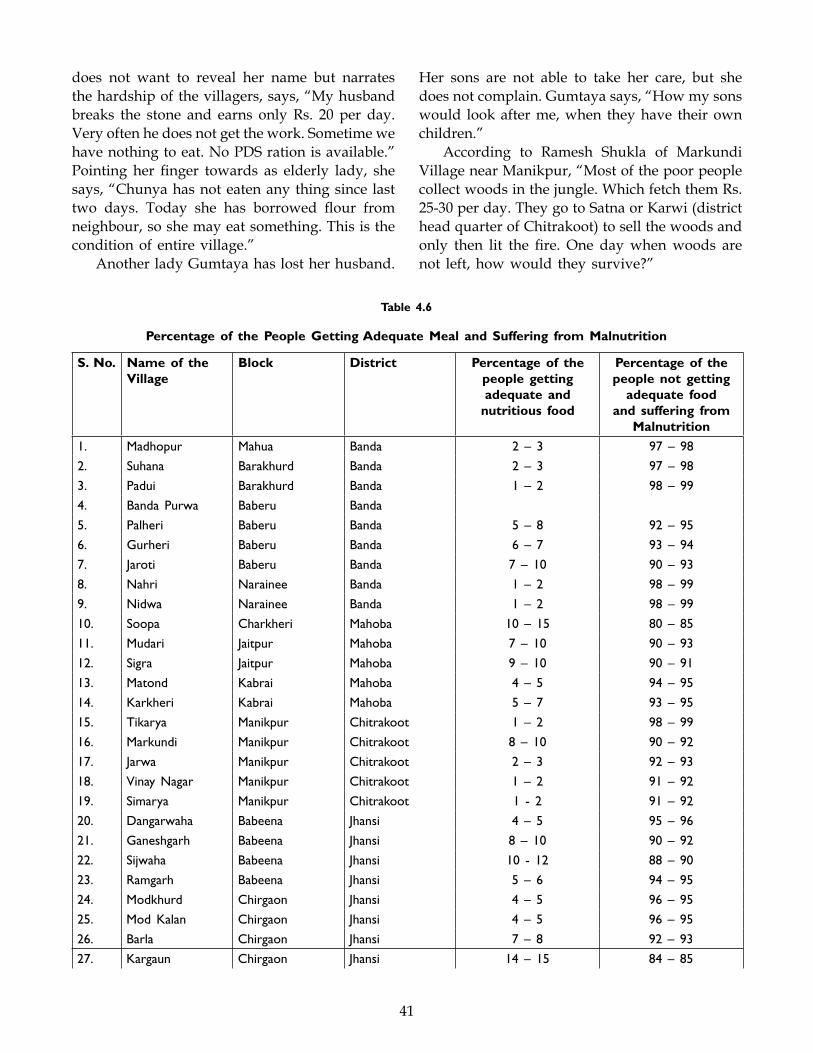
41
does not want to reveal her name but narrates the hardship of the villagers, says, “My husband breaks the stone and earns only Rs. 20 per day. Very often he does not get the work. Sometime we have nothing to eat. No PDS ration is available.” Pointing her finger towards as elderly lady, she says, “Chunya has not eaten any thing since last two days. Today she has borrowed flour from neighbour, so she may eat something. This is the condition of entire village.”
Another lady Gumtaya has lost her husband.
Her sons are not able to take her care, but she does not complain. Gumtaya says, “How my sons would look after me, when they have their own children.”
According to Ramesh Shukla of Markundi Village near Manikpur, “Most of the poor people collect woods in the jungle. Which fetch them Rs. 25-30 per day. They go to Satna or Karwi (district head quarter of Chitrakoot) to sell the woods and only then lit the fire. One day when woods are not left, how would they survive?”
Table 4.6
Percentage of the People Getting Adequate Meal and Suffering from Malnutrition
S. No. Name of the Village
Block District Percentage of the people getting adequate and
nutritious food
Percentage of the people not getting
adequate food and suffering from
Malnutrition
1. Madhopur Mahua Banda 2 – 3 97 – 98
2. Suhana Barakhurd Banda 2 – 3 97 – 98
3. Padui Barakhurd Banda 1 – 2 98 – 99
4. Banda Purwa Baberu Banda
5. Palheri Baberu Banda 5 – 8 92 – 95
6. Gurheri Baberu Banda 6 – 7 93 – 94
7. Jaroti Baberu Banda 7 – 10 90 – 93
8. Nahri Narainee Banda 1 – 2 98 – 99
9. Nidwa Narainee Banda 1 – 2 98 – 99
10. Soopa Charkheri Mahoba 10 – 15 80 – 85
11. Mudari Jaitpur Mahoba 7 – 10 90 – 93
12. Sigra Jaitpur Mahoba 9 – 10 90 – 91
13. Matond Kabrai Mahoba 4 – 5 94 – 95
14. Karkheri Kabrai Mahoba 5 – 7 93 – 95
15. Tikarya Manikpur Chitrakoot 1 – 2 98 – 99
16. Markundi Manikpur Chitrakoot 8 – 10 90 – 92
17. Jarwa Manikpur Chitrakoot 2 – 3 92 – 93
18. Vinay Nagar Manikpur Chitrakoot 1 – 2 91 – 92
19. Simarya Manikpur Chitrakoot 1 - 2 91 – 92
20. Dangarwaha Babeena Jhansi 4 – 5 95 – 96
21. Ganeshgarh Babeena Jhansi 8 – 10 90 – 92
22. Sijwaha Babeena Jhansi 10 - 12 88 – 90
23. Ramgarh Babeena Jhansi 5 – 6 94 – 95
24. Modkhurd Chirgaon Jhansi 4 – 5 96 – 95
25. Mod Kalan Chirgaon Jhansi 4 – 5 96 – 95
26. Barla Chirgaon Jhansi 7 – 8 92 – 93
27. Kargaun Chirgaon Jhansi 14 – 15 84 – 85
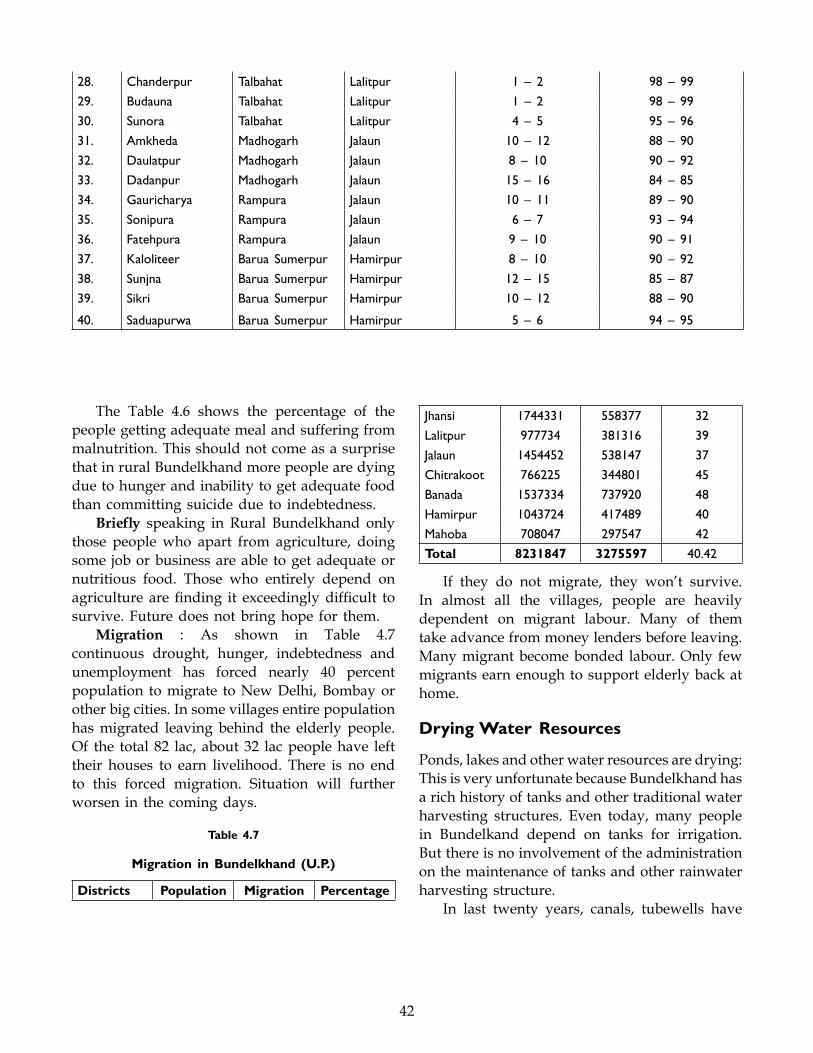
42
The Table 4.6 shows the percentage of the people getting adequate meal and suffering from malnutrition. This should not come as a surprise that in rural Bundelkhand more people are dying due to hunger and inability to get adequate food than committing suicide due to indebtedness.
Briefly speaking in Rural Bundelkhand only those people who apart from agriculture, doing some job or business are able to get adequate or nutritious food. Those who entirely depend on agriculture are finding it exceedingly difficult to survive. Future does not bring hope for them.
Migration : As shown in Table 4.7 continuous drought, hunger, indebtedness and unemployment has forced nearly 40 percent population to migrate to New Delhi, Bombay or other big cities. In some villages entire population has migrated leaving behind the elderly people. Of the total 82 lac, about 32 lac people have left their houses to earn livelihood. There is no end to this forced migration. Situation will further worsen in the coming days.
Table 4.7
Migration in Bundelkhand (U.P.)
Districts Population Migration Percentage
Jhansi 1744331 558377 32
Lalitpur 977734 381316 39
Jalaun 1454452 538147 37
Chitrakoot 766225 344801 45
Banada 1537334 737920 48
Hamirpur 1043724 417489 40
Mahoba 708047 297547 42
Total 8231847 3275597 40.42
If they do not migrate, they won’t survive. In almost all the villages, people are heavily dependent on migrant labour. Many of them take advance from money lenders before leaving. Many migrant become bonded labour. Only few migrants earn enough to support elderly back at home.
Drying Water Resources
Ponds, lakes and other water resources are drying: This is very unfortunate because Bundelkhand has a rich history of tanks and other traditional water harvesting structures. Even today, many people in Bundelkand depend on tanks for irrigation. But there is no involvement of the administration on the maintenance of tanks and other rainwater harvesting structure.
In last twenty years, canals, tubewells have
28. Chanderpur Talbahat Lalitpur 1 – 2 98 – 99
29. Budauna Talbahat Lalitpur 1 – 2 98 – 99
30. Sunora Talbahat Lalitpur 4 – 5 95 – 96
31. Amkheda Madhogarh Jalaun 10 – 12 88 – 90
32. Daulatpur Madhogarh Jalaun 8 – 10 90 – 92
33. Dadanpur Madhogarh Jalaun 15 – 16 84 – 85
34. Gauricharya Rampura Jalaun 10 – 11 89 – 90
35. Sonipura Rampura Jalaun 6 – 7 93 – 94
36. Fatehpura Rampura Jalaun 9 – 10 90 – 91
37. Kaloliteer Barua Sumerpur Hamirpur 8 – 10 90 – 92
38. Sunjna Barua Sumerpur Hamirpur 12 – 15 85 – 87
39. Sikri Barua Sumerpur Hamirpur 10 – 12 88 – 90
40. Saduapurwa Barua Sumerpur Hamirpur 5 – 6 94 – 95
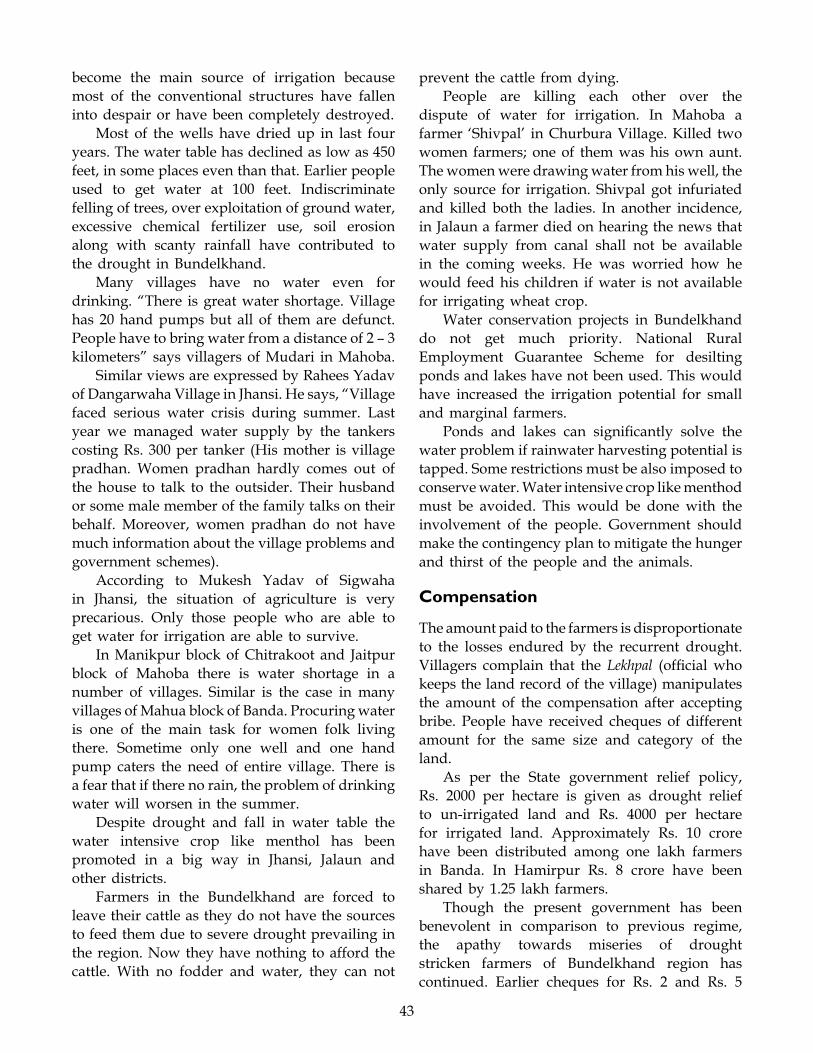
43
become the main source of irrigation because most of the conventional structures have fallen into despair or have been completely destroyed.
Most of the wells have dried up in last four years. The water table has declined as low as 450 feet, in some places even than that. Earlier people used to get water at 100 feet. Indiscriminate felling of trees, over exploitation of ground water, excessive chemical fertilizer use, soil erosion along with scanty rainfall have contributed to the drought in Bundelkhand.
Many villages have no water even for drinking. “There is great water shortage. Village has 20 hand pumps but all of them are defunct. People have to bring water from a distance of 2 – 3 kilometers” says villagers of Mudari in Mahoba.
Similar views are expressed by Rahees Yadav of Dangarwaha Village in Jhansi. He says, “Village faced serious water crisis during summer. Last year we managed water supply by the tankers costing Rs. 300 per tanker (His mother is village pradhan. Women pradhan hardly comes out of the house to talk to the outsider. Their husband or some male member of the family talks on their behalf. Moreover, women pradhan do not have much information about the village problems and government schemes).
According to Mukesh Yadav of Sigwaha in Jhansi, the situation of agriculture is very precarious. Only those people who are able to get water for irrigation are able to survive.
In Manikpur block of Chitrakoot and Jaitpur block of Mahoba there is water shortage in a number of villages. Similar is the case in many villages of Mahua block of Banda. Procuring water is one of the main task for women folk living there. Sometime only one well and one hand pump caters the need of entire village. There is a fear that if there no rain, the problem of drinking water will worsen in the summer.
Despite drought and fall in water table the water intensive crop like menthol has been promoted in a big way in Jhansi, Jalaun and other districts.
Farmers in the Bundelkhand are forced to leave their cattle as they do not have the sources to feed them due to severe drought prevailing in the region. Now they have nothing to afford the cattle. With no fodder and water, they can not
prevent the cattle from dying.People are killing each other over the
dispute of water for irrigation. In Mahoba a farmer ‘Shivpal’ in Churbura Village. Killed two women farmers; one of them was his own aunt. The women were drawing water from his well, the only source for irrigation. Shivpal got infuriated and killed both the ladies. In another incidence, in Jalaun a farmer died on hearing the news that water supply from canal shall not be available in the coming weeks. He was worried how he would feed his children if water is not available for irrigating wheat crop.
Water conservation projects in Bundelkhand do not get much priority. National Rural Employment Guarantee Scheme for desilting ponds and lakes have not been used. This would have increased the irrigation potential for small and marginal farmers.
Ponds and lakes can significantly solve the water problem if rainwater harvesting potential is tapped. Some restrictions must be also imposed to conserve water. Water intensive crop like menthod must be avoided. This would be done with the involvement of the people. Government should make the contingency plan to mitigate the hunger and thirst of the people and the animals.
Compensation
The amount paid to the farmers is disproportionate to the losses endured by the recurrent drought. Villagers complain that the Lekhpal (official who keeps the land record of the village) manipulates the amount of the compensation after accepting bribe. People have received cheques of different amount for the same size and category of the land.
As per the State government relief policy, Rs. 2000 per hectare is given as drought relief to un-irrigated land and Rs. 4000 per hectare for irrigated land. Approximately Rs. 10 crore have been distributed among one lakh farmers in Banda. In Hamirpur Rs. 8 crore have been shared by 1.25 lakh farmers.
Though the present government has been benevolent in comparison to previous regime, the apathy towards miseries of drought stricken farmers of Bundelkhand region has continued. Earlier cheques for Rs. 2 and Rs. 5
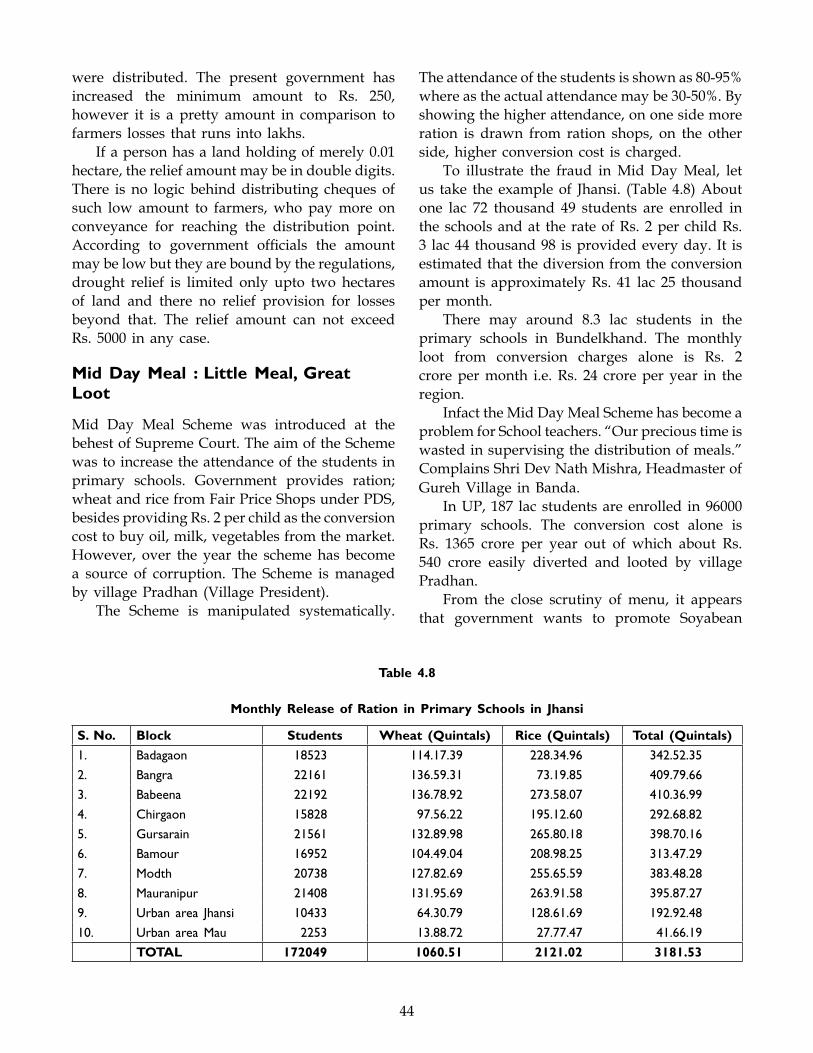
44
were distributed. The present government has increased the minimum amount to Rs. 250, however it is a pretty amount in comparison to farmers losses that runs into lakhs.
If a person has a land holding of merely 0.01 hectare, the relief amount may be in double digits. There is no logic behind distributing cheques of such low amount to farmers, who pay more on conveyance for reaching the distribution point. According to government officials the amount may be low but they are bound by the regulations, drought relief is limited only upto two hectares of land and there no relief provision for losses beyond that. The relief amount can not exceed Rs. 5000 in any case.
Mid Day Meal : Little Meal, Great Loot
Mid Day Meal Scheme was introduced at the behest of Supreme Court. The aim of the Scheme was to increase the attendance of the students in primary schools. Government provides ration; wheat and rice from Fair Price Shops under PDS, besides providing Rs. 2 per child as the conversion cost to buy oil, milk, vegetables from the market. However, over the year the scheme has become a source of corruption. The Scheme is managed by village Pradhan (Village President).
The Scheme is manipulated systematically.
The attendance of the students is shown as 80-95% where as the actual attendance may be 30-50%. By showing the higher attendance, on one side more ration is drawn from ration shops, on the other side, higher conversion cost is charged.
To illustrate the fraud in Mid Day Meal, let us take the example of Jhansi. (Table 4.8) About one lac 72 thousand 49 students are enrolled in the schools and at the rate of Rs. 2 per child Rs. 3 lac 44 thousand 98 is provided every day. It is estimated that the diversion from the conversion amount is approximately Rs. 41 lac 25 thousand per month.
There may around 8.3 lac students in the primary schools in Bundelkhand. The monthly loot from conversion charges alone is Rs. 2 crore per month i.e. Rs. 24 crore per year in the region.
Infact the Mid Day Meal Scheme has become a problem for School teachers. “Our precious time is wasted in supervising the distribution of meals.” Complains Shri Dev Nath Mishra, Headmaster of Gureh Village in Banda.
In UP, 187 lac students are enrolled in 96000 primary schools. The conversion cost alone is Rs. 1365 crore per year out of which about Rs. 540 crore easily diverted and looted by village Pradhan.
From the close scrutiny of menu, it appears that government wants to promote Soyabean
Table 4.8
Monthly Release of Ration in Primary Schools in Jhansi
S. No. Block Students Wheat (Quintals) Rice (Quintals) Total (Quintals)
1. Badagaon 18523 114.17.39 228.34.96 342.52.35
2. Bangra 22161 136.59.31 73.19.85 409.79.66
3. Babeena 22192 136.78.92 273.58.07 410.36.99
4. Chirgaon 15828 97.56.22 195.12.60 292.68.82
5. Gursarain 21561 132.89.98 265.80.18 398.70.16
6. Bamour 16952 104.49.04 208.98.25 313.47.29
7. Modth 20738 127.82.69 255.65.59 383.48.28
8. Mauranipur 21408 131.95.69 263.91.58 395.87.27
9. Urban area Jhansi 10433 64.30.79 128.61.69 192.92.48
10. Urban area Mau 2253 13.88.72 27.77.47 41.66.19
TOTAL 172049 1060.51 2121.02 3181.53
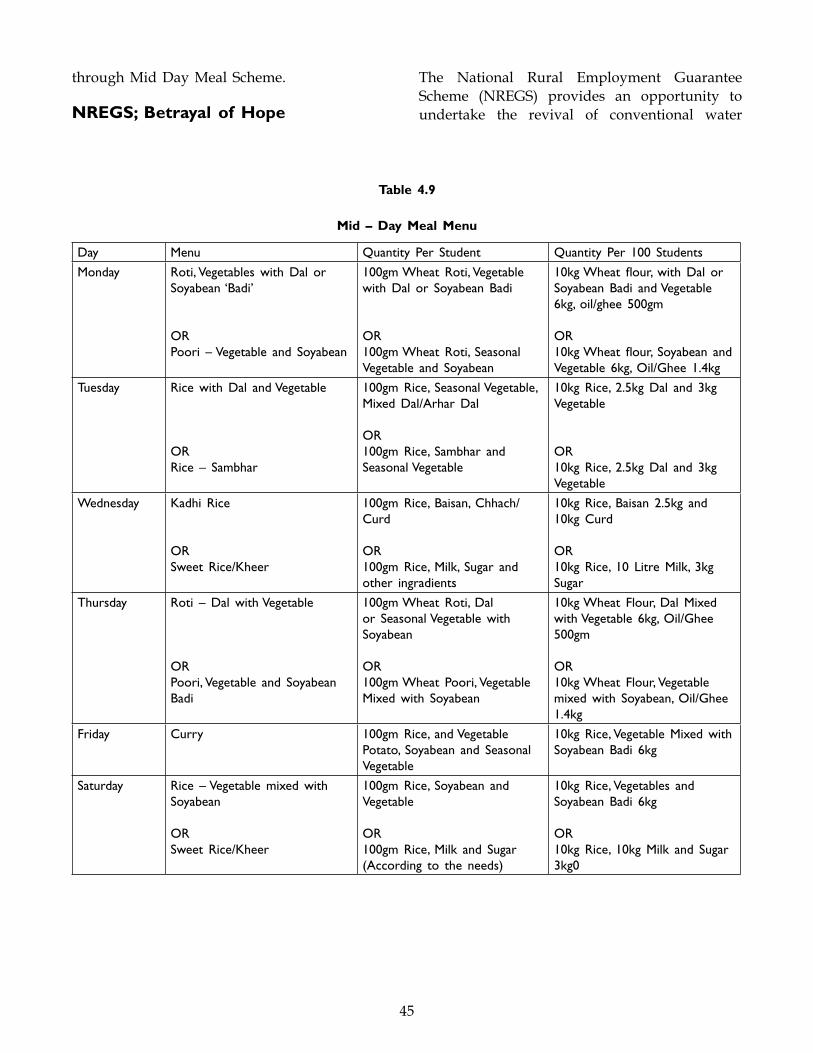
45
through Mid Day Meal Scheme.
NREGS; Betrayal of Hope
The National Rural Employment Guarantee Scheme (NREGS) provides an opportunity to undertake the revival of conventional water
Table 4.9
Mid – Day Meal Menu
Day Menu Quantity Per Student Quantity Per 100 Students
Monday Roti, Vegetables with Dal or Soyabean ‘Badi’
ORPoori – Vegetable and Soyabean
100gm Wheat Roti, Vegetable with Dal or Soyabean Badi
OR100gm Wheat Roti, Seasonal Vegetable and Soyabean
10kg Wheat flour, with Dal or Soyabean Badi and Vegetable 6kg, oil/ghee 500gm
OR10kg Wheat flour, Soyabean and Vegetable 6kg, Oil/Ghee 1.4kg
Tuesday Rice with Dal and Vegetable
ORRice – Sambhar
100gm Rice, Seasonal Vegetable, Mixed Dal/Arhar Dal
OR100gm Rice, Sambhar and Seasonal Vegetable
10kg Rice, 2.5kg Dal and 3kg Vegetable
OR10kg Rice, 2.5kg Dal and 3kg Vegetable
Wednesday Kadhi Rice
ORSweet Rice/Kheer
100gm Rice, Baisan, Chhach/Curd
OR100gm Rice, Milk, Sugar and other ingradients
10kg Rice, Baisan 2.5kg and 10kg Curd
OR10kg Rice, 10 Litre Milk, 3kg Sugar
Thursday Roti – Dal with Vegetable
ORPoori, Vegetable and Soyabean Badi
100gm Wheat Roti, Dal or Seasonal Vegetable with Soyabean
OR100gm Wheat Poori, Vegetable Mixed with Soyabean
10kg Wheat Flour, Dal Mixed with Vegetable 6kg, Oil/Ghee 500gm
OR10kg Wheat Flour, Vegetable mixed with Soyabean, Oil/Ghee 1.4kg
Friday Curry 100gm Rice, and Vegetable Potato, Soyabean and Seasonal Vegetable
10kg Rice, Vegetable Mixed with Soyabean Badi 6kg
Saturday Rice – Vegetable mixed with Soyabean
ORSweet Rice/Kheer
100gm Rice, Soyabean and Vegetable
OR100gm Rice, Milk and Sugar (According to the needs)
10kg Rice, Vegetables and Soyabean Badi 6kg
OR10kg Rice, 10kg Milk and Sugar 3kg0
46
harvesting structures in Bundelkhand. But unfortunately NREGS could not meet the desired results. It could have reduced the large scale migration which continues at an alarming rate.
An analysis of the work initiated under NREGS reveals that only 25 percent pertain to water conservation, where as about 30 percent is related to the road construction. In the quite drought-affected district of Banda, for example only 50 of more than 900 NREGS projects pertain to water conservation, while nearly 200 are road construction projects.
Possibilities of utilizing NIREGS have not been explored, such as desilting of ponds, regeneration of check dams, regeneration of the conventional water sources.
There were high hopes from NREGS to provide employment to the rural poor for 100 days. But no household gets the work for 100 days. Usually people get about 20-25 days. Those who get the work are paid much less than the statutory minimum wages of Rs. 100 per day.
Village Pradhan prepare the list of unskilled workers seeking one hundred days work. But the rolls are mostly fake and carry fictious names. Actually few people really exist to work against this list available with the Pradhan. This helps pradhan and village level worker (VLW) and the Block Development Officer (BDO) to extract huge funds from the District Rural Development Agency (DRDA). It is alleged that apart from pradhan, DRDA officials are the great beneficiary of this scheme.
For the pradhan, BDO and VLW the muster roll carrying the names of card holders are the secret documents. They deny access to these rolls. Some workers do not even get their job cards as these remained with the pradhan or village official who make false entries and corner the funds.
The draft audit report by the Comptroller General of India (CAG) has highlighted the significant deficiencies in the NREGS implementation. The performance audit, carried out in randomly selected 68 districts across 26 showed that barely 3.2 percent of the registered households could avail of 100 days of employment in one year. And the average employment provided under the scheme was just 18 days.The audit also cited specific instances from
all states of alleged corruption, inefficiency, diversion and mis-utilisation of funds and unreliable figures. Frequent complaints were received by the Union Ministry for Rural Development and the monitors were appointed to verify these complaints. But even this monitoring system failed to secure the huge money of the tax payers from getting diverted into the hands of those involved in the execution of the scheme.
Chulahbandi
To save the people from hunger deaths a novel movement called, ‘Chulahbandi’ has been launched in some villages of Bundelkhand. Chulahbandi means to abstain from cooking meal on a particular day and donate it to others who had nothing to eat.
The main person behind the movement was Shri Rajendra Singh of Padui Village in Banda in July 2006. Unfortunately Rajendra Singh died at the early age of 29 years in Tata Memorial Cancer Hospital in Bombay. Now, Pushpendra Bhai, a well known activist of Bundelkhand and a close associate of Navdanya is leading the movement.
Pushpendra Bhai tells the incidence of Adauli Village in Baberu tehsil where an old widow ‘Devrati’ had nothing to eat for several days. She could not believe her eyes when the entire village went to her house with food. The success of the movement has crossed the U.P. boarder and reached Madhya Pradesh covering 156 villages.
(v) Social exclusion and Hunger
In addition to poverty and gender, many social barriers prevent people from securing their rights to food. People belonging to certain communities, tribes, Musahar, Scheduled Castes carry a disproportionate burden of poverty and there by hunger.
World Bank observes that malnutrition in India is a concentrated phenomenon – five states and 50% of villages account for about 80% of the malnutrition cases. Half of the country’s malnourished children live in rural areas. Boys and girls from the scheduled tribes account for 56.2% of the malnourished children. Madhya
47
Pradesh, Chhattisgarh, Jharkhand, Bihar, Orissa, Uttar Pradesh and Rajasthan, all with sizeable adivasi population, account for about 43% of India’s hungry children. The Musahar children would be among the 60 million malnourished children in India that another recent World Bank report titled ‘India’s Undernourished Children : A Call for Reform and Action’, speaks of. They remain hungry in spite of the world’s largest feeding programme for school children. Often the mid-day meal in school is the only meal that children get to eat all day. (Malekar, 2006)
The Musahars are recognized as a scheduled caste (SC). They survive on the margins of villages in isolated settlements. Their traditional occupation was hunting out rats from burrows in the fields. In return they were allowed to keep the grain and chaff recovered from the rat holes. In times of drought and food scarcity, the Musahars families work as bonded labourers at brick kilns.
Musahars largely live on the banks of the Gandak and its tributaries in Eastern UP and Bihar.
The Musahars have mostly been denied the benefits of the government’s food security and employment guarantee schemes. When they demand their rights, the upper castes abuse them and the official machinery says they are Naxalites.
In the eastern UP districts of Varanasi, Sonebhadra, Jaunpur, Khusinagar and Mirzapur, where Musahar deaths are frequently reported, only 31% of children under six years are covered by the Integrated Child Development Services (ICDS).
Deaths related to starvation have been reported in other very backward communities of Uttar Pradesh, like the Nuts, a community of alms-seekers, the Ghasias or grass-cutters, and the Bunkars or weavers. In the weavers’ colony of Baghwa Nala in Varanasi, thousands of looms are lying idle because cheap Chinese yarn and silk fabric imports have deluged the Indian market. Scores of weavers who made the famous Banarasi silk saris are out of work and facing starvation.
Across villages and hamlets in melghat 750 kilometers away from Bombay in Maharashtra’a Amravati district, many in the Korku community
are similarly afflicted. Some years ago, the Maharashtra government appointed a committee of doctors. It declared that sickle cell anaemia was rampant among the Korkus. The implied excuse was: if the Korkus were born with a genetic “defect”, what could the government do? However, this anaemic condition could itself be the slow outcome of generations of malnutrition. Can India ignore 500,000 adivasi citizens (about 240,000 in Maharashtra and the others across the border in Madhya Pradesh) by saying they are genetically predisposed to certain health problems?
Denial of access to products like Mahua, tendu leaf and edible gum proved a matter of life and death for adivasis. Today, they can not collect forest produce in large quantities to sell.
A study with the survivors of the 2002 carnage in Gujarat, which took the lives of more than 2000 Muslim men, women and children and rendered more than 200,000 homeless, highlights the intense food vulnerability of survivors of conflict and ethnic violence.
Another study regarding the prevalence and severity of malnutrition among children living in the slums in Bombay revealed that 63%, were mal nourished, 10% in serious Grade 3. Most of the chidren belonged to families of construction labourers, domestic workers, ragpickers scavenger or beggars. The lack of regular income for the parents had a direct impact on the children. There are nearly 2 million children living in the slums and on the pavements of Bombay.
The study looked at protein energy malnutrition. It is characterized by inadequate calonies and protein for growth and maintenance. As a consequence it is infants and children that are the most susceptible because their requirements for growth include high energy protein needs.
An examination by income shows that the prevalence of severe malnutrition is more than twice in the poorest households as compared to the economically better-off households. That is, the poorest children are carrying the burden of under-nutrition. The links of poor nutrition to a poor quality of life are well-known. Children are more susceptible to disease partly due to the association between nutrition and immunity, but also because the more under-nourished children
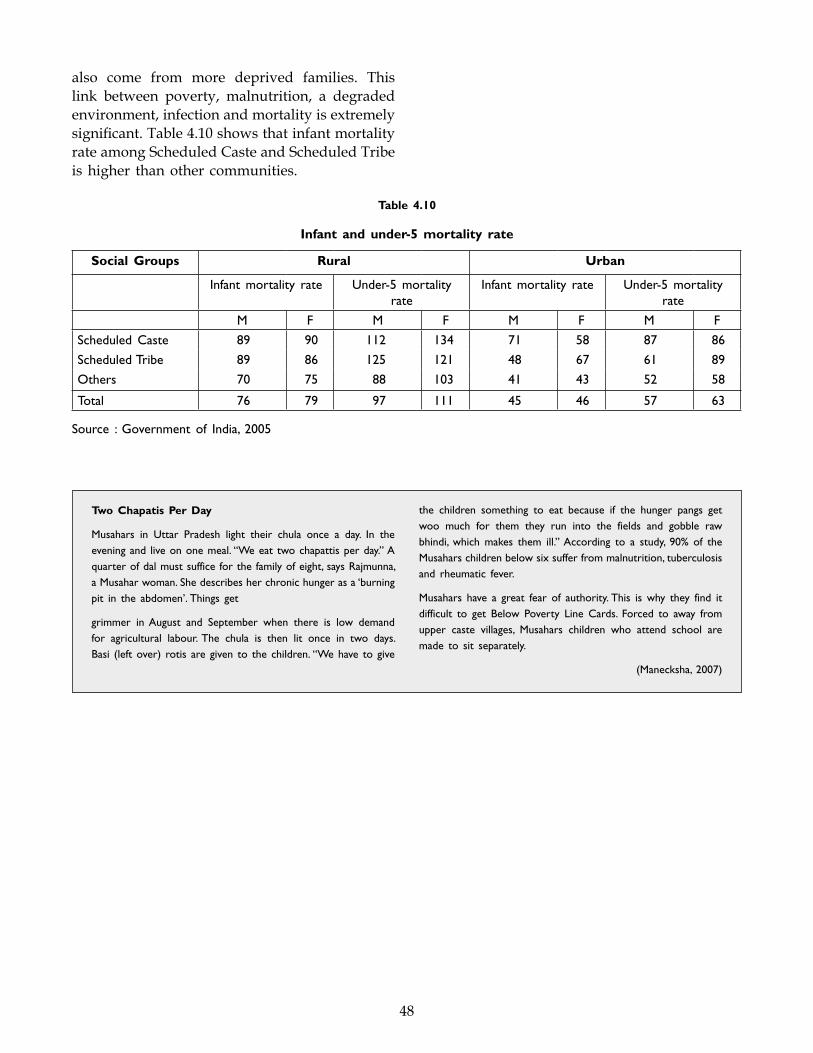
48
also come from more deprived families. This link between poverty, malnutrition, a degraded environment, infection and mortality is extremely significant. Table 4.10 shows that infant mortality rate among Scheduled Caste and Scheduled Tribe is higher than other communities.
Table 4.10
Infant and under-5 mortality rate
Social Groups Rural Urban
Infant mortality rate Under-5 mortality rate
Infant mortality rate Under-5 mortality rate
M F M F M F M F
Scheduled Caste 89 90 112 134 71 58 87 86
Scheduled Tribe 89 86 125 121 48 67 61 89
Others 70 75 88 103 41 43 52 58
Total 76 79 97 111 45 46 57 63
Source : Government of India, 2005
Two Chapatis Per Day
Musahars in Uttar Pradesh light their chula once a day. In the evening and live on one meal. “We eat two chapattis per day.” A quarter of dal must suffice for the family of eight, says Rajmunna, a Musahar woman. She describes her chronic hunger as a ‘burning pit in the abdomen’. Things get
grimmer in August and September when there is low demand for agricultural labour. The chula is then lit once in two days. Basi (left over) rotis are given to the children. “We have to give
the children something to eat because if the hunger pangs get woo much for them they run into the fields and gobble raw bhindi, which makes them ill.” According to a study, 90% of the Musahars children below six suffer from malnutrition, tuberculosis and rheumatic fever.
Musahars have a great fear of authority. This is why they find it difficult to get Below Poverty Line Cards. Forced to away from upper caste villages, Musahars children who attend school are made to sit separately.
(Manecksha, 2007)
49
Public Distribution system (PDS) has been one of the most crucial elements on food
policy and food security system in the country. It started as a rationing system in the backdrop of Bengal famine in 1943, as well as a wartime measure during the Second World War. Over the years, the system expanded enormously emerging as a poverty alleviation measure to become a permanent feature in Indian food economy. In the context of new economic and liberalization policy, it is regarded as a safety net to the poor whose number is more than 330 million and are nutritionally at risk. (Jena, 2002)
With a network of about 451000 Fair Price Shops (FPS) for the distribution of commodities worth over Rs. 150 billion to about 180 million households through out the country, the PDS in India has perhaps the largest distribution network of its type in the world. PDS is a rationing mechanism, entitles households to essential commodities such as rice, wheat, sugar, Kerosene and edible oils at subsidized rates through PDS. The responsibility of operating them is shared by Central and State governments. The Central government procures stocks and supplies the grain and absorbs the cost of these operations, while the state governments ‘lift’ the grains’ and distribute these to retail PDS out lets. (Patnaik, 2004)
The first plan emphasized the distribution of food grain through the statutory rationing system in cities/towns above 50,000 populations and also in highly deficit areas. During the Second Plan, the coverage of PDS was extended from food grain to other essential commodities. The Third Five Year Plan placed the importance on public procurement and distribution system for price stabilization. The approach was to introduce institutional changes in the private trade mechanism by including
consumer cooperatives. In the Fourth Plan, the scope of PDS was further widened. Then system was extended to all the rural areas and other goods of mass consumption were also distributed with the help of cooperative stores. In the Fifth Plan, PDS was focused on the poor and it was related to prices, income and wage policy. The Sixth Plan emphasized public distribution of food grains to the disadvantaged groups. During the Seventh Plan, it was included as an item of the Minimum Needs Programme. During the Eighth Plan, emphasis was on intensification of PDS in rural /disadvantaged areas covering several mass consumption articles (salt, pulses, soap, tea etc), in addition to the six mandatory commodities (rice, wheat, sugar, edible oil, kerosene and soft coke) and developing infrastructure in terms of creation of new fair price shops and godowns. The Ninth Five Year Plan had taken a broader view of food security to include nutritional security. It categorically states.” Food and nutrition security is one of the main objectives. It calls for long term measures for eradication of hunger and starvation by ensuring availability, accessibility ad affordability of balanced food and nutrition for all. During the Tenth Plan, the approach is to meet the challenge to reduce increase in food stokes to roughly half of its present level.
The brief account of the Food Policy and public distribution system in the last five decades shows that barring two spells of decontrol – a brief one in 1947-48 and one from 1954 to 1956-57 some sort of food control was prevalent. As observed in a democratic set up, with government responsible to the people, on a situation of overall shortages of food and fluctuation in agriculture production, the distribution could not be left to the private traders and free market mechanism.
Though the Indian PDS is now over 60 years
CHAPTER – 5
Dismantling the Public Distribution System (PDS)
50
old, the origin of the system in its present form and infrastructure for procurement, storage and distribution of food grains can be traced to the setting up of the Food Corporation of India (FCI) in 1965 by an Act of Parliament called the Food Corporation of India Act 1964. The three objectives cited for the creation of this organization as partial of the country’s food police were. (Sud, 2004)
a. To protect interest of the farmers and producers by providing them remunerative prices
b. To provide food grains, especially to the vulnerable sections of the society at reasonable prices; and
c. To provide food security by maintaining buffer stocks of food grains to meet the exigencies arising out of natural calamities like droughts, floods, cyclone etc.
The present revamped and targeted PDS (TDPS) came into being in June 1997. However this has been a total failure. Though food grains are issued under the TPDS to people below poverty line (BPL) as well as to those above poverty line (APL) but the prices charged are different to ensure that the system caters more to the needs of the poor than the economically better off section. Under the TPDS, the states are given the responsibility to identify the BPL families based on the recommendations of the Planning Commission. A quantity of 10 kg of food grains for family per month used to be issued to these families initially. But the limit was raised first to 25 kg and again 35 kg per month from April 2002. The grains are issued at highly subsidized rates, much below the Central Issue Price (CIP). For, the families falling in the APL category, on the other hand, the food grains are issued at rates at per with the CIP.
Keeping in view the malfunctioning of the PDS, including leakages of food grains and other malpractices adopted by the operation of FPS, a PDS (Control) order 2001 was issued under the Essential Commodities Act. This order sought to ensure timely supply of rations from all the 4.62 lac FPS in the country. It also laid down norms for identifications of BPL families, distribution of ration cards, scale and issue prices of items distributed through the FPS, fair distribution of
food grains, licensing of FPS and monitoring of their function. Besides, the order provides for punishment to those who violated its provision.
Moreover investigations into the starvation deaths have ascertained the view that poverty prevents many ration cardholders from benefiting from the subsidized sale of food grain through the PDS. The holders of Antyodaya card are more vulnerable to this phenomenon. For instance, the officials who had probed into the starvation deaths in Ryagada and Keonjhar district of Orissa in 2002 had made some appalling observation in this regard in their report. According to the report, one woman who was supposed to have died of hunger was earning merely Rs. 100 per month, obviously she was unable to buy food grains even at highly reduced rates. In another case, the victim had mortgaged his ration card to a moneylender to borrow some tiny sum. What is more discomforting is that mortgaging of ratio cards is found to be a regular practice in the poverty-ridden belt.
The abject poverty is fraught with disastrous consequences. There are reports of babies being sold for paltry sums, in some cases for merely Rs 10 baby. Turning to other problem of malnutrition, the Second National Family Health survey reveals that about half of all the children below the age of three are under nourished and according to the latest Human Development Report, India has the highest levels of child under-nutrition in the world, along with Bangladesh and Nepal. According to UNICEF, one third of all malnourished children of the world are in India.
One of the latest tricks played on the masses is the concept of below the poverty line (BPL). The criteria adopted to declare the people as BPL are based on questionable parameters. If the concept of BPL was intended to be made the yard stick for removing poverty, it was required to be premised on rational and objective criteria with real honesty and sincerity. Mihir Shah, designated Advisor to the National Commission appointed by the Supreme Court in the Right to Food case, while questioning the distinction of poor introduced as Below Poverty Line and above Poverty Line, points out that while official data themselves show that 50 percent of Indians are chronically
51
malnourished, less than 30 percent belong to the governments BPL category. Most astonishingly, just one percent of ration card holders were declared BPL in Mumbai and Thane district. Also it was laughable that in Dharavi, Asia’s largest Slum, only 151 families were identified as BPL. (Outlook, 2001)
Apparently, the intentions of the ruling classes are suspicious in as much as the so-called reform agenda began dismantling the centralized food system by revamping the PDS into BPL and APL. While the stated aim was to reduce the burden of subsidy by improving targeting, it resulted in a dramatic fall in the off-take from the PDS. The result was that even at BPL prices, the rural poor, who constitute the majority, lack the purchasing power to buy food grains from the fair price shops. (Arora, 2004)
Now, India has less rice in its granaries that what is required to store under the minimum buffer stock norms. The country’s total reserve food stock, which has been depleting for the past several months, has come to very close to the minimum level, which must be maintained for food security reason. Total food stock reserves have dipped to 20.3 million tones as on October 1, 2004 from a peak of 64.8 million tones as on June 1, 2003. The October 2004 stock is the lowest in the current year and just 11 percent more than the minimum buffer stock requirement of 18.1 tonnes. (Chandra, 2004)
Yet corruption is involved in the Public Distribution System. Food grains meant for the poorest of the poor never reach them. Instead, government officials become the beneficiaries of the many schemes. Food grains get sold in the black market through a well-networked mafia. Politicians get their share too in lieu of the patonage provided to the mafia. (Khetan, 2005a)
The inquiry report of the vigilance cell of the Uttar Pradesh Food and Civil supplies department is chilling. In Lakhimpur Khiri district alone, during last few years, food grains worth of Rs. 250 crore, which should have been distributed to the people below the poverty line, had instead been sold in the black market. Every one from the district magistrates to the Sub-divisional magistrate to the state food corporations officials are the beneficiaries of the loot. The figure of Rs.
250 crore relates to the food grain that had been siphoned off under just one poverty alleviation programme – the BPL scheme of PDS. There are other half a dozen other schemes under which food grain are being allocated to the districts for distribution among the poor.
Similar is the story of Sitapur district where the villagers have not got a grain under the BPL scheme. Their cards expired in 2002. The cards, which should have been their passports to some food are just a sad and cruel testimony to the greed of their perpetrators. A greed that has left them starving. A greed that knows no human bounds. Even in Delhi senior politicians in government are at the centre of the scam. Not surprising them that the economist Jean Derez has estimated that theft from the Public Distribution System is as high as 67 percent. (Khetan, 2005b)
Food grain export is liberalization’s answer to the problem of over procurement from farmers even while it will bring in much needed foreign exchange. However, ever since W.T.O. Indian agriculture exports as part of India’s total exports as well as their value in hard cash has actually declined.
Internationally, food is being traded by powerful multinational companies. By passing on the reins of the nations food security to these companies and the trading blocks through a policing system under the WTO. India is witnessing a gradual collapse of food self-sufficiency and the scrapping of the public distribution system, the very foundations of food security.
Food security, therefore, can only be ensured if the developing countries have provisions and powers to re-enforce quantitative restrictions. No amount of tinkering with suitable clauses on market access, domestic support and export subsidies is going to serve the food security needs of the developing countries. As long as the subsidies – both explicit and implicit – are not brought down to zero in the developed world, the developing countries should have the provision to continue with the quantitative restrictions. After all, border protection is the only way for the developing countries to avoid being inundated by cheap and highly subsidized food and agricultural commodity imports.
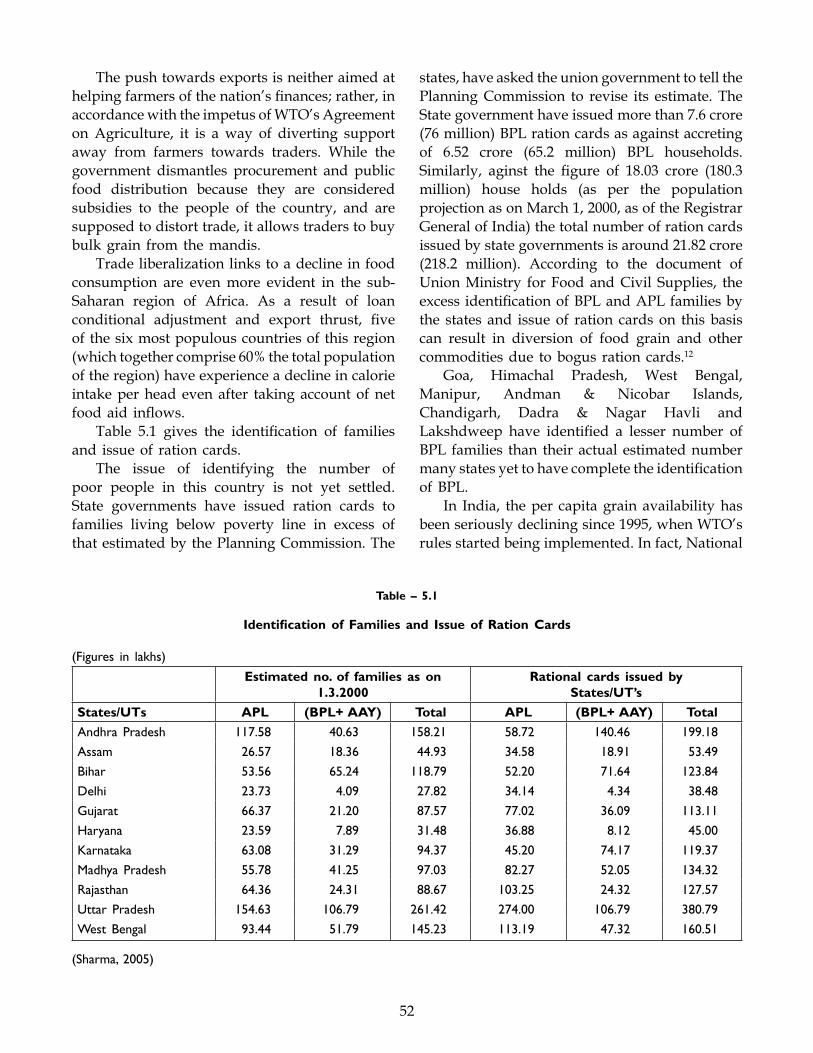
52
The push towards exports is neither aimed at helping farmers of the nation’s finances; rather, in accordance with the impetus of WTO’s Agreement on Agriculture, it is a way of diverting support away from farmers towards traders. While the government dismantles procurement and public food distribution because they are considered subsidies to the people of the country, and are supposed to distort trade, it allows traders to buy bulk grain from the mandis.
Trade liberalization links to a decline in food consumption are even more evident in the sub-Saharan region of Africa. As a result of loan conditional adjustment and export thrust, five of the six most populous countries of this region (which together comprise 60% the total population of the region) have experience a decline in calorie intake per head even after taking account of net food aid inflows.
Table 5.1 gives the identification of families and issue of ration cards.
The issue of identifying the number of poor people in this country is not yet settled. State governments have issued ration cards to families living below poverty line in excess of that estimated by the Planning Commission. The
states, have asked the union government to tell the Planning Commission to revise its estimate. The State government have issued more than 7.6 crore (76 million) BPL ration cards as against accreting of 6.52 crore (65.2 million) BPL households. Similarly, aginst the figure of 18.03 crore (180.3 million) house holds (as per the population projection as on March 1, 2000, as of the Registrar General of India) the total number of ration cards issued by state governments is around 21.82 crore (218.2 million). According to the document of Union Ministry for Food and Civil Supplies, the excess identification of BPL and APL families by the states and issue of ration cards on this basis can result in diversion of food grain and other commodities due to bogus ration cards.12
Goa, Himachal Pradesh, West Bengal, Manipur, Andman & Nicobar Islands, Chandigarh, Dadra & Nagar Havli and Lakshdweep have identified a lesser number of BPL families than their actual estimated number many states yet to have complete the identification of BPL.
In India, the per capita grain availability has been seriously declining since 1995, when WTO’s rules started being implemented. In fact, National
Table – 5.1
Identification of Families and Issue of Ration Cards
(Figures in lakhs)
Estimated no. of families as on 1.3.2000
Rational cards issued by States/UT’s
States/UTs APL (BPL+ AAY) Total APL (BPL+ AAY) Total
Andhra Pradesh 117.58 40.63 158.21 58.72 140.46 199.18
Assam 26.57 18.36 44.93 34.58 18.91 53.49
Bihar 53.56 65.24 118.79 52.20 71.64 123.84
Delhi 23.73 4.09 27.82 34.14 4.34 38.48
Gujarat 66.37 21.20 87.57 77.02 36.09 113.11
Haryana 23.59 7.89 31.48 36.88 8.12 45.00
Karnataka 63.08 31.29 94.37 45.20 74.17 119.37
Madhya Pradesh 55.78 41.25 97.03 82.27 52.05 134.32
Rajasthan 64.36 24.31 88.67 103.25 24.32 127.57
Uttar Pradesh 154.63 106.79 261.42 274.00 106.79 380.79
West Bengal 93.44 51.79 145.23 113.19 47.32 160.51
(Sharma, 2005)
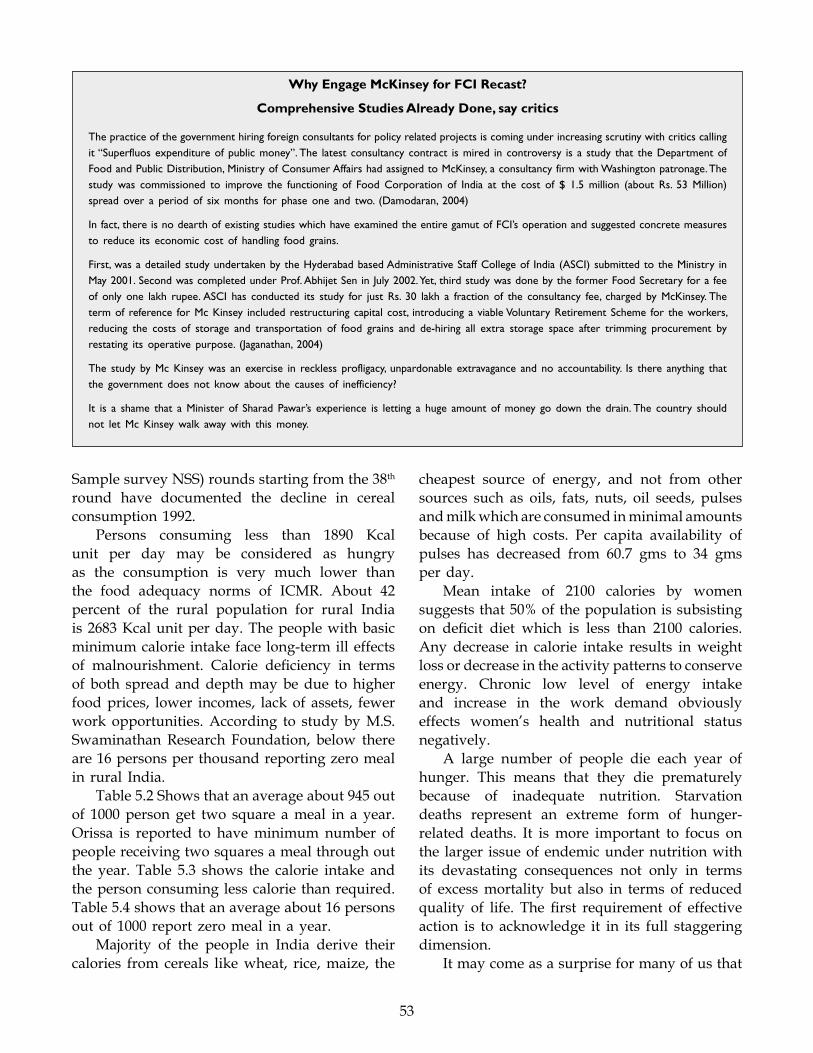
53
Sample survey NSS) rounds starting from the 38th round have documented the decline in cereal consumption 1992.
Persons consuming less than 1890 Kcal unit per day may be considered as hungry as the consumption is very much lower than the food adequacy norms of ICMR. About 42 percent of the rural population for rural India is 2683 Kcal unit per day. The people with basic minimum calorie intake face long-term ill effects of malnourishment. Calorie deficiency in terms of both spread and depth may be due to higher food prices, lower incomes, lack of assets, fewer work opportunities. According to study by M.S. Swaminathan Research Foundation, below there are 16 persons per thousand reporting zero meal in rural India.
Table 5.2 Shows that an average about 945 out of 1000 person get two square a meal in a year. Orissa is reported to have minimum number of people receiving two squares a meal through out the year. Table 5.3 shows the calorie intake and the person consuming less calorie than required. Table 5.4 shows that an average about 16 persons out of 1000 report zero meal in a year.
Majority of the people in India derive their calories from cereals like wheat, rice, maize, the
cheapest source of energy, and not from other sources such as oils, fats, nuts, oil seeds, pulses and milk which are consumed in minimal amounts because of high costs. Per capita availability of pulses has decreased from 60.7 gms to 34 gms per day.
Mean intake of 2100 calories by women suggests that 50% of the population is subsisting on deficit diet which is less than 2100 calories. Any decrease in calorie intake results in weight loss or decrease in the activity patterns to conserve energy. Chronic low level of energy intake and increase in the work demand obviously effects women’s health and nutritional status negatively.
A large number of people die each year of hunger. This means that they die prematurely because of inadequate nutrition. Starvation deaths represent an extreme form of hunger-related deaths. It is more important to focus on the larger issue of endemic under nutrition with its devastating consequences not only in terms of excess mortality but also in terms of reduced quality of life. The first requirement of effective action is to acknowledge it in its full staggering dimension.
It may come as a surprise for many of us that
Why Engage McKinsey for FCI Recast?
Comprehensive Studies Already Done, say critics
The practice of the government hiring foreign consultants for policy related projects is coming under increasing scrutiny with critics calling it “Superfluos expenditure of public money”. The latest consultancy contract is mired in controversy is a study that the Department of Food and Public Distribution, Ministry of Consumer Affairs had assigned to McKinsey, a consultancy firm with Washington patronage. The study was commissioned to improve the functioning of Food Corporation of India at the cost of $ 1.5 million (about Rs. 53 Million) spread over a period of six months for phase one and two. (Damodaran, 2004)
In fact, there is no dearth of existing studies which have examined the entire gamut of FCI’s operation and suggested concrete measures to reduce its economic cost of handling food grains.
First, was a detailed study undertaken by the Hyderabad based Administrative Staff College of India (ASCI) submitted to the Ministry in May 2001. Second was completed under Prof. Abhijet Sen in July 2002. Yet, third study was done by the former Food Secretary for a fee of only one lakh rupee. ASCI has conducted its study for just Rs. 30 lakh a fraction of the consultancy fee, charged by McKinsey. The term of reference for Mc Kinsey included restructuring capital cost, introducing a viable Voluntary Retirement Scheme for the workers, reducing the costs of storage and transportation of food grains and de-hiring all extra storage space after trimming procurement by restating its operative purpose. (Jaganathan, 2004)
The study by Mc Kinsey was an exercise in reckless profligacy, unpardonable extravagance and no accountability. Is there anything that the government does not know about the causes of inefficiency?
It is a shame that a Minister of Sharad Pawar’s experience is letting a huge amount of money go down the drain. The country should not let Mc Kinsey walk away with this money.
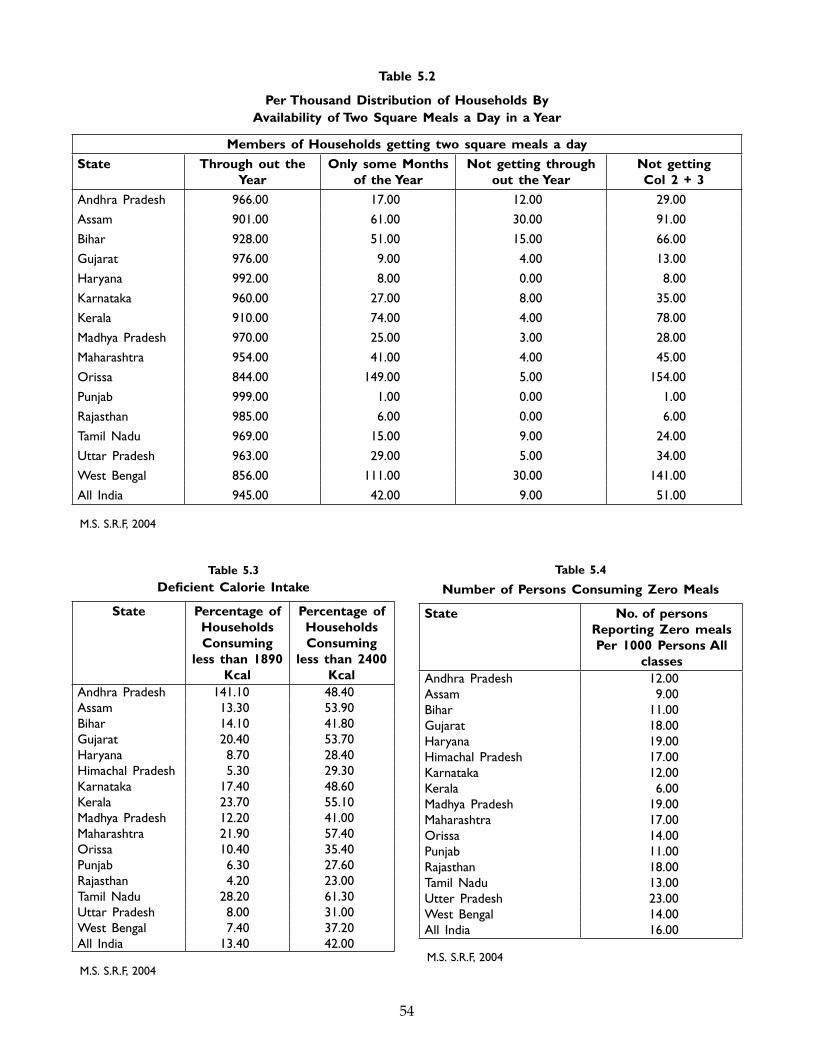
54
Table 5.3Deficient Calorie Intake
State Percentage of Households Consuming
less than 1890 Kcal
Percentage of Households Consuming
less than 2400 Kcal
Andhra Pradesh 141.10 48.40Assam 13.30 53.90Bihar 14.10 41.80Gujarat 20.40 53.70Haryana 8.70 28.40Himachal Pradesh 5.30 29.30Karnataka 17.40 48.60Kerala 23.70 55.10Madhya Pradesh 12.20 41.00Maharashtra 21.90 57.40Orissa 10.40 35.40Punjab 6.30 27.60Rajasthan 4.20 23.00Tamil Nadu 28.20 61.30Uttar Pradesh 8.00 31.00West Bengal 7.40 37.20All India 13.40 42.00
M.S. S.R.F, 2004
Table 5.4
Number of Persons Consuming Zero Meals
State No. of persons Reporting Zero meals Per 1000 Persons All
classesAndhra Pradesh 12.00Assam 9.00Bihar 11.00Gujarat 18.00Haryana 19.00Himachal Pradesh 17.00Karnataka 12.00Kerala 6.00Madhya Pradesh 19.00Maharashtra 17.00Orissa 14.00Punjab 11.00Rajasthan 18.00Tamil Nadu 13.00Utter Pradesh 23.00West Bengal 14.00All India 16.00
M.S. S.R.F, 2004
Table 5.2
Per Thousand Distribution of Households By Availability of Two Square Meals a Day in a Year
Members of Households getting two square meals a day
State Through out the Year
Only some Monthsof the Year
Not getting throughout the Year
Not getting Col 2 + 3
Andhra Pradesh 966.00 17.00 12.00 29.00
Assam 901.00 61.00 30.00 91.00
Bihar 928.00 51.00 15.00 66.00
Gujarat 976.00 9.00 4.00 13.00
Haryana 992.00 8.00 0.00 8.00
Karnataka 960.00 27.00 8.00 35.00
Kerala 910.00 74.00 4.00 78.00
Madhya Pradesh 970.00 25.00 3.00 28.00
Maharashtra 954.00 41.00 4.00 45.00
Orissa 844.00 149.00 5.00 154.00
Punjab 999.00 1.00 0.00 1.00
Rajasthan 985.00 6.00 0.00 6.00
Tamil Nadu 969.00 15.00 9.00 24.00
Uttar Pradesh 963.00 29.00 5.00 34.00
West Bengal 856.00 111.00 30.00 141.00
All India 945.00 42.00 9.00 51.00
M.S. S.R.F, 2004
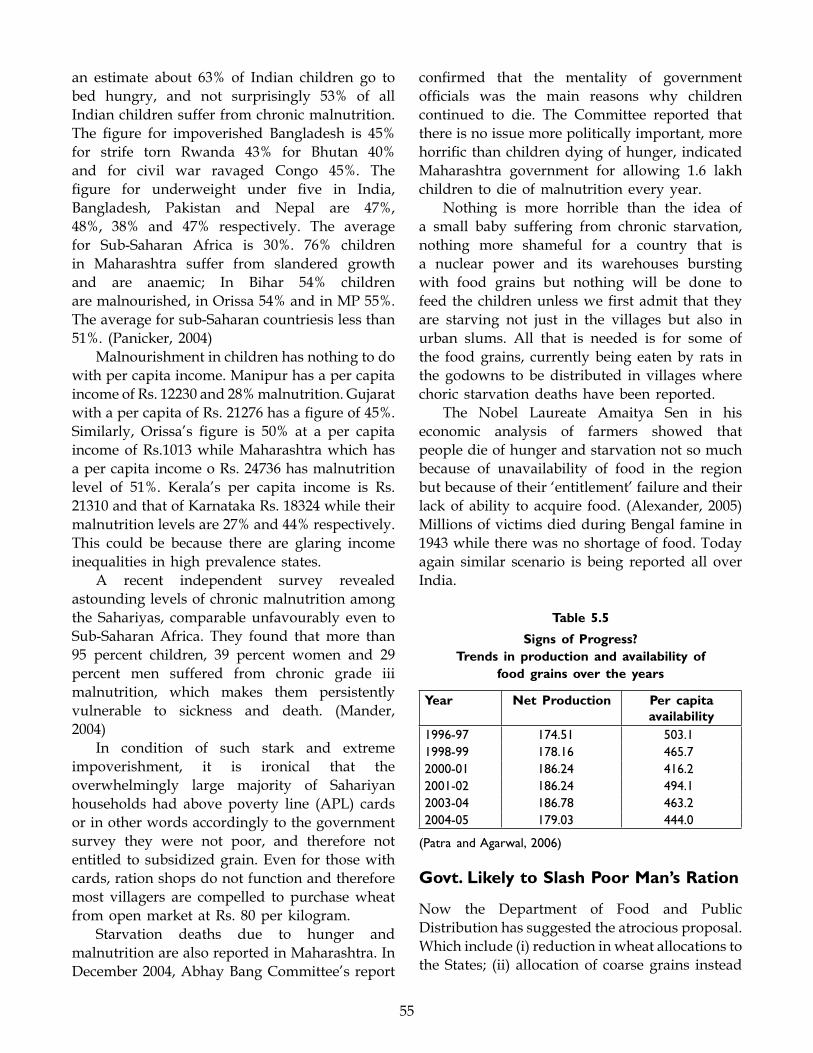
55
confirmed that the mentality of government officials was the main reasons why children continued to die. The Committee reported that there is no issue more politically important, more horrific than children dying of hunger, indicated Maharashtra government for allowing 1.6 lakh children to die of malnutrition every year.
Nothing is more horrible than the idea of a small baby suffering from chronic starvation, nothing more shameful for a country that is a nuclear power and its warehouses bursting with food grains but nothing will be done to feed the children unless we first admit that they are starving not just in the villages but also in urban slums. All that is needed is for some of the food grains, currently being eaten by rats in the godowns to be distributed in villages where choric starvation deaths have been reported.
The Nobel Laureate Amaitya Sen in his economic analysis of farmers showed that people die of hunger and starvation not so much because of unavailability of food in the region but because of their ‘entitlement’ failure and their lack of ability to acquire food. (Alexander, 2005) Millions of victims died during Bengal famine in 1943 while there was no shortage of food. Today again similar scenario is being reported all over India.
Table 5.5
Signs of Progress?Trends in production and availability of
food grains over the years
Year Net Production Per capita availability
1996-97 174.51 503.11998-99 178.16 465.72000-01 186.24 416.22001-02 186.24 494.12003-04 186.78 463.22004-05 179.03 444.0
(Patra and Agarwal, 2006)
Govt. Likely to Slash Poor Man’s Ration
Now the Department of Food and Public Distribution has suggested the atrocious proposal. Which include (i) reduction in wheat allocations to the States; (ii) allocation of coarse grains instead
an estimate about 63% of Indian children go to bed hungry, and not surprisingly 53% of all Indian children suffer from chronic malnutrition. The figure for impoverished Bangladesh is 45% for strife torn Rwanda 43% for Bhutan 40% and for civil war ravaged Congo 45%. The figure for underweight under five in India, Bangladesh, Pakistan and Nepal are 47%, 48%, 38% and 47% respectively. The average for Sub-Saharan Africa is 30%. 76% children in Maharashtra suffer from slandered growth and are anaemic; In Bihar 54% children are malnourished, in Orissa 54% and in MP 55%. The average for sub-Saharan countriesis less than 51%. (Panicker, 2004)
Malnourishment in children has nothing to do with per capita income. Manipur has a per capita income of Rs. 12230 and 28% malnutrition. Gujarat with a per capita of Rs. 21276 has a figure of 45%. Similarly, Orissa’s figure is 50% at a per capita income of Rs.1013 while Maharashtra which has a per capita income o Rs. 24736 has malnutrition level of 51%. Kerala’s per capita income is Rs. 21310 and that of Karnataka Rs. 18324 while their malnutrition levels are 27% and 44% respectively. This could be because there are glaring income inequalities in high prevalence states.
A recent independent survey revealed astounding levels of chronic malnutrition among the Sahariyas, comparable unfavourably even to Sub-Saharan Africa. They found that more than 95 percent children, 39 percent women and 29 percent men suffered from chronic grade iii malnutrition, which makes them persistently vulnerable to sickness and death. (Mander, 2004)
In condition of such stark and extreme impoverishment, it is ironical that the overwhelmingly large majority of Sahariyan households had above poverty line (APL) cards or in other words accordingly to the government survey they were not poor, and therefore not entitled to subsidized grain. Even for those with cards, ration shops do not function and therefore most villagers are compelled to purchase wheat from open market at Rs. 80 per kilogram.
Starvation deaths due to hunger and malnutrition are also reported in Maharashtra. In December 2004, Abhay Bang Committee’s report
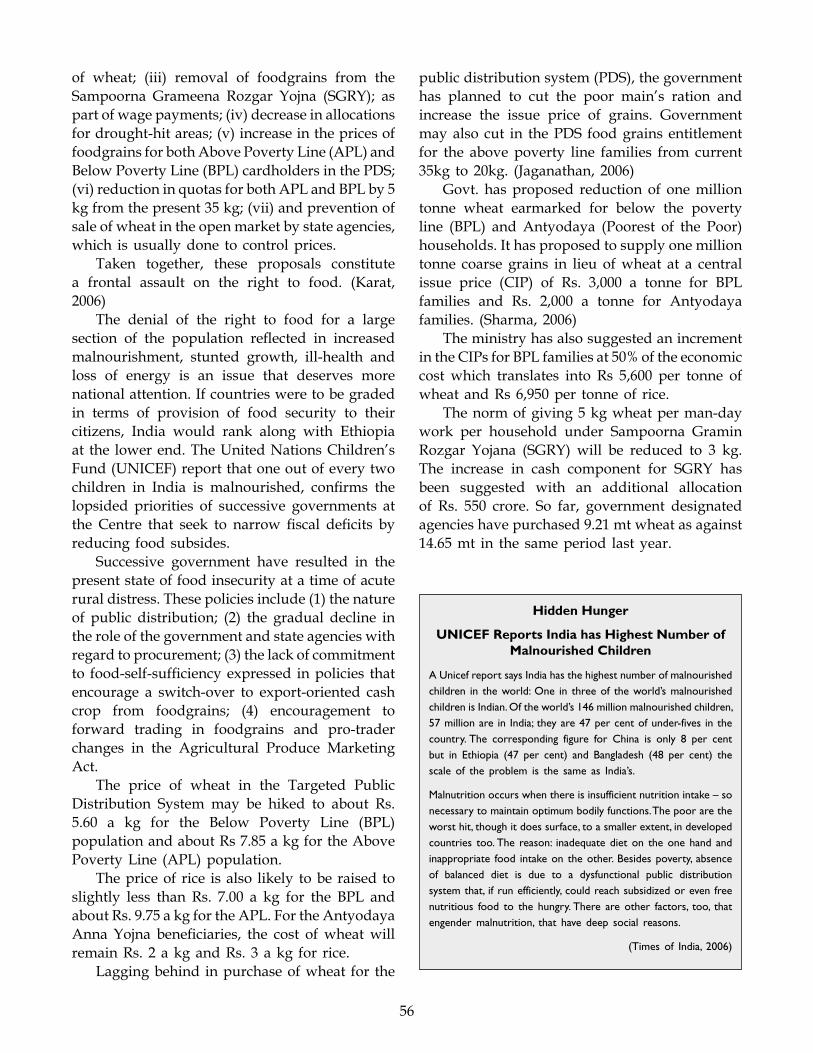
56
Hidden Hunger
UNICEF Reports India has Highest Number of Malnourished Children
A Unicef report says India has the highest number of malnourished children in the world: One in three of the world’s malnourished children is Indian. Of the world’s 146 million malnourished children, 57 million are in India; they are 47 per cent of under-fives in the country. The corresponding figure for China is only 8 per cent but in Ethiopia (47 per cent) and Bangladesh (48 per cent) the scale of the problem is the same as India’s.
Malnutrition occurs when there is insufficient nutrition intake – so necessary to maintain optimum bodily functions. The poor are the worst hit, though it does surface, to a smaller extent, in developed countries too. The reason: inadequate diet on the one hand and inappropriate food intake on the other. Besides poverty, absence of balanced diet is due to a dysfunctional public distribution system that, if run efficiently, could reach subsidized or even free nutritious food to the hungry. There are other factors, too, that engender malnutrition, that have deep social reasons.
(Times of India, 2006)
of wheat; (iii) removal of foodgrains from the Sampoorna Grameena Rozgar Yojna (SGRY); as part of wage payments; (iv) decrease in allocations for drought-hit areas; (v) increase in the prices of foodgrains for both Above Poverty Line (APL) and Below Poverty Line (BPL) cardholders in the PDS; (vi) reduction in quotas for both APL and BPL by 5 kg from the present 35 kg; (vii) and prevention of sale of wheat in the open market by state agencies, which is usually done to control prices.
Taken together, these proposals constitute a frontal assault on the right to food. (Karat, 2006)
The denial of the right to food for a large section of the population reflected in increased malnourishment, stunted growth, ill-health and loss of energy is an issue that deserves more national attention. If countries were to be graded in terms of provision of food security to their citizens, India would rank along with Ethiopia at the lower end. The United Nations Children’s Fund (UNICEF) report that one out of every two children in India is malnourished, confirms the lopsided priorities of successive governments at the Centre that seek to narrow fiscal deficits by reducing food subsides.
Successive government have resulted in the present state of food insecurity at a time of acute rural distress. These policies include (1) the nature of public distribution; (2) the gradual decline in the role of the government and state agencies with regard to procurement; (3) the lack of commitment to food-self-sufficiency expressed in policies that encourage a switch-over to export-oriented cash crop from foodgrains; (4) encouragement to forward trading in foodgrains and pro-trader changes in the Agricultural Produce Marketing Act.
The price of wheat in the Targeted Public Distribution System may be hiked to about Rs. 5.60 a kg for the Below Poverty Line (BPL) population and about Rs 7.85 a kg for the Above Poverty Line (APL) population.
The price of rice is also likely to be raised to slightly less than Rs. 7.00 a kg for the BPL and about Rs. 9.75 a kg for the APL. For the Antyodaya Anna Yojna beneficiaries, the cost of wheat will remain Rs. 2 a kg and Rs. 3 a kg for rice.
Lagging behind in purchase of wheat for the
public distribution system (PDS), the government has planned to cut the poor main’s ration and increase the issue price of grains. Government may also cut in the PDS food grains entitlement for the above poverty line families from current 35kg to 20kg. (Jaganathan, 2006)
Govt. has proposed reduction of one million tonne wheat earmarked for below the poverty line (BPL) and Antyodaya (Poorest of the Poor) households. It has proposed to supply one million tonne coarse grains in lieu of wheat at a central issue price (CIP) of Rs. 3,000 a tonne for BPL families and Rs. 2,000 a tonne for Antyodaya families. (Sharma, 2006)
The ministry has also suggested an increment in the CIPs for BPL families at 50% of the economic cost which translates into Rs 5,600 per tonne of wheat and Rs 6,950 per tonne of rice.
The norm of giving 5 kg wheat per man-day work per household under Sampoorna Gramin Rozgar Yojana (SGRY) will be reduced to 3 kg. The increase in cash component for SGRY has been suggested with an additional allocation of Rs. 550 crore. So far, government designated agencies have purchased 9.21 mt wheat as against 14.65 mt in the same period last year.
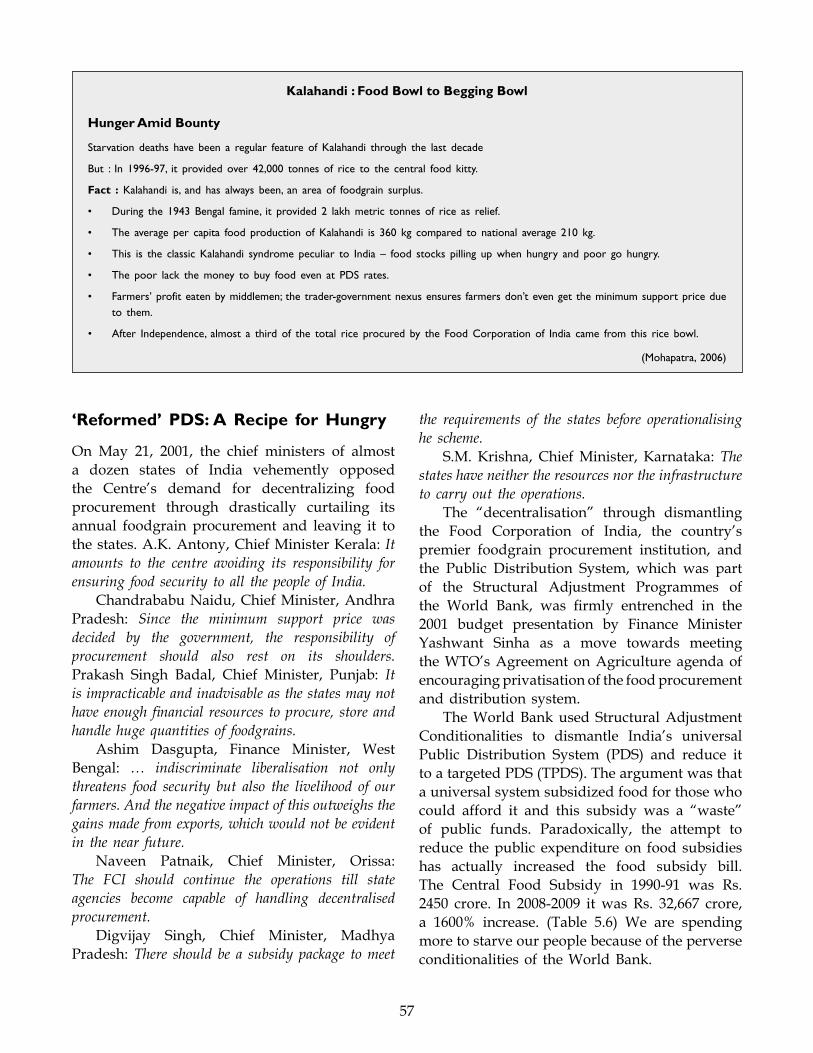
57
‘Reformed’ PDS: A Recipe for Hungry
On May 21, 2001, the chief ministers of almost a dozen states of India vehemently opposed the Centre’s demand for decentralizing food procurement through drastically curtailing its annual foodgrain procurement and leaving it to the states. A.K. Antony, Chief Minister Kerala: It amounts to the centre avoiding its responsibility for ensuring food security to all the people of India.
Chandrababu Naidu, Chief Minister, Andhra Pradesh: Since the minimum support price was decided by the government, the responsibility of procurement should also rest on its shoulders. Prakash Singh Badal, Chief Minister, Punjab: It is impracticable and inadvisable as the states may not have enough financial resources to procure, store and handle huge quantities of foodgrains.
Ashim Dasgupta, Finance Minister, West Bengal: … indiscriminate liberalisation not only threatens food security but also the livelihood of our farmers. And the negative impact of this outweighs the gains made from exports, which would not be evident in the near future.
Naveen Patnaik, Chief Minister, Orissa: The FCI should continue the operations till state agencies become capable of handling decentralised procurement.
Digvijay Singh, Chief Minister, Madhya Pradesh: There should be a subsidy package to meet
the requirements of the states before operationalising he scheme.
S.M. Krishna, Chief Minister, Karnataka: The states have neither the resources nor the infrastructure to carry out the operations.
The “decentralisation” through dismantling the Food Corporation of India, the country’s premier foodgrain procurement institution, and the Public Distribution System, which was part of the Structural Adjustment Programmes of the World Bank, was firmly entrenched in the 2001 budget presentation by Finance Minister Yashwant Sinha as a move towards meeting the WTO’s Agreement on Agriculture agenda of encouraging privatisation of the food procurement and distribution system.
The World Bank used Structural Adjustment Conditionalities to dismantle India’s universal Public Distribution System (PDS) and reduce it to a targeted PDS (TPDS). The argument was that a universal system subsidized food for those who could afford it and this subsidy was a “waste” of public funds. Paradoxically, the attempt to reduce the public expenditure on food subsidies has actually increased the food subsidy bill. The Central Food Subsidy in 1990-91 was Rs. 2450 crore. In 2008-2009 it was Rs. 32,667 crore, a 1600% increase. (Table 5.6) We are spending more to starve our people because of the perverse conditionalities of the World Bank.
Kalahandi : Food Bowl to Begging Bowl
Hunger Amid Bounty
Starvation deaths have been a regular feature of Kalahandi through the last decade
But : In 1996-97, it provided over 42,000 tonnes of rice to the central food kitty.
Fact : Kalahandi is, and has always been, an area of foodgrain surplus.
• During the 1943Bengal famine, it provided 2 lakhmetric tonnes of rice as relief.
• The average per capita food production ofKalahandi is 360 kg compared to national average 210 kg.
• This is the classicKalahandi syndrome peculiar to India – food stocks pilling upwhen hungry and poor go hungry.
• The poor lack themoney to buy food even at PDS rates.
• Farmers’profiteatenbymiddlemen; thetrader-governmentnexusensures farmersdon’tevenget theminimumsupportpricedueto them.
• After Independence, almost a third of the total rice procured by the FoodCorporation of India came from this rice bowl.
(Mohapatra, 2006)
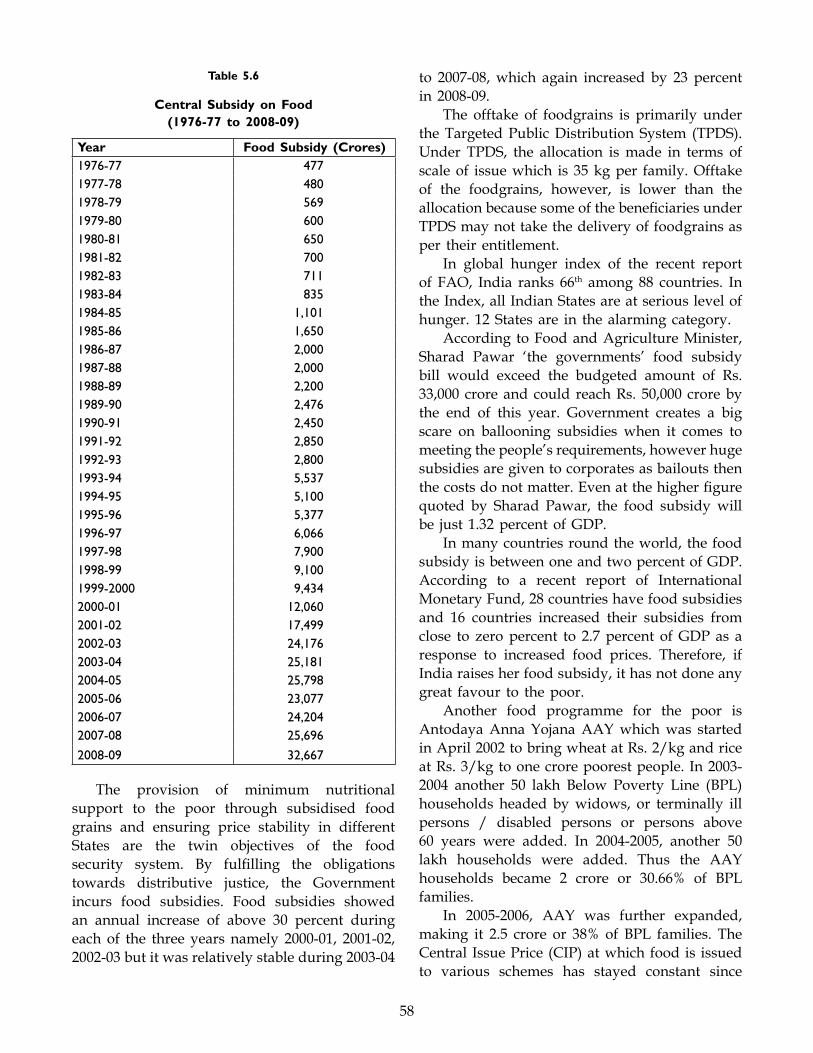
58
Table 5.6
Central Subsidy on Food (1976-77 to 2008-09)
Year Food Subsidy (Crores)1976-77 4771977-78 4801978-79 5691979-80 6001980-81 6501981-82 7001982-83 7111983-84 8351984-85 1,1011985-86 1,6501986-87 2,0001987-88 2,0001988-89 2,2001989-90 2,4761990-91 2,4501991-92 2,8501992-93 2,8001993-94 5,5371994-95 5,1001995-96 5,3771996-97 6,0661997-98 7,9001998-99 9,1001999-2000 9,4342000-01 12,0602001-02 17,4992002-03 24,1762003-04 25,1812004-05 25,7982005-06 23,0772006-07 24,2042007-08 25,696
2008-09 32,667
The provision of minimum nutritional support to the poor through subsidised food grains and ensuring price stability in different States are the twin objectives of the food security system. By fulfilling the obligations towards distributive justice, the Government incurs food subsidies. Food subsidies showed an annual increase of above 30 percent during each of the three years namely 2000-01, 2001-02, 2002-03 but it was relatively stable during 2003-04
to 2007-08, which again increased by 23 percent in 2008-09.
The offtake of foodgrains is primarily under the Targeted Public Distribution System (TPDS). Under TPDS, the allocation is made in terms of scale of issue which is 35 kg per family. Offtake of the foodgrains, however, is lower than the allocation because some of the beneficiaries under TPDS may not take the delivery of foodgrains as per their entitlement.
In global hunger index of the recent report of FAO, India ranks 66th among 88 countries. In the Index, all Indian States are at serious level of hunger. 12 States are in the alarming category.
According to Food and Agriculture Minister, Sharad Pawar ‘the governments’ food subsidy bill would exceed the budgeted amount of Rs. 33,000 crore and could reach Rs. 50,000 crore by the end of this year. Government creates a big scare on ballooning subsidies when it comes to meeting the people’s requirements, however huge subsidies are given to corporates as bailouts then the costs do not matter. Even at the higher figure quoted by Sharad Pawar, the food subsidy will be just 1.32 percent of GDP.
In many countries round the world, the food subsidy is between one and two percent of GDP. According to a recent report of International Monetary Fund, 28 countries have food subsidies and 16 countries increased their subsidies from close to zero percent to 2.7 percent of GDP as a response to increased food prices. Therefore, if India raises her food subsidy, it has not done any great favour to the poor.
Another food programme for the poor is Antodaya Anna Yojana AAY which was started in April 2002 to bring wheat at Rs. 2/kg and rice at Rs. 3/kg to one crore poorest people. In 2003-2004 another 50 lakh Below Poverty Line (BPL) households headed by widows, or terminally ill persons / disabled persons or persons above 60 years were added. In 2004-2005, another 50 lakh households were added. Thus the AAY households became 2 crore or 30.66% of BPL families.
In 2005-2006, AAY was further expanded, making it 2.5 crore or 38% of BPL families. The Central Issue Price (CIP) at which food is issued to various schemes has stayed constant since
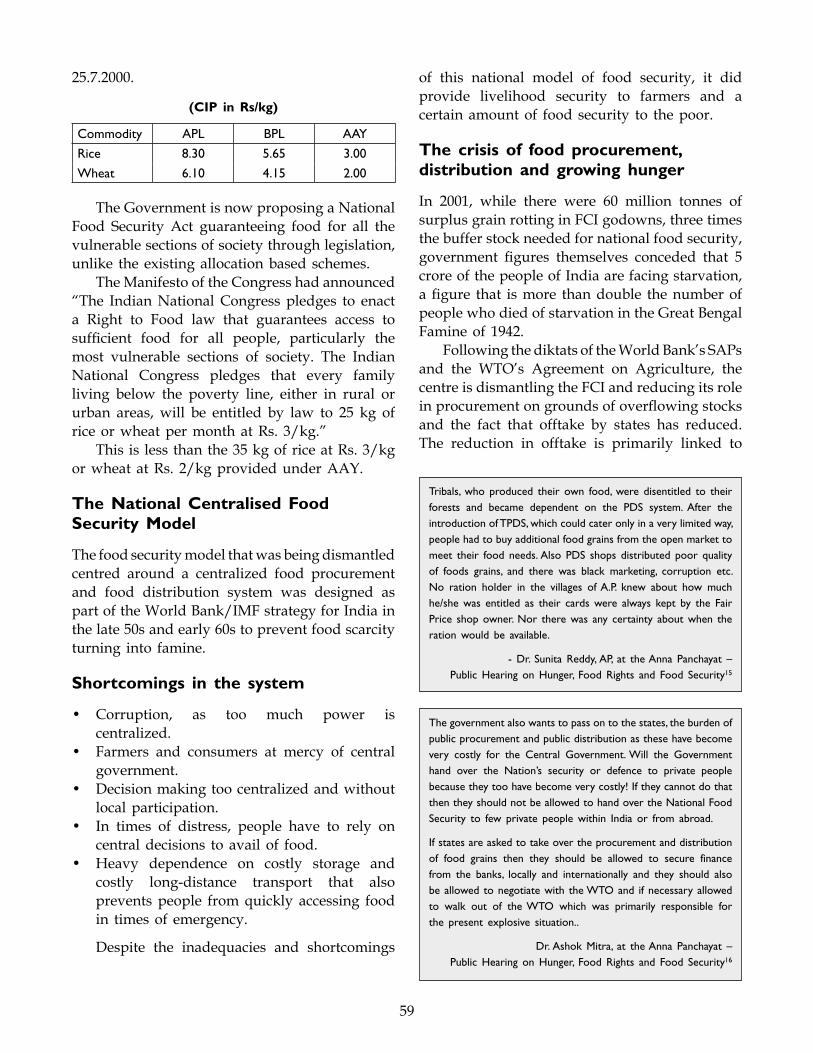
59
25.7.2000.
(CIP in Rs/kg)
Commodity APL BPL AAY
Rice 8.30 5.65 3.00
Wheat 6.10 4.15 2.00
The Government is now proposing a National Food Security Act guaranteeing food for all the vulnerable sections of society through legislation, unlike the existing allocation based schemes.
The Manifesto of the Congress had announced “The Indian National Congress pledges to enact a Right to Food law that guarantees access to sufficient food for all people, particularly the most vulnerable sections of society. The Indian National Congress pledges that every family living below the poverty line, either in rural or urban areas, will be entitled by law to 25 kg of rice or wheat per month at Rs. 3/kg.”
This is less than the 35 kg of rice at Rs. 3/kg or wheat at Rs. 2/kg provided under AAY.
The National Centralised Food Security Model
The food security model that was being dismantled centred around a centralized food procurement and food distribution system was designed as part of the World Bank/IMF strategy for India in the late 50s and early 60s to prevent food scarcity turning into famine.
Shortcomings in the system
• Corruption, as too much power is centralized.
• Farmers and consumers at mercy of central government.
• Decision making too centralized and without local participation.
• In times of distress, people have to rely on central decisions to avail of food.
• Heavy dependence on costly storage and costly long-distance transport that also prevents people from quickly accessing food in times of emergency.
Despite the inadequacies and shortcomings
of this national model of food security, it did provide livelihood security to farmers and a certain amount of food security to the poor.
The crisis of food procurement, distribution and growing hunger
In 2001, while there were 60 million tonnes of surplus grain rotting in FCI godowns, three times the buffer stock needed for national food security, government figures themselves conceded that 5 crore of the people of India are facing starvation, a figure that is more than double the number of people who died of starvation in the Great Bengal Famine of 1942.
Following the diktats of the World Bank’s SAPs and the WTO’s Agreement on Agriculture, the centre is dismantling the FCI and reducing its role in procurement on grounds of overflowing stocks and the fact that offtake by states has reduced. The reduction in offtake is primarily linked to
Tribals, who produced their own food, were disentitled to their forests and became dependent on the PDS system. After the introduction of TPDS, which could cater only in a very limited way, people had to buy additional food grains from the open market to meet their food needs. Also PDS shops distributed poor quality of foods grains, and there was black marketing, corruption etc. No ration holder in the villages of A.P. knew about how much he/she was entitled as their cards were always kept by the Fair Price shop owner. Nor there was any certainty about when the ration would be available.
- Dr. Sunita Reddy, AP, at the Anna Panchayat – Public Hearing on Hunger, Food Rights and Food Security15
The government also wants to pass on to the states, the burden of public procurement and public distribution as these have become very costly for the Central Government. Will the Government hand over the Nation’s security or defence to private people because they too have become very costly! If they cannot do that then they should not be allowed to hand over the National Food Security to few private people within India or from abroad.
If states are asked to take over the procurement and distribution of food grains then they should be allowed to secure finance from the banks, locally and internationally and they should also be allowed to negotiate with the WTO and if necessary allowed to walk out of the WTO which was primarily responsible for the present explosive situation..
Dr. Ashok Mitra, at the Anna Panchayat – Public Hearing on Hunger, Food Rights and Food Security16
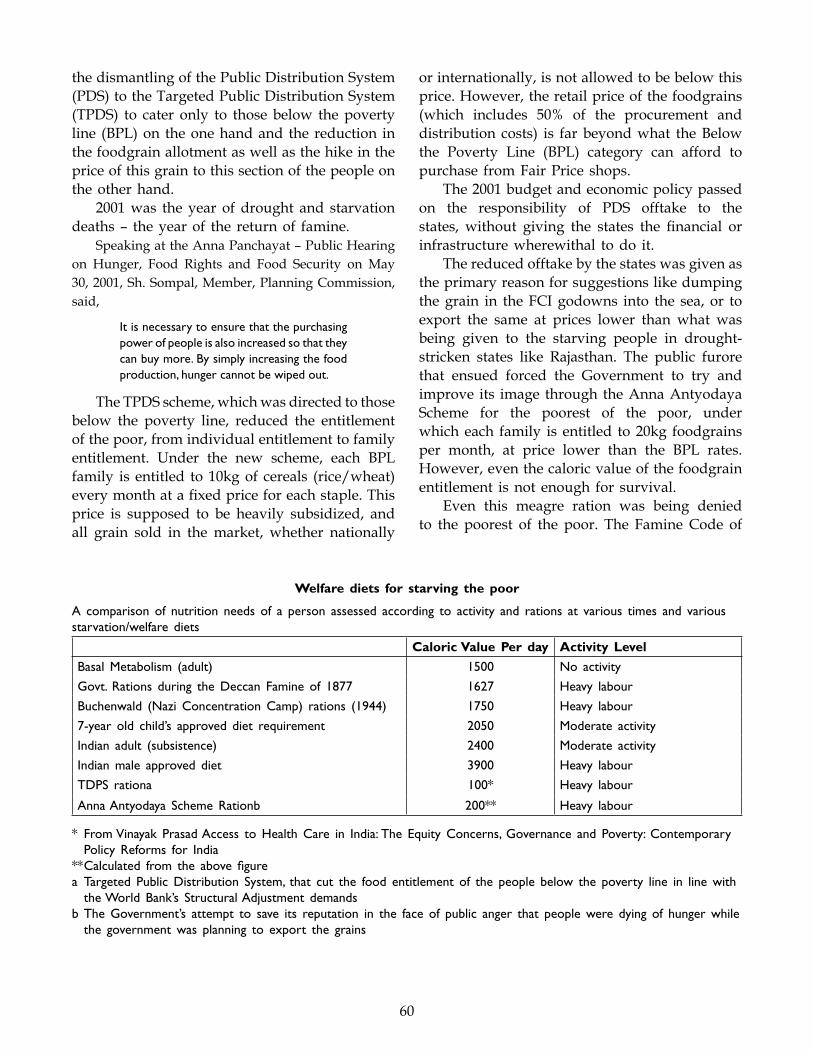
60
the dismantling of the Public Distribution System (PDS) to the Targeted Public Distribution System (TPDS) to cater only to those below the poverty line (BPL) on the one hand and the reduction in the foodgrain allotment as well as the hike in the price of this grain to this section of the people on the other hand.
2001 was the year of drought and starvation deaths – the year of the return of famine.
Speaking at the Anna Panchayat – Public Hearing on Hunger, Food Rights and Food Security on May 30, 2001, Sh. Sompal, Member, Planning Commission, said,
It is necessary to ensure that the purchasing power of people is also increased so that they can buy more. By simply increasing the food production, hunger cannot be wiped out.
The TPDS scheme, which was directed to those below the poverty line, reduced the entitlement of the poor, from individual entitlement to family entitlement. Under the new scheme, each BPL family is entitled to 10kg of cereals (rice/wheat) every month at a fixed price for each staple. This price is supposed to be heavily subsidized, and all grain sold in the market, whether nationally
or internationally, is not allowed to be below this price. However, the retail price of the foodgrains (which includes 50% of the procurement and distribution costs) is far beyond what the Below the Poverty Line (BPL) category can afford to purchase from Fair Price shops.
The 2001 budget and economic policy passed on the responsibility of PDS offtake to the states, without giving the states the financial or infrastructure wherewithal to do it.
The reduced offtake by the states was given as the primary reason for suggestions like dumping the grain in the FCI godowns into the sea, or to export the same at prices lower than what was being given to the starving people in drought-stricken states like Rajasthan. The public furore that ensued forced the Government to try and improve its image through the Anna Antyodaya Scheme for the poorest of the poor, under which each family is entitled to 20kg foodgrains per month, at price lower than the BPL rates. However, even the caloric value of the foodgrain entitlement is not enough for survival.
Even this meagre ration was being denied to the poorest of the poor. The Famine Code of
Welfare diets for starving the poor
A comparison of nutrition needs of a person assessed according to activity and rations at various times and various starvation/welfare diets
Caloric Value Per day Activity Level
Basal Metabolism (adult) 1500 No activity
Govt. Rations during the Deccan Famine of 1877 1627 Heavy labour
Buchenwald (Nazi Concentration Camp) rations (1944) 1750 Heavy labour
7-year old child’s approved diet requirement 2050 Moderate activity
Indian adult (subsistence) 2400 Moderate activity
Indian male approved diet 3900 Heavy labour
TDPS rationa 100* Heavy labour
Anna Antyodaya Scheme Rationb 200** Heavy labour
* From Vinayak Prasad Access to Health Care in India: The Equity Concerns, Governance and Poverty: Contemporary Policy Reforms for India
** Calculated from the above figurea Targeted Public Distribution System, that cut the food entitlement of the people below the poverty line in line with
the World Bank’s Structural Adjustment demandsb The Government’s attempt to save its reputation in the face of public anger that people were dying of hunger while
the government was planning to export the grains
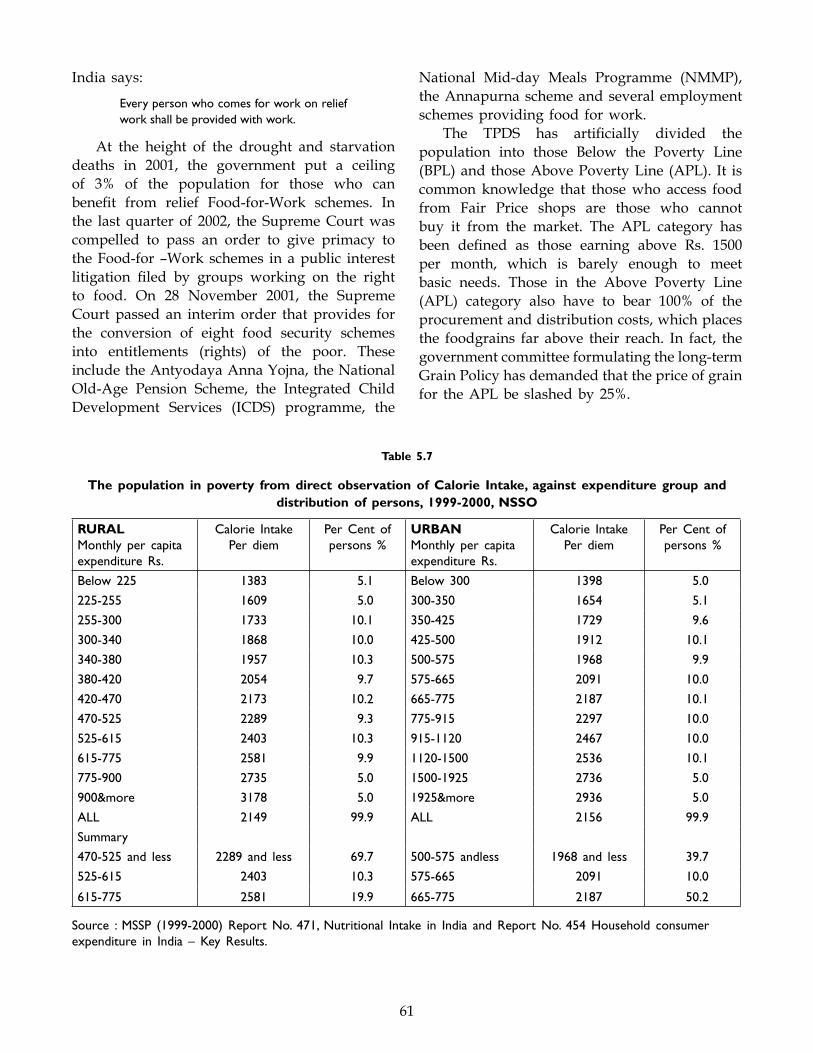
61
Table 5.7
The population in poverty from direct observation of Calorie Intake, against expenditure group and distribution of persons, 1999-2000, NSSO
RURALMonthly per capita expenditure Rs.
Calorie IntakePer diem
Per Cent of persons %
URBANMonthly per capita expenditure Rs.
Calorie Intake Per diem
Per Cent of persons %
Below 225 1383 5.1 Below 300 1398 5.0
225-255 1609 5.0 300-350 1654 5.1
255-300 1733 10.1 350-425 1729 9.6
300-340 1868 10.0 425-500 1912 10.1
340-380 1957 10.3 500-575 1968 9.9
380-420 2054 9.7 575-665 2091 10.0
420-470 2173 10.2 665-775 2187 10.1
470-525 2289 9.3 775-915 2297 10.0
525-615 2403 10.3 915-1120 2467 10.0
615-775 2581 9.9 1120-1500 2536 10.1
775-900 2735 5.0 1500-1925 2736 5.0
900&more 3178 5.0 1925&more 2936 5.0
ALL 2149 99.9 ALL 2156 99.9
Summary
470-525 and less 2289 and less 69.7 500-575 andless 1968 and less 39.7
525-615 2403 10.3 575-665 2091 10.0
615-775 2581 19.9 665-775 2187 50.2
Source : MSSP (1999-2000) Report No. 471, Nutritional Intake in India and Report No. 454 Household consumer expenditure in India – Key Results.
India says:
Every person who comes for work on relief work shall be provided with work.
At the height of the drought and starvation deaths in 2001, the government put a ceiling of 3% of the population for those who can benefit from relief Food-for-Work schemes. In the last quarter of 2002, the Supreme Court was compelled to pass an order to give primacy to the Food-for –Work schemes in a public interest litigation filed by groups working on the right to food. On 28 November 2001, the Supreme Court passed an interim order that provides for the conversion of eight food security schemes into entitlements (rights) of the poor. These include the Antyodaya Anna Yojna, the National Old-Age Pension Scheme, the Integrated Child Development Services (ICDS) programme, the
National Mid-day Meals Programme (NMMP), the Annapurna scheme and several employment schemes providing food for work.
The TPDS has artificially divided the population into those Below the Poverty Line (BPL) and those Above Poverty Line (APL). It is common knowledge that those who access food from Fair Price shops are those who cannot buy it from the market. The APL category has been defined as those earning above Rs. 1500 per month, which is barely enough to meet basic needs. Those in the Above Poverty Line (APL) category also have to bear 100% of the procurement and distribution costs, which places the foodgrains far above their reach. In fact, the government committee formulating the long-term Grain Policy has demanded that the price of grain for the APL be slashed by 25%.
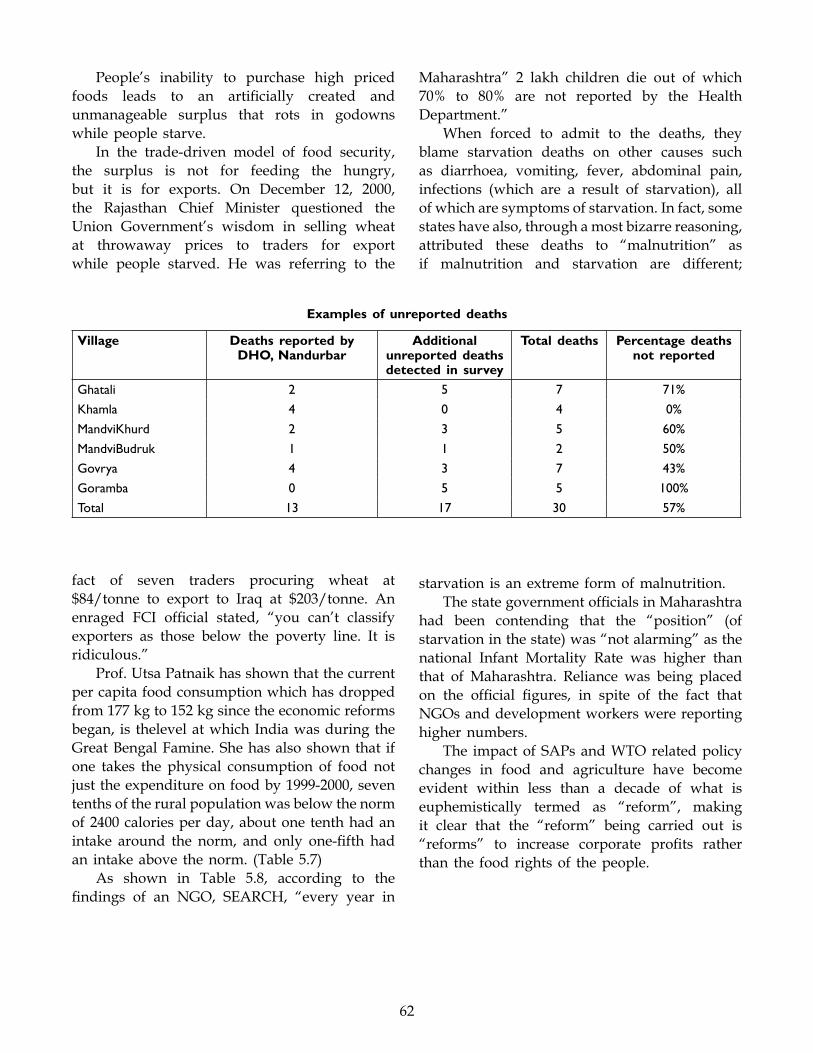
62
People’s inability to purchase high priced foods leads to an artificially created and unmanageable surplus that rots in godowns while people starve.
In the trade-driven model of food security, the surplus is not for feeding the hungry, but it is for exports. On December 12, 2000, the Rajasthan Chief Minister questioned the Union Government’s wisdom in selling wheat at throwaway prices to traders for export while people starved. He was referring to the
Examples of unreported deaths
Village Deaths reported by DHO, Nandurbar
Additional unreported deaths detected in survey
Total deaths Percentage deaths not reported
Ghatali 2 5 7 71%
Khamla 4 0 4 0%
MandviKhurd 2 3 5 60%
MandviBudruk 1 1 2 50%
Govrya 4 3 7 43%
Goramba 0 5 5 100%
Total 13 17 30 57%
fact of seven traders procuring wheat at $84/tonne to export to Iraq at $203/tonne. An enraged FCI official stated, “you can’t classify exporters as those below the poverty line. It is ridiculous.”
Prof. Utsa Patnaik has shown that the current per capita food consumption which has dropped from 177 kg to 152 kg since the economic reforms began, is thelevel at which India was during the Great Bengal Famine. She has also shown that if one takes the physical consumption of food not just the expenditure on food by 1999-2000, seven tenths of the rural population was below the norm of 2400 calories per day, about one tenth had an intake around the norm, and only one-fifth had an intake above the norm. (Table 5.7)
As shown in Table 5.8, according to the findings of an NGO, SEARCH, “every year in
Maharashtra” 2 lakh children die out of which 70% to 80% are not reported by the Health Department.”
When forced to admit to the deaths, they blame starvation deaths on other causes such as diarrhoea, vomiting, fever, abdominal pain, infections (which are a result of starvation), all of which are symptoms of starvation. In fact, some states have also, through a most bizarre reasoning, attributed these deaths to “malnutrition” as if malnutrition and starvation are different;
starvation is an extreme form of malnutrition. The state government officials in Maharashtra
had been contending that the “position” (of starvation in the state) was “not alarming” as the national Infant Mortality Rate was higher than that of Maharashtra. Reliance was being placed on the official figures, in spite of the fact that NGOs and development workers were reporting higher numbers.
The impact of SAPs and WTO related policy changes in food and agriculture have become evident within less than a decade of what is euphemistically termed as “reform”, making it clear that the “reform” being carried out is “reforms” to increase corporate profits rather than the food rights of the people.
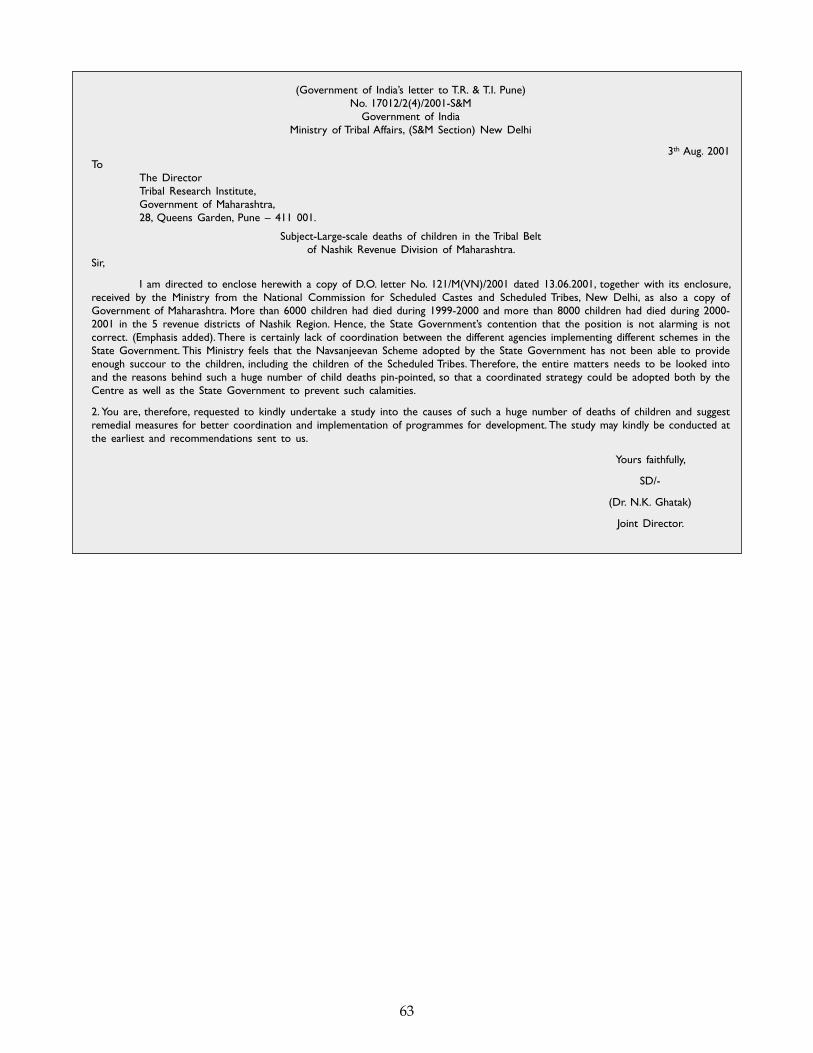
63
(Government of India’s letter to T.R. & T.I. Pune)No. 17012/2(4)/2001-S&M
Government of IndiaMinistry of Tribal Affairs, (S&M Section) New Delhi
3th Aug. 2001To The Director Tribal Research Institute, Government of Maharashtra, 28, Queens Garden, Pune – 411 001.
Subject-Large-scale deaths of children in the Tribal Belt of Nashik Revenue Division of Maharashtra.
Sir,
I am directed to enclose herewith a copy of D.O. letter No. 121/M(VN)/2001 dated 13.06.2001, together with its enclosure, received by the Ministry from the National Commission for Scheduled Castes and Scheduled Tribes, New Delhi, as also a copy of Government of Maharashtra. More than 6000 children had died during 1999-2000 and more than 8000 children had died during 2000-2001 in the 5 revenue districts of Nashik Region. Hence, the State Government’s contention that the position is not alarming is not correct. (Emphasis added). There is certainly lack of coordination between the different agencies implementing different schemes in the State Government. This Ministry feels that the Navsanjeevan Scheme adopted by the State Government has not been able to provide enough succour to the children, including the children of the Scheduled Tribes. Therefore, the entire matters needs to be looked into and the reasons behind such a huge number of child deaths pin-pointed, so that a coordinated strategy could be adopted both by the Centre as well as the State Government to prevent such calamities.
2. You are, therefore, requested to kindly undertake a study into the causes of such a huge number of deaths of children and suggest remedial measures for better coordination and implementation of programmes for development. The study may kindly be conducted at the earliest and recommendations sent to us.
Yours faithfully,
SD/-
(Dr. N.K. Ghatak)
Joint Director.
64
I. The Integrated Child Development Services
Integrated Child Development Services (ICDS) Scheme
It is now globally acknowledged that investment in human resource development is pre-requisite for economic development of any nation. Early childhood (the first six years) constitutes the most crucial period in life, when the foundations are laid for cognitive, social, emotional and physical development as well as cumulative life long learning.
India is the home to the largest child population in the world. “The Development of children is the first priority on the country’s development agenda, not because they are the most vulnerable, but because they are our supreme assets and also the future human resources of the country”. In these words, our Tenth Five Year Plan (2002-07) underlines the fact that the future of India lies in the future of Indian children – across income groups, geographical locations, gender and communities.
Integrated Child Development Scheme
Launched on 2nd October 1975 in 33 Community Development Blocks, Integrated Child Development Scheme (ICDS) today represent one of the world’s largest programmes for early childhood development. ICDS is the foremost symbol of India’s commitment to her children – India’s response to the challenge of providing pre-school education on one hand and breaking the vicious cycle of malnutrition, morbidity, reduced learning capacity and mortality, on the other. It is an inter-sectoral programme which seeks to directly reach out to children, below six years,
especially from vulnerable and remote areas and give them a head-start by providing an integrated programme of early childhood education, health and nutrition. No programme on Early Childhood Care and Education can succeed unless mothers are also brought within it ambit as it is the lap of the mother that human beings learn the first lessons in life.
Objectives of ICDS:
Followings are the main objectives of ICDS:
• Lay the foundation for proper psychological development of the child.
• Improve nutritional & health status of children 0-6 years.
• Reduce incidence of mortality, morbidity, malnutrition and school drop-outs
• Enhance the capability of the mother and family implementation among various departments to promote child development.
Services
The Scheme provides an integrated approach for converging basic services through community-based workers and helpers. The services are provided at a centre called the ‘Anganwadi’. The Anganwadi, literally a courtyard play centre, is a childcare centre, located within the village itself. A package of following six services is provided under the ICDS Scheme:
• Supplementary nutrition• Non-formal pre-school education• Immunization• Health Check-up• Referral services• Nutrition and Health Education
CHAPTER – 6
Programmes for Children’s Nutrition
65
The three services namely immunization, health check-up and referral are delivered through public health infrastructure viz. Health Sub Centres, Primary an Community Health Centres under the Ministry of Health and Family Welfare.
Growth Monitoring and nutrition surveillance are two important activities that are undertaken. Children below the age of three years of age are weighed once a month and children 3-6 years of age are weighed every quarter. Weight-for-age growth cards are maintained for all children below six years. This helps to detect growth faltering and helps in assessing nutritional status. Besides, severely malnourished children are given special supplementary feeding and referred to health sub-centres, Primary Health Centres as and when required.
The Integrated Child Development Services (ICDS) is the flagship national programme that addresses the nutritional needs of children under the age of six years. Two of the major objectives of the ICDS are to improve the nutritional and health status of children below the age of six years and to reduce the incidence of mortality, morbidity, malnutrition and school dropouts. The ICDS scheme works through a network of Anganwadis. The norm is to have one Anganwadi per 1000 population in rural and urban areas. Typically, 10-15% of the population is under five years of age. In some areas where Anganwadis are located within the upper caste part of the village, the lower castes may not be able to access these services easily. (PRS, 2007)
ICDS programme is organized as a collection of projects. One project covers a population of around 100,000 and involves running about 100 Aganwadis. (a) Each project is managed by a Child Development Project Officer at the Block level who is assisted by supervisors. The supervisors inspect and advise the Anganwadi workers. There is an Office of District Programme Officer in every district with five or more ICDS projects. The monitoring and supervision of various officials is essential for proper implementation of the ICDS programme.
An Anganwadi centre needs to have facilities such as a toilet, drinking water, a medical kit,
and weighing machines. Anganwadi workers run the Anganwadi, survey all the families in the neighbourhood, enroll eligible children, ensure that food is served on time every day, conduct the pre-school education activities, make home visits to pregnant mothers, weight under-3 children once a month, and provide counseling on child care. Therefore, the knowledge of the Anganwadi worker and the facilities available at the Anganwadi are good indicators of the effectiveness of the scheme.
Each child upto 6 years of age is to get 300 calories and 8-10 grams of protein; (b) each adolescent girl is to get 500 calories and 20-25 grams of protein; (c) each pregnant woman and lactating mother is to get 500 calories and 20-25 grams protein; and (d) each malnourished child is to get 600 calories and 16-20 grams of protein. Within these parameters, there is considerable variation between states in the type of supplementary nutrition provided to children. Also, supplementary nutrition has to be given to 0-6 years children, adolescent girls, pregnant woman and nursing mothers for 300 days in a year. As the first six years are crucial to a child’s development, nutrition and quality of care being provided at this period is crucial.
The Anganwadi workers are supposed to provide pre-school education to children in the age group of 3-6 years. These children are also weighed once a quarter. Children who attend pre-school and get supplementary nutrition etc. not only gain in health, they are also able to adjust better in formal schools. Therefore, it is important to understand whether every effort is being made to get the children to the Anganwadis.
A Supreme Court order dated October 7, 2004 has stipulated that no contractors shall be used for the supply of supplementary nutrition. Local Women’s Self Help Group and Mahila Mandals should be encouraged to supply the supplementary food distributed in Anganwadis.
It is necessary to determine whether a child is growing well in relation to her age. The level of malnutrition is measured using different metrics such as under weight, stunting or wasting. The most widely used index for defining nutritional status of children is weight-for-age. Nutritional
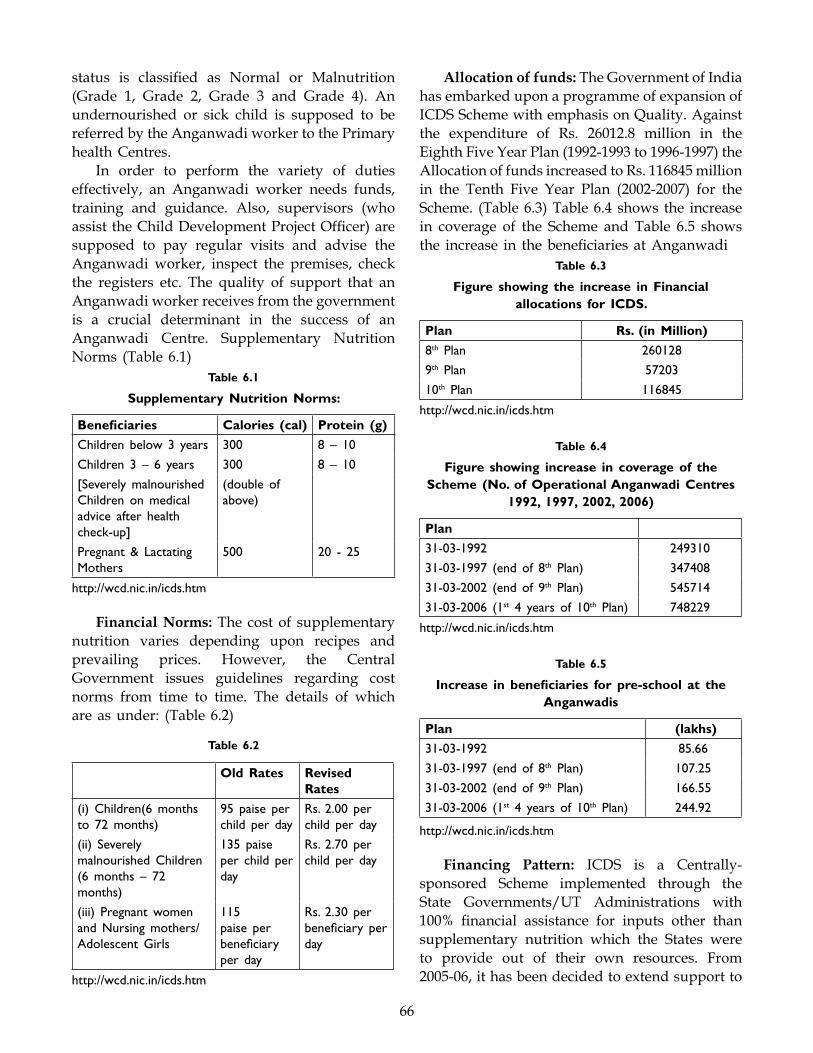
66
status is classified as Normal or Malnutrition (Grade 1, Grade 2, Grade 3 and Grade 4). An undernourished or sick child is supposed to be referred by the Anganwadi worker to the Primary health Centres.
In order to perform the variety of duties effectively, an Anganwadi worker needs funds, training and guidance. Also, supervisors (who assist the Child Development Project Officer) are supposed to pay regular visits and advise the Anganwadi worker, inspect the premises, check the registers etc. The quality of support that an Anganwadi worker receives from the government is a crucial determinant in the success of an Anganwadi Centre. Supplementary Nutrition Norms (Table 6.1)
Table 6.1
Supplementary Nutrition Norms:
Beneficiaries Calories (cal) Protein (g)
Children below 3 years 300 8 – 10
Children 3 – 6 years 300 8 – 10
[Severely malnourished Children on medical advice after health check-up]
(double of above)
Pregnant & Lactating Mothers
500 20 - 25
http://wcd.nic.in/icds.htm
Financial Norms: The cost of supplementary nutrition varies depending upon recipes and prevailing prices. However, the Central Government issues guidelines regarding cost norms from time to time. The details of which are as under: (Table 6.2)
Table 6.2
Old Rates Revised Rates
(i) Children(6 months to 72 months)
95 paise per child per day
Rs. 2.00 per child per day
(ii) Severely malnourished Children (6 months – 72 months)
135 paise per child per day
Rs. 2.70 per child per day
(iii) Pregnant women and Nursing mothers/Adolescent Girls
115 paise per beneficiary per day
Rs. 2.30 per beneficiary per day
http://wcd.nic.in/icds.htm
Allocation of funds: The Government of India has embarked upon a programme of expansion of ICDS Scheme with emphasis on Quality. Against the expenditure of Rs. 26012.8 million in the Eighth Five Year Plan (1992-1993 to 1996-1997) the Allocation of funds increased to Rs. 116845 million in the Tenth Five Year Plan (2002-2007) for the Scheme. (Table 6.3) Table 6.4 shows the increase in coverage of the Scheme and Table 6.5 shows the increase in the beneficiaries at Anganwadi
Table 6.3
Figure showing the increase in Financial allocations for ICDS.
Plan Rs. (in Million)
8th Plan 260128
9th Plan 57203
10th Plan 116845
http://wcd.nic.in/icds.htm
Table 6.4
Figure showing increase in coverage of the Scheme (No. of Operational Anganwadi Centres
1992, 1997, 2002, 2006)
Plan
31-03-1992 249310
31-03-1997 (end of 8th Plan) 347408
31-03-2002 (end of 9th Plan) 545714
31-03-2006 (1st 4 years of 10th Plan) 748229
http://wcd.nic.in/icds.htm
Table 6.5
Increase in beneficiaries for pre-school at the Anganwadis
Plan (lakhs)
31-03-1992 85.66
31-03-1997 (end of 8th Plan) 107.25
31-03-2002 (end of 9th Plan) 166.55
31-03-2006 (1st 4 years of 10th Plan) 244.92
http://wcd.nic.in/icds.htm
Financing Pattern: ICDS is a Centrally-sponsored Scheme implemented through the State Governments/UT Administrations with 100% financial assistance for inputs other than supplementary nutrition which the States were to provide out of their own resources. From 2005-06, it has been decided to extend support to
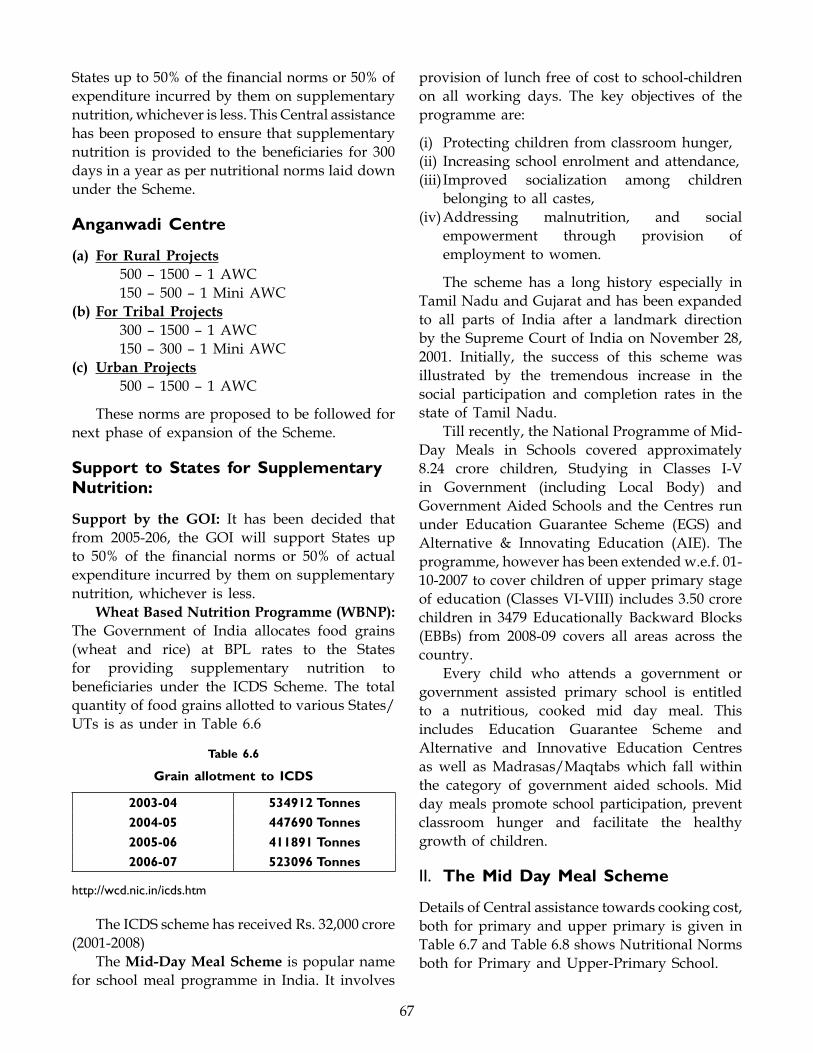
67
States up to 50% of the financial norms or 50% of expenditure incurred by them on supplementary nutrition, whichever is less. This Central assistance has been proposed to ensure that supplementary nutrition is provided to the beneficiaries for 300 days in a year as per nutritional norms laid down under the Scheme.
Anganwadi Centre
(a) For Rural Projects 500 – 1500 – 1 AWC 150 – 500 – 1 Mini AWC(b) For Tribal Projects 300 – 1500 – 1 AWC 150 – 300 – 1 Mini AWC(c) Urban Projects 500 – 1500 – 1 AWC
These norms are proposed to be followed for next phase of expansion of the Scheme.
Support to States for Supplementary Nutrition:
Support by the GOI: It has been decided that from 2005-206, the GOI will support States up to 50% of the financial norms or 50% of actual expenditure incurred by them on supplementary nutrition, whichever is less.
Wheat Based Nutrition Programme (WBNP): The Government of India allocates food grains (wheat and rice) at BPL rates to the States for providing supplementary nutrition to beneficiaries under the ICDS Scheme. The total quantity of food grains allotted to various States/UTs is as under in Table 6.6
Table 6.6
Grain allotment to ICDS
2003-04 534912 Tonnes
2004-05 447690 Tonnes
2005-06 411891 Tonnes
2006-07 523096 Tonnes
http://wcd.nic.in/icds.htm
The ICDS scheme has received Rs. 32,000 crore (2001-2008)
The Mid-Day Meal Scheme is popular name for school meal programme in India. It involves
provision of lunch free of cost to school-children on all working days. The key objectives of the programme are:
(i) Protecting children from classroom hunger,(ii) Increasing school enrolment and attendance,(iii) Improved socialization among children
belonging to all castes,(iv) Addressing malnutrition, and social
empowerment through provision of employment to women.
The scheme has a long history especially in Tamil Nadu and Gujarat and has been expanded to all parts of India after a landmark direction by the Supreme Court of India on November 28, 2001. Initially, the success of this scheme was illustrated by the tremendous increase in the social participation and completion rates in the state of Tamil Nadu.
Till recently, the National Programme of Mid-Day Meals in Schools covered approximately 8.24 crore children, Studying in Classes I-V in Government (including Local Body) and Government Aided Schools and the Centres run under Education Guarantee Scheme (EGS) and Alternative & Innovating Education (AIE). The programme, however has been extended w.e.f. 01-10-2007 to cover children of upper primary stage of education (Classes VI-VIII) includes 3.50 crore children in 3479 Educationally Backward Blocks (EBBs) from 2008-09 covers all areas across the country.
Every child who attends a government or government assisted primary school is entitled to a nutritious, cooked mid day meal. This includes Education Guarantee Scheme and Alternative and Innovative Education Centres as well as Madrasas/Maqtabs which fall within the category of government aided schools. Mid day meals promote school participation, prevent classroom hunger and facilitate the healthy growth of children.
II. The Mid Day Meal Scheme
Details of Central assistance towards cooking cost, both for primary and upper primary is given in Table 6.7 and Table 6.8 shows Nutritional Norms both for Primary and Upper-Primary School.
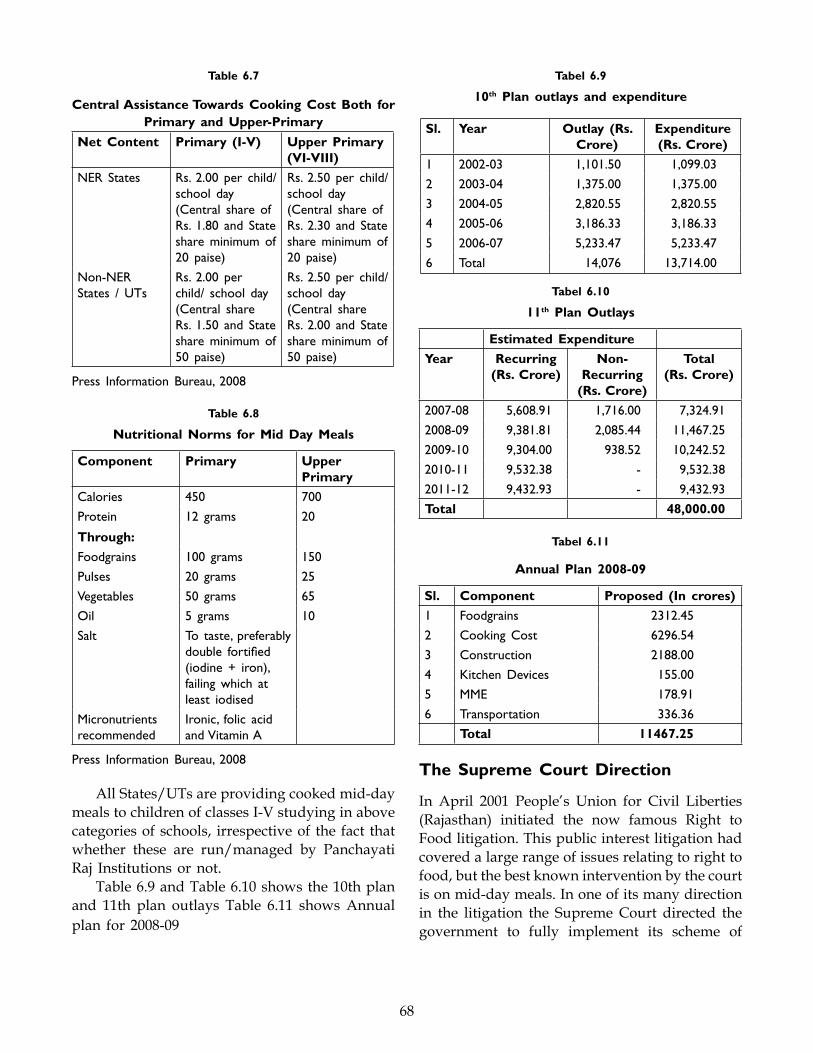
68
Table 6.7
Central Assistance Towards Cooking Cost Both for Primary and Upper-Primary
Net Content Primary (I-V) Upper Primary (VI-VIII)
NER States Rs. 2.00 per child/ school day(Central share of Rs. 1.80 and State share minimum of 20 paise)
Rs. 2.50 per child/ school day(Central share of Rs. 2.30 and State share minimum of 20 paise)
Non-NER States / UTs
Rs. 2.00 per child/ school day (Central share Rs. 1.50 and State share minimum of 50 paise)
Rs. 2.50 per child/ school day(Central share Rs. 2.00 and State share minimum of 50 paise)
Press Information Bureau, 2008
Table 6.8
Nutritional Norms for Mid Day Meals
Component Primary Upper Primary
Calories 450 700
Protein 12 grams 20
Through:
Foodgrains 100 grams 150
Pulses 20 grams 25
Vegetables 50 grams 65
Oil 5 grams 10
Salt To taste, preferably double fortified (iodine + iron), failing which at least iodised
Micronutrients recommended
Ironic, folic acid and Vitamin A
Press Information Bureau, 2008
All States/UTs are providing cooked mid-day meals to children of classes I-V studying in above categories of schools, irrespective of the fact that whether these are run/managed by Panchayati Raj Institutions or not.
Table 6.9 and Table 6.10 shows the 10th plan and 11th plan outlays Table 6.11 shows Annual plan for 2008-09
Tabel 6.9
10th Plan outlays and expenditure
Sl. Year Outlay (Rs. Crore)
Expenditure (Rs. Crore)
1 2002-03 1,101.50 1,099.03
2 2003-04 1,375.00 1,375.00
3 2004-05 2,820.55 2,820.55
4 2005-06 3,186.33 3,186.33
5 2006-07 5,233.47 5,233.47
6 Total 14,076 13,714.00
Tabel 6.10
11th Plan Outlays
Estimated Expenditure
Year Recurring (Rs. Crore)
Non-Recurring
(Rs. Crore)
Total (Rs. Crore)
2007-08 5,608.91 1,716.00 7,324.91
2008-09 9,381.81 2,085.44 11,467.25
2009-10 9,304.00 938.52 10,242.52
2010-11 9,532.38 - 9,532.38
2011-12 9,432.93 - 9,432.93
Total 48,000.00
Tabel 6.11
Annual Plan 2008-09
Sl. Component Proposed (In crores)
1 Foodgrains 2312.45
2 Cooking Cost 6296.54
3 Construction 2188.00
4 Kitchen Devices 155.00
5 MME 178.91
6 Transportation 336.36
Total 11467.25
The Supreme Court Direction
In April 2001 People’s Union for Civil Liberties (Rajasthan) initiated the now famous Right to Food litigation. This public interest litigation had covered a large range of issues relating to right to food, but the best known intervention by the court is on mid-day meals. In one of its many direction in the litigation the Supreme Court directed the government to fully implement its scheme of
69
providing cooked meals to all children in primary schools. This land mark direction converted the mid-day meal scheme into a legal entitlement. On November 28, 2001 the Supreme Court made it mandatory for the State governments to provide cooked meals instead of ‘dry rations’. The direction was to be implemented from June 2002, but was violated by most States. But with sustained pressure from the court, media and in particular from the Right to Food Campaign more and more States started providing cooked meals.
Scams in Mid-Day Meals
Various scams involving Mid-Day Meal Scheme have been unearthed since it was started. In January 2006, the Delhi Police unearthed a scam in the Mid-Day Meal Scheme. In December, 2005, the police had seized eight truckloads (2,760 sacks) of rice, meant for primary school children being carried from Food Corporation of India (FCI) godowns in Bulandshahr District of UP to North Delhi. When the police detained the trucks, the drivers claimed that the rice was being brought all the way to Delhi to be cleaned at a factory. However, according to the guidelines, the rice has to be taken directly from FCI godown to the school or village concerned. Later it was found that the rice was being siphoned off by a UP based NGO, Bhartiya Manav Kalyan Parishad (BMKP), in connivance with the government officials.
In November 2006, the residents of Pembong village under the Mim tea estate (around 30 km from Darjeeling), accused a group of teachers of embezzling mid-day meals. In a written complaint, the residents claimed the students at the primary school had not got midday meal for the past 18 months.
In December 2006, an another scam was reported involving government schools that siphoned off foodgrains under the mid-day meal scheme by faking attendance. The modus operandi of the schools was simple – the attendance register would exaggerate the number of students enrolled in the class. The additional students would not exist – they were “enrolled” to get additional foodgrains which were pocketed by the school staff.
The similar scam was exposed, when P Asha Kumari, an assistant teacher at the government model primary school, Jakkur, in Yelahanka in Bangalore acted as a whistleblower. She informed the Lok Ayukta, who conducted a probe and indicted four persons for misappropriation. The whistleblower was harassed by the school staff and she was transferred to other school, where she again found the same modus operandi being used to siphon off the foodgrains.
In a survey conducted in Bundelkhand region of UP, Navdanya also found the siphoning off money from the Mid-Day Meals. The modus-operands was simple. More than 90-95% students were marked as present where as the actual attendance was below 40/%.
Programmes in Other Parts of the World
Free mid-day meals for school students were first introduced in Japanese private school in the late 1800s, in Brazil in 1938 and in the United States in 1946 with evidently satisfactory results. Both Japan and the US boast 100 percent adult literacy and even Brazil which (like India) is classified as a medium income nation by the United Nations Development Programme has attained 87.3 percent literacy according to UNDP’s Human Development Report, 2003 as against India’s 58 percent. According to the Global School Feeding Report of the United Nation’s World Food Programme; “School feeding programmes often double enrollment within a year and can produce a 40 percent improvement in academic performance in just two years. Children who take part in such programmes stay in school longer and the expense in minimal”.
A study of mid-day meal schemes in three States – Chhattisgarh, Rajasthan and Karnataka – conducted by the Centre for Equity Studies of the Delhi School of Economics clearly indicates the link between improved student enrollment and retention and the free mid-day meal. A study of 81 schools in which free mid-day meals were introduced, indicates that in class I enrollment rose by 15 percent within the year. Particularly impressing jumps were made in female enrollment in Chhattisgarh (17 percent)
70
and Rajasthan (29 percent). There is also much informal evidence which indicates that mid-day meals have enhanced daily school attendance and not just annual enrollment. Many parents, for instance, reported that the availability of a mid-day meal made it much easier for them to persuade their children to go to school in the
morning. Most teachers also concur that mid-day meals have raised daily attendance, especially among young children.
New Distribution Scheme Hits the Mid-Day Meal
Due to new distribution system, States have reduced per school allocation of foodgrains for mid-day meals, resulting in children getting 350-700 calories less per day. Of the total 28 lakh tones of wheat and rice allocated for Mid-Day-Meals.
States managed to lift only 32% of this food grain first six months Mid-Day Meal Scheme has been the biggest factor in improving student enrolment rate in primary schools from 82% to 95% in 10 years. (Chauhan, 2008)
Rajasthan – Lost 52,000 metric tones of foodgrains in the last 3 months due to new system.
Uttar Pradesh – Was unable to lift 60,000 metric tonnes of grains
Bihar – Failed to lift over 40,000 metric tonnes due to floods in the northern parts.
Karnataka – Also reported huge losses of wheat and rice.
Two of the world’s biggest children’s food programmes – the Mid-Day Meal Scheme and the Integrated Child Development Scheme (ICDS) – are facing a food crunch. Reason: a new distribution system adopted by the Food Ministry from the financial year 2007-2008.
According to the new system, allocation of foodgrain quota will take place every three months. Till last year, states were allowed to lift their annual allocations of wheat and rice round the year. Now, inability to lift grains within the stipulated period means the quota will lapse.
The Malnutrition Market
As malnutrition grows in India, corporate giants are rushing in to turn malnutrition into a market. The Global Alliance for Improved Nutrition (GAIN) is pushing for chemical fortification of food. GAIN, an initiative of the Gates Foundation, works closely with the life sciences institute whose members include Bayer, Coca Cola, Dow, Dupont, Exximobil, Mc Donalds, Merck, Monsanto, Nestle,
Mid-Day Meals: MGR’s Valuable Legacy
The mid-day meal scheme for school children was introduced in Tamil Nadu as early as 1925 by the Corporation of Madras, but became a state-wide scheme in 1956 under the then Chief Minister K. Kamraj who introduced it in Adi Dravida community schools as the ‘Poor Feeding’ programme, in 1961, the government started receiving American aid for the programme and it was expanded to all corporations and government schools in urban areas.
But it was only in July 1982 under the leadership of the legendary Chief Minister M.G. Ramachandran that the ‘Puratchi Thalaivar MGR Nutritious Meal Programme’ (PTMGR NMP) was introduced in a phased manner in Child Welfare Centres in rural areas for pre-school children in the age group two-five years and for primary school children in the age group five-nine years. Subsequently on September 15 the same year, despite widespread criticism from economists and experts, MGR extended the scheme to Nutritious Meal Centres in urban areas. It was further extended to school students between 10-15 years in 1984. The successful introduction of Tamil Nadu’s NMP prompted the creation of a National Programme of Nutritional Support to primary education (popularly known as Mid-Day Meal scheme) in 1995. Under this programme the Union HRD ministry supplies free foodgrains to primary school children at the rate of 100 gm per child for ten months in the year.
Today, the TN free noon meal is available to all children of government, corporation, panchayat and municipal schools in the state. Old age pensioners and pregnant women can also avail of the scheme. The infrastructure, built gradually over the years comprises child welfare centres, school nutritious meal centres and anganwadi centres monitored by committees at the district, block, corporation, municipality and panchayat level. The positive feedback from schools in the state indicates that the scheme has more than fulfilled its main objectives of combating malnutrition among children, increasing literacy, serving as an incentive for enhancing enrollment and retention of students in primary and middle schools.
Apart from boosting school attendance and child nutrition, mid-day meals have an important socialization value and foster gender equity. As children learn to sit together and share a common meal, one can expect some erosion of caste prejudices and class inequality. They also reduce the gender gap in education, since they boost female school attendance more than male attendance.
71
Novartis, Pepsico, Pfizer, Proctor & Gamble. As Radha Holla Bhar reports in the Hunger Bazaar-
• In September 2006, GAIN, together with World Food Programme and the Tamil Nadu State Aids Control Society initiated a project to provide nutrient-dense blended food to people living with HIV/AIDS in Tamil Nadu.
• Again, in September 2006, GAIN supported the fortification of 10,000 tonnes of blended food to reach 400,000 children aged between six and 36 months in Gujarat.
• In January 2007, UNICEF received a US$ 198,480 GAIN grant for the fortification of home-made complementary foods with a mix of vitamins and minerals – Sprinkles – aimed at 120,000 children aged between six and 36 months in Rajasthan.
• In May 2007, GAIN started working with Naandi Foundation to start the distribution of fortified meals to school children in Andhra Pradesh, Rajasthan and Madhya Pradesh.
• In May 2007 again, in Hyderabad, Britannia Industries added fortified biscuits for 1,20,000 children, with help from GAIN. This invention created a huge market for Britannia, one that captured with no advertising costs, and got the following response from the company.
“Britannia is delighted to be partnering with GAIN in a first-of-its-kind public private partnership in the school feeding programme in Hyderabad wherein we make and supply specially fortified biscuits to some of the most disadvantaged children. We are grateful to GAIN for supporting our work.”
GAIN is now working with DSM Nutritional Products, Cargill, Azko Nobel and Procter and Gamble to create the GAIN Premix Fund, which will give loans and grants to people to purchase this product, probably through programmes run by NGOs and even governments.
Making a killing on the hunger bazaar – market solutions to malnutrition
GAIN advocates the use of “market solutions” to deal with malnutrition and micronutrient deficiencies. In India alone, GAIN aims at creating a market of one billion people for micronutrients and fortified foods. As mentioned earlier, GAIN provided Britannia Biscuits with the opportunity to reach with its products over a lakh children every day in Hyderabad alone. This is the huge potential of the hunger bazaar to feed corporate greed for profits. Fortification with iron will not reduce anemia until the cultural, social and health problems that contribute to the presence of anemia will not be solved. If women continue to eat last and least, they will continue to be anemic. If the problems of hookworm, malaria and amoebiasis are not resolved, anemia will persist.
Besides chemicalisation of fortification, there is a push for fortification through genetic engineering. Golden Rice is the most popular GM “solution” for malnutrition.
Golden Rice : A Blind Approach to Blindness Prevention
Golden rice has been heralded as the miracle cure for malnutrition and hunger of which 800m members of the human community suffer.
Herbicide resistant and toxin producing genetically engineered plants can be objectionable because of their ecological and social costs. But who could possibly object to rice engineered to produce vitamin A, a deficiency found in nearly 3 million children, largely in the Third World?
As remarked by Mary Lou Guerinot, the author of the Commentary on Vit. A rice in Science,
One can only hope that this application of plant genetic engineering to ameliorate human misery without regard to short term profit will restore this technology to political acceptability.
Unfortunately, Vitamin A rice is a hoax, and will bring further dispute to plant genetic engineering where public relations exercises seem to have replaced science in promotion of untested, unproven and unnecessary technology.
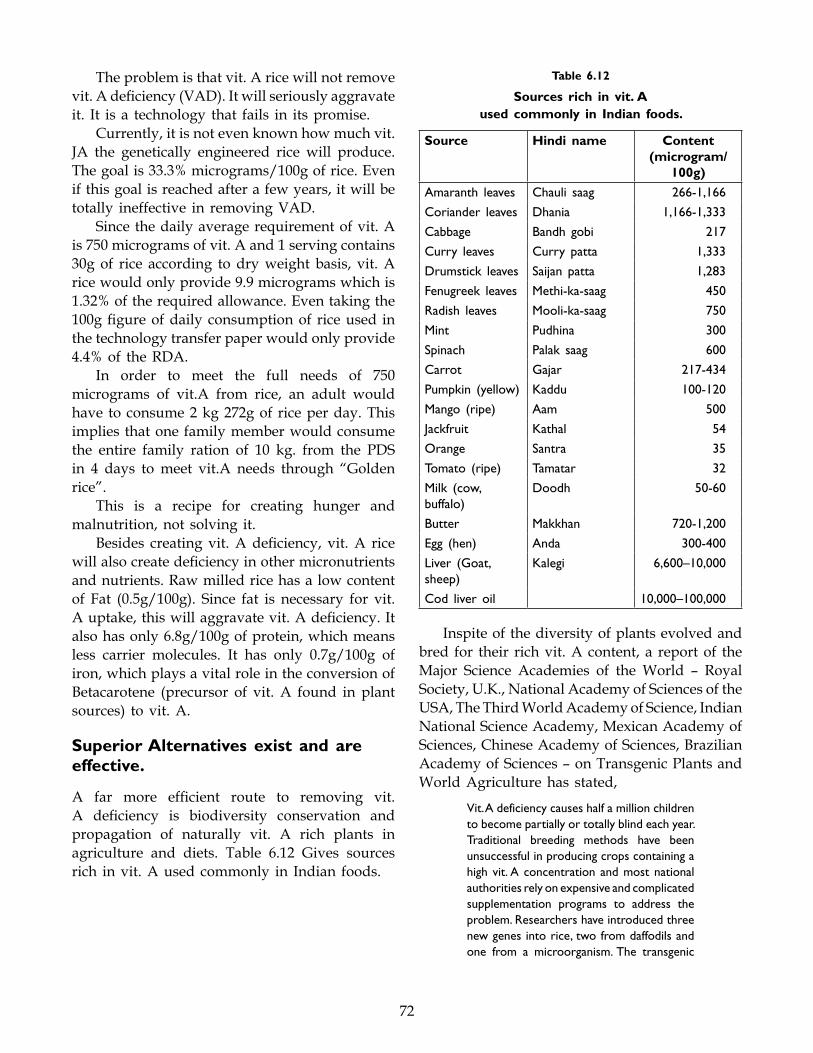
72
The problem is that vit. A rice will not remove vit. A deficiency (VAD). It will seriously aggravate it. It is a technology that fails in its promise.
Currently, it is not even known how much vit. JA the genetically engineered rice will produce. The goal is 33.3% micrograms/100g of rice. Even if this goal is reached after a few years, it will be totally ineffective in removing VAD.
Since the daily average requirement of vit. A is 750 micrograms of vit. A and 1 serving contains 30g of rice according to dry weight basis, vit. A rice would only provide 9.9 micrograms which is 1.32% of the required allowance. Even taking the 100g figure of daily consumption of rice used in the technology transfer paper would only provide 4.4% of the RDA.
In order to meet the full needs of 750 micrograms of vit.A from rice, an adult would have to consume 2 kg 272g of rice per day. This implies that one family member would consume the entire family ration of 10 kg. from the PDS in 4 days to meet vit.A needs through “Golden rice”.
This is a recipe for creating hunger and malnutrition, not solving it.
Besides creating vit. A deficiency, vit. A rice will also create deficiency in other micronutrients and nutrients. Raw milled rice has a low content of Fat (0.5g/100g). Since fat is necessary for vit. A uptake, this will aggravate vit. A deficiency. It also has only 6.8g/100g of protein, which means less carrier molecules. It has only 0.7g/100g of iron, which plays a vital role in the conversion of Betacarotene (precursor of vit. A found in plant sources) to vit. A.
Superior Alternatives exist and are effective.
A far more efficient route to removing vit. A deficiency is biodiversity conservation and propagation of naturally vit. A rich plants in agriculture and diets. Table 6.12 Gives sources rich in vit. A used commonly in Indian foods.
Table 6.12
Sources rich in vit. A used commonly in Indian foods.
Source Hindi name Content (microgram/
100g)
Amaranth leaves Chauli saag 266-1,166
Coriander leaves Dhania 1,166-1,333
Cabbage Bandh gobi 217
Curry leaves Curry patta 1,333
Drumstick leaves Saijan patta 1,283
Fenugreek leaves Methi-ka-saag 450
Radish leaves Mooli-ka-saag 750
Mint Pudhina 300
Spinach Palak saag 600
Carrot Gajar 217-434
Pumpkin (yellow) Kaddu 100-120
Mango (ripe) Aam 500
Jackfruit Kathal 54
Orange Santra 35
Tomato (ripe) Tamatar 32
Milk (cow, buffalo)
Doodh 50-60
Butter Makkhan 720-1,200
Egg (hen) Anda 300-400
Liver (Goat, sheep)
Kalegi 6,600–10,000
Cod liver oil 10,000–100,000
Inspite of the diversity of plants evolved and bred for their rich vit. A content, a report of the Major Science Academies of the World – Royal Society, U.K., National Academy of Sciences of the USA, The Third World Academy of Science, Indian National Science Academy, Mexican Academy of Sciences, Chinese Academy of Sciences, Brazilian Academy of Sciences – on Transgenic Plants and World Agriculture has stated,
Vit. A deficiency causes half a million children to become partially or totally blind each year. Traditional breeding methods have been unsuccessful in producing crops containing a high vit. A concentration and most national authorities rely on expensive and complicated supplementation programs to address the problem. Researchers have introduced three new genes into rice, two from daffodils and one from a microorganism. The transgenic
73
rice exhibits an increased production of betacarotene as a precursor to vit. A and the seed in yellow in colour. Such yellow, or golden rice, may be a useful tool to help treat the problem of vit. A deficiency in young children living in the tropics.
It appears as if the world’s top scientists suffer a more severe form of blindness than children in poor countries. The statement that “traditional breeding has been unsuccessful in producing crops high in vit. A” is not true given the diversity of plants and crops that Third World farmers, especially women have bred and used which are rich sources of vit. A such as coriander, amaranth, carrot, pumpkin, mango, jackfruit.
It is also untrue that vit. A rice will lead to increased production of betacarotene. Even if the target of 33.3 microgram of vit. A in 100g of rice is achieved, it will be only 2.8% of betacarotene we can obtain from amaranth leaves 2.4% of betacarotene obtained from coriander leaves, curry leaves and drumstick leaves.
Even the World Bank has admitted that rediscovering and use of local plants and conservation of vit. A rich green leafy vegetables and fruits have dramatically reduced VAD threatened children over the past 20 years in very cheap and efficient ways. Women in Bengal use more than 200 varieties of field greens. Over a 3 million people have benefited greatly from a food based project for removing VAD by increasing vit. A availability through home gardens. The higher the diversity crops the better the uptake of pro-vitamin A.
The reason there is vit. A deficiency in India in spite of the rich biodiversity a base and indigenous knowledge base in India is because the Green Revolution technologies wiped out biodiversity by converting mixed cropping systems to monocultures of wheat and rice and by spreading the use of herbicides which destroy field greens.
In spite of effective and proven alternatives, a technology transfer agreement has been signed between the Swiss Government and the Government of India for the transfer of genetically engineered vit. A rice to India. The ICAR, ICMR, ICDS, USAIUD, UNICEF, WHO
have been identified as potential partners. The breeding and transformation is to be carried out at Tamil Nadu Agricultural University, Coimbatore, Central Rice Research Institute, Cuttack and Punjab Agricultural University, Ludhiana and University of Delhi, South Campus.
The Indian varieties in which the vit. A traits are expected to be engineered have been identified as IR 64, Pusa Basmati, PR 114 and ASD 16.
Dr. M.S. Swaminathan has been identified as “God father” to ensuring public acceptance of genetically engineered rice. DBT & ICAR are also potential partners for guaranteeing public acceptance and steady progress of the project.
Genetically engineered vit. A rice will aggravate this destruction since it is part of an industrial agriculture, intensive input package. It will also lead to major water scarcity since it is a water intensive crop and displaces water prudent sources of vit. A.
Transferring an Illusion to India.
The first step in the technology transfer of vit. A rice requires a need assessment and an assessment of technology availability. One assessment shows that vit. A rice fails to pass the need test.
The technology availability issue is related to whether the various elements and methods used for the construction of transgenic crop plants are covered by intellectual property rights. Licenses for these rights need to be obtained before a product can be commercialised. The Cornell based ISAAA (International Service for the Acquisition of Agri-biotech Application) has been identified as the partner for ensuring technology availability by ensuring technology availability by having material transfer agreements signed between the representative authority of the ICAR and the “owners” of the technology, Prof. I. Potrykus and Prof. P. Beyer.
In addition, Novartis and Kerin Breweries have patents on the genes used as constructs for the vit. A rice.
At a public hearing on Biotechnology at U.S. Congress on 29th June 2000, Astra-Zeneca stated they would be giving away royalty free licenses for the development of “Golden rice”.
At a workshop organised by the M. S.
74
Swaminathan Research Foundation, Dr. Barry of Monsanto’s Rice Genome initiative announced that it will provide royalty-free licenses for all its technologies that can help the further development of “golden rice”.
Hence these gene giants Novartis, Astra-Zeneca and Monsanto are claiming exclusive ownership to the basic patents related to rice research. Further, neither Monsanto nor Astra – Zeneca said they will give up their patents on rice – they are merely giving royalty free licenses to public sector scientists for development of “golden rice”. This is an arrangement for a public subsidy to corporate giants for R&D since they do not have the expertise or experience with rice breeding which public institutions have. Not giving up the patents, but merely giving royalty free licenses implies that the corporations like Monsanto would ultimately like to collect royalties from farmers for rice varieties developed
by public sector research systems. Monsanto has stated that it expects long term gains from these IPR arrangements, which implies markets in rice as “intellectual property” which cannot be saved or exchanged for seed. The real test for Monsanto would be its declaration of giving up any patent claims to rice now and in the future and joining the call to remove plants and biodiversity out of TRIPS. Failing such an undertaking by Monsanto the announcement that Monsanto giving royalty free licenses for development of vit. A rice like the rice itself can only be taken as a hoax to establish monopoly over rice production, and reduce rice farmers of India into bio-serfs.
While the complicated technology transfer package of “Golden Rice” will not solve vit. A problems in India, it is a very effective strategy for corporate take over of rice production, using the public sector as a Trojan horse.
75
India is passing through the dietary or nutritional transition, face a double burden. Malnutrition
takes on a double face. On the one hand, under nutrition, on the other, over nutrition and its equally debilitating health effects.
A number of chronic diseases are now occurring in India for which unhealthy diet is a leading cause. There is a great difference in the way Western Countries went through and India is experiencing, dietary transition. The shift in diet that took 100-150 years in the West is happening within a few years in India. Of course, the pace varies from state to state, depending on income and the market tune in it.
Nutrition – the nourishment of the human body – has become an increasingly absent factor in the development process in India, both in terms of how the process was envisioned or planned for and how it actually unfolded over time. The balance whereby the ecology of the human body renders itself sustainable has, over time, degraded. It has degraded to the point that today the country faces a double burden. Even as rural India struggles unsuccessfully to shrug off an older legacy of undernourishment, urban India – firmly in the lap of a globalised diet consisting of fats and sugar – tries to come to terms with over nourishment and the ill-health that too much of bad food has begun to lead to. Both are forms of malnourishment; that they co-exist today points to a failure so systematic that the question must be asked: surely the Indian state could not have intended its people to be so burdened? Where are all the extra calories coming from? From the Americanisation of food habits. From more sedentary urban lifestyles. But one surprising source is the raw grains and other ingredients people today use to cook ‘traditional’ dishes.
Crops grown in big farms and processed en masse lose much of their nutrient value. What remains are simple carbohydrates, that the body can turn more easily into fat. Home-cooked paranthas in north India or idlis in south India – used to be made from whole grains, ground by hand. Now households use factory-made “refined” flour from which grain husks have been discarded, along with nutrients like fibre and minerals.
Processing reduces the nutritive value of food – forcing us to eat more calories without getting a corresponding dose of different nutrients. An example: while hundred gram of whole wheat contains 11.8 grams of protein, processing reduces it to 7.8 grams in white bread.
More serious is the fact that the average per capita per day intake of protein has declined in rural areas which means rural India is eating wrong. People in rural areas are chewing into more fat, a clear sign of bad eating habits. On average 70 percent of household consume protein less than the recommended daily allowance of 60 gms. Inadequacy also mark the consumption of micro nutrients such as iron and calcium.
The dietary transition consists of a number of interlinked shifts.
• A change in the methods of food production, processing, storage and distribution. As a capitalist economy assumes preponderance there come, usually in urban areas first and increasingly in rural areas, store-brought foods. There occurs a shift from traditional staple foods to processed foods. Subsidies on staples encourage a change in staple preferences: more milled and polished grain; more corn, or rice and wheat
CHAPTER – 7
Nutritional Transition to Unhealthy and Unsafe Food
76
• A shift in diet towards high-fat, refined carbohydrates and low fibre. The diet becomes more energy-dense: people get most of the calories their bodies require from fewer foods. The diet becomes rich in fat, especially saturated fat, and sugar, but deficient in complex carbohydrate foods that are the main source of dietary fibre.
• This has been accompanied by the consolidation of agricultural and food companies into large transnational corporations. Apart from globally sourcing supplies, centralizing strategic assets, resources and decision-making, these corporations penetrate new markets by purchasing large and often majority shares into local food producers, wholesalers or retailers. This process has now been canonized into law: World Trade Organization agreements place great pressure on developing countries to ‘structurally adjust’ markets.
Infact industrial agriculture created a system of food supply in which food stuff are far less nutritious. A medical study in UK examined 28 raw and 44 cooked vegetables, 17 fruits and 10 types of meat. The result showed all vegetables had lost up to 75 per cent of nutrients such as magnesium; meats had about half their minerals; and fruits had lost about two-thirds. A person would have to eat 10 tomatoes in 1991 to obtain the same copper that one tomato would have yielded in 1940, and 3 oranges to get the same iron as 50 years ago.
The research firm Synovate recently surveyed 13 countries on their food habits and health, particularly fast food culture and obesity. The results reveal that the number one fast food nation in the world is the United Kingdom. About 45 per cent of the people there are fast food eaters, and say “I like the taste of fast food too much to give it up.”
Next come the Americans, with 44 and Canadians with 37 per cent. At the other end of the scale are the French. A full 81 per cent of them reject fast food, as do 71 per cent of Singaporeans. These two countries too are globalised, developed nations, and yet their people reject fast food.
The so-called French Paradox of why metabolic disorders and diseases are the least, among Western nations, in France is answered in part by this statistic. Less than 30 per cent of French are overweight, and less than 24 per cent in Singapore.
The number in China is about 18 per cent. We had 15 per cent of Indians obese, not just overweight, in 1980; it jumped to 27 per cent in 2000. Where would urban India, the one that promotes, and prides itself on, globalization, like to be? With U.K. and U.S., or France, China and Singapore? The choice is ours.
Eating habits, cooking habits, cuisines have changed, are changing, across the country, across social strata, across the rural-urban divide. And for anybody’s money, it isn’t a change to inspire confidence in the future of public health.
Janki Tokas is a resident of DDA Flats in Munirka, as upper middle class locality in South Delhi. Her 13-year-old son’s eating habits drives her nuts. “We have to buy a lot of junk food for him. He just refuses to have the normal rice-and-daal meal. He has cakes and biscuit in the morning, pizzas or Maggi at lunch and paratha at night. This he supplements with liberal doses of soft drinks says Ms. Tokas.
There are people who are aware of the need to balance their diets. But that does not necessarily help for instance, Geeta Devi in R.K. Puram locality in New Delhi sends her five year daughter to school with Kellogs Choco biscuits and a slice of cheese, believing these are better than the chips and assorted junk food other kids eat.
Nafees Ahmad, an advocate in Ghaziabad tries to stick to balance diet. But being an advocate convenience is also important. He is forced to take recourse to the supermarket. Packaged food like pasta, cheese, biscuits, chocolates are on his shopping list. The examples of Janki, Geeta or Nafees shows that there are the people who are under illusion that they are eating healthy, are not actually doing this.
Instant food sells the most these days, especially Maggi. Chhotu, owner of small provision shop in Nanakpura has also noticed the change. “People now buy a lot of bread, biscuits
77
and maggi noodles, because they do not have time to cook in the morning” says Chhotu. He adds, “What families eat now is not dependent on parents anymore. It is all upto the kids and what they want and what they want is what they watch in T.V. ads. Also, it is convenient for working mothers.
All these diets fall woefully short of the ICMR dietary guidelines. The guidelines suggest minimizing packaged food, white bread and fried food and recommends pulses, fresh fruit and vegetables. WHO also suggests the only way to curb chronic diseases is to increase consumption of fresh fruit and vegetables and decrease that of sugar, salt and oil, all commonly found in processed food.
• A study carried out in Ludhiana city, Punjab, showed that high consumption of fat (50.3 + 3.2 gm per day), roots and tubers (76.8 + 6.4 gm per day) and milk (341.7 + 25.5 gm per day) were the major causes of obesity in children. A similar study by the All India Institute of Medical Sciences, New Delhi, linked obesity in one of Delhi’s elite schools with junk food and lack of outdoor activity.Among children in urban regions of district
Dharwad in Karnataka showed that the prevalence of obesity in children aged 12-17 was 5.8 per cent. A similar one, carried out in the public schools of Meerut City, Uttar Pradesh, showed that in children aged 10-19, the prevalence of obesity was 8.4 per cent.
78
The food and hunger crisis is rooted in how we produce food and how we distribute it.
Industrialisation of agriculture and globalization of food systems create hunger and malnutrition yet industrialization and globalization of food systems are offered cures for hunger and malnutrition.
In the Indian context, agriculture, food and nutrition are addressed independent of each other, even though what food is grown determines its nutritional value. It also determines distribution patterns and entitlements. If we grow millets and pulses, we will have more nutrition per capita. If we grow food with chemicals, and we grow monocultures, we will have less nutrition per acre and less nutrition per capita. If we grow food ecologically with internal inputs, more food will stay with the farming household and there will be less malnutrition in rural children. If we grow food chemically, with purchased seeds and costly chemicals, less food will be retained by rural producers, more will go out as commodities, leaving rural areas nutritionally deprived.
Agriculture policy focuses on increasing yields of individual crops – not the output of the food system and its nutritional value. The food security system is based on the Public Distribution System, which does not address issues of nutrition and quality of food distribution. And nutritional programmes are divorced from both agriculture and food security.
The agrarian crisis, the food crisis and the nutritional crisis are intimately connected. They need to be addressed together. The objective of agriculture policy must not be guided by maximizing sales of costly seeds and costly
chemicals which rob the soil, the farmers, and the people of nutrition. The objective of food policy cannot be based on promoting industrial processing of food. The objective of nutritional policy cannot be the creation of a malnutrition market. The chemicalisation of agriculture and the chemicalisation of food are recipes for denutrification of our food. They cannot solve the problem of hunger and malnutrition. The solution to malnutrition begins with the soil. Healthy soils support healthy people.
“A fertile soil, that is, a soil teeming with healthy life in the shape of abundant microflora and microfauna, will bear healthy plants, and these, when consumed by animals and man, will confer health on animals and man. But an infertile soil, that is, one lacking sufficient microbial, fungous, and other life, will pass on some form of deficiency to the plant, and such plant, in turn, will pass on some form of deficiency to animal and man”
- Louise Howard in Sir Albert Howard in India
Hunger and malnutrition begin in the soil, and it is in the soil that solutions to hunger and malnutrition lie.
Industrial agriculture, sold as the Green Revolution and 2nd Green Revolution to Third World countries, is a chemical intensive, capital intensive, fossil fuel intensive system. It must, by its very structure, push farmers into debt, and indebted farmers everywhere are pushed off the land, as their farms are foreclosed and appropriated. In the poor countries, farmers trapped in debt for purchasing costly chemicals and non-renewable seeds, sell the food they grow
CHAPTER – 8
Eco-Nutrition : How Biodiverse Organic Farming Addresses Hunger and Malnutrition
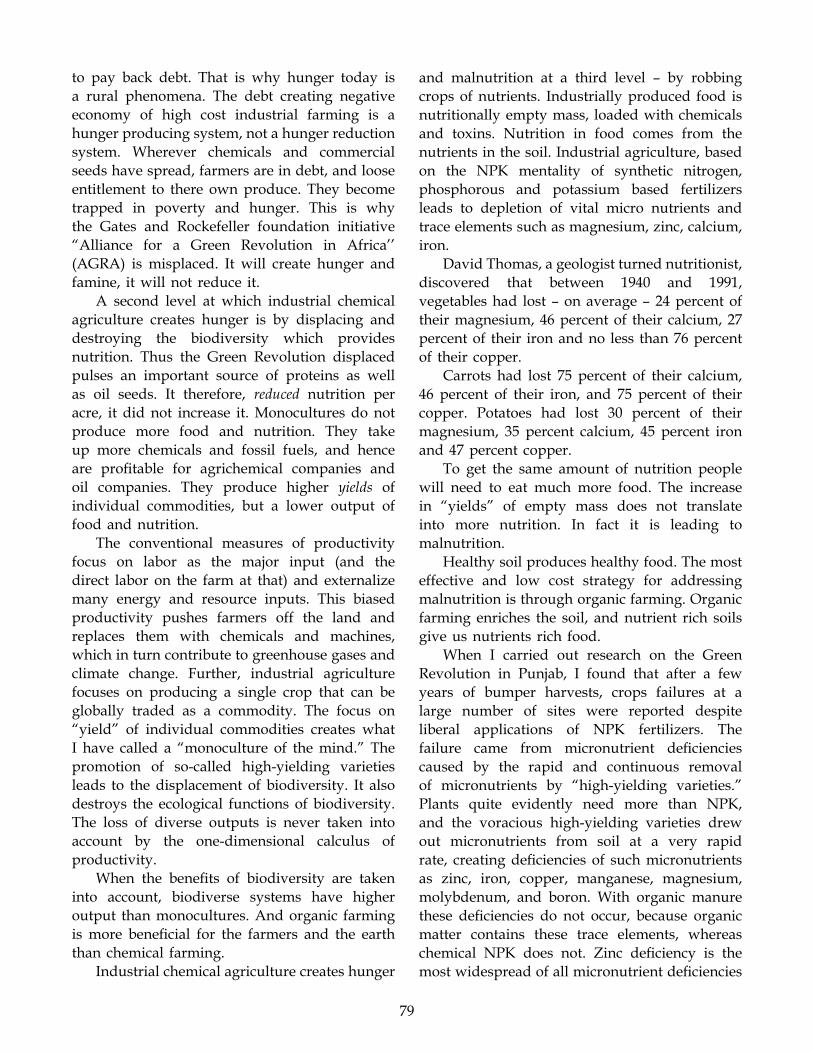
79
to pay back debt. That is why hunger today is a rural phenomena. The debt creating negative economy of high cost industrial farming is a hunger producing system, not a hunger reduction system. Wherever chemicals and commercial seeds have spread, farmers are in debt, and loose entitlement to there own produce. They become trapped in poverty and hunger. This is why the Gates and Rockefeller foundation initiative “Alliance for a Green Revolution in Africa’’ (AGRA) is misplaced. It will create hunger and famine, it will not reduce it.
A second level at which industrial chemical agriculture creates hunger is by displacing and destroying the biodiversity which provides nutrition. Thus the Green Revolution displaced pulses an important source of proteins as well as oil seeds. It therefore, reduced nutrition per acre, it did not increase it. Monocultures do not produce more food and nutrition. They take up more chemicals and fossil fuels, and hence are profitable for agrichemical companies and oil companies. They produce higher yields of individual commodities, but a lower output of food and nutrition.
The conventional measures of productivity focus on labor as the major input (and the direct labor on the farm at that) and externalize many energy and resource inputs. This biased productivity pushes farmers off the land and replaces them with chemicals and machines, which in turn contribute to greenhouse gases and climate change. Further, industrial agriculture focuses on producing a single crop that can be globally traded as a commodity. The focus on “yield” of individual commodities creates what I have called a “monoculture of the mind.” The promotion of so-called high-yielding varieties leads to the displacement of biodiversity. It also destroys the ecological functions of biodiversity. The loss of diverse outputs is never taken into account by the one-dimensional calculus of productivity.
When the benefits of biodiversity are taken into account, biodiverse systems have higher output than monocultures. And organic farming is more beneficial for the farmers and the earth than chemical farming.
Industrial chemical agriculture creates hunger
and malnutrition at a third level – by robbing crops of nutrients. Industrially produced food is nutritionally empty mass, loaded with chemicals and toxins. Nutrition in food comes from the nutrients in the soil. Industrial agriculture, based on the NPK mentality of synthetic nitrogen, phosphorous and potassium based fertilizers leads to depletion of vital micro nutrients and trace elements such as magnesium, zinc, calcium, iron.
David Thomas, a geologist turned nutritionist, discovered that between 1940 and 1991, vegetables had lost – on average – 24 percent of their magnesium, 46 percent of their calcium, 27 percent of their iron and no less than 76 percent of their copper.
Carrots had lost 75 percent of their calcium, 46 percent of their iron, and 75 percent of their copper. Potatoes had lost 30 percent of their magnesium, 35 percent calcium, 45 percent iron and 47 percent copper.
To get the same amount of nutrition people will need to eat much more food. The increase in “yields” of empty mass does not translate into more nutrition. In fact it is leading to malnutrition.
Healthy soil produces healthy food. The most effective and low cost strategy for addressing malnutrition is through organic farming. Organic farming enriches the soil, and nutrient rich soils give us nutrients rich food.
When I carried out research on the Green Revolution in Punjab, I found that after a few years of bumper harvests, crops failures at a large number of sites were reported despite liberal applications of NPK fertilizers. The failure came from micronutrient deficiencies caused by the rapid and continuous removal of micronutrients by “high-yielding varieties.” Plants quite evidently need more than NPK, and the voracious high-yielding varieties drew out micronutrients from soil at a very rapid rate, creating deficiencies of such micronutrients as zinc, iron, copper, manganese, magnesium, molybdenum, and boron. With organic manure these deficiencies do not occur, because organic matter contains these trace elements, whereas chemical NPK does not. Zinc deficiency is the most widespread of all micronutrient deficiencies
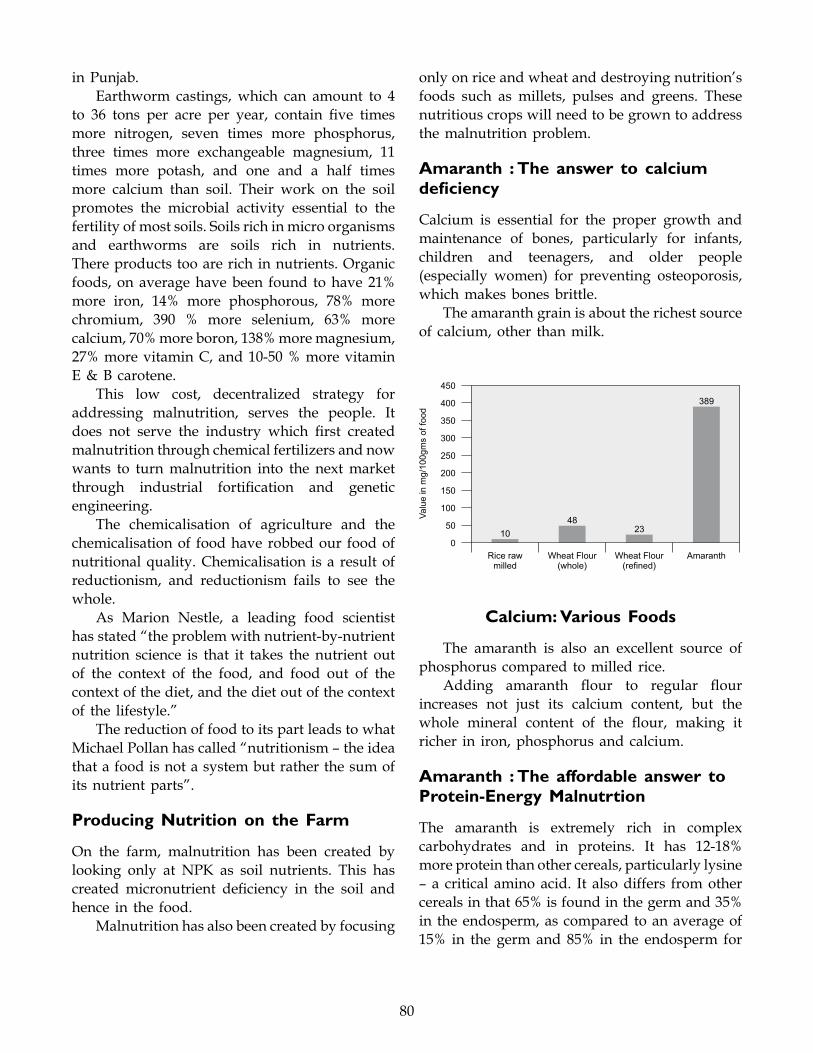
80
in Punjab.Earthworm castings, which can amount to 4
to 36 tons per acre per year, contain five times more nitrogen, seven times more phosphorus, three times more exchangeable magnesium, 11 times more potash, and one and a half times more calcium than soil. Their work on the soil promotes the microbial activity essential to the fertility of most soils. Soils rich in micro organisms and earthworms are soils rich in nutrients. There products too are rich in nutrients. Organic foods, on average have been found to have 21% more iron, 14% more phosphorous, 78% more chromium, 390 % more selenium, 63% more calcium, 70% more boron, 138% more magnesium, 27% more vitamin C, and 10-50 % more vitamin E & B carotene.
This low cost, decentralized strategy for addressing malnutrition, serves the people. It does not serve the industry which first created malnutrition through chemical fertilizers and now wants to turn malnutrition into the next market through industrial fortification and genetic engineering.
The chemicalisation of agriculture and the chemicalisation of food have robbed our food of nutritional quality. Chemicalisation is a result of reductionism, and reductionism fails to see the whole.
As Marion Nestle, a leading food scientist has stated “the problem with nutrient-by-nutrient nutrition science is that it takes the nutrient out of the context of the food, and food out of the context of the diet, and the diet out of the context of the lifestyle.”
The reduction of food to its part leads to what Michael Pollan has called “nutritionism – the idea that a food is not a system but rather the sum of its nutrient parts”.
Producing Nutrition on the Farm
On the farm, malnutrition has been created by looking only at NPK as soil nutrients. This has created micronutrient deficiency in the soil and hence in the food.
Malnutrition has also been created by focusing
only on rice and wheat and destroying nutrition’s foods such as millets, pulses and greens. These nutritious crops will need to be grown to address the malnutrition problem.
Amaranth : The answer to calcium deficiency
Calcium is essential for the proper growth and maintenance of bones, particularly for infants, children and teenagers, and older people (especially women) for preventing osteoporosis, which makes bones brittle.
The amaranth grain is about the richest source of calcium, other than milk.
Calcium: Various Foods
The amaranth is also an excellent source of phosphorus compared to milled rice.
Adding amaranth flour to regular flour increases not just its calcium content, but the whole mineral content of the flour, making it richer in iron, phosphorus and calcium.
Amaranth : The affordable answer to Protein-Energy Malnutrtion
The amaranth is extremely rich in complex carbohydrates and in proteins. It has 12-18% more protein than other cereals, particularly lysine – a critical amino acid. It also differs from other cereals in that 65% is found in the germ and 35% in the endosperm, as compared to an average of 15% in the germ and 85% in the endosperm for
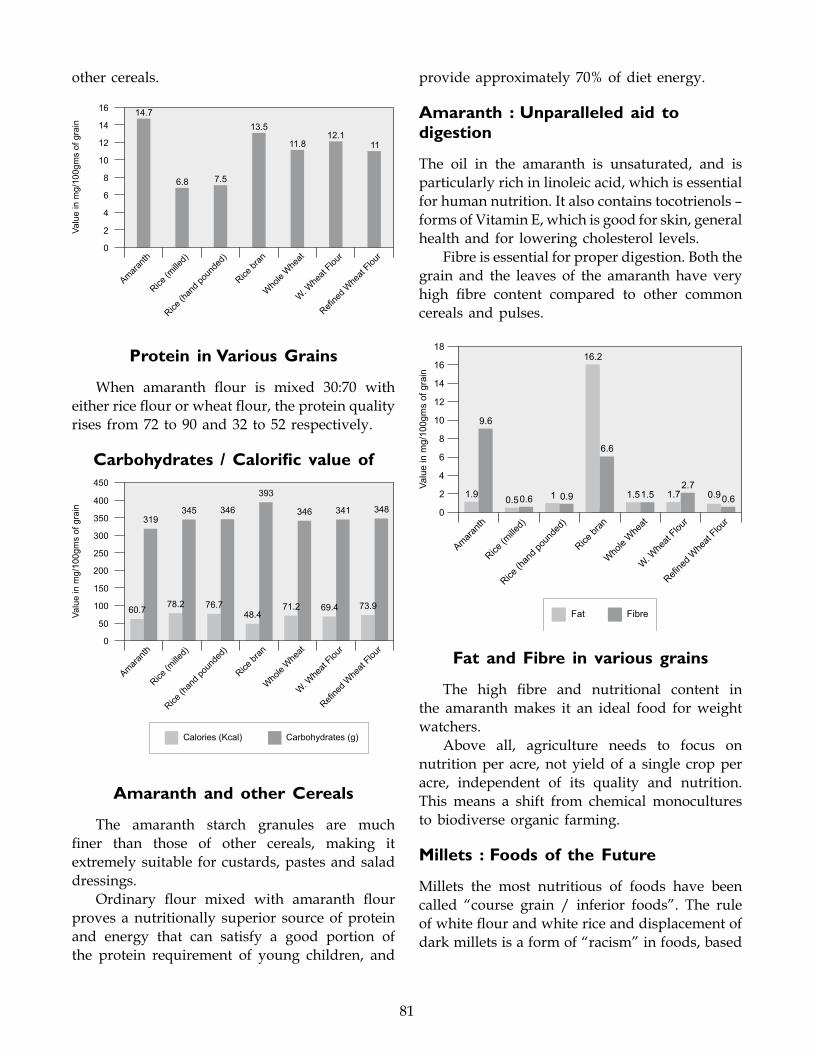
81
other cereals. provide approximately 70% of diet energy.
Amaranth : Unparalleled aid to digestion
The oil in the amaranth is unsaturated, and is particularly rich in linoleic acid, which is essential for human nutrition. It also contains tocotrienols – forms of Vitamin E, which is good for skin, general health and for lowering cholesterol levels.
Fibre is essential for proper digestion. Both the grain and the leaves of the amaranth have very high fibre content compared to other common cereals and pulses.
Protein in Various Grains
When amaranth flour is mixed 30:70 with either rice flour or wheat flour, the protein quality rises from 72 to 90 and 32 to 52 respectively.
Carbohydrates / Calorific value of
Amaranth and other Cereals
The amaranth starch granules are much finer than those of other cereals, making it extremely suitable for custards, pastes and salad dressings.
Ordinary flour mixed with amaranth flour proves a nutritionally superior source of protein and energy that can satisfy a good portion of the protein requirement of young children, and
Fat and Fibre in various grains
The high fibre and nutritional content in the amaranth makes it an ideal food for weight watchers.
Above all, agriculture needs to focus on nutrition per acre, not yield of a single crop per acre, independent of its quality and nutrition. This means a shift from chemical monocultures to biodiverse organic farming.
Millets : Foods of the Future
Millets the most nutritious of foods have been called “course grain / inferior foods”. The rule of white flour and white rice and displacement of dark millets is a form of “racism” in foods, based
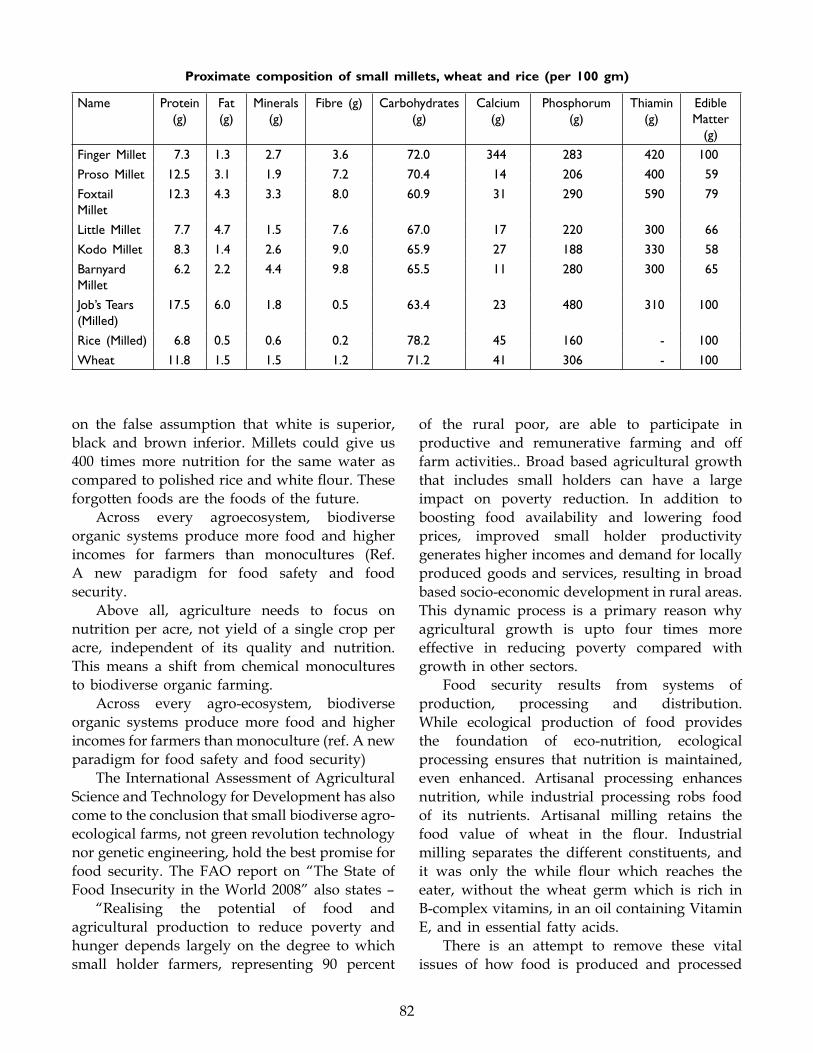
82
on the false assumption that white is superior, black and brown inferior. Millets could give us 400 times more nutrition for the same water as compared to polished rice and white flour. These forgotten foods are the foods of the future.
Across every agroecosystem, biodiverse organic systems produce more food and higher incomes for farmers than monocultures (Ref. A new paradigm for food safety and food security.
Above all, agriculture needs to focus on nutrition per acre, not yield of a single crop per acre, independent of its quality and nutrition. This means a shift from chemical monocultures to biodiverse organic farming.
Across every agro-ecosystem, biodiverse organic systems produce more food and higher incomes for farmers than monoculture (ref. A new paradigm for food safety and food security)
The International Assessment of Agricultural Science and Technology for Development has also come to the conclusion that small biodiverse agro-ecological farms, not green revolution technology nor genetic engineering, hold the best promise for food security. The FAO report on “The State of Food Insecurity in the World 2008” also states –
“Realising the potential of food and agricultural production to reduce poverty and hunger depends largely on the degree to which small holder farmers, representing 90 percent
of the rural poor, are able to participate in productive and remunerative farming and off farm activities.. Broad based agricultural growth that includes small holders can have a large impact on poverty reduction. In addition to boosting food availability and lowering food prices, improved small holder productivity generates higher incomes and demand for locally produced goods and services, resulting in broad based socio-economic development in rural areas. This dynamic process is a primary reason why agricultural growth is upto four times more effective in reducing poverty compared with growth in other sectors.
Food security results from systems of production, processing and distribution. While ecological production of food provides the foundation of eco-nutrition, ecological processing ensures that nutrition is maintained, even enhanced. Artisanal processing enhances nutrition, while industrial processing robs food of its nutrients. Artisanal milling retains the food value of wheat in the flour. Industrial milling separates the different constituents, and it was only the while flour which reaches the eater, without the wheat germ which is rich in B-complex vitamins, in an oil containing Vitamin E, and in essential fatty acids.
There is an attempt to remove these vital issues of how food is produced and processed
Proximate composition of small millets, wheat and rice (per 100 gm)
Name Protein (g)
Fat(g)
Minerals (g)
Fibre (g) Carbohydrates (g)
Calcium (g)
Phosphorum (g)
Thiamin (g)
Edible Matter
(g)
Finger Millet 7.3 1.3 2.7 3.6 72.0 344 283 420 100
Proso Millet 12.5 3.1 1.9 7.2 70.4 14 206 400 59
Foxtail Millet
12.3 4.3 3.3 8.0 60.9 31 290 590 79
Little Millet 7.7 4.7 1.5 7.6 67.0 17 220 300 66
Kodo Millet 8.3 1.4 2.6 9.0 65.9 27 188 330 58
Barnyard Millet
6.2 2.2 4.4 9.8 65.5 11 280 300 65
Job’s Tears (Milled)
17.5 6.0 1.8 0.5 63.4 23 480 310 100
Rice (Milled) 6.8 0.5 0.6 0.2 78.2 45 160 - 100
Wheat 11.8 1.5 1.5 1.2 71.2 41 306 - 100

83
from the definition of food security. Infact, at a time when the west is itself questioning the western diet because of obesity and diabetes and micronutrient deficiencies, India is rushing head long into adopting a western industrialized food diet.
As nutritionist Carol Simontacchi says in her book “Crazy Makers”
“We’ve been told over and over that our food choices are contributing to degenerative diseases like cancer, diabetes, and heart disease. Maybe its time that we explore the possibility that these major American consumer brand “foods” are destroying our brains, too. Cell by cell.
When Rachel Carson published her indictment of industrial polluters, Silent Spring, in the early sixties, environmental rapists were held responsible for their destruction of the world we share. They have been and are being forced to clean up and to undo the damage they have done, either knowingly or unknowingly. They have been held accountable, and rightly so.
What about food industries that wantonly destroy our bodies and our brains, all in the name of profit? We call them “food manufacturing companies”, a nomenclature that is chilling. Are they manufacturing food, or food artifacts that look, taste and smell like the real thing? Are they redefining what we think food to be, while the words “food” and “nutrition” have lost their true meaning in our marketing / advertising driven world?”
And as Michael Pollen observes in his best seller “In Defense of Food” –
“People eating a western diet are prone to a complex of chronic diseases that seldom strike people eating more traditional diets. Scientists can argue all they want about the biological mechanisms behind this phenomenon, but whichever it is, the solution to the problem would appear to remain very much the same. Stop Eating a Western Diet”.
We cannot solve the malnutrition problem by adopting the industrial food systems the west itself is shedding. We need to base our
food security on eco-nutrition, from the field to the kitchen.
Eco-nutrition enhances nutrition in an integrated manner at two levels. Firstly, by viewing food as a whole, not merely through the reductionist lens of “nutritionism”. Secondly, by integrating the field to the kitchen through the food web.
Steps for an eco-nutrition agenda include –
1. Promotion of nutrition rich foods such as millets and dals. For this it is vital to stop referring to millets as “course grains”. They should be referred to as nutritious grains.
2. Promote mixed cropping and biodiverse farming to increase food output per acre and keep seed as a public good and a common property to guarantee farmers access to see.
3. Promote organic agriculture to enhance nutrition in the soil and thus in the food to solve the problem of micronutrient deficiency
4. Promote artisanal food processing to enhance and retain food value
5. Start kitchen gardens in urban and rural areas to make nutritious food and vegetables available.
6. Start school gardens to enhance eco-literacy about eco-nutrition and also supplement mid day meals with fresh nutritious vegetables.
7. Start farmers markets in every town and city to enable direct links between farmers – consumers and enhance farmers options so that their incomes stay in their hands and are not converted into profits for corporations and industrial houses, the emerging mega-middle men in the Indian food system through changes in the APMC Act.
8. Make the PDS system decentralized and universal.
9. Protect the soil and agriculture land. Soil provides the ground for food security. The destruction of farmland is directly linked to food insecurity. Madhya Pradesh has cultivated 33.89% less cropland in 2005-2006 compared to 1996-97. Madhya Pradesh is also the State with the worst food insecurity. Bihar lost 27.63 of its cropland and is also high in the hunger index.
Land Sovereignty is the first step to Food
84
Sovereignty.
The real creative solutions that the current food crisis demands are :
1. Stop policies to encourage unnecessary imports, stop reducing import duties on products Indian farmers can produce. Introduce QR’s. If the government can introduce export bans to manage prices, it must introduce import bans to protect farmers and regulate prices.
2. Stop policies that encourage futures trading and linking of peoples food rights with speculation in a global financial casino.
3. Stop diverting farmland and village common lands and grazing grounds to Jatropha for biofuel. Stop the diversion of sorghum and sugarcane to ethanol.
4. Stop promoting chemical fertilizer and fossil fuel based green revolution agriculture to mitigate climate change.
5. Stop policies that promote diverting food growing land to luxury export crops such as flowers and exotic vegetables.
6. A democratically controlled decentralized PDS system that guarantees food security for all is vital both to guarantee, secure and fair markets to producers and affordable, safe food to all.
7. Stop amendments of APMC Acts to create private mandis. Treat privte mandis as large scale hoarding violative of the essential commodities act. Stop passing laws to allow entry of the corporations into retail. Stop providing subsidies to industrial processing.
8. Stop appropriating fertile farmlands for SEZ’s The SEZ Act should be scrapped and farmlands should be protected for food security.
9. Stop deregulating India’s biosafety laws to promote GMO’s. Scrap the U.S _ India Agriculture Agreement which is foreclosing India’s options to do research on ecological, farmer centered strategies to increase food production. Promote ecological / organic farming to simultaneously address the
agrarian crisis and the food crisis.
No where in the Constitution is it said that the duty of the government is to protect “economic reforms” and trade liberalization even as people die. The Prime Minister has referred to introducing changes in the laws and policies for trade liberalization as “blind control”. The Constitution does have a clearly articulated Art. 21 that states that the state must protect the right to life of all its citizens.
Denial of food is denial of the right to life. Ensuring safe, good, and affordable food for all is central to protecting the right to life. This is not “blind control” but a Constitutional obligation of the state. And it is the Constitution and people’s rights enshrined in it which must guide policy, not blind adherence to a failed and false paradigm of trade liberalization and state intervention for corporate welfare.
As Ulrich Beck has written in a recent article on the financial crisis “A farce which shows how badly we need the state - “World Risk Society – The Play… Dramatis Personae are the hardcore neo-liberals who in the face of danger have overnight converted from the market faith to the state faith. Now they are praying, begging, pleading for the mercy of state intervention and multi billion dollar handouts of the taxpayers money….only one opponent of the free market remains : the unbridled free market itself” (Hindu, 10th April, 2008).
We cannot have state intervention to secure the profits and monopolies of corporations and refuse state intervention to secure food for the poor and hungry. This is regulatory schizophrema. And the price people are paying for this government’s schizophrema is now becoming too high.
85
A corporatized, understrualised, globalised for system has given us hunger and
malnutrition. We need to make a transition to people centered, ecological and decentralized food systems to address the deepening crisis of malnutrition and hunger. This transition involves radical changes in how food is produced and how it is distributed.
Chemical industrialized agriculture has been promoted on the false argument that it increases food production. In reality it has led to a decline in nutrition per acre.
Proposed Food Sovereignty Act : Blind Spots and Biases
The proposed introduction of a Food Security Act by the UPA Government is a welcome step. The Right to Food is the basis of the Right to life, and Art.21 of the Constitution guarantees the right to life of all Indian citizens.
Given that India has emerged as the capital of hunger, given that per capita consumption has 178 kg in 1991, the beginning of the period of economic reforms, to 155 kg in 200-2003, and daily calorie consumption of the bottom 25 percent of the population has decreased from 1683 k.cal in 1987-88 to 1624 k.cal in 2004-05, against a national norm of 2400 and 2011 k cal/day for rural and urban areas respectively, a response on the food in security front is a response to a national emergency.
However, the approach to food security has a number of blind spots and biases.
Blind Spot : Where does one food come from? How is it produced?
The biggest blind spot is neglecting food production and food producers as a core element
of food security, from the household to the national level. You cannot provide food to people if you do not first ensure that food is produced in adequate quantities. And to ensure food production, the livelihood of food producers must be ensured. The right of food producers to produce food is the foundation of food security. This right has internationally evolved through the concept of “food sovereignty”. In Navdanya we refer to it as Anna Swaraj.
Food Sovereignty is derived from socio-economic human rights, which include the right to food and the right to produce food for rural communities. As Peter Rosset has recently written in Monthly Rview July – August, 2007 (Fixing Our Global Food System) “Food Sovereignty argues that feeding a nations people is an issue of national security – of sovereignty, if you will. If the population of a country must depend for their next meal on the vagaries and price swings of the global economy, on the good will of a superpower not to use food as a weapon, or on the unpredictability and high cost of long-distance shipping, then the country is not secure, neither in the sense of national security, nor in the sense of food security. Food sovereignty thus goes beyond the concept of food security, which says nothing about where food comes from, or how it is produced. To achieve genuine sovereignty, people in rural areas must have access to productive land and receive prices for their crops that allow them to make a decent living while feeding the nations people.
Two aspects of food security have disappeared in the current approach – firstly, the right to produce food, and secondly national food security. Both are aspects of food sovereignty, one at the level of food producers and the other at the level of the country as a whole.
CHAPTER – 9
Food Sovereignty (Anna Swaraj)
86
Any country risks genuine food security if it ignores food is higher because two thirds of our population is involved in agriculture and food production, our small farmers produce food for the country and have provided a nation of 1.2 billion with food security, and today they themselves are in distress.
The most tragic face of the agrarian crisis the country is facing are the suicides of over 200,000 farmers over the past decade. If our food producers do not survive, where is the nation’s food security?
The second reason why India cannot afford to ignore the crisis of our food producers is because our rural communities face a deep crisis of hunger. Globally too, half of the hungry people of the world today are food producers. This is directly related to the capital intensive, chemical intensive, high external input systems of food production introduced as the Green Revolution, and the second Green Revolution. Farmers must get into debt to buy costly inputs, and indebted farmers must sell what they produce to pay back the debt. Hence the paradox and irony of food producers being the highest number of hungry people in India and in the world. Farmers suicides too are linked to the same process of indebtedness due to high costs of inputs.
The solution to the hunger of producer communities is to shift to low cost sustainable agriculture production based on principles of agro ecology. And contrary to the false perception that small farmers and sustainable systems do not produce enough, data from India and other parts of the world establishes that small farmers have higher output than large farms, that biodiverse organic farms have high food output than chemical monocultures. This is also confirmed by the IAASTD report.
This food sovereignty of rural producers addresses hunger of rural communities as well as the hunger of those they feed. And for the same reasons, corporate farming and contract farming are false solutions in the context of the hunger and malnutrition crisis facing the country. As is the corporate take over of food processing and attempted hijack of our food security programmes such as ICDS and Mid Day Meal Schemes.
Biases
The Governments policies are biased in favour of the corporate sector. The proposal to shift from the PDS system to the food stamp or food voucher systems arises from this corporate bias. The assumption is that corporations will control the food supply, and the government will enable the poor to buy from corporations on the basis of food stamps and vouchers. However, the poor will then be condemned to the least nutritious unhealthy food as has happened in countries like the U.S
As Tolstoy put it when he was involved in setting up soup kitchens during the Russian famine of 1891-1892, he despaired that they were “distributing the vomit, regurgitated by the rich”
A food security system that does not include food sovereignty and that does not build public food systems must condemn the poor to food unfit for humans. This is what happened when India imported pest weed, pesticide infested wheat two years ago. The Chennai Port Authority, and the Maharashtra Government both said that wheat was unfit for human consumption.
The present paradigm has the bias that the poor can eat bad food. Good food is only for the rich.
However food security includes the right to safe, healthy, culturally appropriate and economically affordable food. Food stamps cannot guarantee this. Further, the PDS ystem is not a one sided system. It is both a food procurement and food distribution system. Its dismantling and substitution by food vouchers will erode the food sovereignty of producers, abandon them to the vagaries of the market and finally destroy their livelihoods.
Adding 650 million rural people to the displaced and hungry will create a hunger problem no government and no market can solve.
That is why we must strengthen food sovereignty and the PDS system to strengthen food security.
87
Anti Constitution
The proposals of the Government that the centre will identify the poor goes against the federal structure of India’s Constitution. As Chief Minister of Punjab Prakash Singh Badal has recently said (Indian Express 5.7.06) “States have to go like beggars to the centre for everything. We have been reduced to glorified municipalities”.
A national food security systems needs to be based on the Constitution. Decentralisation is key to ensuring good and abundant food is produced on every farm and reaches every kitchen. Centralisation and corporate hijack of food go hand in hand. Decentralisation and food sovereignty go hand in hand.
Food Sovereignty (Anna Swaraj)
Anna Swaraj: Creating a genuine decentralised food and agriculture system for national food sovereignty and people’s food security
Quite clearly, the “decentralisation” that is being offered by the centre today is a higher centralization by corporations.
The transition from a national centralised system built over more than 30 years to a genuinely decentralised system cannot be instantaneous. A demand for instantaneous transition is a recipe for a mafia-like takeover of the food and agricultural system by the market.
Requirements for transition to genuine decentralisation
• A five year transition is needed to move from the present centralized system to a genuinely decentralised system, which must evolve through democratic discussion among communities for local and household food security and with the states for regional food security, within the constitutional guarantees of Panchayati Raj and Federal structure.
• In the interim period, while states are building capacity, infrastructure and raising resources, the FCI must continue to be the main procurer of foodgrains in the country to ensure food security.
• The PDS system must be maintained, and the artificial divide of BPL and APL categories must be removed to ensure that all the people of the country have access to food at all times.
Putting the food security of the people and of the nation on the market is putting the sovereignty of the nation on the market.
The decentralised democratic people’s food security model
A truly people-centred decentralised democratic model of food procurement and distribution for food security has to ensure:
• Food security at the household level;• Food security at the local level;• Food security at the regional level;• Food security at the national level.
The present food crisis is reflected in bursting godowns and starving people – a reflection of total food insecurity at the household, local and regional levels.
A truly decentralised democratic model will put the foundation of national food security - household food security – in women’s hands.
Elements of women-centred household food security
• high nutrition-per-acre to increase nutritional security
• Internal input agricultural practice to reduce debt and expenditure on purchased inputs.
• Increased use of drought resistance varieties and crops to reduce ecological vulnerability
Organic methods to improve soil moisture, conservation and reduce water demand.
• Diversity of crops to ensure balanced nutrition throughout the year.
• Use of farmer saved open pollinated varieties to reduce costs and improve adaptation.Elements of gram-sabha centred local level
food security
• Food security should be a central element of genuine decentralisation of the food system.
88
For gram sabhas to be empowered to function as providers of food security, they need to:
• Establish community grain banks – Gram Annakosh
• Receive grants to procure locally so that local producers’ livelihoods are protected and hence their food entitlement is protected.
• Local procurement reduces storage and transport costs.
• Local procurement provides culturally appropriate foods.
• Use locally procured grain for all public food-related programmes and schemes like ICDS, Food for Work Schemes, Anna Antyodaya, Jawahar Rozgar Yojna and other development programmes, school mid-day meals, as well as in all other public sector institutions such as primary health centres, district health centres, canteens, railways, etc.
• In case surpluses exist after meeting local needs, village grain bank should sell to grain banks of state and centre.
• In case of scarcity and emergency, village grain banks receive from state and central grain banks.
• Gram sabha has the right to develop a taxation system to raise complementary financial resources for procurement and running the Gram Annakosh.
State level Food Security System – Kshetriya Annakosh
• States are empowered to procure regionally with the centre providing adequate financial resources during the transition period.
• State policies include ability to raise complementary financial resources through taxation.
• State governments procure surpluses from Gram Sabhas.
• Kshetriya Annakosh provides food to Gram Sabhas in periods of regional food scarcity and emergency.
• Kshetriya Annakosh will provide food to all public institutions and schemes related to food such as ICDS, PDS, Food-for-work schemes, state-run hospitals, health centres and clinics,
state institution canteens including canteens of legislative assemblies; railways, etc.
• State agricultural policies should be redirected from non-sustainable, water- and capital-intensive food production systems to sustainable, water prudent, low input systems of food production.
National level food security System – Rashtriya Annakosh
• Maintain the FCI as the central institution of procurement during the transition to multilevel food procurement system to ensure genuine decentralisation and effective food security at household, local, regional and national levels.
• Maintain the PDS system merging the BPL with the APL so that all peoples access to food is protected
• Develop, over 5 years, a multi-layered PDS system with responsibilities at each level that matches with rights and capacities at that level.
• Centre continues to fix a uniform minimum support price for foodgrains and ensures its implementation, both for public and private procurement, so that internal dumping of foodgrain does not occur, and farmers get a fair price.
• Revision of New Agricultural Policy to make it farmer-centred and food security-centred rather than corporation-centred, by removing
a. contract farmingb. incentives such as tax holidays, tax
concessions, low lending rate, etc. to corporations for taking over food system
c. ban futures trading in food grains
• Policy should give priority to local production, local procurement and local processing.
• Removal of Farm-to-Port clauses in EXIM policy and Zero excise duty for industrial agroprocessing.
• Exports to be routed through state agencies after ensuring the existence of genuine surpluses after ensuring domestic food
89
security at the levels of the household, the village, the region and the nation have been met.
• Imports only to be in periods of genuine scarcity.
• Remove restrictions on transport of food within the country by farmers rather than traders.
• New taxes on luxury consumption, corporations, increase in tariffs on agricultural imports and exports to finance national food security system including financial resources to be transferred to states and Gram Sabhas.
• Maintain national buffer stocks.• Bring back quantitative restrictions on imports
and exports of agricultural commodities and food by using Art. 20 and 21 of the WTO Agreement on Agriculture.
• Negotiate for change in WTO’s Agreement on Agriculture to ensure that livelihood and food security boxes empower India to be exempted from trade liberalisation rules of WTO in areas of food and agriculture.
• Fix maximum retail price for essential commodities.
• Ensure labeling for food safety, including freedom from genetic engineering.
WTO Reforms for a Genuinely Decentralised Food System
The present rules of the WTO including its various treaties such as the AoA, TRIPs and GATS undermine the Constitution of the country by threatening the fundamental right to food, the Panchayati Raj Amendment and the federal structure of the Constitution.
The re-negotiated terms part of the citizen’s call for WTO: SINK OR SHRINK.
The re-negotiation should include, as part of creating a genuinely decentralised agenda for food security system,
• Agreement on Agriculture –The negotiations must reject the clauses on Market Access, removal of Quantitative Restrictions on imports and exports and removal of subsidies to farmers and food subsidies for consumers. Quantitative restrictions must be re-imposed on food and agricultural items.
• Trade Related Intellectual Property Rights (TRIPs) – Food security is not possible without farmers right to safe seed. Monopoly IPRs on seeds, plants and other lifeforms threaten farmers right to safe seed and thus endanger food security.
• Sanitary and Phytosanitary Agreement. The current dominant interpretation of the Agreement allows the shutting up on safe foods on SPS grounds – such as banning freshly pressed low-cost, healthy mustard oil, while allowing the introduction of hazardous foods – such as genetically engineered food products, meat products that increase health hazards and public health problems. Each nation needs to develop its own national system that meets its national needs of safety rather than being limited/directed y the present interpretation of the SPS.
• General Agreement on Trade in Services (GATS) covers food distribution and water by bringing both sectors under services. Thus it allows corporate takeover of essential commodities and vital resources, without which it is not possible to survive. Food and Water cannot be brought under GATS.
People’s Charter for Food Security
In 1995, Navdanya organized a national discourse on Globalisation and Food Security to identify the threats from globalisation to national food sovereignty and people’s food security. The outcome of the discourse took the form of a Charter.
The Right to Food Security
We believe, food security is a human right.We believe, food is first and foremost a source
of nutrition, and only secondarily, an item of trade.
We believe, that food security can be guaranteed only if :
There is enough food available Such food is accessible People have power to access food, and People have the freedom of choice with regard
to the food they produce and consume.
90
We believe, that trade in the area of food and agriculture needs to be guided by equity and ecological imperatives.
We believe, therefore, that food security cannot be ensured by entrusting agriculture, food production and trade to global markets.
The complete commercialization of all agriculture, in the context of the extent occupational distribution of the work force will lead to large-scale displacement of farmers from agricultural production and the adequacy of food supply and consumption patterns that would ensure environmental protection, health safety and food entitlements.
Trade liberalization will result in the creation of a class of ‘redundant’ humans, comprising mainly of displaced landless rural agro-related communities, including artisans and fisherfolk, who will be doubly hit by the loss of their traditional markets and linkages with the agro-sector as well by loss of food entitlements. The food security of this new class of ‘dispensable people with neither food entitlements or purchasing power will be totally denied by an agri-business dominated agriculture.
We foresee the need to accord special protection to these vulnerable communities, in areas here there is danger of takeover of local resources and increasing lack of purchasing power. By protecting the production and market systems that meet local needs and offer local solutions to the livelihood crisis.
There is an urgent need to build up adequate national food reserves, for meeting the needs of communities that will be affected by severe scarcity and famine, as their livelihoods and food entitlements are destroyed by trade liberalization.
Decentralised Food System
We believe, that the sudden and total replacement of a centralized system of procurement and distribution of food, by a global market –oriented system of production and trade, would be to replace one defective system by another more defective and dangerous system. If the state withdraws, food security can only be ensured
by allowing local rather than global initiatives to takeover.
We believe, that there is need for greater local self-sufficiency in regard to food production, in accordance with local consumption practices and priorities. (for example, the replacement of the production of the highly nutritive Ragi crop by commercial crops is a development fraught with grave dangers to the nutritional land health safety of the local population)
A large part of food subsidies currently do not go either to producers or consumers of food, but towards subsidizing the inefficiencies of input industry (fertilizer) or managing the centralized procurement and distribution structure of the Food Corporation of India and the Public Distribution System.
The high level of these subsidies should not be substituted by new subsidies for infrastructure, transport, storage, etc. for long distance and over-processed food.
The only alternative is, therefore a decentralized and democratic system of food production and distribution.
When all subsidies for wasteful expenditure are removed, the decentralized and democratic structures of food production and distribution will emerge as the most efficient, just and sustainable means for ensuring food security.
Promotion of Sustainable Agriculture
We believe, that a transition to sustainable agriculture is an imperative for food security, both at the local and the national level.
The diversity which is the basis of sustainable agriculture, and that which is being destroyed by monocultures is the key to food security at the domestic and the community level. The large scale corporate farms being created for export-oriented floriculture, horticulture and aquaculture are aggravating the non-sustainable use of natural resources which has already been the result of green-revolution practices.
Organic farming and low external input agriculture are being recognized everywhere as necessary for environmental protection, health protection and the protection of food security.
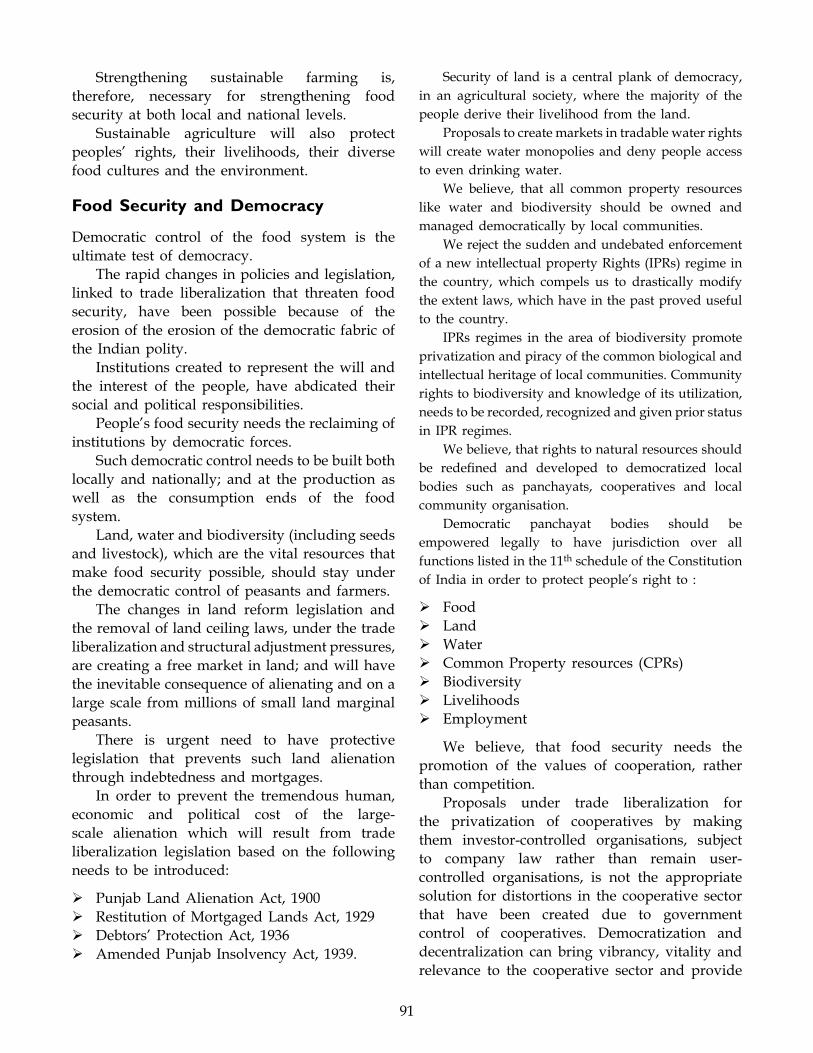
91
Strengthening sustainable farming is, therefore, necessary for strengthening food security at both local and national levels.
Sustainable agriculture will also protect peoples’ rights, their livelihoods, their diverse food cultures and the environment.
Food Security and Democracy
Democratic control of the food system is the ultimate test of democracy.
The rapid changes in policies and legislation, linked to trade liberalization that threaten food security, have been possible because of the erosion of the erosion of the democratic fabric of the Indian polity.
Institutions created to represent the will and the interest of the people, have abdicated their social and political responsibilities.
People’s food security needs the reclaiming of institutions by democratic forces.
Such democratic control needs to be built both locally and nationally; and at the production as well as the consumption ends of the food system.
Land, water and biodiversity (including seeds and livestock), which are the vital resources that make food security possible, should stay under the democratic control of peasants and farmers.
The changes in land reform legislation and the removal of land ceiling laws, under the trade liberalization and structural adjustment pressures, are creating a free market in land; and will have the inevitable consequence of alienating and on a large scale from millions of small land marginal peasants.
There is urgent need to have protective legislation that prevents such land alienation through indebtedness and mortgages.
In order to prevent the tremendous human, economic and political cost of the large-scale alienation which will result from trade liberalization legislation based on the following needs to be introduced:
Punjab Land Alienation Act, 1900 Restitution of Mortgaged Lands Act, 1929 Debtors’ Protection Act, 1936 Amended Punjab Insolvency Act, 1939.
Security of land is a central plank of democracy, in an agricultural society, where the majority of the people derive their livelihood from the land.
Proposals to create markets in tradable water rights will create water monopolies and deny people access to even drinking water.
We believe, that all common property resources like water and biodiversity should be owned and managed democratically by local communities.
We reject the sudden and undebated enforcement of a new intellectual property Rights (IPRs) regime in the country, which compels us to drastically modify the extent laws, which have in the past proved useful to the country.
IPRs regimes in the area of biodiversity promote privatization and piracy of the common biological and intellectual heritage of local communities. Community rights to biodiversity and knowledge of its utilization, needs to be recorded, recognized and given prior status in IPR regimes.
We believe, that rights to natural resources should be redefined and developed to democratized local bodies such as panchayats, cooperatives and local community organisation.
Democratic panchayat bodies should be empowered legally to have jurisdiction over all functions listed in the 11th schedule of the Constitution of India in order to protect people’s right to :
Food Land Water Common Property resources (CPRs) Biodiversity Livelihoods Employment
We believe, that food security needs the promotion of the values of cooperation, rather than competition.
Proposals under trade liberalization for the privatization of cooperatives by making them investor-controlled organisations, subject to company law rather than remain user-controlled organisations, is not the appropriate solution for distortions in the cooperative sector that have been created due to government control of cooperatives. Democratization and decentralization can bring vibrancy, vitality and relevance to the cooperative sector and provide
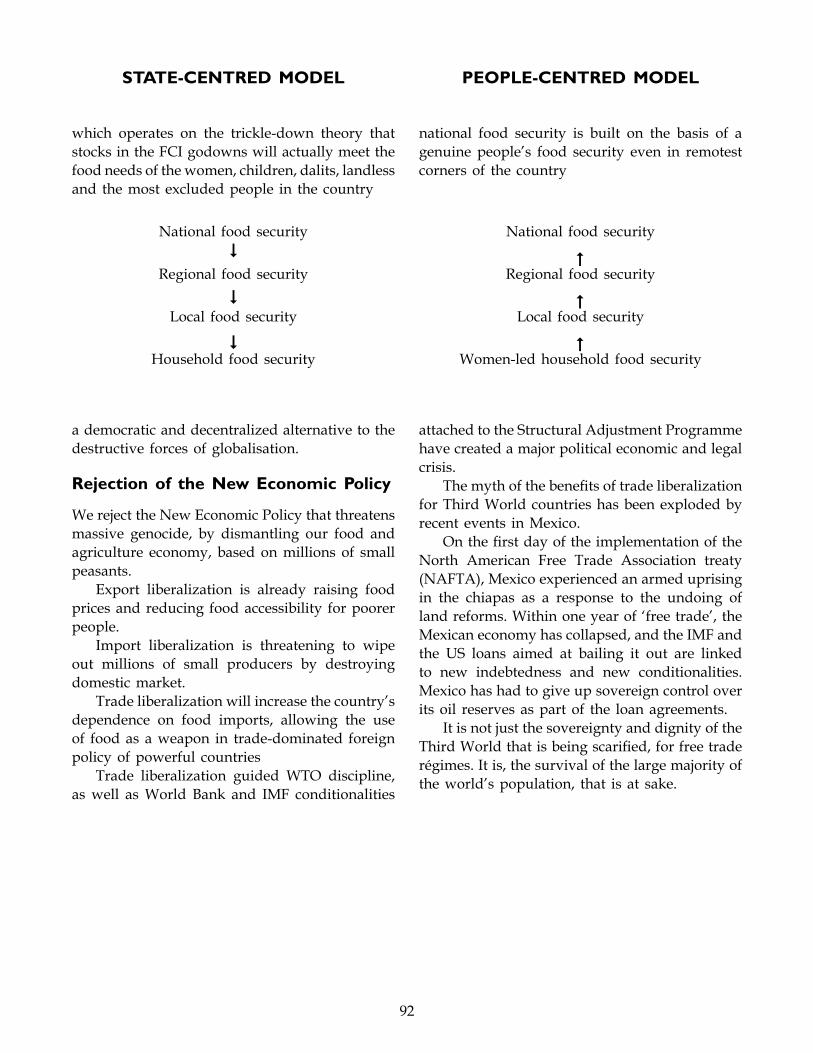
92
a democratic and decentralized alternative to the destructive forces of globalisation.
Rejection of the New Economic Policy
We reject the New Economic Policy that threatens massive genocide, by dismantling our food and agriculture economy, based on millions of small peasants.
Export liberalization is already raising food prices and reducing food accessibility for poorer people.
Import liberalization is threatening to wipe out millions of small producers by destroying domestic market.
Trade liberalization will increase the country’s dependence on food imports, allowing the use of food as a weapon in trade-dominated foreign policy of powerful countries
Trade liberalization guided WTO discipline, as well as World Bank and IMF conditionalities
attached to the Structural Adjustment Programme have created a major political economic and legal crisis.
The myth of the benefits of trade liberalization for Third World countries has been exploded by recent events in Mexico.
On the first day of the implementation of the North American Free Trade Association treaty (NAFTA), Mexico experienced an armed uprising in the chiapas as a response to the undoing of land reforms. Within one year of ‘free trade’, the Mexican economy has collapsed, and the IMF and the US loans aimed at bailing it out are linked to new indebtedness and new conditionalities. Mexico has had to give up sovereign control over its oil reserves as part of the loan agreements.
It is not just the sovereignty and dignity of the Third World that is being scarified, for free trade régimes. It is, the survival of the large majority of the world’s population, that is at sake.
STATE-CENTRED MODEL
which operates on the trickle-down theory that stocks in the FCI godowns will actually meet the food needs of the women, children, dalits, landless and the most excluded people in the country
National food security
Regional food security
Local food security
Household food security
PEOPLE-CENTRED MODEL
national food security is built on the basis of a genuine people’s food security even in remotest corners of the country
National food security
Regional food security
Local food security
Women-led household food security
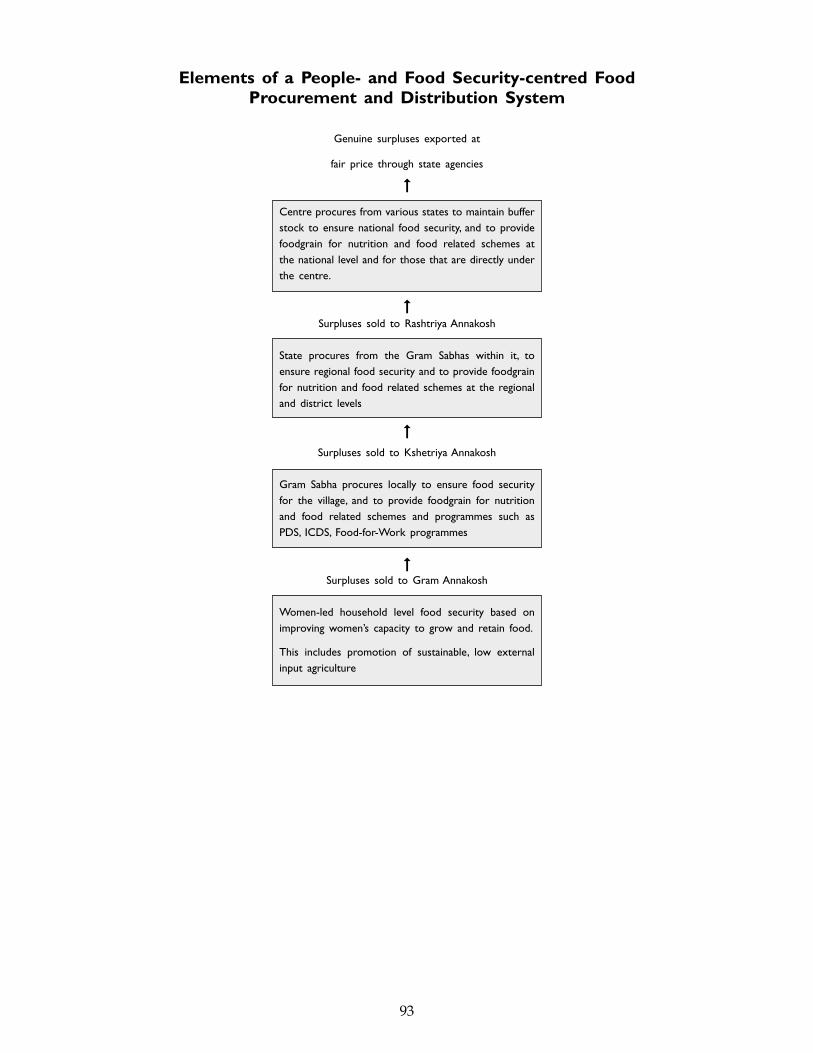
93
Elements of a People- and Food Security-centred Food Procurement and Distribution System
Genuine surpluses exported at
fair price through state agencies
Centre procures from various states to maintain buffer stock to ensure national food security, and to provide foodgrain for nutrition and food related schemes at the national level and for those that are directly under the centre.
Surpluses sold to Rashtriya Annakosh
State procures from the Gram Sabhas within it, to ensure regional food security and to provide foodgrain for nutrition and food related schemes at the regional and district levels
Surpluses sold to Kshetriya Annakosh
Gram Sabha procures locally to ensure food security for the village, and to provide foodgrain for nutrition and food related schemes and programmes such as PDS, ICDS, Food-for-Work programmes
Surpluses sold to Gram Annakosh
Women-led household level food security based on improving women’s capacity to grow and retain food.
This includes promotion of sustainable, low external input agriculture
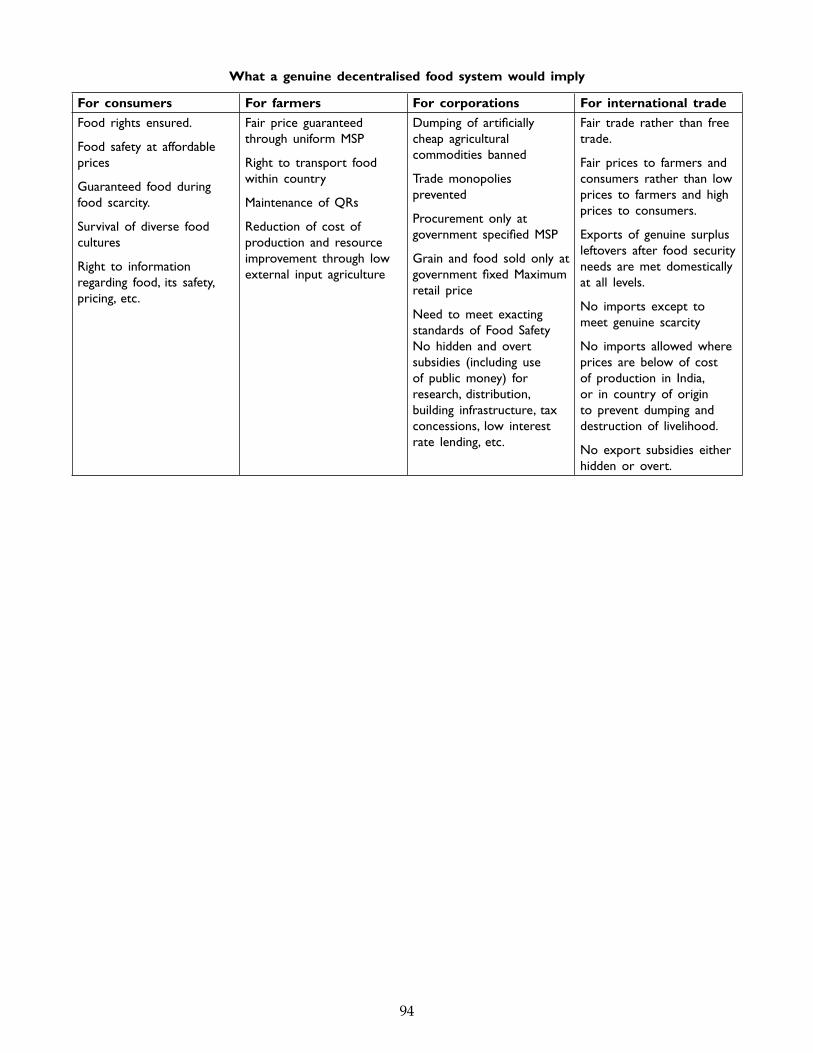
94
What a genuine decentralised food system would imply
For consumers For farmers For corporations For international trade
Food rights ensured.
Food safety at affordable prices
Guaranteed food during food scarcity.
Survival of diverse food cultures
Right to information regarding food, its safety, pricing, etc.
Fair price guaranteed through uniform MSP
Right to transport food within country
Maintenance of QRs
Reduction of cost of production and resource improvement through low external input agriculture
Dumping of artificially cheap agricultural commodities banned
Trade monopolies prevented
Procurement only at government specified MSP
Grain and food sold only at government fixed Maximum retail price
Need to meet exacting standards of Food SafetyNo hidden and overt subsidies (including use of public money) for research, distribution, building infrastructure, tax concessions, low interest rate lending, etc.
Fair trade rather than free trade.
Fair prices to farmers and consumers rather than low prices to farmers and high prices to consumers.
Exports of genuine surplus leftovers after food security needs are met domestically at all levels.
No imports except to meet genuine scarcity
No imports allowed where prices are below of cost of production in India, or in country of origin to prevent dumping and destruction of livelihood.
No export subsidies either hidden or overt.
95
Chapter 1
www.developmenteducation.ie
http://www.fao.org/es/esc/prices/CIWP QueryServlet
Chapter 2
Central Chronicle 2007; “Malnutrition Free MP : Truth is Always Bitter”, 13 September, 2007, Central Chronicle, Bhopal.
Hindustan Times 2006; “State of Nutrition”, 19, December, 2006, Hindustan Times, New Delhi.
Jain, Sonu 2007; “MPs Set Politics Aside to Learn a Gujarat Lesson on Tackling Malnutrition”, 6 October, 2007, Indian Express, New Delhi.
Sinha, Soni 2007; “India Shamed on Global Hunger Index”, 22 October, 2007, Sahara Times, New Delhi.
PTI 2007; “India’s Hungry Out number Pak, China”, 15 October, 2007, The Political and Business Daily, New Delhi.
Shastri, Paromita 2007; “India Ranks 94th in Global List, Trails Behind China; Libya on Top”, 13 October, 2007, Mint, New Delhi.
Mudgal, Vipul 2007; “Child’s Environment : Annual Cost of Malnutrition is 3-4 Percent of GDP”, 22 October, 2007, Hindustan Times, New Delhi.
Verma, Amita 2007; “U.P. Girl Dies Over a Bowl of Rice,” 30th September, 2007, Asian Age, New Delhi.
Nair, KRG 2007; “Malnourishment Among Children in India: A Regional Analysis”, 15th September, 2007, Economic and Political Weekly, Bombay.
Kumar, Praduman, 2007; “Long Term Changes in Indian Food Basket and Nutrition”, 1st September,Murthyunjaya and Madan M Dev 2007, Economic and Political Weekly, 2007, Bombay.
Guruswamy, Mohan and 2006; The Poverty Line is Starvation Lines,” Infochange Agenda”, issue 6, 2006, Ronald Joseph Abraham Pune.
Malekar, Anosh 2006; “The Empty Belly of Bhandup” Infochange Agenda, Issue 6, 2006, Pune.
Andersen, Per Pinstrup, 2007; “Still Hungry” Scientific American India, September, 2007, Vol. 2, Number 9,and Fuzhi Cheng New Delhi.
Jolly, Tikku 2007; “Chandigarh Kids Are Undernourished? 19 November, 2007, Asian Age, New Delhi.
Chapter 3
Mishra, L, 2007; “Some Reflections on 60th Anniversary of our Independence,” 17-23 August, 2007, Vol. XLV, No. 35, Mainstream, New Delhi.
References
96
Bandyopadhyay, D 2007; “On Poverty, Food Inadequacy and Hunger in West Bengal,” 15-21 June, 2007, Vol. XLV, No. 26, Mainstream, New Delhi.
Mander, Harsh 2006; “All You who sleep Hungry to Night”, Infochange Agenda, Issue 6, 2006, Pune.
Patnaik, Utsa 2006; “Increasing Hunger Amongst Relative Plenty”, Infochange Agenda, Issue 6, 2006, Pune
M.S.S.R.F. 2004; “Hunger Atlas 2004”, M.S. Swaminathan Research Foundation, Chennai.
Sarkar, Abhirup 2007; “Grain of Truth”, 25th October, 2007, Telegraph, New Delhi.
Ganpathy, Nirmala 2005; “Food Biggest Expense for Farmers”, 14th October, 2005, Indian Express, New Delhi.
Celestine, Avinash, 2006; “Dwindling Bounty” 14th August 2006, Business World, New Delhi
Jishnu, Latha 2007; “Paying More for Less, Against the Grain, Against the Farmer” 8th October 2007 Business World, New Delhi.
Chapter 4
Goswami, Rahul 2009; “How Distant a square Meal : The Persistence of Hunger in India info Change India, 2009
Zaidi, Annie 2006; “Starving Childhoods, Vol. 23, No 17, August 26 - Sept 8, 2006, Frontline, Chennai
Zaidi, Annie 2007; Hungry and Dying”, October 8, 2007, Frontline, Chennai
Hindu 2007; “Shivraj Vows to Fight Malnourishment”, 30 September, 2007, Hindu, New Delhi.
Balajiwale, Vaishali 2007; “Malnourishment Dogs Nasik”, 21 August, 2007, DNA, Bombay.
Choudhury, Chitrangada 2006; “State Forms Expert Committee to Beat Nutrition”, 19 November, 2006, Hindustan Times, New Delhi.
Bevadam, Lyla 2005; “Dying Young”, 23 September, 2005, Frontline, Chennai.
Bhatia, Arun 2005; “Denial As Policy”, 23 September, 2005, Frontline, Chennai
Singh, Rajesh Kumar 2006; “Children Go Hungry So Cattle Can Eat”, 19 February, 2006, Hindustan Times, New Delhi.
Aikara, Anita 2007; “How Scales Were Tipped Against, Malnutrition”, 30 September, 2007, DNA, and Neeta Kulhatkar Bombay.
Malekar, Anosh 2006; “Why Karmeena Musahar Died”, Infochange Agenda, Issue 6, 2006.
Manecksha, Freny 2007; “Two Chapatis Per Day” 4th November, 2007, Times of India, Bombay.
Chapter 5
Jena, AC 2002; “Public Distribution System : Impact, Status and Future Pogramme”, Kurukshetra, October, 2002, New Delhi.
Patnaik, B.K. 2004; “Public Distribution System in Himachal Pradesh; An Analysis”, Kurukshetra, December, 2004, New Delhi.
Sud, Surender 2004; “Food Availability and Revamped PDS”, Yojana, August, New Delhi.
Outlook 2001; 17 September, Bombay.
97
Arora, B.N. 2004; “Human Rights Day is Celebrated But Right to Food Continues to be Denied” Mainstream, 11 December, 2004, New Delhi.
Shekhar, Chandra 2004; “Food Grain Buffer at Record Low”, Financial Express, 22 October, 2004, New Delhi.
Khetan, Ashish 2005 (a); “This Greed Knows No Limits”, Tehelka, 21 January, 2005.
Khetan, Ashish 2005 (b); “Feeding on Human Beings,” Tehelka, 29 January, 2005, New Delhi.
Sharma, Ashok B, 2005; “Union States Differ Widely on Ration Cards Beneficiaries”, Financial Express, 17 January, 2005, New Delhi.
Damodaran, Harish 2004; “Why Engage Mckinsey for FCI Recast? Comprehensive Study Already Done Say Critics”, Business Line, 6 October, 2004, New Delhi.
Jaganathan, Prabha 2004; “Mckinsey to Script FCI Spending”, Times of India, 26 June, 2004, New Delhi.
Hunger Atlas 2004; “Hunger Atlas”, M.S. Swaminathan Foundation, Chennai.
Panicker, Lalitha 2004; “63% Kids Hungry on World Food Day” Times of India, October, 2004, New Delhi.
Mander, Harsh 2004; “Look Back on Hunger” Hindustan Times, 24 December, 2004, New Delhi.
Alexander, John M 2005; “The Sen Difference, Frontline, 25 February, 2005, Chennai.
Patra, Niharika and “India’s Crumbling Foundation” Business and Economy” 16 June, 2006,Surbhi Agarwal 2006; New Delhi.
Karat, Brinda 2006; “Food At Stake”, Frontline, 30 June, 2006, Chennai.
Jaganathan, Prabha 2006; “Government May Cut PDS Food Grain Entitlement”, Economic Times, 8 May, 2006, New Delhi.
Sharma, Ashok B 2006; “Govt Likely to Slash Poor Man’s Ration”, Financial Express, 23 May, 2006, New Delhi.
Times of India 2006; “Hidden Hunger” Editorial, Times of India, 5 May, 2006, New Delhi.
Ganpathy, Nirmala 2005; “Food Biggest Expense for Farmers”, Indian Express, 14 October, 2005, New Delhi.
Mohapatra, Satyen 2006; “Kalahandi; Food Bowl to Begging Bowl”, Hindustan Times, 28 June, 2006, New Delhi.
Chapter 6
http://wcd.nic.in/icds.htm “Integreated Child Development Services (ICDS) Scheme”
Press Information Bureau, 2008; “Mid-Day Meal Scheme”, Ministry of Human Resource Development Government of India August 12, 2008.
Chauhan, Chetan 2008; “Going Against the Grain” 28 October 2008 Hindustan Times, New Delhi.