why insurers fail - pacicc the role of... · of insolvency, while repeated ... investment), but...
TRANSCRIPT

Property and Casualty InsuranceCompensation Corporation20 Richmond Street EastSuite 210Toronto, Ontario M5C 2R9Phone (416) 364-8677Fax (416) 364-5889www.pacicc.ca
Property and Casualty Insurance Compensation Corporation Société d’indemnisation en matière d’assurances IARD
Why insurers fail
The role of capital in weathering crisis
2015
By
Grant Kelly
Capital
Claims

The role of capitalin weathering crises
ByGrant Kelly
2015
Why insurers fail

PACICC’s mission and principles
Mission StatementThe mission of the Property and Casualty Insurance Compensation Corporation (PACICC) is to protect eligible policyholders from undue financial loss in the event that a member insurer becomes insolvent. We work to minimize the costs of insurer insolvencies and seek to maintain a high level of consumer and business confidence in Canada’s property and casualty (P&C) insurance industry through the financial protection we provide to policyholders.
Principles• In the unlikely event that an insurance company becomes insolvent, policyholders should be
protected from undue financial loss through prompt payment of covered claims.
• Financial preparedness is fundamental to PACICC’s successful management support of insurance company liquidations, requiring both adequate financial capacity and prudently managed compensation funds.
• Good corporate governance, well-informed stakeholders and cost-effective delivery of member services are foundations for success.
• Frequent and open consultations with members, regulators, liquidators and other stakeholders will strengthen PACICC’s performance.
• In-depth P&C insurance industry knowledge – based on applied research and analysis – is essential for effective monitoring of insolvency risk.

Contents
Executive summary. . . . . . . . . . . . . . . . . . . . . . 5
Introduction . . . . . . . . . . . . . . . . . . . . . . . . . . . . 7
Literature review . . . . . . . . . . . . . . . . . . . . . . . . 11
Methodology . . . . . . . . . . . . . . . . . . . . . . . . . . . . 16
Analysis . . . . . . . . . . . . . . . . . . . . . . . . . . . . . . . . 17
Lessons learned . . . . . . . . . . . . . . . . . . . . . . . . . 27
References . . . . . . . . . . . . . . . . . . . . . . . . . . . . . 30

4
AcknowledgementsThe author would like to acknowledge the invaluable research assistance provided by Nassim Ketita (Western University) and Echo Li (Wilfrid Laurier University).
Thank you also to Amra Porobic, Manager, Library Services at Insurance Bureau of Canada for providing access to IBC’s library.

5
Executive Summary
This edition of PACICC’s Why insurers fail research series focuses on 18 insurers that failed and were closed by Canadian insurance regulators since 1980. Through an examination
of financial statements from these firms’ final 10 years of operation, the study seeks to answer two key questions:
1. What happened to the capital bases supporting these insurers?
2. Were there any common patterns in the erosion of their capital bases?
The study presents a number of recommendations for regulators and insurers to guard against future insolvencies.
For insurance solvency regulators:• Solvency regulation should track trends in earnings as an indicator of future capital adequacy,
in addition to continuing to monitor capital adequacy in relation to current company commitments. Profitable insurance companies generate earnings that provide the primary source of capital to strengthen their financial health and support growth. Sustained, healthy earnings reduce the risk of insolvency, while repeated losses increase the risk of failure. Trends in earnings are the primary indicator of changes in future capital adequacy.
• Insurance solvency regulation should focus primarily on long-term financial trends. Conditions that led to the failure of insurance companies in Canada over the last 35 years built up over a period of 10 years or more. Concepts like “a run on the bank” suggest that some financial institutions fail quickly, but this has not been the recent experience of the Canadian P&C insurance industry. Some warnings of financial distress were evident years before each failure. Most companies experienced a shock five or six years before failure, when their claims increased significantly.
• Regulators should closely monitor the response of insurers to a significant shock. Most insurers that failed sought to generate the funds required to offset an unexpected increase in claims through growth in premiums and the sale of assets. Growth supported by inadequate premiums, insufficient loss reserves, and/or participation in new markets typically establishes the foundation for another shock in claims and increases the risk of failure. Alternatively, the risk of insolvency should decline if companies address their underwriting problems by enhancing rate and reserve adequacy and attracting external capital.
For insurance companies:• Companies must focus on strong underwriting results as the most important determinant
of their survivability. All of the insurance companies that failed over the past 35 years experienced several years of underwriting crisis. Indeed, in at least two of their last 10 years of operation, these firms reported a loss ratio that was more than 20 percent above the industry average. Many other performance measures for these troubled companies were similar to the industry average (such as return on investment), but they all experienced price inadequacy, insufficient loss reserves, excessive loss ratios and other underwriting problems from which they ultimately could not recover.

6
• Management must be careful not to overreact in response to an underwriting crisis. Some insurers respond to an unanticipated spike in claims by selling assets and lowering prices in order to increase revenues. Assets sold in a rush may be undervalued. Revenues that result from lowering prices below adequate levels or failure to set aside sufficient loss reserves are actions that set the stage for the next underwriting crisis. Unexpected claims require an infusion of capital and/or increased rates and more aggressive loss reserving practices to ensure that pricing is adequate.
• Companies must address underlying deficiencies in their underwriting practices in order to properly address a crisis. Most insurers that failed over the past 35 years were successful in securing some external funds to support their troubled company – nevertheless, these companies all became insolvent. These injections were not used to address the primary weakness found in all insurance companies that failed – poor underwriting. While it is possible that the new capital was insufficient or that it arrived too late, the long-term issue for all insurance companies that failed was the need to address deficiencies in their underwriting practices.

7
Introduction
Adequate capital is very important for insurance companies, regulators and consumers. Adequate capital fuels growth. Capital is the signal that regulators, industry observers and, most
importantly, consumers seek to confirm whether an insurer can follow through on promises made when it underwrites an insurance policy.
Capital is also the buffer that allows property and casualty (P&C) insurers to weather bad times. P&C insurance protects consumers from almost every legal and physical risk imaginable. Every insurer in Canada experiences periods when claims costs and the costs of running an insurance company exceed their plans.
This is why regulators constantly assess the capital adequacy of an insurance company and have the authority to force an insurer to cease operations if they do not believe the insurer has enough capital to support its business. From a solvency perspective, adequate capital is the ultimate measure of an insurer’s survivability.
This edition of PACICC’s Why insurers fail research series focuses on the operations of 18 insurers that failed and were closed by Canadian regulators since 1980. The study examines financial statements from their final 10 years of operation in order to answer two key questions:
1. What happened to the capital bases supporting these insurers?
2. Were there any common patterns in the erosion of their capital bases?
Where does P&C insurance industry capital come from?PACICC member insurers reported more than $47 billion in capital at the end of 2014. Measured relative to premiums, the Canadian P&C insurance industry has record-high capital. This $47 billion is the amount of money used to underwrite most of the risks in Canada’s $1.8 trillion economy.
Insurers are using their capital base more conservatively than in the past. In 1975, for example, Canadian insurers wrote almost $2 of premiums for each dollar of capital on hand. The long-term trend has seen this ratio decline to approximately $1 of premiums for each dollar of capital held.
All things being equal, this means that the risk of an insurance company failing is lower than it was 20 years ago.
Capital is wealth in the form of money or other assets owned by a person or organization or available or contributed for a particular purpose such as starting a company or investing. www.investopedia.com
Sources of P&C industry capital 2014
Other 4%
RetainedEarnings
58%
Moneyfromowners38%
Source: PACICC based on MSA research
8
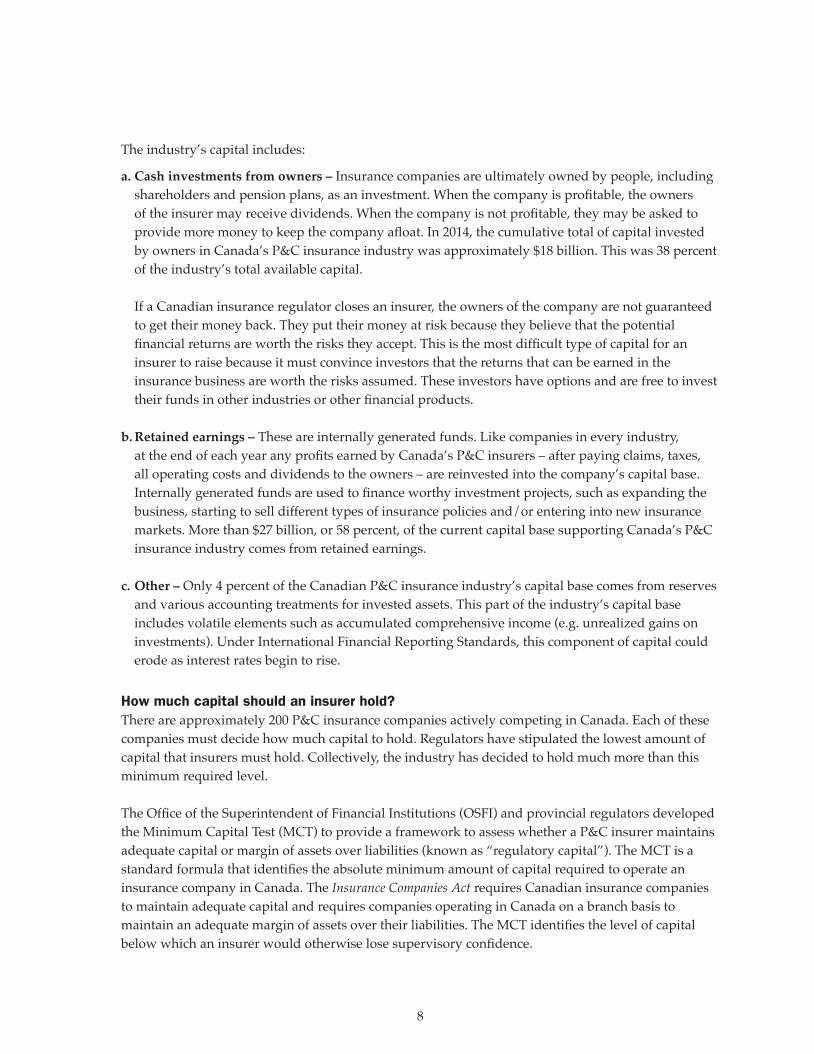
The industry’s capital includes:
a. Cash investments from owners – Insurance companies are ultimately owned by people, including shareholders and pension plans, as an investment. When the company is profitable, the owners of the insurer may receive dividends. When the company is not profitable, they may be asked to provide more money to keep the company afloat. In 2014, the cumulative total of capital invested by owners in Canada’s P&C insurance industry was approximately $18 billion. This was 38 percent of the industry’s total available capital. If a Canadian insurance regulator closes an insurer, the owners of the company are not guaranteed to get their money back. They put their money at risk because they believe that the potential financial returns are worth the risks they accept. This is the most difficult type of capital for an insurer to raise because it must convince investors that the returns that can be earned in the insurance business are worth the risks assumed. These investors have options and are free to invest their funds in other industries or other financial products.
b. Retained earnings – These are internally generated funds. Like companies in every industry, at the end of each year any profits earned by Canada’s P&C insurers – after paying claims, taxes, all operating costs and dividends to the owners – are reinvested into the company’s capital base. Internally generated funds are used to finance worthy investment projects, such as expanding the business, starting to sell different types of insurance policies and/or entering into new insurance markets. More than $27 billion, or 58 percent, of the current capital base supporting Canada’s P&C insurance industry comes from retained earnings.
c. Other – Only 4 percent of the Canadian P&C insurance industry’s capital base comes from reserves and various accounting treatments for invested assets. This part of the industry’s capital base includes volatile elements such as accumulated comprehensive income (e.g. unrealized gains on investments). Under International Financial Reporting Standards, this component of capital could erode as interest rates begin to rise.
How much capital should an insurer hold?There are approximately 200 P&C insurance companies actively competing in Canada. Each of these companies must decide how much capital to hold. Regulators have stipulated the lowest amount of capital that insurers must hold. Collectively, the industry has decided to hold much more than this minimum required level.
The Office of the Superintendent of Financial Institutions (OSFI) and provincial regulators developed the Minimum Capital Test (MCT) to provide a framework to assess whether a P&C insurer maintains adequate capital or margin of assets over liabilities (known as “regulatory capital”). The MCT is a standard formula that identifies the absolute minimum amount of capital required to operate an insurance company in Canada. The Insurance Companies Act requires Canadian insurance companies to maintain adequate capital and requires companies operating in Canada on a branch basis to maintain an adequate margin of assets over their liabilities. The MCT identifies the level of capital below which an insurer would otherwise lose supervisory confidence.

9
The MCT Guidelines establish standards for measuring specific insurer risks and for aggregating these results to calculate how much regulatory capital is needed to support these risks. Capital gives the company time to absorb potential future losses. The greater the amount of capital, the larger the potential losses or risks the company can accept and absorb. For the companies in this study, their ability to absorb losses over their final 10 years of operation was the key determinant of their survivability.
Insurers determine an internal target of capital needed to absorb losses and protect policyholders and creditors in a wind-up. If an insurer’s capital levels fall below its internal target, or if the insurer anticipates that this could happen within two years, the company is required to inform OSFI and provide plans on how it expects to manage the risks and/or restore its available capital levels to meet its internal target.
Canada’s insurance regulatory system does not recognize parent/head office guarantees, promises of potential future injections of capital by owners or other management actions in the determination of the supervisory capital target or the company’s internal target. If an insurer falls below its internal target, Canadian regulators will intervene – which can mean that they lose confidence and could seek a court order to close the company.
Setting the target level of capitalCapital is something that insurers actively manage. Capital management is the continual process of determining and maintaining the quantity and quality of capital appropriate to support an insurer’s planned operations. 1
The target level of capital is not easily defined. There are competing interests that insurers must balance when targeting how much capital to hold. They must hold enough capital to convince insurance regulators that their business is viable and that they have the financial resources to pay claims and remain in business. Prudent capital management must balance a number of competing objectives and expectations, including:
• clients and brokers – maintaining the confidence of clients;
• internal requirements – an appropriate amount of capital allocated to business segments/entities to support strategy/growth and maintain an efficient capital structure to minimize the cost of capital;
• capital – exceeding regulatory capital requirements and managing the risk of regulatory intervention;
• shareholders’ return expectations – optimizing capital allocation and deployment;
• financial analysts – evaluating the group’s financial strength; and
• credit rating agencies – maintaining high rating levels and raising additional capital (when needed and at favourable rates) for credibility, security for policyholders/clients and low refinancing costs.
1 http://www.osfi-bsif.gc.ca/Eng/fi-if/rg-ro/gdn-ort/gl-ld/Pages/a4_gd.aspx

10
Regulators also require that each insurer undertake an “Own Risk Solvency Assessment” (ORSA). ORSA is a tool that requires an insurer to document the interrelationships between its risk profile and capital needs. When undertaking an ORSA evaluation, insurers must consider all reasonably foreseeable and relevant risks, be forward-looking and observe the company’s business and strategic plans. Insurance companies are risk-taking enterprises. They balance the risks they accept with the potential rewards available in the insurance industry. Investors everywhere want to be sure that what they earn is worth the risk of investing. Why would an investor accept returns which are less than they could earn by investing in industries other than insurance? Insurers must try to earn enough profit so that investors do not sell off their investments and move on to other industries.
There is no simple answer to how much capital is enough capital. Capital is managed to maintain financial strength, withstand adverse economic conditions, allow for growth opportunities and meet other risk management and business objectives. It must be actively managed – especially in extreme cases such as an imminent failure or insolvency – so that an insurer has sufficient assets to transfer or run-off policyholder obligations and pay creditor claims.

11
Literature review
There is an extensive body of literature aimed at understanding how much capital an insurance company should hold.
The most often-quoted paper on capital management was written by Modigliani and Miller. In the 1950s, these two professors studied capital-structure theory intensely and hypothesized that in perfect markets, it does not matter what capital structure a company uses to finance its operations. They theorized that the market value of a firm is determined by its earning power and by the risk of its underlying assets; and that its value is independent of the way it chooses to finance its investments or distribute dividends.
Insurance and capitalCummins and Summer (1996) investigated the capital and portfolio risk decisions of property-liability insurance firms. In their theoretical model, insurers balance capital and risk to achieve their desired overall insolvency risk. They also provide evidence that managerial incentives play a role in determining capital and risk in insurance markets. The findings have significant implications for insurance solvency regulation.
Bankruptcy costs can significantly affect a company’s cost of capital. When a company invests in debt, the company is required to service that debt by making required interest payments. Interest payments alter a company’s earnings as well as cash flow. For every company, there is an optimal capital structure, including a percentage of debt and equity and a balance between the tax benefits of the debt and the equity. As a company continues to increase its debt over the amount stated by the optimal capital structure, the cost to finance the debt becomes higher as the debt is now riskier to the lender. Optimal capital structure varies by industry, mainly because some industries are more asset-intensive than others. In very general terms, the greater the investment in fixed assets (plant, property and equipment), the greater the average use of debt. This is because banks prefer to make loans against fixed assets rather than intangibles. Industries that require a great deal of plant investment, such as telecommunications, generally use more long-term debt. In Canada, Section 476 of the Insurance Companies Act limits the borrowing ability of a P&C insurance company or a marine company to two per cent of the company’s total assets.2 This is the reason that insurers do not issue bonds to finance their businesses.
Much has been written about how and why organizations fail, especially in the wake of the most recent financial crisis. Caprio and Klingebiel (1996) note that banks differ from other firms due to the inter-temporal nature of their contracts, i.e. they borrow short and lend long. Because of this, it can take time for the insolvent nature of a bank to be discovered. Banks are also an integral part of the payment system, so insolvency in this industry can have contagion effects and lead to a systemic crisis as seen in the European and North American banking crisis in 2008. Caprio and Klingebiel (1996) identify several reasons for a bank to fail, such as macroeconomic factors, speculative bubbles
2 http://laws-lois.justice.gc.ca/eng/regulations/SOR-92-281/page-1.html

12
brought on by excessive credit growth, asset-liability mismatches and fraud. In their survey of 29 bank insolvencies in the 1980s and 1990s, they found that poor management or regulation was the most common cause. Cummins and Phillips (2009) outline the failure process as a set of preconditions, such as poor management reaching a “critical mass,” at which point a “triggering event” causes the firm to fail. Deficient loss reserves and inadequate pricing were found to be the most common triggering events for P&C insurers, as also seen in Leadbetter and Dibra (2008).
The path a healthy firm takes on its way to failure often falls within a small number of distinct archetypes. Miller (1977) called these failure “syndromes” and discussed four common ways in which a business can fail. The first case is that of an overly ambitious chief executive that grows the company too quickly for its infrastructure to support. The second describes an unchanging bureaucracy that fails to adapt to new developments in its industry. The third suffers from a lack of strong central leadership and internal co-ordination failures. Lastly, the fourth type is a situation in which a distressed company brings in a new chief executive who takes excessive risks and pushes the firm closer to bankruptcy. All of these syndromes are characterized by some form of extreme: too much (little) product innovation, too many (few) controls, and/or an overly powerful (powerless) chief executive.
Hambrick and D’Aveni (1988) extend these ideas and identify four major vectors for failure: domain initiative, environmental carrying capacity, slack and performance. As with Miller (1977), extremes on either end of the spectrum are considered. Using a matched pair study, Hambrick and D’Aveni (1988) find that companies can show signs of weakness for up to 10 years prior to their failure, going on a four-stage “downward spiral.” O’Connor (1994) confirms the 10-year lead period prior to bankruptcies and the fact that companies that grow too quickly are more likely to fail. D’Aveni (1989) examines declining firms in more detail – in particular the timing of their failures – and proposes three patterns of decline: sudden decline, in which a company goes through a rapid decline and bankruptcy; gradual decline, in which a company slowly withers away before declaring bankruptcy; and lingering, in which a company manages to survive in a weakened state for several years before eventually declaring bankruptcy.
D’Aveni (1989) goes on to investigate the factors that allow firms to linger, showing that they can survive a while longer in industries with high-demand growth. Once the favourable environmental conditions cease, lingering firms often fail soon after. Balcaen, Manigart and Ooghe (2011) found that slack resources prolong the decline process. Older firms or firms with a large amount of investments also take longer to go bankrupt. du Jardin and Séverin (2010) take a statistical approach to studying this issue using a self-organizing map or Kohonen (1982) map. Their analysis showed that bankrupt firms followed four common trajectories, supporting prior research. D’Aveni’s (1989) sudden decliners, gradual decliners, and lingerers were found along with an additional type: companies that have a brief period of improvement following initial distress, only to get worse in subsequent years. du Jardin and Séverin (2010) also found that failed firms behave more erratically relative to successful firms, again in the vein of previous studies.

13
Distressed firms invariably attempt some sort of turnaround strategy. Sudarsanam and Lai (2001) found that firms that went on to fail tended to restructure their operations more intensively relative to firms that recovered from distress. Failed firms further intensified their turnaround strategies following ineffective restructuring in the early years of distress. Sudarsanam and Lai (2001) also found that successful companies tended to use investment and acquisition strategies whereas failed firms tended to opt for operational and financial restructuring.
Lasfer and Remer (2010) note that both failed and successful firms initially adopt the same strategies; however, failed firms are slower in their execution. “Recovered companies are more efficient and tighter in their monetary policies while the non-recovered companies burn cash more easily.”3
Why insurers failThere is another body of literature that seeks to explain the causes of insurer insolvency.
A.M. Best maintains a database of more than 1,000 insurance companies that have failed in the United States since 1969. The most common reasons for insolvency were deficient loss reserves/inadequate pricing or rapid growth. These factors accounted for the majority of financial impairments. Natural disasters were the seventh most common reason for an insurer in the United States to fail, accounting for 7 percent of insolvencies.
The Financial Services Authority (FSA) in the United Kingdom assessed 270 insurance companies that failed in the European Union since 1969. Many factors were identified as primary or contributing factors resulting in insurance insolvency, with natural hazards found to have made a very small contribution.
The European research emphasizes that failures in the insurance industry are typically complex problems linking together inadequacies in addressing many risks. One event, like a natural disaster, may be seen as the ultimate cause of insolvency, but Sharma (2002) and others found that there are frequently many contributing factors.
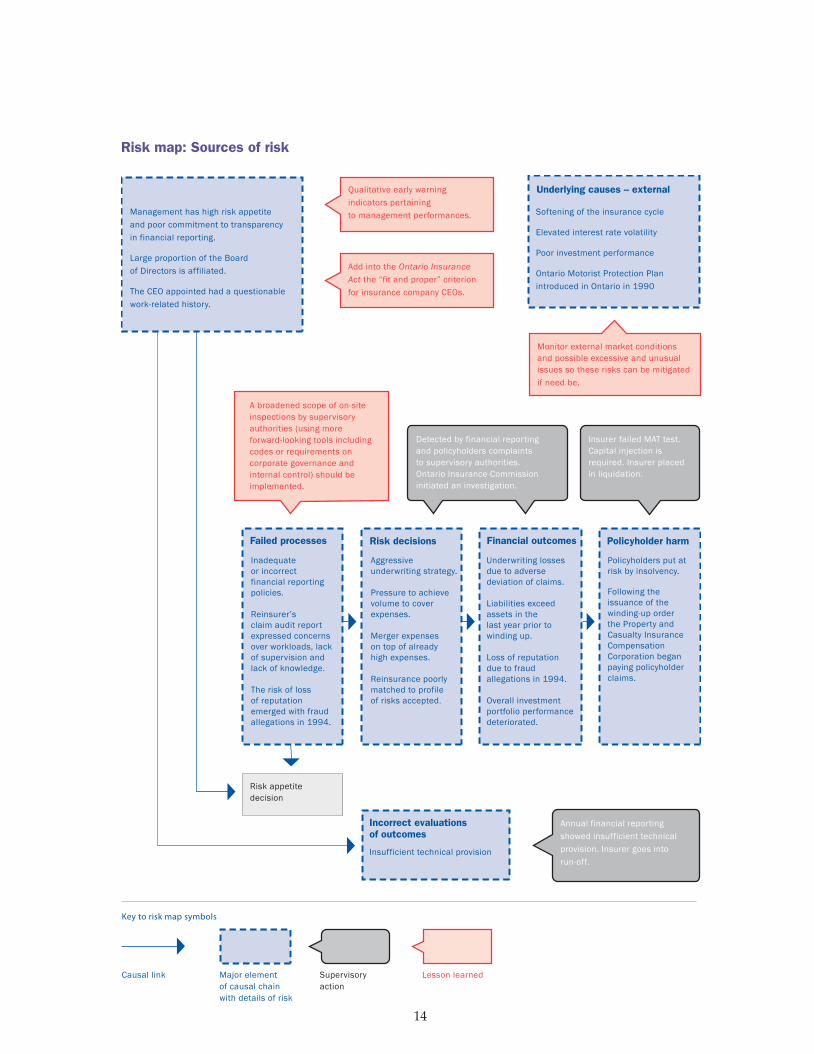
McDonnell (2002) and the EU (2002) developed a risk map that illustrates the sources of risk (failed processes, risk decisions, external factors and management) and the links between them. The process of mapping and analyzing the data allowed a broader understanding of why a particular institution was wound-up.
Leadbetter (2009) studied the impact of inadequate pricing on insolvency. Claims, the largest cost for insurers, are unknown when the risk is accepted. Pricing is determined and agreed upon before costs are known. Actuarial analysis is used to anticipate the expected frequency and severity of future claims, but actual costs are not known when prices are set. Some have described this as an inverted production cycle, noting that insurance is quite different from the other financial industries and most businesses where input costs are largely known when prices are set. Setting adequate prices is a challenge for inexperienced insurers, including new companies and established companies that enter into new markets.
3 Lasfer, Meziane, and Laxmi S. Remer, Corporate Financial Distress and Recovery: The UK Evidence, (November 7, 2010).
14
Underlying causes – external
Failed processes
Incorrect evaluations of outcomes
Risk decisions Financial outcomes Policyholder harm
Management has high risk appetiteand poor commitment to transparencyin financial reporting.
Large proportion of the Boardof Directors is affiliated.
The CEO appointed had a questionablework-related history.
Qualitative early warning indicators pertaining to management performances.
Add into the Ontario Insurance Act the “fit and proper” criterion for insurance company CEOs.
Monitor external market conditions and possible excessive and unusual issues so these risks can be mitigated if need be.
A broadened scope of on-site inspections by supervisory authorities (using more forward-looking tools including codes or requirements on corporate governance and internal control) should be implemented.
Detected by financial reporting and policyholders complaints to supervisory authorities. Ontario Insurance Commission initiated an investigation.
Insurer failed MAT test. Capital injection is required. Insurer placed in liquidation.
Annual financial reporting showed insufficient technical provision. Insurer goes into run-off.
Softening of the insurance cycle
Elevated interest rate volatility
Poor investment performance
Ontario Motorist Protection Plan introduced in Ontario in 1990
Inadequate or incorrectfinancial reportingpolicies.
Reinsurer’sclaim audit reportexpressed concernsover workloads, lackof supervision andlack of knowledge.
The risk of lossof reputationemerged with fraudallegations in 1994.
Aggressiveunderwriting strategy.
Pressure to achievevolume to coverexpenses.
Merger expenseson top of alreadyhigh expenses.
Reinsurance poorlymatched to profileof risks accepted.
Underwriting lossesdue to adversedeviation of claims.
Liabilities exceedassets in thelast year prior towinding up.
Loss of reputationdue to fraudallegations in 1994.
Overall investmentportfolio performancedeteriorated.
Policyholders put atrisk by insolvency.
Following theissuance of thewinding-up orderthe Property andCasualty InsuranceCompensationCorporation beganpaying policyholderclaims.
Insufficient technical provision
Major elementof causal chainwith details of risk
Causal link
Key to risk map symbols
Lesson learnedSupervisoryaction
Risk appetite decision
Risk map: Sources of risk
15
Leadbetter (2011) examined what factors allowed new entrants in the P&C insurance industry to thrive or fail in their first 10 years of operation. North American data shows that almost one-quarter of new insurance companies fail within their first five years of operation and 70 percent fail within 10 years.
Harries (2010, 2012 and 2014) provide excellent case studies on the business and regulatory factors that drove insurance companies to fail. These studies inject a striking dose of reality into the theoretical literature.
In summary, therefore, the literature on insurer insolvency can be summarized as:
• no single financial indicator, or set of indicators, has been identified as a robust measure for predicting financial distress;
• firm size is a factor in financial distress;
• managerial experience and governance are important factors in firm survival; and
• price controls increase the volatility of insurance premiums and may temporarily compress prices relative to loss experience.

16
Methodology
Since 1979, 32 insurers have been involuntarily wound-up by Canada’s solvency regulators. Roughly one-third (11 companies) were financially sound but were closed because their foreign
parent became insolvent. The remainder (21 companies) became insolvent. Two-thirds of the insolvent Canadian insurers over the past 35 years failed due to inadequate pricing, deficient loss reserves or rapid growth (14 of the 21 companies). This study focuses on insurers with up to 10 years of available financial data.
This paper examines the final 10 years of financial statements for 18 insurers that were closed by regulators. It compares the financial ratios of each failed insurer to its peers. Canada’s insurance industry began voluntarily disclosing financial data in 1979. Prior to this time, only summary statistics were available. These summary statistics do not include any information on capital.
The following insurers were included in the analysis:
Company Data availableYear
of failure
Advocate General Insurance Company 1980 to 1988 1989
American Mutual Liability Insurance 1979 to 1988 1989
Canadian Millers Mutual Insurance Company 1985 to 2000 2001
The Century Insurance Company of Canada 1979 to 1988 1989
Eaton Bay Insurance Company 1979 to 1988 1989
English & American Insurance Company 1979 to 1991 1993
Hiland Insurance Company 1979 to 1991 1994
Maplex General Insurance 1987 to 1994 1995
Midland Insurance Company 1979 to 1985 1986
Home Insurance Company 1979 to 2001 2003
Kansa General International Insurance Co. Ltd. 1979 to 1991 1995
Lumbermens Mutual Casualty Company 1979 to 2001 2003
National Employers Mutual General Insurance 1979 to 1989 1990
Northumberland Insurance Company 1979 to 1984 1985
Orion Insurance Company PLC 1979 to 1992 1995
Phoenix Assurance Company of Canada 1979 to 1988 1989
Reliance Insurance Company 1979 to 2000 2001
United General Insurance Company 1979 to 1984 1986
The performance of each company is compared to the industry for the years in which they operated. For instance, Lumbermens Mutual Casualty Company’s performance in 1979 is compared to the industry results from 1979. Reliance Insurance Company’s performance in 1999 is compared to the industry’s performance in 1999.

17
Analysis
Capitalization: 10 years prior to failureThe first observation on the 18 insurers in the sample is that most were small companies. Fifteen of the 18 insurers were supported by less than $10 million in total capital. There is a large body of economic literature suggesting there are no economies of scale in the P&C insurance industry. These studies typically find that small insurers that survive demonstrate an ability to find a profitable market niche that they understand. Small insurers can underwrite profitably and thrive. In 2014, there were more than 25 P&C insurers in Canada holding less than $10 million in capital.
However, a small capital base means that an insurer has less room to make a mistake. Most of the insurers in this sample, 10 years prior to failure, were thinly capitalized. They did not have a lot of room to make underwriting mistakes. Each policy issued by a P&C insurer is a conditional promise that it will pay cash if the policy’s defined trigger event occurs. Examples of a trigger event include car crashes, thefts, fires, fraud, storms and so forth. Insurance companies use a process called underwriting to decide which risks to accept. This allows them to leverage their capital to accept the risks inherent in a modern economy. An insurance company with a small capital base cannot survive if too many claims liabilities are triggered at once.
Company
Capitalization 10 years prior to failure
($, millions)
Net premiums earned
($, millions)
Advocate General Insurance Company 3.975 0.274
American Mutual Liability Insurance 1.173 0.655
Canadian Millers Mutual Insurance Company 2.153 0.565
The Century Insurance Company of Canada 8.007 6.444
Eaton Bay Insurance Company 2.113 9.936
English & American Insurance Company 3.525 0.367
Hiland Insurance Company 2.285 0.442
Maplex General Insurance 1.506 4.080
Midland Insurance Company 1.130 0.069
Home Insurance Company 16.755 33.457
Kansa General International Insurance Co. Ltd. 4.187 9.260
Lumbermens Mutual Casualty Company 45.857 28.671
National Employers Mutual General Insurance 2.387 0.611
Northumberland Insurance Company 1.026 1.047
Orion Insurance Company PLC 9.683 0.715
Phoenix Assurance Company of Canada 48.146 40.821
Reliance Insurance Company 7.637 15.396
United General Insurance Company 1.891 9.911
Average 9.399 9.345

18
Another way to measure the capital base of these insurers is to judge it relative to the insurance premiums written by the insurer. A high premiums-to-capital ratio indicates that the insurer is highly leveraged and is offering coverage many times its capital base. A lower ratio indicates that the insurer is relatively safer. This is one of the early warning tests commonly used by insurance regulators to assess the financial health of an insurance company. A company passes this test if the amount of premiums written is less than 300% of its reported capital base.
In the 10 years before the insurers in our sample became insolvent, 15 of the 18 reported premiums-to-capital ratios significantly below the industry average. The average reported premiums-to-capital ratio was approximately 85.5%. This was half the score reported by the industry comparison group. Only one insurer – Eaton Bay Insurance Company – would have failed this test.
The premiums-to-capital test measures leverage. On average, these companies were not overextended relative to their peers. Just 10 years prior to their insolvency, and excluding Eaton Bay Insurance Company, there was no evidence that these companies were overextended and doomed to failure.
Return on InvestmentInsurance companies invest insurance premiums to earn interest and other income until claims are paid. Over the study period (past 35 years), the Canadian P&C insurance industry had an underwriting loss. Investment income was used to generate positive income.
Historically, the Canadian P&C insurance industry has allocated approximately 75 percent of its investment portfolio to bonds. As an industry, insurers have never reported a loss on their investment income in any quarter since 1975. The insurers included in this study reported similar investment allocations. The vast majority of their investment portfolio was allocated to bonds.
The insolvent insurers reported a return on invested assets (ROI) higher than the industry average in six of the 10 years prior to being closed by regulators. In fact, Phoenix Assurance Company’s investment returns beat the industry average for all 10 years in our sample. Midland Insurance Company reported a ROI greater than the industry average in eight of the 10 years before the company was closed by regulators. Two other companies reported above-average investment results in seven of the 10 years in our sample. Data required to assess the riskiness of specific stocks and bonds in
Premiums written per $ of capital
$0.00
$1.50
$1.00
$0.50
$2.00
Industry Failed insurers
Return on investments5%
4%
3%
2%
1%
0%
–1%
–2%10
Years before insolvency
9 8 7 6 5 4 3 2 1

19
which the company invested is not available. On the other end of this spectrum, American Mutual Liability Insurance was the only insurer that reported consistently below-average returns on its investment portfolio.
For purposes of this study, the returns earned on the insolvent insurers’ investment portfolios were generally in line with the average results for the Canadian P&C insurance industry. More importantly, every company in our sample consistently reported earning positive investment income. This means that their investment portfolios were, all other things being equal, contributing strength to their capital base.
Poor underwriting performance created cash flow crises As noted by Dibra and Leadbetter (2007), the leading cause of involuntary exit in Canada’s P&C insurance industry is inadequate pricing and deficient loss reserves – accounting for 31% of the impairments. This is consistent with international experience.
The adequate pricing of risk and reserving for future claims is the core function of an insurance company. In an analytical framework, this means that the premiums collected should match expected losses. An insurer sets prices using data that is one period old.4 The following function describes the pricing of insurance:
Pt = E (L t–1) +E (πu t)
where E (L t–1) is the expected loss (claims) experience and πu t is the expected underwriting result (profit/loss). In a competitive market, without a systemic error which introduces mispricing throughout the system, we would expect this function to hold.5 Insurance premiums earned in period t are set aside as reserves to pay claims from period t (which may be fully realized in later periods such as t+1). In subsequent periods as claims are realized, if insufficient reserves were set aside, an insurer must deplete its capital base to increase reserves.
A company with insufficient capital must use current revenues to support current claims and a portion of past claims. Persistent and consistent underpricing and inadequate reserving ultimately leads to insolvency. It is therefore to be expected that the common thread among all 18 insurers in the sample was that they were below-average underwriters. The loss ratio compares the amount of claims paid by the insurer per dollar of premiums collected. The lower the loss ratio, the more profitable the insurance company. Ten of the 18 insurers reported loss ratios higher than the industry average in five of the 10 years prior to insolvency.
It is important to note that these figures represent reported underwriting performance. Once an insurer is closed by regulators, the court-appointed liquidator often finds that the booked claims reserves were inadequate to cover the actual cost of claims. It is thus likely that the reported results overstated the underwriting profitability and/or understated underwriting losses (since most were not very profitable).
4 When there is some uncertainty in the losses (for example losses in period t-1 are not an accurate predictor of losses today, uncertainty in the data), a stochastic error term is included in the simple model.
5 Cummins (2002) outlines a simple model for insurance pricing that demonstrates this. Note that the result does not hold when there is systemic error. Mispricing could occur where there is incorrect or lagged information on loss costs. Some accounting conventions, rate regulation or inappropriate estimation techniques could introduce systemic mispricing.

20
Loss ratios compared to industryNumber of below-average underwriting years
0 1
Years before insolvency2 3 4 5 6 7 8 9 10
United General Insurance Company
Reliance Insurance Company
Phoenix Assurance Company of Canada
Orion Insurance Company PLC
Northumberland
National Employers Mutual General Insurance
Lumbermans Mutual Casualty Company
Kansa General International Insurance Co. Ltd.
Home Insurance Company
Midland Insurance Company
Maplex General Insurance
Hiland Insurance Company
English and American Insurance Company
Eaton Bay Insurance Company
The Century Insurance Company of Canada
Canadian Millers Mutual Insurance Company
American Mutual Liabliity Insurance
Advocate General Insurance Company
Persistently poor underwritingNumber of consecutive below-average underwriting years
0 1
Years before insolvency2 3 4 5 6 7 8 9
United General Insurance Company
Reliance Insurance Company
Phoenix Assurance Company of Canada
Orion Insurance Company PLC
Northumberland
National Employers Mutual General Insurance
Lumbermans Mutual Casualty Company
Kansa General International Insurance Co. Ltd.
Home Insurance Company
Midland Insurance Company
Maplex General Insurance
Hiland Insurance Company
English and American Insurance Company
Eaton Bay Insurance Company
The Century Insurance Company of Canada
Canadian Millers Mutual Insurance Company
American Mutual Liabliity Insurance
Advocate General Insurance Company

21
Any insurance company can experience a poor financial year. There are a number of reasons why an insurer may experience poor underwriting results. For example:
• Geographic and/or product concentration of risks;
• Underpricing;
• Expanding into new lines of business; and/or
• Bad luck in selecting risks.
However, the insurers in our sample reported persistently poor underwriting results. Bad luck is one factor that can be ruled out.
Leadbetter (2009) examined the pricing strategies for 30 Canadian insurers that were closed by regulators. The study identified three potential sources of systemic and catastrophic mispricing of insurance policies that could result in the ultimate failure of the company:
• Deficiencies in data available to underwriters;
• Managerial experience; and
• Rate regulation.
These factors led Canadian insurers, including all 18 in this study, to understate the costs associated with their insurance products. The problem was not just that the reported underwriting results were slightly below average. When these insurers missed the industry average, they did so significantly. In fact, roughly half of the insurers in our sample reported a loss ratio 20 percentage points higher than the industry average in the 10 years prior to insolvency. On average, these companies reported two years where their loss ratio was at least 20 percentage points higher than the industry average. This placed the insurance company in a cash-flow crisis, forcing it to assume additional risks in order to pay claims.
Poor underwriting years also increased operating expensesAn examination of the reported operating costs of the insurers in our sample finds that the claims crisis also impacted their ability to manage operating costs.
Twelve of the 18 insurers in our sample reported at least one year when their expense ratio was more than 10 percentage points above the industry average. The expense ratio compares operating costs to premiums. Often this period of increased operating costs occurred in the same year, or the year following, the loss ratio exceeding the industry ratio by 20 points. This likely reflected the need to find additional resources to respond to the crisis. While it is directly related to the underwriting crisis, it must be noted that the spike in the expense
Expenses 10% higher than industry average6
5
4
3
2
1
0
Years before insolvency
10 9 8 7 6 5 4 3 2 1

22
ratio exacerbated the crisis and required the insurer to find additional financial resources to deal with the crisis. They had to sell more invested assets – thus further eroding their capital base. For these firms, capital stopped growing four years prior to the insolvency – and began to decline rapidly in the last three years of operation. In the final year, capital deteriorated very rapidly.
Reaction to the claims crisisThe 18 companies in the sample are not the only insurers to have experienced an underwriting crisis (where their combined ratio exceeded the industry average by more
than 20 percentage points). In each year since 2004, 15 PACICC members on average have reported an underwriting crisis. However, none of them have lost the confidence of regulators and been closed.
The test of management for an insurance company comes in response to an underwriting crisis. There are several important differences in the way that the 18 companies in our sample managed the crisis that ultimately led to them becoming insolvent.
There is a definite pattern in the way that these 18 insurers responded to their claims crisis. It appears that they each had a three-part strategy to survival:
1. Increasing cash flow from the insurance operations, by temporarily lowering prices or relaxing underwriting standards;
2. Selling invested assets; and3. Seeking additional capital from owners or new investors.
1. Increasing cash flow from operationsTo manage the claims crisis, these insurers needed cash to pay the increase in claims. The majority of insurance is funded by up-front payment of premiums. This provides insurers with strong operating cash flows. On average, the insurers in our sample were reporting growth in net premiums earned of 7.8 percent in the year before the crisis. In the first year following the crisis, the rate of reported net premium growth more than tripled to 28.6 percent. This shows that these companies attempted to use cash-flow underwriting to escape the crisis. Cash-flow underwriting is a strategy used by insurance companies to generate substantial investment capital from the increased business that will come from lower prices.
Underwriting experience involves challenges in risk selection. An insurer can underprice the product, in some cases to maintain or gain market share in a period of rising claims costs. Typically, this was accompanied by weak or relaxed risk selection which in some cases led to the selection of risks either outside the company’s prior experience or higher than planned. These companies responded to an underwriting crisis by further leveraging their capital, accepting greater and larger risks.
Return on equityAverage return on equity
10%
5%
0%
–5%
–10%10
Years before insolvency
9 8 7 6 5 4 3 2 1

23
This strategy was supported by insufficient capital with management expecting to ride out the rough time in the belief that the insurance cycle would turn around. When the situation became critical (that is, it became difficult to pay claims), the insurers started to grow even more rapidly, selling policies in order to generate revenue to pay current claims. The problem with this strategy is that such explosive growth requires the insurer to relax their underwriting standards and accept risks that it would normally avoid.
Troubled companies frequently assume additional risks when struggling to survive. Distressed insurers sometimes enter into new markets where the risks are unfamiliar, and/or they temporarily offer aggressive pricing to attract new customers and additional revenue.
While there may be examples where “gambling the company” proved successful, more often than not these approaches cause the situation to deteriorate rapidly.
This strategy appears to have been a temporary measure because in the second year following the underwriting crisis, the insurers in our sample reported a dramatic reduction in their insurance writings as net premiums written declined by 14 percent. It is very difficult to manage a successful company with this type of rapid expansion, followed by contraction. This strategy is also the likely cause for these companies experiencing multiple underwriting crises in their final 10 years of operation.
2. Poor underwriting results forced sales of invested assets Insurers set aside premiums collected in period t as reserves to pay claims from period t (which may be fully realized in later periods such as t+1). These reserves are mainly invested in bonds, as described above. In subsequent periods as claims are realized, if the reserves are insufficient, an
insurer must find the cash. Normally this involves selling its invested assets.
All of the insurers in our sample reported a year where they were forced to sell invested assets to manage an underwriting crisis. This depleted the capital base of the insurer. Five years prior to their insolvency, nine of the 18 insurers in our sample reported a decline in invested assets. Four years prior to their insolvency, 10 insurers reported a decline in invested assets. While insolvency did not follow instantly, this period of crisis was the beginning of the end for these companies.
Big swings in premium growth
–15%
0%
15%
30%
Before crisis 1st year afterUW crisis
2nd year afterUW crisis
Number of insurers experiencing a decline in invested assets12
10
8
6
4
2
0
Years before insolvency10 9 8 7 6 5 4 3 12

24
3. Seeking additional capitalTo be profitable, companies in every industry seek to raise additional capital. This is an area of great interest to academic researchers. Myers and Majluf (1985) discussed the structure of corporate finance which states that firms prefer to raise additional capital in the following order:
a. Internally generated funds;b. Increase debt levels by borrowing; andc. Sell additional shares or request additional capital from owners.
a. Internally generated fundsReturn on equity (ROE) is a company’s net income divided by average total equity. ROE provides a measure of the overall profitability of the company, incorporating results from both underwriting and investment performance. Over the past 25 years, the Canadian P&C insurance industry has recorded an ROE of approximately 10% each year. A large decrease in ROE suggests a lack of stability in the company or other developments that deserve further examination.
Not surprisingly, and taken as a whole, the companies in our sample reported below-average ROE in their final 10 years of operation. While each company reported two or more years of profitability over the 10-year period, these profitable years were more than offset by two or more consecutive years with a negative ROE. A negative ROE measures the speed of decline in a company’s capital base.
b. Increase debt levels by borrowingIf internal funds are insufficient to finance the company’s needs, the firm will attempt to issue the safest securities first and the most risky securities last. As referenced above, Canadian P&C insurers are not permitted to borrow more than two percent of their assets. This forces insurers that need more capital to consider mergers, selling the company or requesting a cash injection from investors or from the parent company.
c. Sell additional shares or request additional capital from ownersTwelve of 18 insurers in our sample were able convince investors or their parent companies to provide additional capital in an attempt to save them from insolvency. These include:
• Advocate General Insurance Company – Owners invested an additional $3.5 million in 1985. • American Mutual Liability Insurance – Owners invested an additional $627,000 in 1984.• Eaton Bay Insurance Company – Owners invested an additional $5.75 million. • Maplex General Insurance – Merged with Abstainers’ Insurance Company in 1989.• Midland Insurance Company – Head Office Account and General & Contingency Reserves
doubled in 1984 and again in 1985.• Kansa General International Insurance Co. Ltd. – Head Office Account increased
by 2,415% in 1985.• Northumberland Insurance Company – Income from subsidiaries doubled.• Orion Insurance Company PLC – Head Office Account increased by 1,119% in 1980.• Phoenix Assurance Company of Canada – Head Office Account increased by 41% in three years. • Reliance Insurance Company – Head Office Account doubled in 1984.

25
None of these investments proved to be profitable for the owners of these companies. The common thread in these investments is that the insurers continued to underwrite poorly after receiving these cash injections. The money was not used to improve risk selection or to improve the insurer’s ability to set prices.
Net impact on capitalFour of the 18 insurers reported losses in excess of 100 percent of their original capital base in the 10-year period. They burned through the original capital, received new capital investment from their owners and promptly lost that investment too.
The impact of the various underwriting crises limited the ability of these insurance companies to increase their capital base. The table below shows the growth in the insolvent insurer’s capital over its final 10 years of operation relative to the growth in its premiums. For example, over the 10-year period, the capital supporting the industry grew by 26 percent. Over the same period, the industry’s capital base grew by 126 percent and net premiums earned (NPE) grew by 14,789%. Advocate’s capital base was simply stretched too far. It could not finance the funds necessary to pay claims on this large a book of business. A similar pattern was true for nine of the 18 insurers in our sample.
CompanyLast 10 years
in businessGrowth in
capital
Growth in net premiums
earned
Advocate General Insurance Company 1980 to 1988 126.06% 14,789.42%
American Mutual Liability Insurance 1979 to 1988 121.40% 10.84%
Canadian Millers Mutual Insurance Company 1991 to 2000 92.29% 339.22%
The Century Insurance Company of Canada 1979 to 1988 129.91% 283.67%
Eaton Bay Insurance Company 1979 to 1988 92.05% 1,135.47%
English & American Insurance Company 1982 to 1991 208.72% 148.63%
Hiland Insurance Company 1982 to 1991 93.42% 0.00%
Maplex General Insurance 1987 to 1994 –181.21% 362.87%
Midland Insurance Company 1979 to 1985 352.12% 415.94%
The Home Insurance Company 1992 to 2001 80.39% 0.00%
Kansa General International Insurance Co. Ltd. 1985 to 1994 91.63% 0.70%
Lumbermens Mutual Casualty Company 1992 to 2001 192.97% 104.79%
National Employers Mutual General Insurance 1980 to 1989 46.37% 0.00%
Northumberland Insurance Company 1979 to 1984 1,660.14% 4,322.45%
Orion Insurance Company PLC 1983 to 1992 47.11% 43.78%
Phoenix Assurance Company of Canada 1979 to 1988 305.99% 273.08%
Reliance Insurance Company 1991 to 2000 179.36% 306.82%
United General Insurance Company 1979 to 1984 106.40% 161.65%

26
The modern playbookIt is not unusual for an industry with more than 200 companies competing to have some underperformers each year. On average, approximately 15 insurers a year experience an “underwriting crisis” in Canada as defined in this paper – experiencing loss ratios considerably higher than the industry average. For most of these insurers, the poor financial results are only temporary. Underwriting results quickly improve and they return to profitability – and thus, retain the confidence of regulators.
Over the past 10 years, PACICC monitored 30 insurers that reported more than two years of underwriting crisis. Of these 30 insurers:
• Seven merged or were sold off to other insurers;• Six are in run-off (voluntarily leaving the insurance industry); and• 17 are still actively competing in the marketplace.
A number of the 17 insurers that remain in the market are part of larger financial conglomerates and thus have access to larger pools of capital.

27
Lessons learned
The capital base of the 18 insurers in our sample slowly eroded in the 10 years prior to failure. The primary cause of this erosion was poor underwriting results. These insurers reported multiple
years where their loss experience was much worse than the industry average. On average, these insurers reported at least two years with loss ratios 20 percentage points higher than the industry average. This translates to an extra 20 cents of each premium dollar collected quickly leaving the company. There was no time to invest this money. There was less money available to enhance their business processes or retain their talent. These insurers were forced to find ways to increase their operational cash flows either by employing cash-flow underwriting or by selling invested assets. Short-term crisis management replaced long-term planning and business development.
There was a common pattern in the erosion of these companies’ capital bases. The first underwriting crisis weakened their capital base. They reacted aggressively in the first year of crisis by expanding their premiums written and by selling investments. In the second year following the crisis, they sought to tighten underwriting standards and thereby reduce their exposure to future losses. This seldom worked, however, and a second, larger claims crisis followed quickly. The firms then sought to strengthen their capital base by asking their owners to inject more capital. However, this increase in capital did not address the core problem – subpar underwriting and mispricing of insurance risk. The cycle continued and new capital was lost during the next crisis.
Poor underwriting or
underpricing created
a claims crisis.
Company needed to
generate additional
cash to pay claims.
Increased volume
of insurance means
accepting having
to pay additional
claims in the future.
Insurer needed to
increase operating
cash �ows and has two
options in the short term.
a) Sell investments.
b) Increase volume of
the insurance sold.
The tools a) and b)
shown above can work
in the short term
but weaken the
company’s capital
base.
Selling invested
assets directly reduced
the amount of capital
supporting the
insurance business.
Less capital made them
more vunerable to the
next crisis.
How insurers
fail

28
Lessons learnedFollowing is a list of lessons learned from this paper’s analysis to help insurance solvency regulators and insurance companies to avoid problem situations in future.
For insurance solvency regulators:• Solvency regulation should track trends in earnings as an indicator of future capital adequacy,
in addition to continuing to monitor capital adequacy in relation to current company commitments. Profitable insurance companies generate earnings that provide the primary source of capital to strengthen their financial health and support growth. Sustained, healthy earnings reduce the risk of insolvency, while repeated losses increase the risk of failure. Trends in earnings are the primary indicator of changes in future capital adequacy.
• Insurance solvency regulation should focus primarily on long-term financial trends. Conditions that led to the failure of insurance companies in Canada over the last 35 years built up over a period of 10 years or more. Concepts like “a run on the bank” suggest that some financial institutions fail quickly, but this has not been the recent experience of the Canadian P&C insurance industry. Some warnings of financial distress were evident years before each failure. Most companies experienced a shock five or six years before failure, when their claims increased significantly.
• Regulators should closely monitor the response of insurers to a significant shock. Most insurers that failed sought to generate the funds to pay for an unexpected increase in claims through growth in premiums and/or the sale of assets. Growth supported by inadequate premiums, insufficient loss reserves and/or participation in new markets typically establishes the foundation for another shock in claims and increases the risk of failure. Alternatively, the risk of insolvency should decline if companies address their underwriting problems by enhancing rate and reserve adequacy and attracting external capital.
For insurance companies:• Companies must focus on strong underwriting results as the most important determinant
of their survivability. All of the insurance companies that failed over the past 35 years experienced several years of underwriting crisis. Indeed, in at least two of their last 10 years of operation, these firms reported a loss ratio that was more than 20 percent above the industry average. Many other performance measures for these troubled companies were similar to the industry average (such as return on investment), but they all experienced price inadequacy, insufficient loss reserves, excessive loss ratios and other underwriting problems from which they ultimately could not recover.

29
• Management must be careful not to overreact in response to an underwriting crisis. Some insurers respond to an unanticipated spike in claims by selling assets and lowering prices in order to increase revenues. Assets sold in a rush may be undervalued. Revenues that result from lowering prices below adequate levels or failure to set aside sufficient loss reserves are actions that set the stage for the next underwriting crisis. Unexpected claims require an infusion of capital and/or increased rates and more aggressive loss reserving practices to ensure that pricing is adequate.
• Companies must address underlying deficiencies in their underwriting practices in order to properly address a crisis. Most insurers that failed over the past 35 years were successful in securing some external funds to support their troubled company – nevertheless, these companies all became insolvent. These injections were not used to address the primary weakness found in all insurance companies that failed – poor underwriting. While it is possible that the new capital was insufficient or that it arrived too late, the long-term issue for all insurance companies that failed was the need to address deficiencies in their underwriting practices.

30
References
Balcaen, Sofie, Sophie Manigart, and Hubert Ooghe, “From distress to exit: determinants of the time to exit.” Journal of Evolutionary Economics 21, no. 3 (2011): Pages 407-446.
Caprio, Gerard, and Daniela Klingebiel, “Bank insolvency: bad luck, bad policy, or bad banking?” Annual World Bank conference on development economics, Volume 79. Washington: The World Bank, 1996.
Cummins, J. David, and Richard D. Phillips, “Capital Adequacy and Insurance Risk-Based Capital Systems.” Journal of Insurance Regulation 28, no. 1 (2009).
Cummins, J. David, and David W. Summer, “Capital and risk in property-liability insurance markets.” Journal of Banking & Finance, Volume 20, Issue 6, July 1996, Pages 1069-1092.
D’Aveni, Richard A., “The aftermath of organizational decline: A longitudinal study of the strategic and managerial characteristics of declining firms.” Academy of Management Journal 32, no. 3 (1989): Pages 577-605.
du Jardin, Philippe, and Eric Séverin, “Dynamic analysis of the business failure process: a study of bankruptcy trajectories.” (2010).
Group-Wide Risk and Capital Management of Internationally Active Insurance Groups, http://www.genevaassociation.org/media/463708/ga2013-comframe_survey.pdf
Hambrick, Donald C., and Richard A. D’Aveni, “Large corporate failures as downward spirals.” Administrative Science Quarterly (1988): Pages 1-23.
Kohonen, Teuvo, “Self-organized formation of topologically correct feature maps.” Biological cybernetics 43, no. 1 (1982): Pages 59-69.
Lasfer, Meziane, and Laxmi S. Remer, Corporate Financial Distress and Recovery: The UK Evidence, (November 7, 2010).
Leadbetter, Darrell, and Suela Dibra, “Why insurers fail: The dynamics of property and casualty insurance insolvency in Canada.” The Geneva Papers on Risk and Insurance Issues and Practice 33, no. 3 (2008): Pages 464-488.

31
Miller, Danny, “Common syndromes of business failure.” Business Horizons 20, no. 6 (1977): Pages 43-53.
Modigliani, F.; Miller, M. (1958), “The Cost of Capital, Corporation Finance and the Theory of Investment.” American Economic Review 48 (3): Pages 261-297. JSTOR 1809766
O’Connor, Gina Colarelli, “Differences in marketing strategies and operating efficiencies in surviving and failed organizations.” Journal of Strategic Marketing 2, no. 1 (1994): Pages 1-28.
Sudarsanam, Sudi, and Jim Lai, “Corporate financial distress and turnaround strategies: An empirical analysis.” British Journal of Management 12, no. 3 (2001): Pages 183-199.

Property and Casualty InsuranceCompensation Corporation20 Richmond Street EastSuite 210Toronto, Ontario M5C 2R9Phone (416) 364-8677Fax (416) 364-5889www.pacicc.ca
Property and Casualty Insurance Compensation Corporation Société d’indemnisation en matière d’assurances IARD
Why insurers fail
The role of capital in weathering crisis
2015
By
Grant Kelly
Capital
Claims