why do so many people in cities get diabetes?
TRANSCRIPT
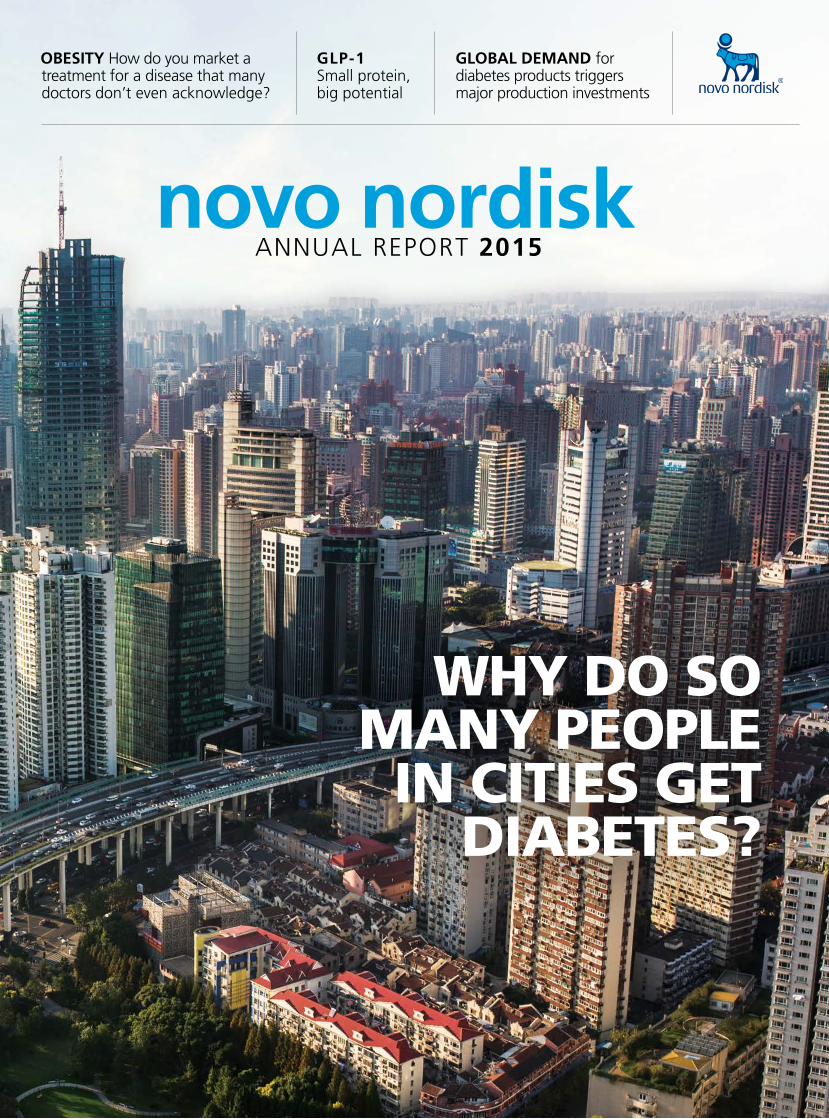
WHY DO SO MANY PEOPLE
IN CITIES GET DIABETES?
GLP-1 Small protein, big potential
OBESITY How do you market a treatment for a disease that many doctors don’t even acknowledge?
GLOBAL DEMAND for diabetes products triggers major production investments
CONTENTS
The Management review, as defined by the Danish Financial Statements Act (FSA), is found on pp 1–54 and 95.This Annual Report is published in English only. A shorter version, consisting of the Management review and excerpts from the consolidated statements, is available in Danish. In the event of any discrepancies, the English version shall prevail.
01 Letter from the Chairman
02 Letter from the CEO
04 Novo Nordisk at a glance
06 2015 performance and 2016 outlook
14 Performance highlights
16 Our strategy
18 Novo Nordisk Way
20 Pipeline overview
22 193 million people do not know they have diabetes – Are you one of them?
24 Future diabetes medicines – What’s next from Novo Nordisk’s labs?
26 GLP-1 – Small protein, big potential
28 Obesity care – Building the market from scratch
30 Tackling the rise of diabetes in cities
32 30 years of changing haemophilia
33 The people behind it all
34 The future of pharmaceuticals
38 Global demand triggers major production investments
40 Environmental strategy – Doing more with less
42 Managing risks
44 Shares and capital structure
46 Corporate governance
49 Remuneration
52 Board of Directors
54 Executive Management
55 Consolidated financial, social and environmental statements
105 Financial statements of the parent company
109 Management’s statement and Auditor’s reports
112 Product overview
113 More information and references
ACCOMPLISHMENTS AND RESULTS 2015
OUR BUSINESS
FINANCIAL, SOCIAL AND ENVIRONMENTAL
STATEMENTS
GOVERNANCE, LEADERSHIP AND
SHARES
ADDITIONAL INFORMATION
GLOBAL DEMANDtriggers major production investments38
Tackling the rise of DIABETES IN CITIES30
OBESITY CARE– Building the market from scratch28
GLP-1 – Small protein, big potential26
2015 PERFORMANCE and 2016 outlook06
All references can be found on p 113.

2015 was a good year for Novo Nordisk. This is how the Board of Directors sees it when taking stock of the year that is now behind us. I hope that you will agree with us.
In a difficult and changing environment for the pharmaceutical industry, Novo Nordisk delivered on the forecasts it made at the beginning of the year, both in terms of sales growth and profit growth. Equally important was the encouraging progress in the company’s pipeline of new and upcoming products, which bodes well for the future.
In his review of the year on the following pages, President and CEO Lars Rebien Sørensen highlights some of the key developments and achieve-ments in 2015, including the launch of Saxenda® for the treatment of obesity, the flow of encouraging phase 2 and 3 data regarding sema-glutide in both an injectable and an oral version for type 2 diabetes, and, of course, the long-awaited approval of Tresiba® in the US.
These achievements are the result of a very robust long-term strategy and excellent execution by the entire Novo Nordisk organisation. Every year we spend a considerable amount of time in board meetings and in meetings with members of Executive Management reviewing this strategy – challenging assumptions and bringing in new perspectives to be sure not only that the company’s strategic priorities are the right ones, but also that the organisation has the capabilities needed to execute them.
If you have been following Novo Nordisk for some years, you will notice from the article on pages 16–17 that we have not made any significant changes to the strategy in 2015. This means the company will retain its sharp focus on just four disease areas: diabetes, obesity, haemophilia and growth disorders. Many of our discussions last year focused on how best to ensure that Novo Nordisk can continue its track record of innovation within these areas, so that we will have new and better medicines also in the coming decades for people with these serious chronic conditions. This requires further expansion of our research organisations in Europe, the US and China, and also that we become even more active in forming partnerships with biotech companies and universities that have knowledge and technologies that complement what we have in-house.
One of the main responsibilities of a board is to ensure that the company has the right executive leadership and that there are solid succession plans in place for top management. In April, we announced significant changes to the organisation’s leadership, elevating the heads of our commercial activities in the US, Europe and International Operations, and of Product Supply to Executive Management. Moreover, Jakob Riis, executive vice president, Marketing, Medical Affairs and Stakeholder Engagement, was given additional responsibility for China, Japan, Korea, Australasia and Canada. The Board also decided that CEO Lars Rebien Sørensen should remain in his role until he approaches the end of his contract, which expires in 2019.
These changes enhance the visibility of Novo Nordisk’s international business operations to the Board at a time when the company is preparing for global launches of several key products and embarking on an unprecedented investment programme in new production facilities. In addition, they support the further development of our key leadership talent.
As a result of the changes, Kåre Schultz, president and COO, decided to continue his professional career outside Novo Nordisk. I wish him all the
best and thank him for his achievements over many years at Novo Nordisk. Lars Rebien Sørensen now has the additional role of chairman of the Operations Committee, with Lars Fruergaard Jørgensen, executive vice president, Corporate Development, as vice chair.
In light of Novo Nordisk’s solid performance in 2015, the Board will at the Annual General Meeting propose a 28% increase in dividend to 6.40 Danish kroner per share. Furthermore, the Board has decided to initiate a new share repurchase programme of up to 14 billion kroner, which will commence in February 2016, and intends to introduce an interim dividend for 2016 in August 2016.
With the financial results for 2015, we have achieved the long-term financial targets that we last revised in January 2013. In light of the significant improvement in operating margin during the past years and the need to invest in sustaining sales growth, further improvement of the operating margin is not a strategic priority in the coming years. Reflecting this, we have set the long-term target for operating profit growth at 10%, under-lining our confidence in the growth outlook for the company.
On behalf of the Board of Directors, I would like to express my appreciation for the leadership shown by Lars Rebien Sørensen and his management team, and for the hard work and dedication of the entire Novo Nordisk organisation.
A GOOD YEARLETTER FROM THE CHAIRMAN
Göran Ando Chairman of the Board of Directors
1
In my letter in last year’s Annual Report, I predicted that 2015 would be one of the most exciting and challenging years in Novo Nordisk’s 92-year history. And indeed it has been. As it turned out, there were many reasons to be excited, and we successfully dealt with most of the challenges.
I will return to the challenges later. Let us start with the excitement which, to a large extent, was related to new developments in our product pipeline. The fact is that if our pipeline does not progress well, if we fail to discover and develop new, innovative products for people with diabetes and other serious chronic conditions, then we will not be successful in the long term. So let us look at the highlights from our pipeline in 2015:
• Tresiba® (insulin degludec) – our new-generation long-acting insulin – was approved in the US in September and launched in January 2016 for the treatment of type 1 and type 2 diabetes.
• Xultophy® – the combination of insulin degludec and liraglutide for type 2 diabetes – was launched in the first European countries and filed for approval in the US.
• Following successful completion of the phase 3a studies, we filed for regulatory approval of faster-acting insulin aspart in both the EU and the US for the management of blood glucose around meals for both type 1 and 2 diabetes patients.
• Injectable semaglutide – a once-weekly GLP-1-analogue for type 2 diabetes – showed superior efficacy over the comparator products in four phase 3 trials announced during the year.
• A once-daily oral formulation of semaglutide showed very encouraging results in a proof-of-concept phase 2 trial, and we subsequently decided to take this product into phase 3 development.
• We launched Saxenda® (liraglutide 3 mg) in the US and in the first markets outside the US. Saxenda® is our first product for chronic weight management, an undeveloped market despite the huge and growing burden of obesity all over the world.
• We launched NovoEight® in the US for people with haemophilia A, and in January 2016 we filed our long-acting factor IX (nonacog beta pegol) for the treatment of haemophilia B for approval in Europe. We expect to file in the US in the first half of 2016.
With the number of projects we have in our pipeline these days, one would also expect a number of setbacks. However, we were privileged to have only one significant disappointment in 2015: the results of phase 3 trials showed that liraglutide (Victoza®), as adjunct to insulin therapy, met the primary end-point of improving blood glucose control for people with type 1 diabetes, but unfortunately without the hypoglycaemic benefit experienced in type 2 diabetes. We therefore decided not to submit an application to expand the label of Victoza® for use in type 1 diabetes.
Our expectation is that there will continue to be increasing demand for our products for many years to come. That is why, in 2015, we decided on an unprecedented expansion of our production capacity for diabetes, obesity and haemophilia products. This includes investing close to 2 billion US dollars in a new site in Clayton, North Carolina, which will produce active pharmaceutical ingredients for both oral semaglutide and a range of Novo Nordisk’s current and future diabetes care products.
While developing and making such products will always remain our number one priority, our efforts to change diabetes go beyond medicine. In 2014, we launched Cities Changing Diabetes – a partnership programme to identify and address the root causes of type 2 diabetes in major cities around the world. I was very happy to see the progress already made when we hosted the inaugural Cities Changing Diabetes Summit in Copenhagen in November 2015.
When I referred to 2015 as a challenging year in the opening of my letter, I was referring to the challenges of obtaining access to the market for our new products.
In 2015, we found ourselves in increasingly tougher negotiations with payers in the US to get our products onto their formularies. In Europe, China, Japan and many other countries, we are experiencing continued strong pressure on prices and reimbursement restrictions for new products. In one case, for Tresiba® in Germany, we had to make the difficult decision to discontinue the product following the negative outcome of price negotiations with the statutory health insurance funds. We were offered a price at the level of ordinary human insulin, a product which was launched in the 1980s. If we were to accept this price, we would undermine our ability to research and develop medical innovations for people with diabetes.
This is an extreme case, but it serves as an example of what could become an unsustainable future for research-based pharmaceutical companies if payers and producers cannot find common ground when determining the value of a medicinal product. There is no doubt that we at Novo Nordisk, and in the industry at large, need to become better at demonstrating the value that our new products bring. It is in this light that our new partnership with IBM Watson Health should be seen. Announced in December, this partnership will explore possibilities for improved diabetes care via insights from real-time, real-world evidence of Novo Nordisk diabetes treatments and devices.
Despite market access challenges, we ended the year growing sales by 8% and operating profit by 21%, both in local currencies. Sales growth was primarily driven by Victoza®, aided by the high growth of the GLP-1 market, but other products also did well, including Levemir®, NovoRapid®, Tresiba® and our human growth hormone, Norditropin®. Measured in local currencies, new-generation insulin accounted for 10% sales growth, and Tresiba® continues to do well in all the markets in which it is competing on an equal footing with other insulin products in terms of reimbursement status. Tresiba® was launched in Japan as the first country in February 2013, and by the end of 2015 it had claimed more than 33% of the segment for long-acting insulin (basal insulin) in Japan, measured in value.
IT’S ALL ABOUT INNOVATION
LETTER FROM THE CEO
From a regional perspective, North America accounted for 62% of sales growth, followed by International Operations and Region China. It is also in these regions that we expect to see most of the growth in the coming years, although we have had to lower our short-term growth projections for China due to a combination of lower economic growth, pricing reforms and increased competition from both local and global competitors.
In the performance review starting on page 6 and in subsequent articles in this Annual Report, you can read more about some of the topics I have mentioned in my letter. I hope they will give you a good sense of why, despite the challenging business environment for the pharmaceutical industry, I remain optimistic about the future for Novo Nordisk. The need for medical treatment and better pharmaceuticals is there, not least in many emerging economies. We will do our best to meet these needs and, in doing so, create value for our shareholders and for society at large by the knowledge we generate, the taxes we pay and the jobs we create.
So what about 2016? I predict another exciting and challenging year. There will be an intense news flow from our pipeline, including the results of the two large cardiovascular outcomes trials: LEADER regarding Victoza® and DEVOTE regarding insulin degludec. Plus, of course, there will be a lot of attention on how Tresiba® performs in the all-important US market. You will find a table of key pipeline events on page 21 and our financial outlook for 2016 on page 8.
As always, I take great pleasure in working with my Executive Management team, our Senior Management Board and the Board of Directors on making the most of the opportunities and dealing with the challenges ahead. As mentioned by our Chairman, Göran Ando, in his letter, we had a reorganisation of Executive Management in 2015, which led to Kåre Schultz, our chief operating officer for many years, seeking new opportunities outside Novo Nordisk. I have worked with Kåre for as long as I can remember and have great respect for his capabilities and what he has done for Novo Nordisk over the years. I wish him all the best in his new career.
Last but not least, I would like to thank everyone in the Novo Nordisk organisation for their contributions to our results in 2015, the people who use our products for their confidence in us, our stakeholders and partners for their collaboration and our shareholders for their continued support.
Lars Rebien SørensenPresident and chief executive officer
3

FOCUS VALUE CREATEDRESOURCES
Return to shareholders
Tax contributions
HOW NOVO NORDISK CREATES AND SUSTAINS VALUE
Taking a patient-centred approach, Novo Nordisk provides innovation for the benefit of all of the company’s stakeholders. The Triple Bottom Line principle, anchored in the Novo Nordisk Way, is the foundation that makes it possible to optimise the use of resources and maximise value creation in a sustainable way.
OUR BUSINESS MODEL
Financial resources to invest in R&D, production capacity and customer outreach
INTERNAL
Contributions to communities
Capital provided by investors
EXTERNAL
Biological research and manufacturing facilities
Job creation and productivity
A skilled and diverse workforce
Raw materials
Insights from patients and expertise from academic and educational institutions
Improved health and quality of life for people with diabetes and other serious chronic diseases
WE DISCOVER, DEVELOP AND MANUFACTURE INNOVATIVE BIOLOGICAL MEDICINES AND
MAKE THEM ACCESSIBLE TO PATIENTS THROUGHOUT THE WORLD
Capacity and competence building
NOVO NORDISKAT A GLANCENovo Nordisk is a global healthcare company with more than 90 years of innovation and leadership in diabetes care. This heritage has given us experience and capabilities that also enable us to help people defeat other serious chronic conditions: haemophilia, growth disorders and obesity. For more information, visit novonordisk.com, Twitter, LinkedIn, YouTube and Facebook.
NOVO NORDISK WAY
CORPORATE STRATEGY
Dia
betes
Growth d
isord
ers
PATIENTS
Obesity
Haem
ophilia
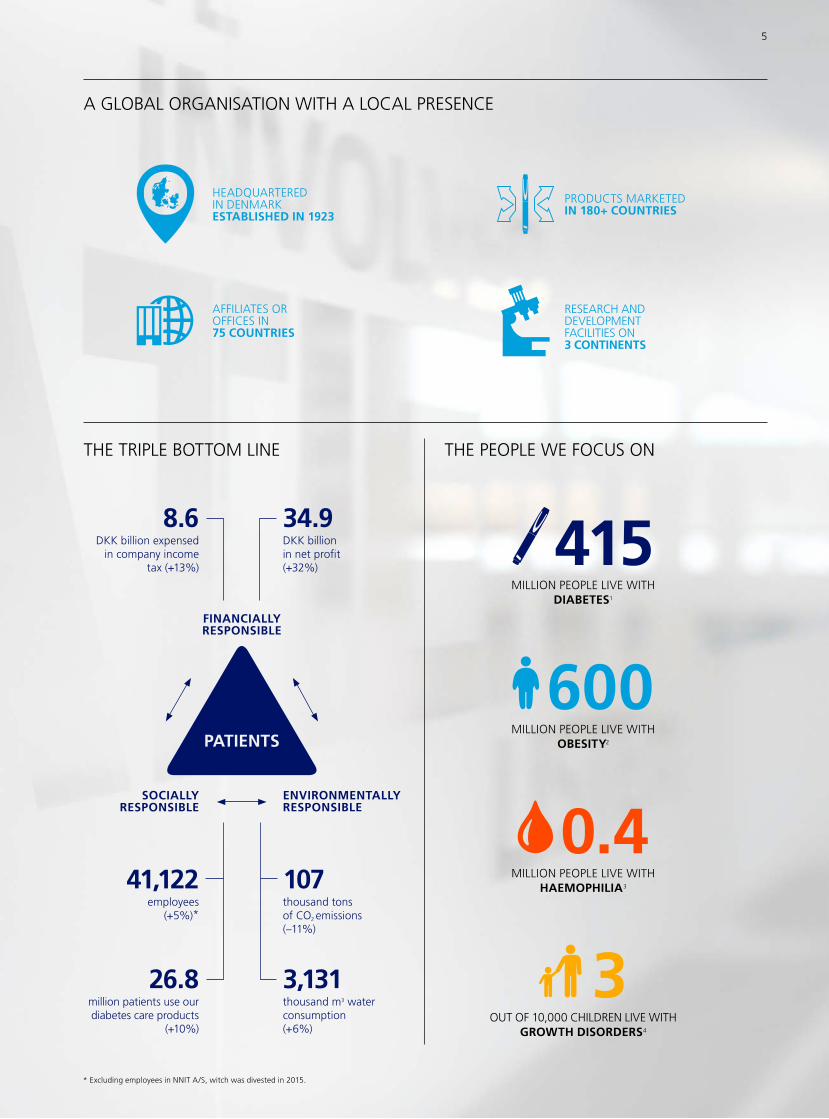
A GLOBAL ORGANISATION WITH A LOCAL PRESENCE
HEADQUARTERED IN DENMARK ESTABLISHED IN 1923
PRODUCTS MARKETED IN 180+ COUNTRIES
AFFILIATES OR OFFICES IN 75 COUNTRIES
RESEARCH AND DEVELOPMENT FACILITIES ON 3 CONTINENTS
THE TRIPLE BOTTOM LINE
41,122employees
(+5%)*
26.8million patients use our diabetes care products
(+10%)
8.6DKK billion expensed
in company income tax (+13%)
34.9DKK billionin net profit (+32%)
107thousand tons of CO2 emissions(–11%)
3,131thousand m3 water consumption(+6%)
SOCIALLYRESPONSIBLE
ENVIRONMENTALLYRESPONSIBLE
FINANCIALLYRESPONSIBLE
THE PEOPLE WE FOCUS ON
MILLION PEOPLE LIVE WITH DIABETES1
415
MILLION PEOPLE LIVE WITH HAEMOPHILIA3
0.4
MILLION PEOPLE LIVE WITH OBESITY2
600
OUT OF 10,000 CHILDREN LIVE WITH GROWTH DISORDERS4
3* Excluding employees in NNIT A/S, witch was divested in 2015.
5
2015 PERFORMANCE AND 2016 OUTLOOK
FINANCIAL PERFORMANCE
2011 2012 2013 2014 20150
5
10
15
20
25
SALES GROWTH • In local currencies • In DKK as reported
%
2011 2012* 2013 2014* 20150
20
40
60
80
100
SHARE OF GROWTH IN LOCAL CURRENCIES Japan & Korea Region China International Operations Europe North America
%
* In 2012 and 2014, Japan & Korea contributed –1% to the total growth.
2011 2012 2013 2014 20150
25
50
75
100
125
SALES BY SEGMENT Biopharmaceuticals Diabetes and obesity care
DKK billion
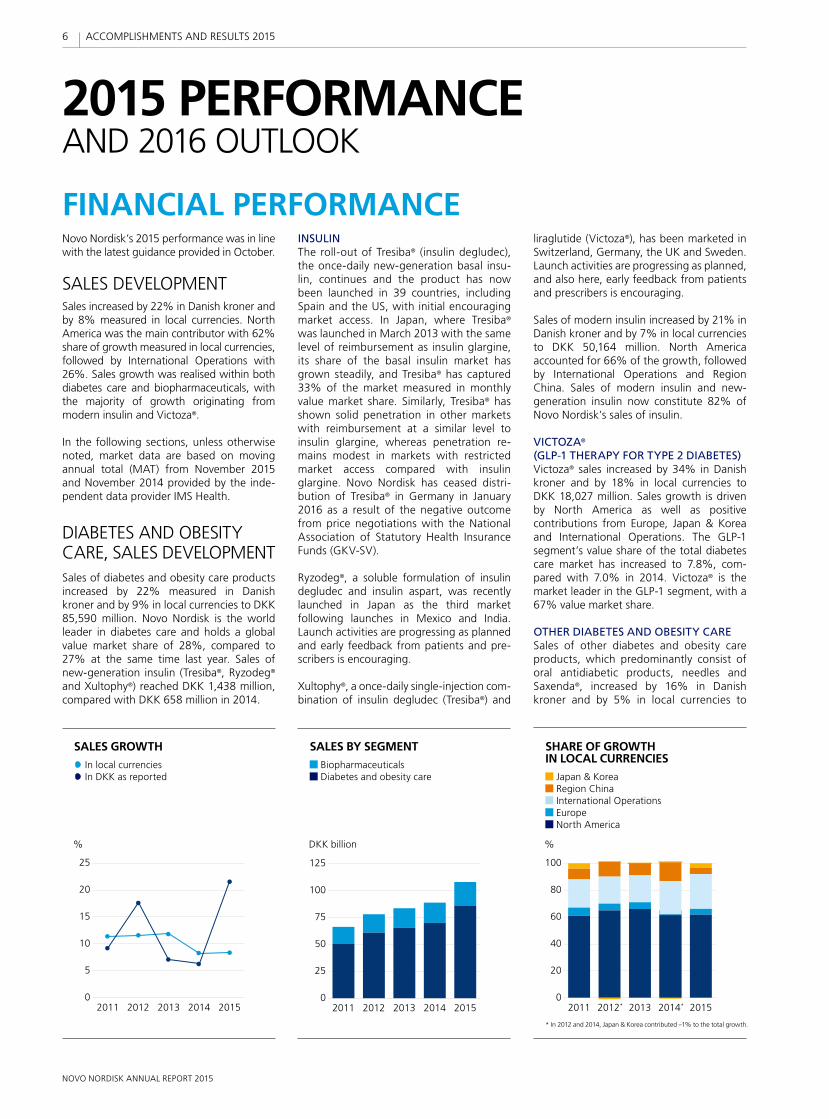
Novo Nordisk’s 2015 performance was in line with the latest guidance provided in October.
SALES DEVELOPMENTSales increased by 22% in Danish kroner and by 8% measured in local currencies. North America was the main contributor with 62% share of growth measured in local currencies, followed by International Operations with 26%. Sales growth was realised within both diabetes care and biopharmaceuticals, with the majority of growth originating from modern insulin and Victoza®.
In the following sections, unless otherwise noted, market data are based on moving annual total (MAT) from November 2015 and November 2014 provided by the inde-pendent data provider IMS Health.
DIABETES AND OBESITY CARE, SALES DEVELOPMENTSales of diabetes and obesity care products increased by 22% measured in Danish kroner and by 9% in local currencies to DKK 85,590 million. Novo Nordisk is the world leader in diabetes care and holds a global value market share of 28%, compared to 27% at the same time last year. Sales of new-generation insulin (Tresiba®, Ryzodeg® and Xultophy®) reached DKK 1,438 million, compared with DKK 658 million in 2014.
INSULIN The roll-out of Tresiba® (insulin degludec), the once-daily new-generation basal insu-lin, continues and the product has now been launched in 39 countries, including Spain and the US, with initial encouraging market access. In Japan, where Tresiba® was launched in March 2013 with the same level of reimbursement as insulin glargine, its share of the basal insulin market has grown steadily, and Tresiba® has captured 33% of the market measured in monthly value market share. Similarly, Tresiba® has shown solid penetration in other markets with reimbursement at a similar level to insulin glargine, whereas penetration re-mains modest in markets with restricted market access compared with insulin glargine. Novo Nordisk has ceased distri-bution of Tresiba® in Germany in January 2016 as a result of the negative outcome from price negotiations with the National Association of Statutory Health Insurance Funds (GKV-SV).
Ryzodeg®, a soluble formulation of insulin degludec and insulin aspart, was recently launched in Japan as the third market following launches in Mexico and India. Launch activities are progressing as planned and early feedback from patients and pre-scribers is encouraging.
Xultophy®, a once-daily single-injection com-bination of insulin degludec (Tresiba®) and
liraglutide (Victoza®), has been marketed in Switzerland, Germany, the UK and Sweden. Launch activities are progressing as planned, and also here, early feedback from patients and prescribers is encouraging.
Sales of modern insulin increased by 21% in Danish kroner and by 7% in local currencies to DKK 50,164 million. North America accounted for 66% of the growth, followed by International Operations and Region China. Sales of modern insulin and new-generation insulin now constitute 82% of Novo Nordisk’s sales of insulin.
VICTOZA®
(GLP-1 THERAPY FOR TYPE 2 DIABETES)Victoza® sales increased by 34% in Danish kroner and by 18% in local currencies to DKK 18,027 million. Sales growth is driven by North America as well as positive contributions from Europe, Japan & Korea and International Operations. The GLP-1 segment’s value share of the total diabetes care market has increased to 7.8%, com-pared with 7.0% in 2014. Victoza® is the market leader in the GLP-1 segment, with a 67% value market share.
OTHER DIABETES AND OBESITY CARESales of other diabetes and obesity care products, which predominantly consist of oral antidiabetic products, needles and Saxenda®, increased by 16% in Danish kroner and by 5% in local currencies to
6
NOVO NORDISK ANNUAL REPORT 2015
ACCOMPLISHMENTS AND RESULTS 2015
CONTINUED
2011 2012 2013 2014 20150
10
20
30
40
0
10
20
30
40
DKK billion
NET PROFIT • Net profit margin (right) Net profit (left)
2011 2012 2013 2014 20150
10
20
30
40
DEVELOPMENT IN COSTS Costs in % of sales
• Sales and distribution • Cost of goods sold • Research and development • Administration
%
2011 2012 2013 2014 20150
10
20
30
40
50
0
10
20
30
40
50
OPERATING PROFIT • Operating profit margin (right) Operating profit (left)
DKK billion % %
DKK 4,730 million. This reflects a significant positive contribution from the US launch of Saxenda®, liraglutide 3 mg for weight management, in May 2015. In the US, Saxenda® has broad market access in the commercial segment, launch activities are progressing as planned and feedback from patients and prescribers is encouraging. Declining sales of needles in Europe and oral anti-diabetics in North America and International Operations partly offset sales growth.
BIOPHARMACEUTICALS SALES DEVELOPMENTSales of biopharmaceutical products in-creased by 19% measured in Danish kroner and by 6% in local currencies to DKK 22,337 million. Sales growth is primarily driven by North America, International Operations and Europe.
HAEMOPHILIASales of haemophilia products increased by 14% in Danish kroner and by 3% in local currencies to DKK 10,647 million. The growth in local currencies is primarily driven by the roll-out of NovoEight® in Europe, Japan and the US as well as by NovoSeven® in Inter-national Operations, partly offset by lower NovoSeven® sales in the US and Japan.
NORDITROPIN®
(GROWTH HORMONE THERAPY)Sales of Norditropin® increased by 20% in Danish kroner and by 8% in local currencies to DKK 7,820 million. The sales growth is primarily derived from North America, reflecting favourable pricing and increased demand driven by the pre-filled FlexPro® device as well as Latin American and Middle East markets in International Operations. Novo Nordisk is the leading company in the global growth hormone market, with a 32% market share measured in volume.
OTHER BIOPHARMACEUTICALS Sales of other products within biopharma-ceuticals, which predominantly consist of hormone replacement therapy-related (HRT) products, increased by 28% in Danish kroner and by 13% in local currencies to DKK 3,870 million. Sales growth is driven by a positive impact from pricing of Vagifem® in the US.
DEVELOPMENT IN COSTS AND OPERATING PROFITThe cost of goods sold increased by 11% to DKK 16,188 million, resulting in a gross margin of 85.0%, compared with 83.6% in 2014. This reflects a positive currency impact of 1.5 percentage points and a positive impact from the product mix, primarily due to increased sales of Victoza® and modern insulin. This is countered by ramp-up costs for new manufacturing capacity.
Sales and distribution costs increased by 22% in Danish kroner and by 9% in local currencies to DKK 28,312 million. The increase in costs is driven by US launch costs related to Saxenda® and NovoEight® and by preparations for the Tresiba® launch in the US, sales force investments in selected countries in International Operations as well as adjustments to legal provisions.
Research and development costs decreased by 1% in Danish kroner and by 6% in local currencies to DKK 13,608 million. Excluding all costs related to inflammatory disorders, an area which Novo Nordisk exited in September 2014, research and development costs increased by 8% compared to 2014. The increase in underlying costs reflects the progression of the late-stage diabetes care portfolio and is primarily driven by the cardiovascular outcomes trial DEVOTE for insulin degludec and the phase 3a pro-gramme SUSTAIN for the once-weekly GLP-1
analogue semaglutide. The increase in costs is partly offset by lower costs related to faster-acting insulin aspart following the completion of the phase 3a development programme onset in August 2015.
Administration costs increased by 9% in Danish kroner and by 4% in local currencies to DKK 3,857 million.
Other operating income (net) was DKK 3,482 million, compared with DKK 770 million in 2014. The increase is driven by the DKK 2,376 million non-recurring income from the partial divestment of NNIT A/S, an IT service and consultancy company, in connection with the Initial Public Offering on Nasdaq Copenhagen under the symbol ‘NNIT’ (ISIN DK0060580512) as well as the DKK 449 million non-recurring income related to the out-licensing of assets for inflammatory disorders.
Operating profit increased by 43% in Danish kroner to DKK 49,444 million. In local currencies the growth was 21%, which is slightly higher than the latest guidance for operating profit growth measured in local currencies for 2015 of ‘around 20%’. Adjusted for the income related to the partial divestment of NNIT A/S, the growth in operating profit was 14% in local currencies.
NET FINANCIALS AND TAXNet financials showed a net loss of DKK 5,961 million, compared with a net loss of DKK 396 million in 2014. The reported net financial loss in 2015 is larger than the latest guidance of ‘around DKK 5.6 billion’, primarily reflecting higher than expected losses on commercial balances following the depreciation of the Argentine peso in December 2015 as well as an effect from the depreciation of the Russian rouble and the Brazilian real during the fourth quarter of 2015.
7
NOVO NORDISK ANNUAL REPORT 2015
ACCOMPLISHMENTS AND RESULTS 2015
In line with Novo Nordisk’s treasury policy, the most significant foreign exchange risks for the Group have been hedged, primarily through foreign exchange forward contracts. The foreign exchange result was a loss of DKK 5,898 million compared with a loss of DKK 381 million in 2014. This development reflects losses on foreign exchange hedging involving especially the US dollar due to its appreciation versus the Danish krone com-pared with the prevailing exchange rates in 2014. As of 31 December 2015, foreign ex-change hedging losses of around DKK 700 million have been deferred for recognition in the income statement in 2016.
The effective tax rate for 2015 was 19.8%, which is in line with the latest guidance of a tax rate of ‘around 20%’ for the full year 2015. The lower tax rate compared with the 2014 level of 22.3% primarily reflects the tax-free gain from the partial divestment of NNIT A/S, the gradual reduction of the corporate income tax rate in Denmark from 24.5% in 2014 to 23.5% in 2015 as well as changes in provisions related to international tax cases.
CAPITAL EXPENDITURE AND FREE CASH FLOWNet capital expenditure for property, plant and equipment was DKK 5.2 billion, compared with DKK 4.0 billion in 2014, which is in line with the latest guidance of ‘around DKK 5.0 billion’. Net capital expenditure was primarily related to investments in additional insulin filling capacity, expansion of the manu fac-turing capacity for biopharmaceutical pro d-ucts and the construction of new re search facilities.
Free cash flow was DKK 34.2 billion, com-pared with DKK 27.4 billion in 2014, which is in line with the latest guidance of ’DKK 33–35 billion’. The increase of 25% com-pared with 2014 primarily reflects the increased cash flow from operating activities as well as the non-recurring proceeds from the partial divestment of NNIT A/S.
OUTLOOK 2016 Sales growth for 2016 is expected to be 5–9% measured in local currencies. This reflects expectations for continued robust performance for the portfolio of modern insulin, Victoza® and Tresiba® as well as a
contribution from Saxenda® and Xultophy®. These sales drivers are expected to be partly countered by an impact from a contract loss in the US, healthcare reforms, the loss of exclusivity for products within hormone replacement therapy, intensifying compe-tition within diabetes and biopharmaceuticals as well as macroeconomic conditions in China and a number of markets in Inter-national Operations. Given the current level of exchange rates versus the Danish krone, growth reported in DKK is expected to be around 1 percentage point lower than the local currency level.
For 2016, operating profit growth is expected to be 5–9% measured in local currencies, adjusted by DKK 2,376 million for the partial divestment of NNIT A/S and by DKK 449 million for the income related to the out-licensing of assets for inflammatory disorders, both in 2015. The expectations for operating profit growth reflect growth in selling and distribution costs to support continued launch activities as well as in research and development costs to support the progress of Novo Nordisk’s pipeline. Given the current level of exchange rates versus the Danish krone, growth reported in DKK is expected to be around 1 percentage point lower than the local currency level.
For 2016, Novo Nordisk expects a net financial loss of around DKK 1.3 billion. The current expectation primarily reflects losses associat-ed with foreign exchange hedging contracts, mainly related to the appreciation of the US
dollar versus the Danish krone compared to the prevailing exchange rates in 2015.
The effective tax rate for 2016 is expected to be in the range of 20–22%.
Capital expenditure is expected to be around DKK 7.0 billion in 2016, primarily related to investments in an expansion of the manu-facturing capacity for biopharmaceutical products, additional capacity for active pharmaceutical ingredient production within diabetes care, an expansion of the insulin filling capacity and construction of new research facilities. Depreciation, amortisation and impairment losses are expected to be around DKK 3.0 billion. Free cash flow is expected to be DKK 36–39 billion.
All of the above expectations are based on the assumption that the global economic environment will not significantly change business conditions for Novo Nordisk during 2016, and that currency exchange rates, especially the US dollar, will remain at the current level versus the Danish krone.
Novo Nordisk has hedged expected net cash flows in a number of invoicing currencies and, all other things being equal, movements in key invoicing currencies will impact Novo Nordisk’s operating profit as outlined in the table to the left.
LONG-TERM FINANCIAL TARGETSNovo Nordisk introduced four long-term financial targets in 1996 to balance short- and long-term considerations, thereby ensuring a focus on shareholder value creation. The targets were subsequently revised and updated on several occasions, most recently in connection with the annual results for 2012 released in January 2013.
KEY INVOICING ANNUAL IMPACT ON NOVO NORDISK’S OPERATING HEDGING PERIOD CURRENCIES PROFIT OF A 5% MOVEMENT IN CURRENCY (MONTHS)
USD DKK 2,000 million 12
CNY DKK 300 million 11
JPY DKK 150 million 12
GBP DKK 85 million 11
CAD DKK 70 million 11
* USD and Chinese yuan traded offshore (CNH) used as proxy when hedging Novo Nordisk’s CNY currency exposure.
*
OUTLOOK 2016
EXPECTATIONS ARE AS REPORTED, EXPECTATIONSIF NOT OTHERWISE STATED 3 FEBRUARY 2016
Sales growth • in local currencies 5–9% • as reported Around 1 percentage point lower
Operating profit growth* • in local currencies 5–9% • as reported Around 1 percentage point lower
Net financials Loss of around DKK 1.3 billion
Effective tax rate 20–22%
Capital expenditure Around DKK 7.0 billion
Depreciation, amortisation and impairment losses Around DKK 3.0 billion
Free cash flow DKK 36–39 billion
The current expectations for 2016 are summarised in the table below:
* Adjusted DKK 2,376 million for the partial divestment of NNIT A/S and DKK 449 million for the income related to the out-licensing of assets for inflammatory disorders, both in 2015.
8
NOVO NORDISK ANNUAL REPORT 2015
ACCOMPLISHMENTS AND RESULTS 2015
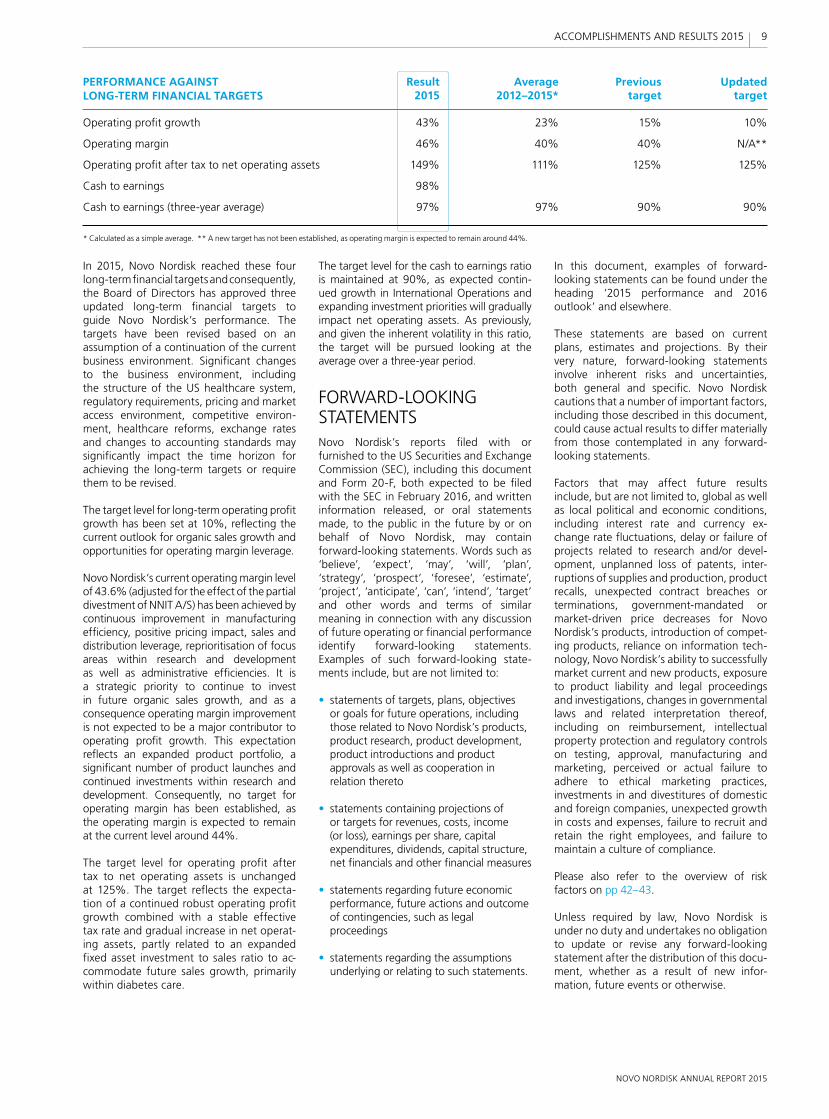
The target level for the cash to earnings ratio is maintained at 90%, as expected contin-ued growth in International Operations and expanding investment priorities will gradually impact net operating assets. As previously, and given the inherent volatility in this ratio, the target will be pursued looking at the average over a three-year period.
FORWARD-LOOKING STATEMENTSNovo Nordisk’s reports filed with or furnished to the US Securities and Exchange Commission (SEC), including this document and Form 20-F, both expected to be filed with the SEC in February 2016, and written information released, or oral statements made, to the public in the future by or on behalf of Novo Nordisk, may contain forward-looking statements. Words such as ‘believe’, ‘expect’, ‘may’, ‘will’, ‘plan’, ‘strategy’, ‘prospect’, ‘foresee’, ‘estimate’, ‘project’, ‘anticipate’, ‘can’, ‘intend’, ‘target’ and other words and terms of similar meaning in connection with any discussion of future operating or financial performance identify forward-looking statements. Examples of such forward-looking state-ments include, but are not limited to:
• statements of targets, plans, objectives or goals for future operations, including those related to Novo Nordisk’s products, product research, product development, product introductions and product approvals as well as cooperation in relation thereto
• statements containing projections of or targets for revenues, costs, income (or loss), earnings per share, capital expenditures, dividends, capital structure, net financials and other financial measures
• statements regarding future economic performance, future actions and outcome of contingencies, such as legal proceedings
• statements regarding the assumptions underlying or relating to such statements.
In 2015, Novo Nordisk reached these four long-term financial targets and consequently, the Board of Directors has approved three updated long-term financial targets to guide Novo Nordisk’s performance. The targets have been revised based on an assumption of a continuation of the current business environment. Significant changes to the business environment, including the structure of the US healthcare system, regulatory requirements, pricing and mar ket access environment, competitive environ-ment, healthcare reforms, exchange rates and changes to accounting standards may significantly impact the time horizon for achieving the long-term targets or require them to be revised.
The target level for long-term operating profit growth has been set at 10%, reflecting the current outlook for organic sales growth and opportunities for operating margin leverage.
Novo Nordisk’s current operating margin level of 43.6% (adjusted for the effect of the partial divestment of NNIT A/S) has been achieved by continuous improvement in manufacturing efficiency, positive pricing impact, sales and distribution leverage, reprioritisation of focus areas within research and development as well as administrative efficiencies. It is a strategic priority to continue to invest in future organic sales growth, and as a consequence operating margin improvement is not expected to be a major contributor to operating profit growth. This expectation reflects an expanded product portfolio, a significant number of product launches and continued investments within research and development. Consequently, no target for operating margin has been established, as the operating margin is expected to remain at the current level around 44%.
The target level for operating profit after tax to net operating assets is unchanged at 125%. The target reflects the expecta-tion of a continued robust operating profit growth combined with a stable effective tax rate and gradual increase in net operat-ing assets, partly related to an expanded fixed asset investment to sales ratio to ac-commodate future sales growth, primarily within diabetes care.
In this document, examples of forward-looking statements can be found under the heading ‘2015 performance and 2016 outlook’ and elsewhere.
These statements are based on current plans, estimates and projections. By their very nature, forward-looking statements involve inherent risks and uncertainties, both general and specific. Novo Nordisk cautions that a number of important factors, including those described in this document, could cause actual results to differ materially from those contemplated in any forward-looking statements.
Factors that may affect future results include, but are not limited to, global as well as local political and economic conditions, including interest rate and currency ex-change rate fluctuations, delay or failure of projects related to research and/or devel-opment, unplanned loss of patents, inter-ruptions of supplies and production, product recalls, unexpected contract breaches or terminations, government-mandated or market-driven price decreases for Novo Nordisk’s products, introduction of compe t-ing products, reliance on information tech-nology, Novo Nordisk’s ability to successfully market current and new products, exposure to product liability and legal proceedings and investigations, changes in governmental laws and related interpretation thereof, including on reimbursement, intellectual property protection and regulatory controls on testing, approval, manufacturing and marketing, perceived or actual failure to adhere to ethical marketing practices, investments in and divestitures of domestic and foreign companies, unexpected growth in costs and expenses, failure to recruit and retain the right employees, and failure to maintain a culture of compliance.
Please also refer to the overview of risk factors on pp 42–43.
Unless required by law, Novo Nordisk is under no duty and undertakes no obligation to update or revise any forward-looking statement after the distribution of this docu-ment, whether as a result of new infor-mation, future events or otherwise.
Previoustarget
15%
40%
125%
90%
Average 2012–2015*
23%
40%
111%
97%
Result 2015
43%
46%
149%
98%
97%
Updatedtarget
10%
N/A**
125%
90%
PERFORMANCE AGAINST LONG-TERM FINANCIAL TARGETS
Operating profit growth
Operating margin
Operating profit after tax to net operating assets
Cash to earnings
Cash to earnings (three-year average)
* Calculated as a simple average. ** A new target has not been established, as operating margin is expected to remain around 44%.
9
NOVO NORDISK ANNUAL REPORT 2015
ACCOMPLISHMENTS AND RESULTS 2015
RESEARCH AND DEVELOPMENT
2011 2012 2013 2014 20150
5
10
15
20
25
30
PATIENT YEARS IN CLINICAL TRIALS*
Japan & Korea Region China International Operations Europe North America
Thousand
* A patient year is measured as the total number of months a patient is enrolled in a clinical trial divided by 12.
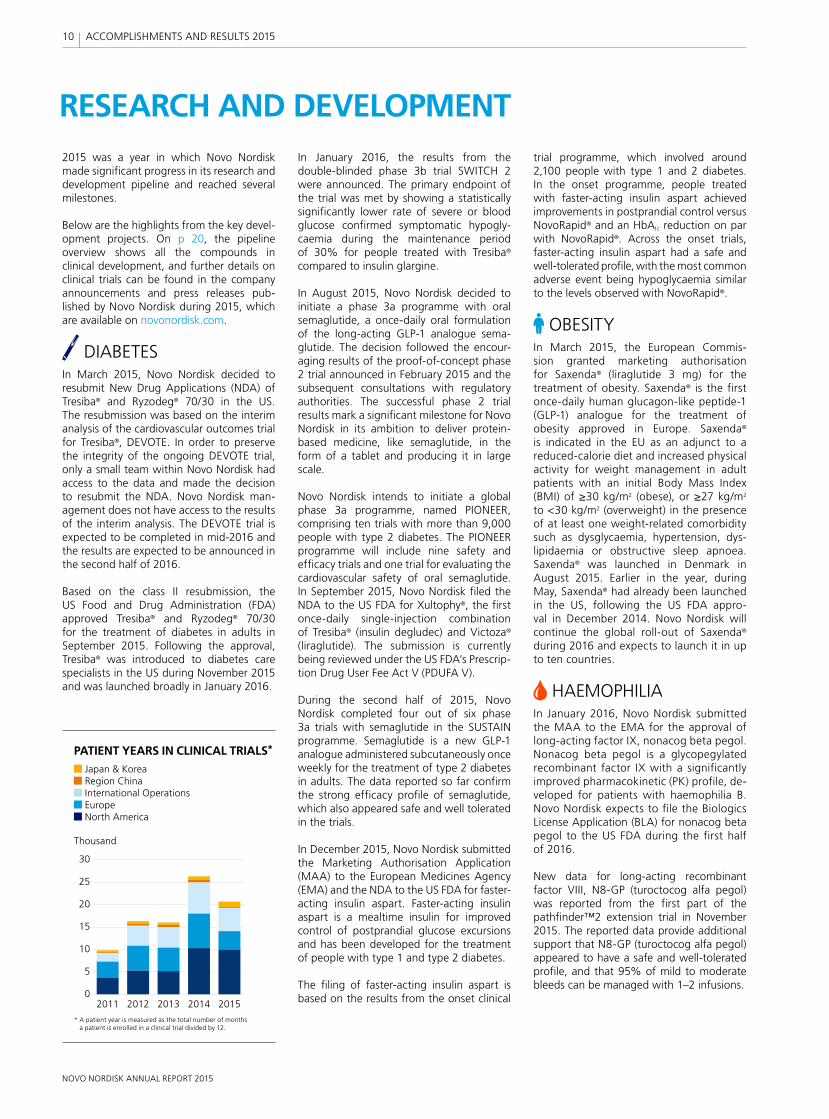
2015 was a year in which Novo Nordisk made significant progress in its research and development pipeline and reached several milestones.
Below are the highlights from the key devel-opment projects. On p 20, the pipeline overview shows all the compounds in clinical development, and further details on clinical trials can be found in the company announcements and press releases pub-lished by Novo Nordisk during 2015, which are available on novonordisk.com.
DIABETES In March 2015, Novo Nordisk decided to resubmit New Drug Applications (NDA) of Tresiba® and Ryzodeg® 70/30 in the US. The resubmission was based on the interim analysis of the cardiovascular outcomes trial for Tresiba®, DEVOTE. In order to preserve the integrity of the ongoing DEVOTE trial, only a small team within Novo Nordisk had access to the data and made the decision to resubmit the NDA. Novo Nordisk man-agement does not have access to the results of the interim analysis. The DEVOTE trial is expected to be completed in mid-2016 and the results are expected to be announced in the second half of 2016.
Based on the class II resubmission, the US Food and Drug Administration (FDA) approved Tresiba® and Ryzodeg® 70/30 for the treatment of diabetes in adults in September 2015. Following the approval, Tresiba® was introduced to diabetes care specialists in the US during November 2015 and was launched broadly in January 2016.
trial programme, which involved around 2,100 people with type 1 and 2 diabetes. In the onset programme, people treated with faster-acting insulin aspart achieved improvements in postprandial control versus NovoRapid® and an HbA1c reduction on par with NovoRapid®. Across the onset trials, faster-acting insulin aspart had a safe and well-tolerated profile, with the most common adverse event being hypoglycaemia similar to the levels observed with NovoRapid®.
OBESITYIn March 2015, the European Commis-sion granted marketing authorisation for Saxenda® (liraglutide 3 mg) for the treatment of obesity. Saxenda® is the first once-daily human glucagon-like peptide-1 (GLP-1) analogue for the treatment of obesity approved in Europe. Saxenda® is indicated in the EU as an adjunct to a reduced-calorie diet and increased physical activity for weight management in adult patients with an initial Body Mass Index (BMI) of ≥30 kg/m2 (obese), or ≥27 kg/m2 to <30 kg/m2 (overweight) in the presence of at least one weight-related comorbidity such as dysglycaemia, hypertension, dys-li pidaemia or obstructive sleep apnoea. Saxenda® was launched in Denmark in August 2015. Earlier in the year, during May, Saxenda® had already been launched in the US, following the US FDA appro-val in December 2014. Novo Nordisk will continue the global roll-out of Saxenda® during 2016 and expects to launch it in up to ten countries.
HAEMOPHILIAIn January 2016, Novo Nordisk submitted the MAA to the EMA for the approval of long-acting factor IX, nonacog beta pegol. Nonacog beta pegol is a glycopegylated recombinant factor IX with a significantly improved pharmacokinetic (PK) profile, de-veloped for patients with haemophilia B. Novo Nordisk expects to file the Biologics License Application (BLA) for nonacog beta pegol to the US FDA during the first half of 2016.
New data for long-acting recombinant factor VIII, N8-GP (turoctocog alfa pegol) was reported from the first part of the pathfinder™2 extension trial in November 2015. The reported data provide additional support that N8-GP (turoctocog alfa pegol) appeared to have a safe and well-tolerated profile, and that 95% of mild to moderate bleeds can be managed with 1–2 infusions.
In January 2016, the results from the double-blinded phase 3b trial SWITCH 2 were announced. The primary endpoint of the trial was met by showing a statisti cally significantly lower rate of severe or blood glucose confirmed symptomatic hypogly-caemia during the maintenance period of 30% for people treated with Tresiba® compared to insulin glargine.
In August 2015, Novo Nordisk decided to initiate a phase 3a programme with oral semaglutide, a once-daily oral formulation of the long-acting GLP-1 analogue sema - glutide. The decision followed the encour-aging results of the proof-of-concept phase 2 trial announced in February 2015 and the subsequent consultations with regulatory authorities. The successful phase 2 trial results mark a significant milestone for Novo Nordisk in its ambition to deliver protein-based medicine, like semaglutide, in the form of a tablet and producing it in large scale.
Novo Nordisk intends to initiate a global phase 3a programme, named PIONEER, comprising ten trials with more than 9,000 people with type 2 diabetes. The PIONEER programme will include nine safety and efficacy trials and one trial for evaluating the cardiovascular safety of oral semaglutide.In September 2015, Novo Nordisk filed the NDA to the US FDA for Xultophy®, the first once-daily single-injection combination of Tresiba® (insulin degludec) and Victoza® (liraglutide). The submission is currently being reviewed under the US FDA’s Prescrip-tion Drug User Fee Act V (PDUFA V).
During the second half of 2015, Novo Nordisk completed four out of six phase 3a trials with semaglutide in the SUSTAIN programme. Semaglutide is a new GLP-1 analogue administered subcutaneously once weekly for the treatment of type 2 diabetes in adults. The data reported so far confirm the strong efficacy profile of semaglutide, which also appeared safe and well tolerated in the trials.
In December 2015, Novo Nordisk submitted the Marketing Authorisation Application (MAA) to the European Medicines Agency (EMA) and the NDA to the US FDA for faster-acting insulin aspart. Faster-acting insulin aspart is a mealtime insulin for improved control of postprandial glucose excursions and has been developed for the treatment of people with type 1 and type 2 diabetes. The filing of faster-acting insulin aspart is based on the results from the onset clinical
10
NOVO NORDISK ANNUAL REPORT 2015
ACCOMPLISHMENTS AND RESULTS 2015
CONTINUEDCONTINUED
SOCIAL PERFORMANCE Social performance has three dimensions: improving access to medical treatment and quality of care for patients, offering a healthy and engaging working environment, and providing assurance that responsible business practices are in place, with the aim of contributing to the communities in which the company operates.
PATIENTSJust over half of the 415 million people living with diabetes1 are diagnosed, and many of those diagnosed do not receive medical treatment.
As part of Novo Nordisk’s strategy for global access to diabetes care, the company has set itself the long-term target of reaching 40 million people with its diabetes care products by 2020, which is double the baseline number in 2010. The aim is to enable more people with diabetes to receive medical treatment.
In 2015, Novo Nordisk provided medical treatments to an estimated 26.8 million pa-ti ents with diabetes worldwide, compared with 24.4 million in 2014, calculated based on WHO’s recommended daily doses for diabetes medicines. The number reflects an overall increase in the number of pa-ti ents treated with Novo Nordisk’s insulin products and was driven by human insulin in International Operations (1.2 million pa-ti ents) and modern and new-generation in-sulins globally (0.9 million patients). Novo Nordisk focuses on enhancing quality of care through product innovation, while remaining committed to expanding access to medical treatment and care for patients with diabe-tes throughout the world. The company has several programmes specifically targeting people in low- and middle-income countries who have limited access to health services.
Novo Nordisk sold human insulin according to the company’s differential pricing policy in 23 of the world’s 48 poorest countries (the Least Developed Countries – LDC), compared with 32 countries in 2014. According to this policy, the price should not exceed 20% of the average insulin price in the western world (defined as the EU, Norway, Switzerland, the US, Canada and Japan). In 2015, the LDC ceiling price for insulin treatment per patient per day was USD 0.19, while the average realised price for insulin sold under the programme was USD 0.15, corresponding to USD 3.85 per vial. The decline is attributed to fewer insulin tenders in 2015 and lack of response from governments or private wholesalers and other partners to Novo
Nordisk’s offer. The total number of patients treated with insulins sold at or below ceiling price was approximately 411,000 in 2015, which is a slight decrease compared with approximately 431,000 in 2014. Beyond this scheme, Novo Nordisk sells human insulin at similar prices in low-income countries. In 2015, an estimated 5.5 million patients have been treated with insulin for USD 0.19 per day or less, corresponding to a price per vial of USD 4.81 or less. In comparison, an estimated 4.3 million patients were treated with insulin at or below the ceiling price in 2014.
By the end of 2015, continued progress had been achieved by Changing Diabetes® programmes with the aim of reaching more people with diabetes and building capacity. The Changing Diabetes® in Children programme has been rolled out in nine countries since its launch in 2009, reach-ing more than 3,400 children, who receive insulin treatment free of cost. A total of 108 clinics have been established, and more than 6,500 healthcare professionals have been trained or re-trained. The Changing Diabetes® in Pregnancy programme, also launched in 2009, has since screened more than 33,300 women for gestational diabetes mellitus, and more than 3,800 women have been diagnosed and subsequently treated. The Base of the Pyramid programme has, since its launch in 2011, established seven Diabetes Support Centres in Nigeria and six in Ghana. The programme has been scaled up in Kenya to build capacity and ensure supply. Furthermore, two new Centres of Excellence in Diabetes care were launched in the Kenyan public sector at county level in 2015.
In 2014, Novo Nordisk launched Cities Changing Diabetes – a cross-disciplinary and cross-sector partnership programme to iden - tify and address the root causes of the rise in type 2 diabetes in urban areas. The programme is currently running in Mexico City, Copenhagen, Houston, Tianjin and Shanghai, representing more than 60 million inhabitants. In 2016, they will be joined by Vancouver and Johannesburg. The aim of the programme is to drive transformative action through new research focusing on cultural determinants and social factors that will facilitate the implementation of integrated and sustainable solutions in cities.
Donations through the World Diabetes Foundation (WDF) amounted to DKK 78 million in 2015. The WDF is an independent non-profit organisation established by Novo Nordisk in 2002 to help expand access to diabetes care. The foundation invests in
sustainable initiatives to build healthcare capacity, with the aim of improving pre-vention and treatment of diabetes in de-veloping countries. In 2015, the WDF sup-ported 22 new projects. These included projects with a focus on prevention and others aimed at reaching people in the most remote rural areas. Read more on worlddiabetesfoundation.org.
Novo Nordisk also provides financial support to improve global access to haemophilia care. In 2015, the company donated DKK 19 million to the Novo Nordisk Haemo-philia Foundation, established in 2005. The foundation supports projects and fellow - ships in developing and emerging econ-omies. Initiatives focus on capacity building, awareness, diagnosis and patient registries. Read more on nnhf.org.
EMPLOYEESAt the end of 2015, the total number of employees was 41,122, corresponding to 40,638 full-time positions, which is a 1% decrease compared with 2014 due to the divestment of NNIT A/S in March 2015. The underlying growth (5%) is primarily driven by expansion within the sales region International Operations and in Denmark, primarily within research & development and production.
Employee turnover increased from 9.0% in 2014 to 9.2% and was primarily driven by Region China. In previous years the turnover rate has been 8–10%.
The consolidated score in the annual em-ployee survey, eVoice, was 4.3 as in 2014, measured on a scale of 1 to 5, with 5 being the best score. The survey measures the extent to which the organisation is working in accordance with the Novo Nordisk Way. The 2015 result reflects a strong culture and commitment to the company’s values.
To ensure a robust pipeline of talent for management positions, a new aspiration has been set that strives for enhanced diversity in all management teams, including entry-level and middle management. By the end of 2015, the gender diversity among managers was 59% men and 41% women. Of the newly promoted managers, 44% were women.
Tragically, a sales representative in India died in a traffic accident while on duty in 2015. The 2015 average frequency rate of occupational accidents with absence decreased to 3.0 per million working hours, compared with
11
NOVO NORDISK ANNUAL REPORT 2015
ACCOMPLISHMENTS AND RESULTS 2015
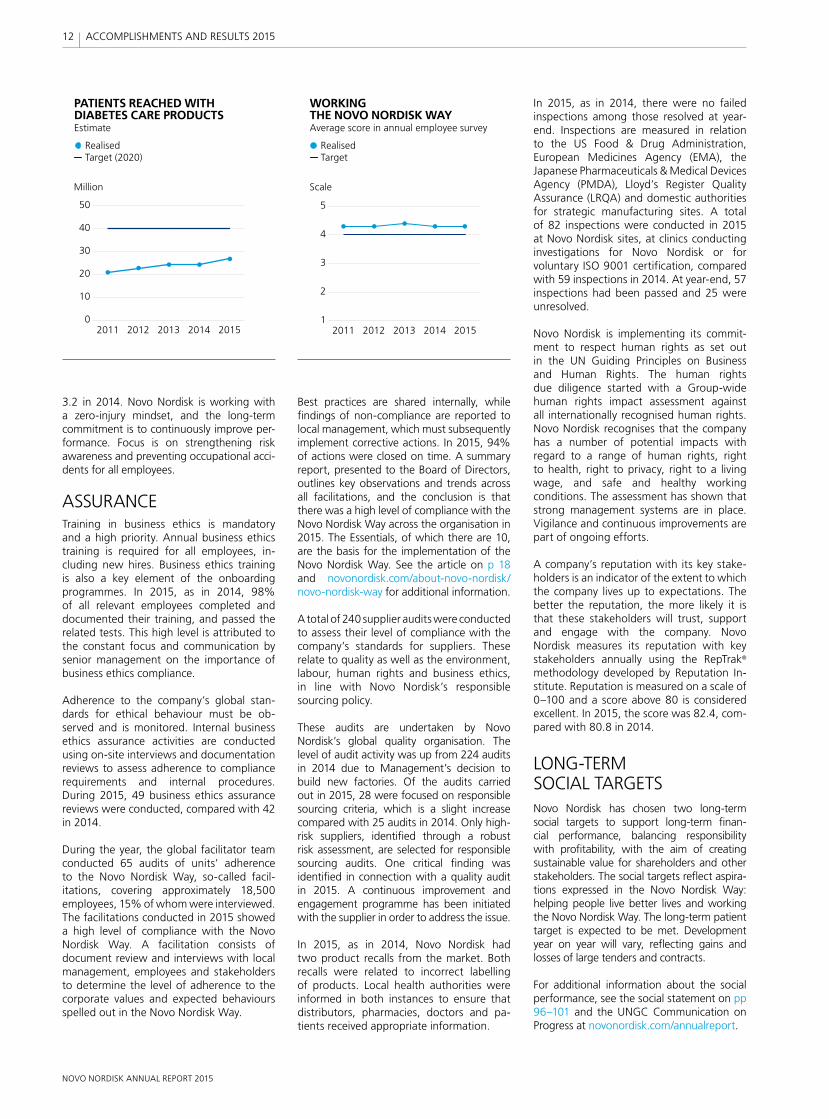
2011 2012 2013 2014 20150
10
20
30
40
50
PATIENTS REACHED WITH DIABETES CARE PRODUCTS Estimate
• Realised Target (2020)
Million
2011 2012 2013 2014 20151
2
3
4
5
WORKING THE NOVO NORDISK WAY Average score in annual employee survey
• Realised Target
Scale
3.2 in 2014. Novo Nordisk is working with a zero-injury mindset, and the long-term commitment is to continuously improve per-formance. Focus is on strengthening risk awareness and preventing occupational acci-dents for all employees.
ASSURANCETraining in business ethics is mandatory and a high priority. Annual business ethics training is required for all employees, in-cluding new hires. Business ethics training is also a key element of the onboarding programmes. In 2015, as in 2014, 98% of all relevant employees completed and documented their training, and passed the related tests. This high level is attributed to the constant focus and communication by senior management on the importance of business ethics compliance.
Adherence to the company’s global stan-dards for ethical behaviour must be ob-ser ved and is monitored. Internal business ethics assurance activities are conducted using on-site interviews and documentation reviews to assess adherence to compliance requirements and internal proce dures. During 2015, 49 business ethics assurance reviews were conducted, com pared with 42 in 2014.
During the year, the global facilitator team conducted 65 audits of units’ adherence to the Novo Nordisk Way, so-called fa cil -itations, covering approximately 18,500 employees, 15% of whom were interviewed. The facilitations conducted in 2015 showed a high level of compliance with the Novo Nordisk Way. A facilitation consists of docu ment review and interviews with local management, employees and stakeholders to determine the level of adherence to the corporate values and expected behaviours spelled out in the Novo Nordisk Way.
Best practices are shared internally, while findings of non-compliance are reported to local management, which must subsequently implement corrective actions. In 2015, 94% of actions were closed on time. A summary report, presented to the Board of Directors, outlines key observations and trends across all facilitations, and the conclusion is that there was a high level of compliance with the Novo Nordisk Way across the organisation in 2015. The Essentials, of which there are 10, are the basis for the implementation of the Novo Nordisk Way. See the article on p 18 and novonordisk.com/about-novo-nordisk/novo-nordisk-way for additional information.
A total of 240 supplier audits were conducted to assess their level of compliance with the company’s standards for suppliers. These relate to quality as well as the environment, labour, human rights and business ethics, in line with Novo Nordisk’s responsible sourcing policy.
These audits are undertaken by Novo Nordisk’s global quality organisation. The level of audit activity was up from 224 audits in 2014 due to Management’s decision to build new factories. Of the audits carried out in 2015, 28 were focused on responsible sourcing criteria, which is a slight increase compared with 25 audits in 2014. Only high-risk suppliers, identified through a robust risk assessment, are selected for responsible sourcing audits. One critical finding was identified in connection with a quality audit in 2015. A continuous improvement and engagement programme has been initiated with the supplier in order to address the issue.
In 2015, as in 2014, Novo Nordisk had two product recalls from the market. Both recalls were related to incorrect labelling of products. Local health authorities were informed in both instances to ensure that distributors, pharmacies, doctors and pa- ti ents received appropriate information.
In 2015, as in 2014, there were no failed inspections among those resolved at year-end. Inspections are measured in relation to the US Food & Drug Administration, European Medicines Agency (EMA), the Japanese Pharmaceuticals & Medical Devices Agency (PMDA), Lloyd’s Register Quality Assurance (LRQA) and domestic authorities for strategic manufacturing sites. A total of 82 inspections were conducted in 2015 at Novo Nordisk sites, at clinics conducting investigations for Novo Nordisk or for voluntary ISO 9001 certification, compared with 59 inspections in 2014. At year-end, 57 inspections had been passed and 25 were unresolved.
Novo Nordisk is implementing its commi t - ment to respect human rights as set out in the UN Guiding Principles on Business and Human Rights. The human rights due diligence started with a Group-wide human rights impact assessment against all internationally recognised human rights. Novo Nordisk recognises that the company has a number of potential impacts with regard to a range of human rights, right to health, right to privacy, right to a living wage, and safe and healthy working conditions. The assessment has shown that strong management systems are in place. Vigilance and continuous improvements are part of ongoing efforts.
A company’s reputation with its key stake-holders is an indicator of the extent to which the company lives up to expectations. The better the reputation, the more likely it is that these stakeholders will trust, support and engage with the company. Novo Nordisk measures its reputation with key stakeholders annually using the RepTrak® methodology developed by Reputation In-stitute. Reputation is measured on a scale of 0–100 and a score above 80 is considered excellent. In 2015, the score was 82.4, com-pared with 80.8 in 2014.
LONG-TERM SOCIAL TARGETSNovo Nordisk has chosen two long-term social targets to support long-term finan-cial performance, balancing responsibility with profitability, with the aim of creating sustainable value for shareholders and other stakeholders. The social targets reflect aspira-tions expressed in the Novo Nordisk Way: helping people live better lives and working the Novo Nordisk Way. The long-term patient target is expected to be met. Development year on year will vary, reflecting gains and losses of large tenders and contracts.
For additional information about the social performance, see the social statement on pp 96–101 and the UNGC Communication on Progress at novonordisk.com/annualreport.
12
NOVO NORDISK ANNUAL REPORT 2015
ACCOMPLISHMENTS AND RESULTS 2015

ENVIRONMENTAL PERFORMANCE
0
1
2
3
4
2011 2012 2013 2014 2015
ENERGY CONSUMPTION • Realised Target (not to exceed)*
* From 2007 to 2011, the target was set as an accumulated reduction over four years from a 2007 baseline.
1,000,000 GJ
2011 2012 2013 2014 20150
1
2
3
4
WATER CONSUMPTION • Realised Target (not to exceed)*
* From 2007 to 2011, the target was set as an accumulated reduction over four years from a 2007 baseline.
1,000,000 m3
Novo Nordisk measures environmental per-formance on four dimensions: consumption of energy, consumption of water, CO2 emis-sions from energy consumption and waste.
ENERGY AND WATERIn 2015, 2,778,000 GJ energy and 3,131,000 m3 water were used at production sites around the world. In spite of a high focus on process optimisations, the energy consumption increased by 9% and the water consumption by 6%. This development reflects increased production and capacity. Of the water used at production sites, 14% is in water-scarce regions in Brazil and China. These sites have a particular focus on good water stewardship.
CO2 EMISSIONSWhile the main focus of Novo Nordisk’s climate action programme has been to re-duce CO2 emissions from production as well as emissions from distribution of products, Novo Nordisk is now extending the scope of the climate programme to encompass indirect emissions from relevant business activities. The initial focus is on the supply chain, and emissions from company cars and business travel. Refer to p 40 for more information on the climate ambition.
The CO2 emissions related to consumption of energy at the production facilities de-creased by 11%, despite the increase in energy use of 9%. The production plant in Tianjin, China, has started sourcing wind power from a windfarm in Inner Mongolia, and the Danish production facilities are
now sourcing bio-natural gas. This is biogas produced from liquid manure, food waste and organic waste from the industry. The biogas is upgraded to meet the quality re-quirements of natural gas and feeds into the natural gas distribution system.
CO2 emissions from transport (product distribution) decreased significantly, by 25%, compared with 2014. This is mainly due to an increase in the volume of products distributed via sea from 72% in 2014 to 83% in 2015. In 2015, CO2 emissions from sea freight accounted for 16%, transport via trucks accounted for 5% and air transport accounted for 79% of total emissions. Distri-buting as many products as possible by sea is a priority for Novo Nordisk, as it reduces both CO2 emissions and costs.
Novo Nordisk also aims to reduce CO2 emissions from business flights and company cars. In 2015, business flights resulted in estimated CO2 emissions of 74,000 tons, which is an increase of 9% compared with 2014. The estimated CO2 emissions from leased company cars decreased by 7%, from 72,000 tons in 2014 to 67,000 tons in 2015.
WASTEIn 2015, Novo Nordisk generated 34,715 tons of waste, which is an increase of 13% compared with 2014. This is mainly due to an increase in non-recyclable ethanol used in purification processes for insulin production. Reducing ethanol waste is a high priority for the company, and efficient regeneration plants enable the ethanol to be re-used many times.
LONG-TERM ENVIRONMENTAL TARGETS
The long-term ambition is to decouple consumption of water and energy from sales growth. The current target is set as a maximum of half of the percentage in- cre ase in sales in local currencies, measured as a three-year average. In 2015, sales increased by 8% in local currencies while energy consumption increased by 9% and water consumption by 6%. The target is challenged by production expansion and lower sales growth rates.
NEW LONG-TERM TARGET FOR CO2 EMISSIONS Novo Nordisk has set a new long-term target to reduce CO2 emissions. A key element of the strategy is increasing the share of renewable energy. In 2020, production sites worldwide will be 100% powered by renewable electricity. As part of the We Mean Business Coalition, Novo Nordisk has signed the RE100 initiative led by The Climate Group in partnership with CDP. This is a collaborative initiative of influential businesses committed to 100% renewable electricity that is working to increase cor-porate demand for renewable energy.
For additional information on environmental performance, see the environmental state-ment on pp 102–104 and the UNGC Com-munication on Progress at novonordisk.com/annualreport.
13
NOVO NORDISK ANNUAL REPORT 2015
ACCOMPLISHMENTS AND RESULTS 2015
NOVO NORDISK ANNUAL REPORT 2015
14 ACCOMPLISHMENTS AND RESULTS 2015
PERFORMANCE HIGHLIGHTS
2011 2012 2013 2014 20150
5
10
15
20
25
BIOPHARMACEUTICALS SALES Other Biopharmaceuticals Norditropin®
Haemophilia
DKK billion
2011 2012 2013 2014 20150
25
50
75
100
125
SALES BY GEOGRAPHIC REGION Japan & Korea Region China International Operations Europe North America
DKK billion
2011 2012 2013 2014 20150
20
40
60
80
100
DKK billion
DIABETES AND OBESITY CARE SALES Other diabetes and obesity care Victoza®
New-generation insulin Modern insulins (insulin analogues) Human insulins
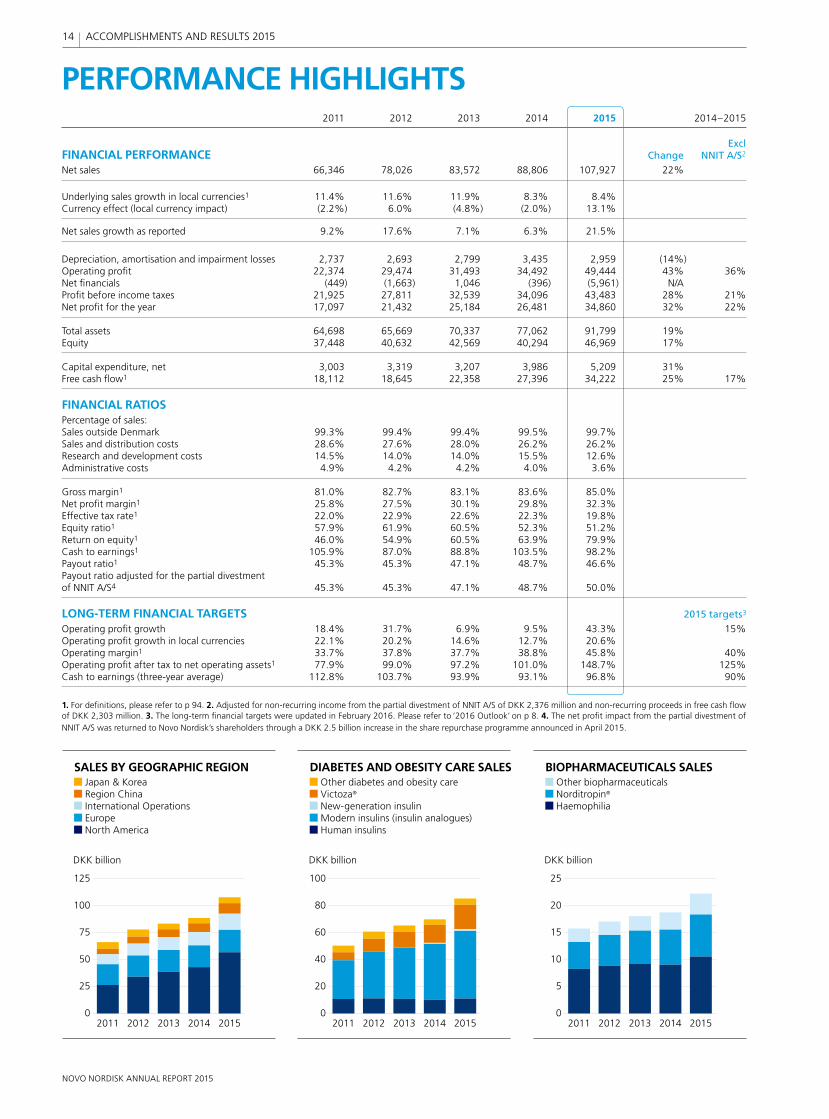
2011 2012 2013 2014 2015 2014–2015
ExclFINANCIAL PERFORMANCE Change NNIT A/S2
Net sales 66,346 78,026 83,572 88,806 107,927 22%
Underlying sales growth in local currencies1 11.4% 11.6% 11.9% 8.3% 8.4% Currency effect (local currency impact) (2.2%) 6.0% (4.8%) (2.0%) 13.1%
Net sales growth as reported 9.2% 17.6% 7.1% 6.3% 21.5%
Depreciation, amortisation and impairment losses 2,737 2,693 2,799 3,435 2,959 (14%) Operating profi t 22,374 29,474 31,493 34,492 49,444 43% 36%Net fi nancials (449) (1,663) 1,046 (396) (5,961) N/A Profi t before income taxes 21,925 27,811 32,539 34,096 43,483 28% 21%Net profi t for the year 17,097 21,432 25,184 26,481 34,860 32% 22%
Total assets 64,698 65,669 70,337 77,062 91,799 19% Equity 37,448 40,632 42,569 40,294 46,969 17%
Capital expenditure, net 3,003 3,319 3,207 3,986 5,209 31% Free cash fl ow1 18,112 18,645 22,358 27,396 34,222 25% 17%
FINANCIAL RATIOSPercentage of sales:Sales outside Denmark 99.3% 99.4% 99.4% 99.5% 99.7% Sales and distribution costs 28.6% 27.6% 28.0% 26.2% 26.2% Research and development costs 14.5% 14.0% 14.0% 15.5% 12.6% Administrative costs 4.9% 4.2% 4.2% 4.0% 3.6%
Gross margin1 81.0% 82.7% 83.1% 83.6% 85.0% Net profi t margin1 25.8% 27.5% 30.1% 29.8% 32.3% Effective tax rate1 22.0% 22.9% 22.6% 22.3% 19.8% Equity ratio1 57.9% 61.9% 60.5% 52.3% 51.2% Return on equity1 46.0% 54.9% 60.5% 63.9% 79.9% Cash to earnings1 105.9% 87.0% 88.8% 103.5% 98.2% Payout ratio1 45.3% 45.3% 47.1% 48.7% 46.6% Payout ratio adjusted for the partial divestment of NNIT A/S4 45.3% 45.3% 47.1% 48.7% 50.0%
LONG-TERM FINANCIAL TARGETS 2015 targets3
Operating profi t growth 18.4% 31.7% 6.9% 9.5% 43.3% 15%Operating profi t growth in local currencies 22.1% 20.2% 14.6% 12.7% 20.6% Operating margin1 33.7% 37.8% 37.7% 38.8% 45.8% 40%Operating profi t after tax to net operating assets1 77.9% 99.0% 97.2% 101.0% 148.7% 125%Cash to earnings (three-year average) 112.8% 103.7% 93.9% 93.1% 96.8% 90%
1. For defi nitions, please refer to p 94. 2. Adjusted for non-recurring income from the partial divestment of NNIT A/S of DKK 2,376 million and non-recurring proceeds in free cash fl ow of DKK 2,303 million. 3. The long-term fi nancial targets were updated in February 2016. Please refer to ‘2016 Outlook’ on p 8. 4. The net profi t impact from the partial divestment of NNIT A/S was returned to Novo Nordisk’s shareholders through a DKK 2.5 billion increase in the share repurchase programme announced in April 2015.
2011 2012 2013 2014 20150
5
10
15
20
25
BIOPHARMACEUTICALS SALES Other biopharmaceuticals Norditropin®
Haemophilia
DKK billion
2011 2012 2013 2014 20150
25
50
75
100
125
SALES BY GEOGRAPHIC REGION Japan & Korea Region China International Operations Europe North America
DKK billion
2011 2012 2013 2014 20150
20
40
60
80
100
DKK billion
DIABETES AND OBESITY CARE SALES Other diabetes and obesity care Victoza®
New-generation insulin Modern insulins (insulin analogues) Human insulins
14
NOVO NORDISK ANNUAL REPORT 2015
ACCOMPLISHMENTS AND RESULTS 2015
NOVO NORDISK ANNUAL REPORT 2015
15 ACCOMPLISHMENTS AND RESULTS 2015
2011 2012 2013 2014 20150
10
20
30
40
50
EMPLOYEES (TOTAL) Japan & Korea Region China International Operations Europe North America
Thousand
2011 2012 2013 2014 20150
80
160
240
320
400
SALES AND CO2 EMISSIONS (2004 = INDEX 100) • Index sales in DKK • Index CO2 emissions
Index
2011 2012 2013 2014 20150
10
20
30
40
50
NET CASH DISTRIBUTION TO SHAREHOLDERS
Dividends Share repurchases
DKK billion
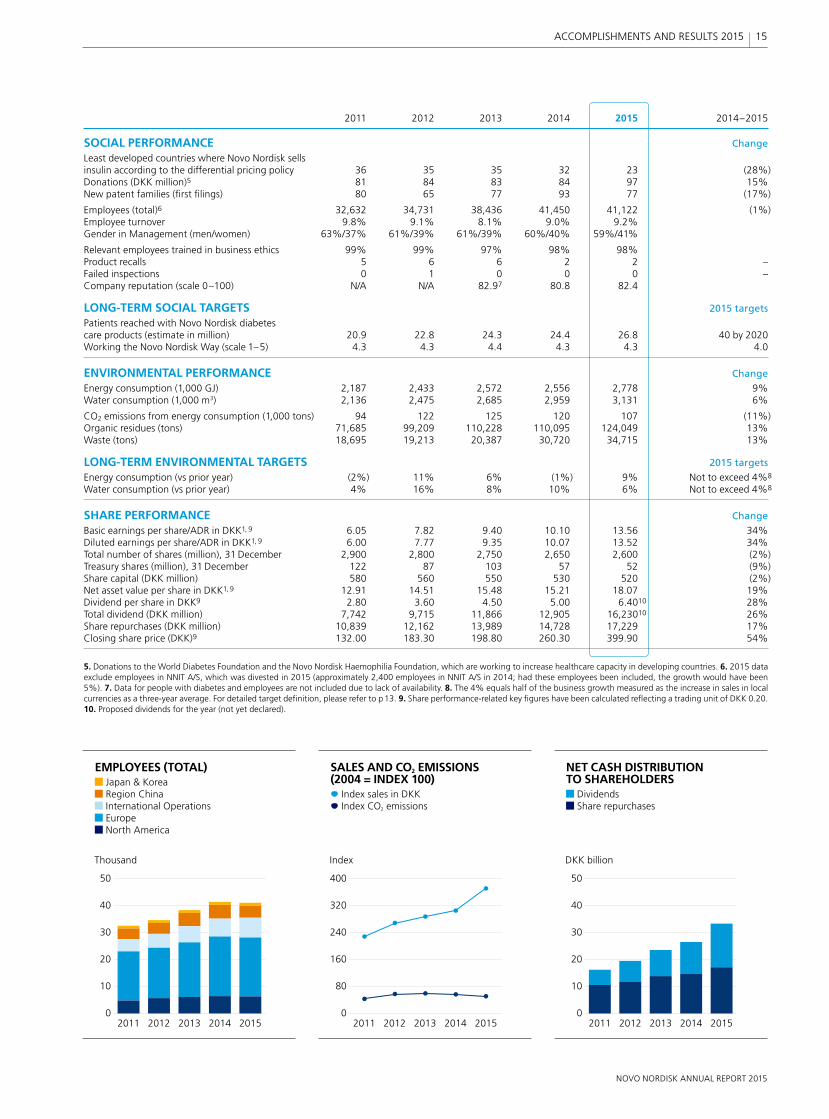
2011 2012 2013 2014 2015 2014–2015
SOCIAL PERFORMANCE Change
Least developed countries where Novo Nordisk sells insulin according to the differential pricing policy 36 35 35 32 23 (28%)Donations (DKK million)5 81 84 83 84 97 15%New patent families (fi rst fi lings) 80 65 77 93 77 (17%)
Employees (total)6 32,632 34,731 38,436 41,450 41,122 (1%)Employee turnover 9.8% 9.1% 8.1% 9.0% 9.2% Gender in Management (men/women) 63%/37% 61%/39% 61%/39% 60%/40% 59%/41%
Relevant employees trained in business ethics 99% 99% 97% 98% 98% Product recalls 5 6 6 2 2 –Failed inspections 0 1 0 0 0 –Company reputation (scale 0–100) N/A N/A 82.97 80.8 82.4
LONG-TERM SOCIAL TARGETS 2015 targets
Patients reached with Novo Nordisk diabetes care products (estimate in million) 20.9 22.8 24.3 24.4 26.8 40 by 2020Working the Novo Nordisk Way (scale 1–5) 4.3 4.3 4.4 4.3 4.3 4.0
ENVIRONMENTAL PERFORMANCE Change
Energy consumption (1,000 GJ) 2,187 2,433 2,572 2,556 2,778 9%Water consumption (1,000 m3) 2,136 2,475 2,685 2,959 3,131 6%
CO2 emissions from energy consumption (1,000 tons) 94 122 125 120 107 (11%)Organic residues (tons) 71,685 99,209 110,228 110,095 124,049 13%Waste (tons) 18,695 19,213 20,387 30,720 34,715 13%
LONG-TERM ENVIRONMENTAL TARGETS 2015 targets
Energy consumption (vs prior year) (2%) 11% 6% (1%) 9% Not to exceed 4%8
Water consumption (vs prior year) 4% 16% 8% 10% 6% Not to exceed 4%8
SHARE PERFORMANCE Change
Basic earnings per share/ADR in DKK1, 9 6.05 7.82 9.40 10.10 13.56 34%Diluted earnings per share/ADR in DKK1, 9 6.00 7.77 9.35 10.07 13.52 34%Total number of shares (million), 31 December 2,900 2,800 2,750 2,650 2,600 (2%)Treasury shares (million), 31 December 122 87 103 57 52 (9%)Share capital (DKK million) 580 560 550 530 520 (2%)Net asset value per share in DKK1, 9 12.91 14.51 15.48 15.21 18.07 19%Dividend per share in DKK9 2.80 3.60 4.50 5.00 6.4010 28%Total dividend (DKK million) 7,742 9,715 11,866 12,905 16,23010 26%Share repurchases (DKK million) 10,839 12,162 13,989 14,728 17,229 17%Closing share price (DKK)9 132.00 183.30 198.80 260.30 399.90 54%
5. Donations to the World Diabetes Foundation and the Novo Nordisk Haemophilia Foundation, which are working to increase healthcare capacity in developing countries. 6. 2015 data exclude employees in NNIT A/S, which was divested in 2015 (approximately 2,400 employees in NNIT A/S in 2014; had these employees been included, the growth would have been 5%). 7. Data for people with diabetes and employees are not included due to lack of availability. 8. The 4% equals half of the business growth measured as the increase in sales in local currencies as a three-year average. For detailed target defi nition, please refer to p 13. 9. Share performance-related key fi gures have been calculated refl ecting a trading unit of DKK 0.20. 10. Proposed dividends for the year (not yet declared).
2011 2012 2013 2014 20150
10
20
30
40
50
EMPLOYEES (TOTAL) Japan & Korea Region China International Operations Europe North America
Thousand
2011 2012 2013 2014 20150
80
160
240
320
400
SALES AND CO2 EMISSIONS (2004 = INDEX 100) • Index sales in DKK • Index CO2 emissions
Index
2011 2012 2013 2014 20150
10
20
30
40
50
NET CASH DISTRIBUTION TO SHAREHOLDERS Dividends Share repurchases
DKK billion
15
NOVO NORDISK ANNUAL REPORT 2015
ACCOMPLISHMENTS AND RESULTS 2015
up over the years and continues to leverage in all four therapeutic areas. The final ingre-dient of the strategy is the values-based management system, the Novo Nordisk Way. All of which serves the pur pose of driving change to defeat diabetes and other serious chronic conditions. Read more about the Novo Nordisk Way on p 18.
Since it was founded in Denmark more than 90 years ago, Novo Nordisk has been changing diabetes. This heritage has given the company experience and capabilities that also enable it to help people defeat other serious chronic conditions: haemophilia, growth disorders and obesity. Today, Novo Nordisk is a leading company within diabetes, haemophilia and
growth disorders, and is well on its way to building a presence within obesity.
This sharp focus on a few selected thera-peutic areas is a key part of Novo Nordisk’s corporate strategy. Another is the strong focus on the constant development of five core capabilities that Novo Nordisk has built
1. EXPAND LEADERSHIP IN DIABETES
According to the International Diabetes Fed-eration, 415 million people worldwide are living with diabetes, and it is predicted that by 2040 more than 10% of the world’s adult population – 642 million people worldwide – will have diabetes.1
The global market for diabetes care products amounts to 353 billion Danish kroner, of which Novo Nordisk products account for approximately 27%. The mar ket has grown by around 10% annually in the last decade, and all indications are that it will continue to
grow as a result of the increasing number of people with diabetes and the need for better treatments. Of this global market, insulin accounts for 56%, oral diabetes products (tablet-based medi cations) account for 37% and GLP-1 products account for 7%, measured in value.
Diabetes care is by far Novo Nordisk’s largest business area, accounting for 79% of the company’s total sales. In 2007, the company decided to focus all its efforts in diabetes care on protein-based products, such as insulin and GLP-1. As a result, today Novo Nordisk is the leader in both seg-ments, with market shares of 40% and 75% respectively, measured in value.
Novo Nordisk’s ambition is to further expand its leadership within the insulin and GLP-1 segments. Key to achieving this ambition are the new generation of insulin products, Tresiba®, Xultophy® and Ryzodeg®, and the once-daily GLP-1 analogue Victoza®, all of which have been or will be launched in convenient injection devices, such as FlexTouch®. Significant projects in the re-search and development pipeline include a new faster-acting formulation of insulin aspart, a once-weekly injectable GLP-1 ana-logue semaglutide and a once-daily tablet version of semaglutide.
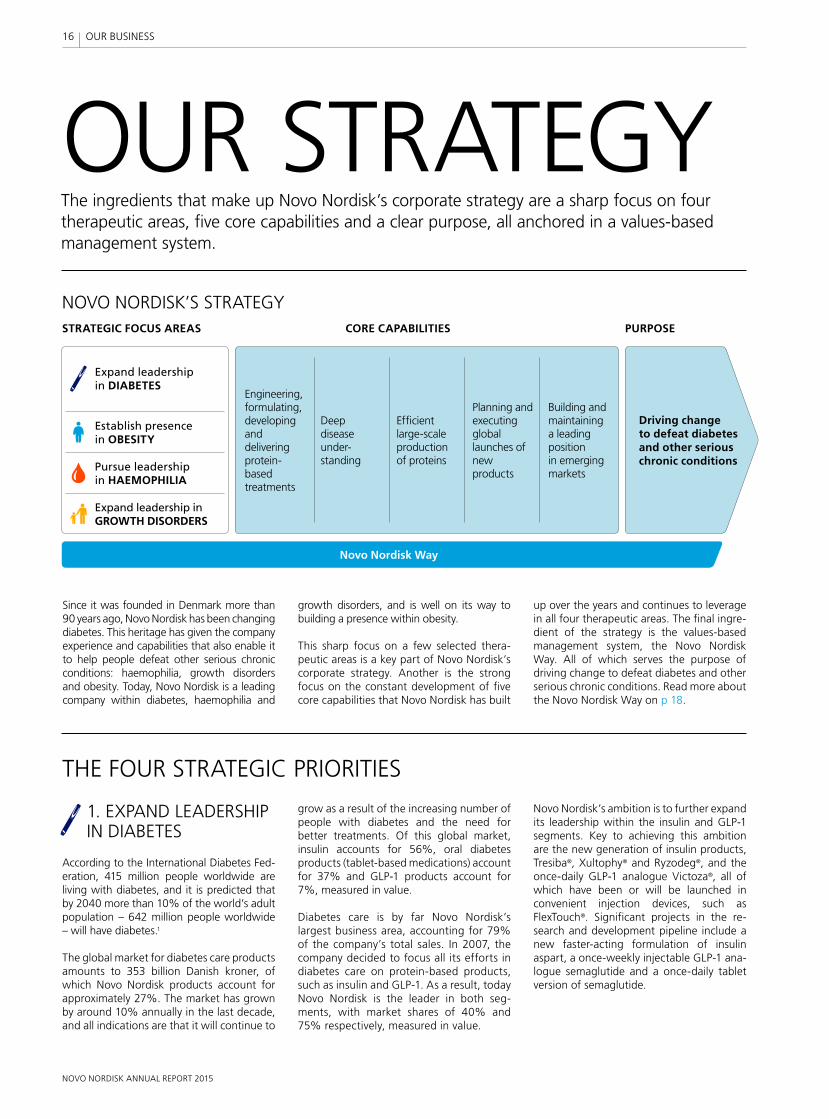
The ingredients that make up Novo Nordisk’s corporate strategy are a sharp focus on four therapeutic areas, five core capabilities and a clear purpose, all anchored in a values-based management system.
OUR STRATEGY
THE FOUR STRATEGIC PRIORITIES
NOVO NORDISK’S STRATEGYSTRATEGIC FOCUS AREAS CORE CAPABILITIES
Novo Nordisk Way
Engineering, formulating, developing and delivering protein-based treatments
Deep disease under-standing
Efficient large-scale production of proteins
Planning and executing global launches of new products
Building and maintaining a leading position in emerging markets
Establish presence in OBESITY
Expand leadership in DIABETES
Pursue leadership in HAEMOPHILIA
Expand leadership in GROWTH DISORDERS
Driving change to defeat diabetes and other serious chronic conditions
PURPOSE
16
NOVO NORDISK ANNUAL REPORT 2015
OUR BUSINESS
Innovative biological medicines such as these are Novo Nordisk’s key contribution to defeating diabetes. However, the company is well aware that its products only do part of the job: it takes more than medicine to change diabetes. That is why Novo Nordisk, with Changing Diabetes®, is engaged in other activities aimed at cre-ating awareness of type 2 diabetes and promoting healthy lifestyles and societal changes that are needed to curb the alarming rise in new cases of the disease. A recent example is Cities Changing Diabetes, a global initiative to tackle diabetes in the world’s big cities. Read more about:
Novo Nordisk’s pipeline of products in development, p 20GLP-1 products, p 26 The challenge of fighting diabetes, p 22Cities Changing Diabetes, p 30.
2. ESTABLISH A PRESENCE IN OBESITY
Obesity is known to be a major risk factor in developing serious diseases such as type 2 diabetes and, as such, is a natural therapeutic area for Novo Nordisk to enter. Obesity has reached pandemic proportions, with more than 600 million adults having clinical obesity (defined as having a Body Mass Index of 30 or above).2 However, currently there are few pharmaceutical treatment options available to treat obesity, and reimbursement for these medications is limited. The global pharmaceutical market for obesity products currently amounts to around 10 billion kroner.
In 2015, Novo Nordisk entered the obesity market with Saxenda® (liraglutide 3 mg), which was launched in the US in April and is now also available in Denmark and Canada. Novo Nordisk’s ambition is to build a long-term presence in the obesity market, and Saxenda® is seen as the first of several steps towards achieving this. Read more about Novo Nordisk’s obesity strategy on p 28.
3. PURSUE LEADERSHIP IN HAEMOPHILIA
Haemophilia is an inherited or acquired bleeding disorder that prevents blood from clotting. An estimated 420,000 people worldwide are living with severe or moderate haemophilia.3 The global haemophilia phar-maceutical market has a value of around 75 billion kroner and has grown by around 5% annually in recent years.5
Novo Nordisk entered the haemophilia market in 1996 with NovoSeven® for the treatment of people with haemophilia who form antibodies against traditional treat ments.
The launch of NovoEight® in 2014 was a significant milestone in the company’s ambition to move from this niche into the main haemophilia A market. In January 2016, Novo Nordisk filed for regulatory approval of long-acting factor IX in the EU for the treatment of haemophilia B. Fur-thermore, the company has a long-acting clotting factor in phase 3 development for haemophilia A. Novo Nordisk’s ambition is to achieve a leadership position within both haemophilia A and haemophilia B.Read more about Novo Nordisk’s activities within haemophilia on p 32.
4. EXPAND LEADERSHIP IN GROWTH DISORDERS
Novo Nordisk has been active in the treatment of growth hormone deficiency for almost four decades. The global market for growth disorder treatments is estimated to be 16 billion kroner. Novo Nordisk’s growth hor-mone, Norditropin®, is the global market leader, with a market share of 35% measured by value. The company’s ambition is to expand its leadership in the growth hormone market. A key project in this respect is Novo Nordisk’s long-acting growth hormone pro d-uct which is in phase 3 development.
FIVE CORE CAPABILITIESNovo Nordisk’s core capabilities have been developed and refined over many years.
ENGINEERING, FORMULATING, DEVELOPING AND DELIVERING PROTEIN-BASED TREATMENTS Novo Nordisk’s researchers are among the world’s best within protein engineering, formulation technology, expression and de-livery, enabling the company to continuously improve the properties of therapeutic proteins such as insulin and GLP-1 and the injection devices needed. Recently, Novo Nordisk has built new capabilities in for-mulating protein-based products into tablets.
DEEP DISEASE UNDERSTANDING Striving for decades to meet the medical needs of people with diabetes has given Novo Nordisk a deep understanding of what it is like to live with this condition. Together with strong relationships and collaborations with external researchers and clinicians, this understanding provides a solid foundation for the company’s research, development and marketing activities.
EFFICIENT LARGE-SCALE PRODUCTION OF PROTEINS A high-quality, cost-effective global manu-facturing infrastructure is a prerequisite for competing successfully in an increasing ly competitive pharmaceutical market. Novo Nordisk is the world’s largest producer of insulin and has been developing its expertise in the production of protein-based pharma-ceuticals since 1923. Read more about new investments in production on p 38.
PLANNING AND EXECUTING GLOBAL LAUNCHES OF NEW PRODUCTSDue to the high and increasing costs associated with developing and launching new medicines, most products are launched globally over a relatively short period to ensure a reasonable time before patent expiration. Through the global launch of Victoza®, Novo Nordisk has refined this capability, which is now being used for the launch of new products, such as Tresiba® and NovoEight®.
BUILDING AND MAINTAINING A LEADING POSITION IN EMERGING MARKETSMany years of experience have helped Novo Nordisk understand the needs of emerging markets as their healthcare systems develop. The company’s strategy has always been to establish a local organisation early and to grow organically as the market develops. This has enabled Novo Nordisk to build a highly skilled sales force, long-term rela-tionships and a sustainable market presence in emerging markets.
ENGINEERING, FORMULATING, DEVELOPING AND DELIVERING PROTEIN-BASED TREATMENTS
1920
1940
1980
1990
2000
2010
Nordisk Insulinlaboratorium (1923) and Novo Terapeutisk Laboratorium (1925) founded.
Nordisk develops isophane insulin (NPH), a neutral insulin with prolonged action.
NovoPen® is launched – an injection system similar in appearance to a fountain pen.Novo starts production of human insulin with the help of genetically engineered yeast cells.
Nordisk markets Norditropin® – genetically engineered human growth hormone.
NovoSeven® is launched – for the treatment of haemophilia patients with inhibitor reaction.
NovoRapid® – the company’s first modern insulin – is marketed.
Victoza® – a human GLP-1 analogue for once-daily treatment of type 2 diabetes – is launched.
Tresiba® – the company’s first new- generation insulin – is launched.
17
NOVO NORDISK ANNUAL REPORT 2015
OUR BUSINESS
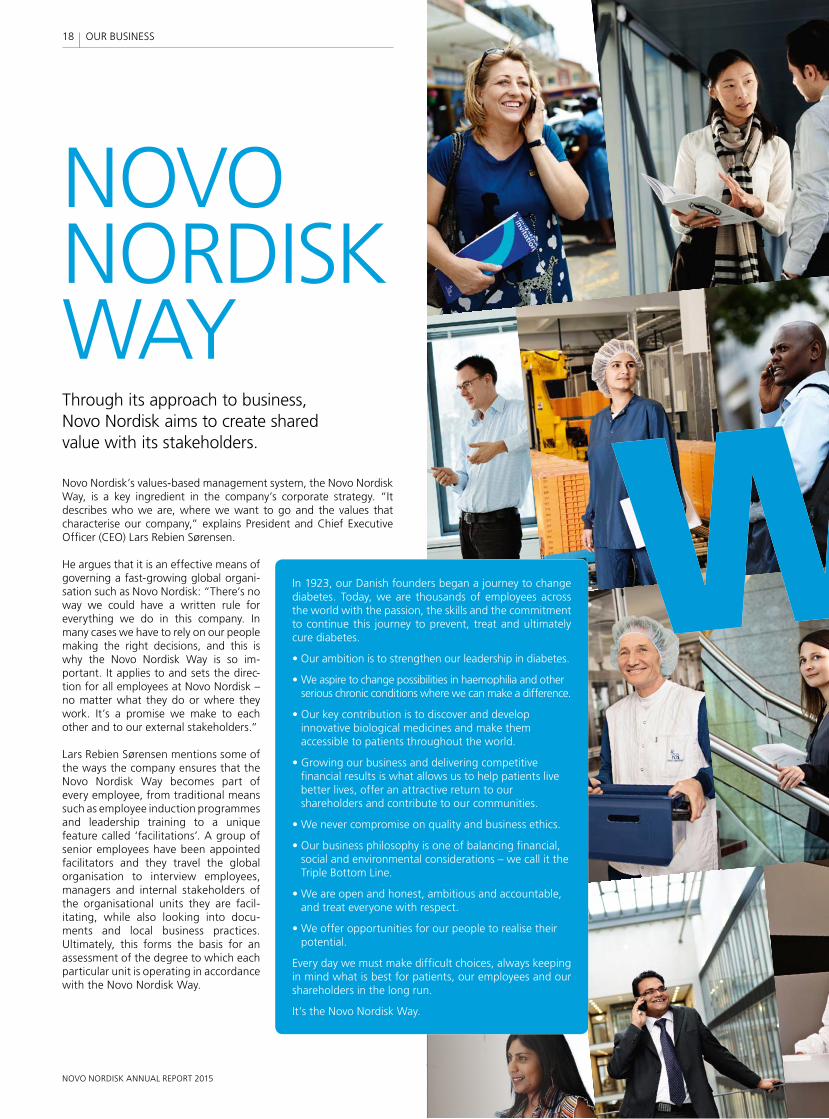
NOVO NORDISK WAYThrough its approach to business, Novo Nordisk aims to create shared value with its stakeholders.
Novo Nordisk’s values-based management system, the Novo Nordisk Way, is a key ingredient in the company’s corporate strategy. “It describes who we are, where we want to go and the values that characterise our company,” explains President and Chief Executive Officer (CEO) Lars Rebien Sørensen.
He argues that it is an effective means of governing a fast-growing global orga n i-sation such as Novo Nordisk: “There’s no way we could have a written rule for everything we do in this company. In many cases we have to rely on our people making the right decisions, and this is why the Novo Nordisk Way is so im-portant. It applies to and sets the direc-tion for all employees at Novo Nordisk – no matter what they do or where they work. It’s a promise we make to each other and to our external stakeholders.”
Lars Rebien Sørensen mentions some of the ways the company ensures that the Novo Nordisk Way becomes part of every employee, from traditional means such as employee induction programmes and leadership training to a unique feature called ‘facilitations’. A group of senior employees have been appointed facilitators and they travel the global organisation to interview employees, managers and internal stakeholders of the organisational units they are faci l-itating, while also looking into docu-ments and local business practices. Ultimately, this forms the basis for an assessment of the degree to which each particular unit is operating in accordance with the Novo Nordisk Way.
In 1923, our Danish founders began a journey to change diabetes. Today, we are thousands of employees across the world with the passion, the skills and the commitment to continue this journey to prevent, treat and ultimately cure diabetes.
• Our ambition is to strengthen our leadership in diabetes.
• We aspire to change possibilities in haemophilia and other serious chronic conditions where we can make a difference.
• Our key contribution is to discover and develop innovative biological medicines and make them accessible to patients throughout the world.
• Growing our business and delivering competitive financial results is what allows us to help patients live better lives, offer an attractive return to our shareholders and contribute to our communities.
• We never compromise on quality and business ethics.
• Our business philosophy is one of balancing financial, social and environmental considerations – we call it the Triple Bottom Line.
• We are open and honest, ambitious and accountable, and treat everyone with respect.
• We offer opportunities for our people to realise their potential.
Every day we must make difficult choices, always keeping in mind what is best for patients, our employees and our shareholders in the long run.
It’s the Novo Nordisk Way.
18
NOVO NORDISK ANNUAL REPORT 2015
OUR BUSINESS
Association at the Annual General Meeting in 2004. It states that Novo Nordisk ”strives to conduct its activities in a financially, environmentally and socially responsible way”.
The Triple Bottom Line business principle frames Novo Nordisk’s long-term strategy to be a sustainable business. It obliges everyone in the company to always consider how decisions and actions may affect people, communities and the environment. The aim is to ensure long-term profit - a bility by reducing risks related to business activities and to enhance the positive contributions to society from Novo Nordisk’s global operations.
Lars Rebien Sørensen underlines that the Triple Bottom Line principle is about maximising the value of the company in the long term. “Because,” as he said in a recent interview with Harvard Business Review, “in the long term, social and environmental issues become financial issues. There’s really no hocus pocus about this. And Novo Nordisk is part-owned by a Danish foundation that obliges us to maximise the value of the company for the long term.
“When we convert to renewable energy, we reduce costs. When we provide a safe workplace and chal-lenges for each individual, employees can realise
their potential. When we provide affordable medicines in the world’s poorest countries, we strengthen our business and repu tation. And when we contribute to our communities, we earn stakeholder trust,” he adds.
CREATING SHARED VALUELars Rebien Sørensen is a firm believer that Novo Nordisk’s long-term success depends on its ability to create both economic and societal development: “If we’re not seen as creating value for the local communities in which we have a presence and the countries in which we do business, we will not be successful in the long run.”
Contributions to communities are often measured in economic terms, such as job creation and tax payments. Novo Nordisk pays taxes in all jurisdictions where the company is present. It has a policy to ‘pursue a competitive tax level in a responsible way’, reflecting a continued focus on value creation without compromising business ethics. To manage uncertainties regarding tax payments, multi-year agreements, known as Advance Pricing Agreements, are negotiated in key jurisdictions and fully disclosed to tax authorities.
But there are more ways to generate value beyond commercial transactions. Often referred to as creating shared value, companies can earn returns in a sustainable way by developing solutions for the benefit of society. One example is in Kalundborg, Denmark, where Novo Nordisk’s largest production site is located. Here, the company works with local stakeholders to promote sustainable development in the municipality. Its aim is to ensure that Kalundborg will develop into an even more attractive place to live and work, and a place where businesses will flourish.
Novo Nordisk’s initiatives at country level aim to create value for society on a larger scale, for example by building capabilities in the healthcare system and improving access to healthcare. When successful, this strengthens the company’s stakeholder relations, reputation and ultimately its chances of business success in that country.
An example of this philosophy in action can be seen in Algeria, one of Novo Nordisk’s fastest-growing markets, where the com-pany has had a successful partnership with the Ministry of Health for many years. Outcomes from this partnership include a Changing Diabetes® mobile clinic, which improves the competences of local healthcare professionals, and access to diabetes screening and care for underserved populations, and the Algerian Changing Diabetes® Barometer, which measures progress in the fight against diabetes.
DRIVING CHANGE ON A GLOBAL SCALENovo Nordisk proactively engages in dialogue on sustainable development with relevant partners worldwide. Since the Rio+20 Conference in 2012, the company has participated in the process leading up to the approval of the United Nations Sustainable Development Goals (SDGs), or, as they are often referred to, the Global Goals for Sustainable Development.
“The Global Goals are important for Novo Nordisk, not least because non-communicable diseases including diabetes are explicitly mentioned in the goal to provide ‘health and well-being for all, of all ages’,” says Lars Rebien Sørensen. “The Global Goals give us a platform from which we can engage local, national and international stakeholders in discussions on diabetes and sustainable development, but also on many other topics on our agenda.”
The end product is a report evaluating the unit’s performance against the Novo Nordisk Way and an action plan agreed with local management for how to do even better. Just as the facilitators can identify areas for improvement, they also identify best practices which can be shared throughout the company. Both Executive Management and the Board of Directors regularly receive reports on how well the organisation is living up to the Novo Nordisk Way.
THE TRIPLE BOTTOM LINEA key element of the Novo Nordisk Way is the Triple Bottom Line business principle, which was written into the company’s Articles of
19
NOVO NORDISK ANNUAL REPORT 2015
19OUR BUSINESS
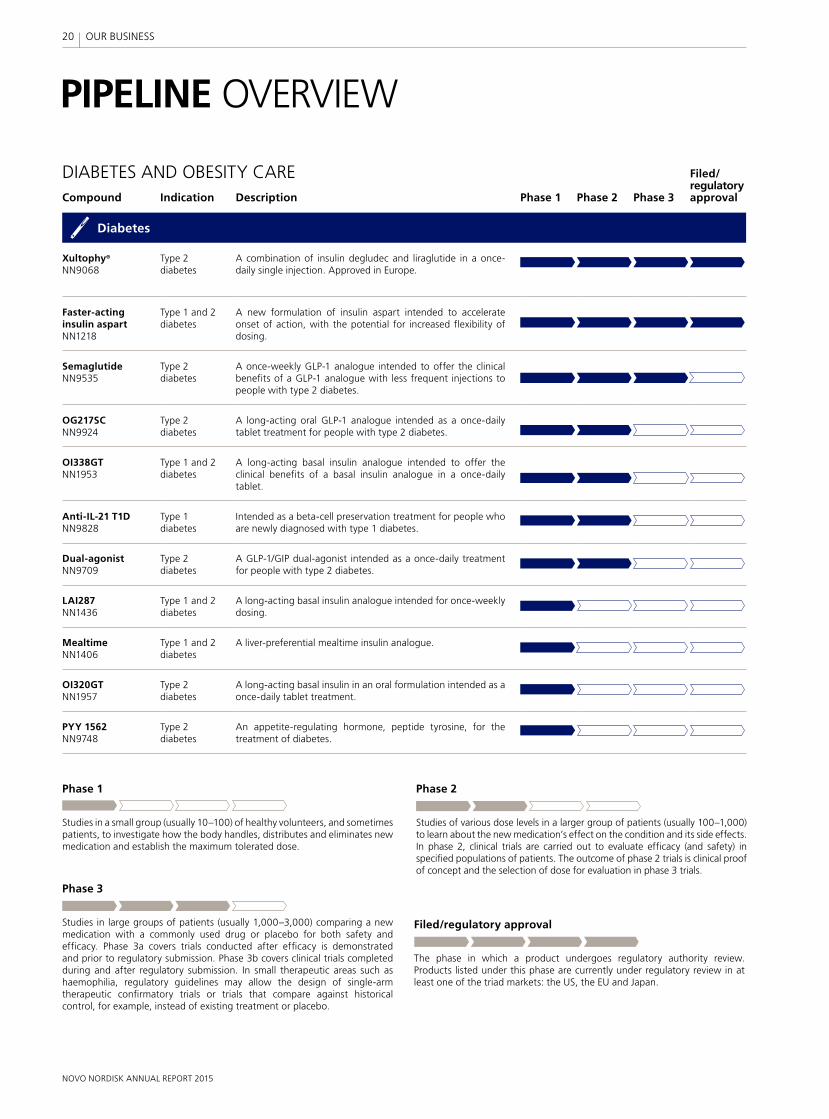
Compound Indication Description Phase 1 Phase 2 Phase 3
Filed/regulatory approval
Diabetes
Xultophy®
NN9068Type 2 diabetes
A combination of insulin degludec and liraglutide in a once- daily single injection. Approved in Europe.
Faster-acting insulin aspartNN1218
Type 1 and 2 diabetes
A new formulation of insulin aspart intended to accelerate onset of action, with the potential for increased flexibility of dosing.
SemaglutideNN9535
Type 2 diabetes
A once-weekly GLP-1 analogue intended to offer the clinical benefits of a GLP-1 analogue with less frequent injections to people with type 2 diabetes.
OG217SCNN9924
Type 2 diabetes
A long-acting oral GLP-1 analogue intended as a once-daily tablet treatment for people with type 2 diabetes.
OI338GTNN1953
Type 1 and 2 diabetes
A long-acting basal insulin analogue intended to offer the clinical benefits of a basal insulin analogue in a once-daily tablet.
Anti-IL-21 T1DNN9828
Type 1 diabetes
Intended as a beta-cell preservation treatment for people who are newly diagnosed with type 1 diabetes.
Dual-agonistNN9709
Type 2 diabetes
A GLP-1/GIP dual-agonist intended as a once-daily treatment for people with type 2 diabetes.
LAI287NN1436
Type 1 and 2 diabetes
A long-acting basal insulin analogue intended for once-weekly dosing.
MealtimeNN1406
Type 1 and 2 diabetes
A liver-preferential mealtime insulin analogue.
OI320GTNN1957
Type 2 diabetes
A long-acting basal insulin in an oral formulation intended as a once-daily tablet treatment.
PYY 1562NN9748
Type 2 diabetes
An appetite-regulating hormone, peptide tyrosine, for the treatment of diabetes.
PIPELINE OVERVIEW
Studies in large groups of patients (usually 1,000–3,000) comparing a new medication with a commonly used drug or placebo for both safety and efficacy. Phase 3a covers trials conducted after efficacy is demonstrated and prior to regulatory submission. Phase 3b covers clinical trials completed during and after regulatory submission. In small therapeutic areas such as haemophilia, regulatory guidelines may allow the design of single-arm therapeutic confirmatory trials or trials that compare against historical control, for example, instead of existing treatment or placebo.
Phase 3
Phase 1
Studies in a small group (usually 10–100) of healthy volunteers, and sometimes patients, to investigate how the body handles, distributes and eliminates new medication and establish the maximum tolerated dose.
Phase 2
Studies of various dose levels in a larger group of patients (usually 100–1,000) to learn about the new medication’s effect on the condition and its side effects. In phase 2, clinical trials are carried out to evaluate efficacy (and safety) in specified populations of patients. The outcome of phase 2 trials is clinical proof of concept and the selection of dose for evaluation in phase 3 trials.
DIABETES AND OBESITY CARE
The phase in which a product undergoes regulatory authority review. Products listed under this phase are currently under regulatory review in at least one of the triad markets: the US, the EU and Japan.
Filed/regulatory approval
20
NOVO NORDISK ANNUAL REPORT 2015
OUR BUSINESS
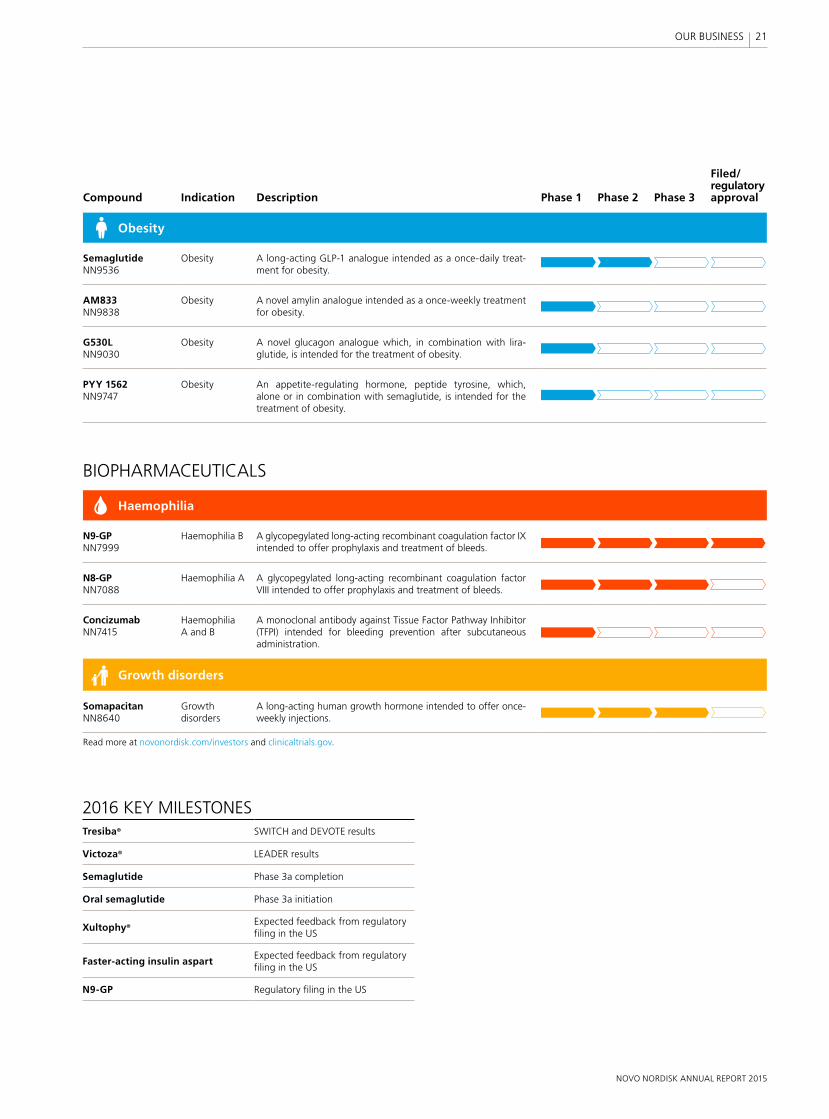
Compound Indication Description Phase 1 Phase 2 Phase 3
Filed/regulatory approval
Obesity
SemaglutideNN9536
Obesity A long-acting GLP-1 analogue intended as a once-daily treat-ment for obesity.
AM833NN9838
Obesity A novel amylin analogue intended as a once-weekly treatment for obesity.
G530LNN9030
Obesity A novel glucagon analogue which, in combination with lira-glutide, is intended for the treatment of obesity.
PYY 1562NN9747
Obesity An appetite-regulating hormone, peptide tyrosine, which, alone or in combination with semaglutide, is intended for the treatment of obesity.
Haemophilia
N9-GPNN7999
Haemophilia B A glycopegylated long-acting recombinant coagulation factor IX intended to offer prophylaxis and treatment of bleeds.
N8-GPNN7088
Haemophilia A A glycopegylated long-acting recombinant coagulation factor VIII intended to offer prophylaxis and treatment of bleeds.
ConcizumabNN7415
Haemophilia A and B
A monoclonal antibody against Tissue Factor Pathway Inhibitor (TFPI) intended for bleeding prevention after subcutaneous administration.
Growth disorders
SomapacitanNN8640
Growth disorders
A long-acting human growth hormone intended to offer once-weekly injections.
BIOPHARMACEUTICALS
2016 KEY MILESTONES Tresiba® SWITCH and DEVOTE results
Victoza® LEADER results
Semaglutide Phase 3a completion
Oral semaglutide Phase 3a initiation
Xultophy®Expected feedback from regulatoryfiling in the US
Faster-acting insulin aspartExpected feedback from regulatoryfiling in the US
N9-GP Regulatory filing in the US
Read more at novonordisk.com/investors and clinicaltrials.gov.
21
NOVO NORDISK ANNUAL REPORT 2015
OUR BUSINESS
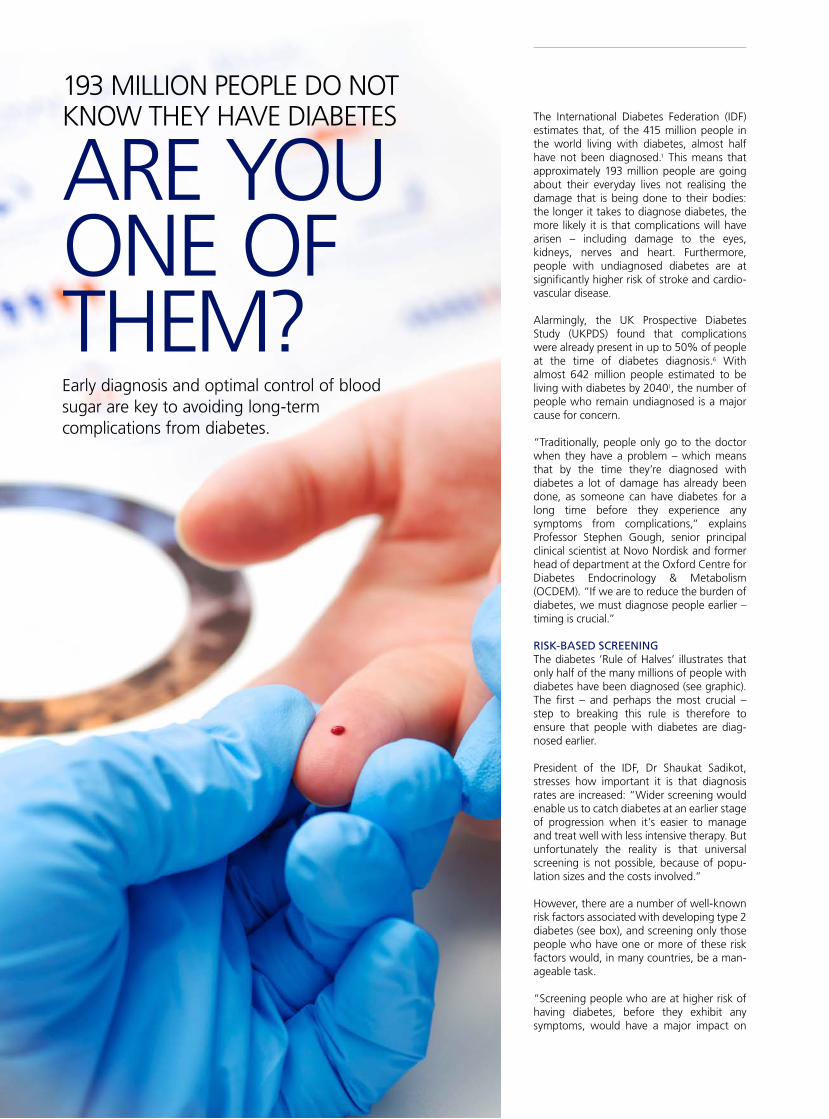
The International Diabetes Federation (IDF) estimates that, of the 415 million people in the world living with diabetes, almost half have not been diagnosed.1 This means that approximately 193 million people are going about their everyday lives not realising the damage that is being done to their bodies: the longer it takes to diagnose diabetes, the more likely it is that complications will have arisen – including damage to the eyes, kidneys, nerves and heart. Furthermore, people with undiagnosed diabetes are at significantly higher risk of stroke and car dio-vascular disease.
Alarmingly, the UK Prospective Diabetes Study (UKPDS) found that complications were already present in up to 50% of people at the time of diabetes diagnosis.6 With almost 642 million people estimated to be living with diabetes by 20401, the number of people who remain undiagnosed is a major cause for concern.
“Traditionally, people only go to the doctor when they have a problem – which means that by the time they’re diagnosed with diabetes a lot of damage has already been done, as someone can have diabetes for a long time before they experience any symptoms from complications,” explains Professor Stephen Gough, senior principal clinical scientist at Novo Nordisk and former head of department at the Oxford Centre for Diabetes Endocrinology & Metabolism (OCDEM). “If we are to reduce the burden of diabetes, we must diagnose people earlier – timing is crucial.”
RISK-BASED SCREENINGThe diabetes ’Rule of Halves’ illustrates that only half of the many millions of people with diabetes have been diagnosed (see graphic). The first – and perhaps the most crucial – step to breaking this rule is therefore to ensure that people with diabetes are diag-nosed earlier.
President of the IDF, Dr Shaukat Sadikot, stresses how important it is that diagnosis rates are increased: “Wider screening would enable us to catch diabetes at an earlier stage of progression when it’s easier to manage and treat well with less intensive therapy. But unfortunately the reality is that universal screening is not possible, because of popu-lation sizes and the costs involved.”
However, there are a number of well-known risk factors associated with developing type 2 diabetes (see box), and screening only those people who have one or more of these risk factors would, in many countries, be a man-ageable task.
“Screening people who are at higher risk of having diabetes, before they exhibit any symptoms, would have a major impact on
Early diagnosis and optimal control of blood sugar are key to avoiding long-term complications from diabetes.
ARE YOU ONE OF THEM?
193 MILLION PEOPLE DO NOT KNOW THEY HAVE DIABETES
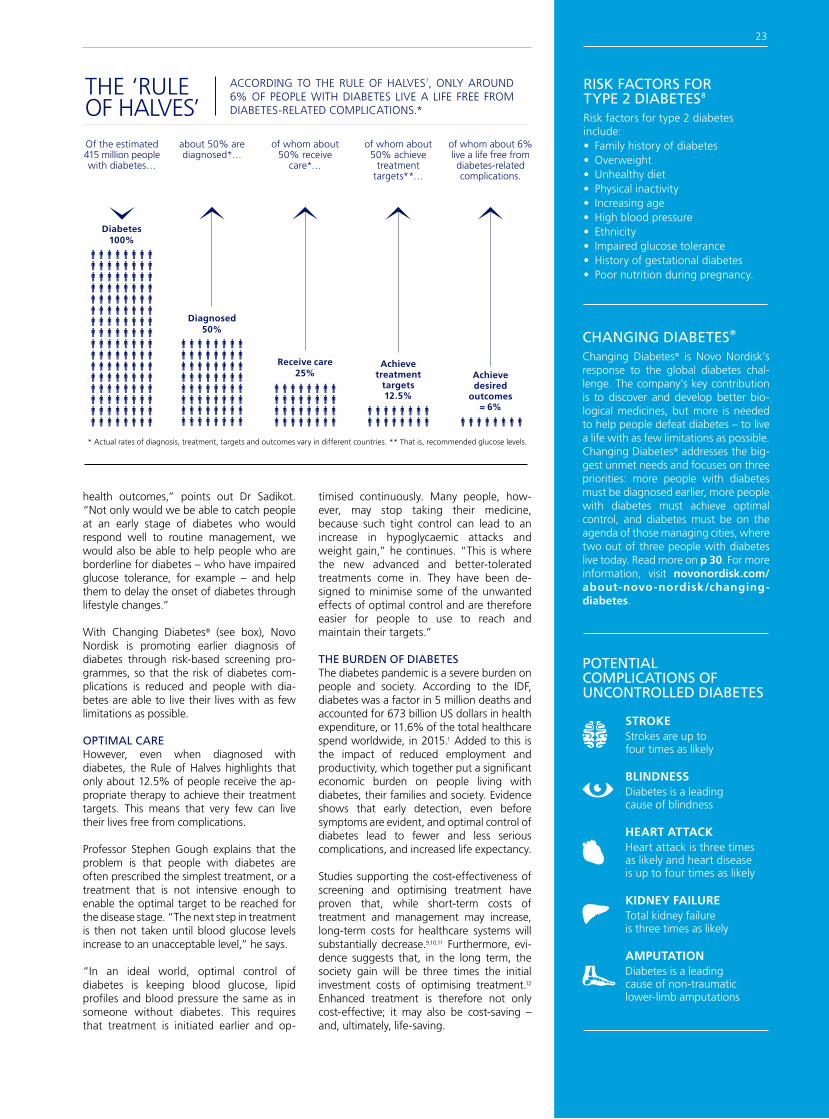
Diabetes100%
Of the estimated 415 million people with diabetes…
Diagnosed50%
about 50% are diagnosed*…
Receive care25%
of whom about 50% receive
care*…
Achieve treatment
targets12.5%
of whom about 50% achieve
treatment targets**…
Achieve desired
outcomes≈ 6%
of whom about 6% live a life free from diabetes-related complications.
* Actual rates of diagnosis, treatment, targets and outcomes vary in different countries. ** That is, recommended glucose levels.
ACCORDING TO THE RULE OF HALVES7, ONLY AROUND 6% OF PEOPLE WITH DIABETES LIVE A LIFE FREE FROM DIABETES-RELATED COMPLICATIONS.*
THE ‘RULE OF HALVES’
health outcomes,” points out Dr Sadikot. “Not only would we be able to catch people at an early stage of diabetes who would respond well to routine management, we would also be able to help people who are borderline for diabetes – who have impaired glucose tolerance, for example – and help them to delay the onset of diabetes through lifestyle changes.”
With Changing Diabetes® (see box), Novo Nordisk is promoting earlier diagnosis of diabetes through risk-based screening pro-grammes, so that the risk of diabetes com-plications is reduced and people with dia-betes are able to live their lives with as few limitations as possible.
OPTIMAL CAREHowever, even when diagnosed with diabetes, the Rule of Halves highlights that only about 12.5% of people receive the ap-propriate therapy to achieve their treatment targets. This means that very few can live their lives free from complications.
Professor Stephen Gough explains that the problem is that people with diabetes are often prescribed the simplest treatment, or a treatment that is not intensive enough to enable the optimal target to be reached for the disease stage. “The next step in treatment is then not taken until blood glucose levels increase to an unacceptable level,” he says.
“In an ideal world, optimal control of diabetes is keeping blood glucose, lipid profiles and blood pressure the same as in someone without diabetes. This requires that treatment is initiated earlier and op-
timised continuously. Many people, how-ever, may stop taking their medicine, because such tight control can lead to an increase in hypoglycaemic attacks and weight gain,” he continues. “This is where the new advanced and better-tolerated treatments come in. They have been de-signed to minimise some of the unwanted effects of optimal control and are therefore easier for people to use to reach and maintain their targets.”
THE BURDEN OF DIABETESThe diabetes pandemic is a severe burden on people and society. According to the IDF, diabetes was a factor in 5 million deaths and accounted for 673 billion US dollars in health expenditure, or 11.6% of the total healthcare spend worldwide, in 2015.1 Added to this is the impact of reduced employment and productivity, which together put a significant economic burden on people living with diabetes, their families and society. Evidence shows that early detection, even before symptoms are evident, and optimal control of diabetes lead to fewer and less serious complications, and increased life expectancy.
Studies supporting the cost-effectiveness of screening and optimising treatment have proven that, while short-term costs of treatment and management may increase, long-term costs for healthcare systems will substantially decrease.9,10,11 Furthermore, evi-dence suggests that, in the long term, the society gain will be three times the initial investment costs of optimising treatment.12 Enhanced treatment is therefore not only cost-effective; it may also be cost-saving – and, ultimately, life-saving.
Heart attack is three times as likely and heart disease is up to four times as likely
HEART ATTACK
Total kidney failure is three times as likely
KIDNEY FAILURE
Diabetes is a leading cause of non-traumatic lower-limb amputations
AMPUTATION
Diabetes is a leading cause of blindness
BLINDNESS
Strokes are up to four times as likely
STROKE
POTENTIAL COMPLICATIONS OF UNCONTROLLED DIABETES
CHANGING DIABETES®
Changing Diabetes® is Novo Nordisk’s response to the global diabetes chal-lenge. The company’s key contribution is to discover and develop better bio-logical medicines, but more is needed to help people defeat diabetes – to live a life with as few limitations as possible. Changing Diabetes® addresses the big-gest unmet needs and focuses on three priorities: more people with diabetes must be diagnosed earlier, more people with diabetes must achieve optimal control, and diabetes must be on the agenda of those managing cities, where two out of three people with diabetes live today. Read more on p 30. For more information, visit novonordisk.com/about-novo-nordisk/changing-diabetes.
RISK FACTORS FOR TYPE 2 DIABETES8
Risk factors for type 2 diabetes include:• Family history of diabetes• Overweight• Unhealthy diet• Physical inactivity• Increasing age• High blood pressure• Ethnicity• Impaired glucose tolerance• History of gestational diabetes• Poor nutrition during pregnancy.
23

FUTURE DIABETES MEDICINESWHAT’S NEXT FROM NOVO NORDISK’S LABS?
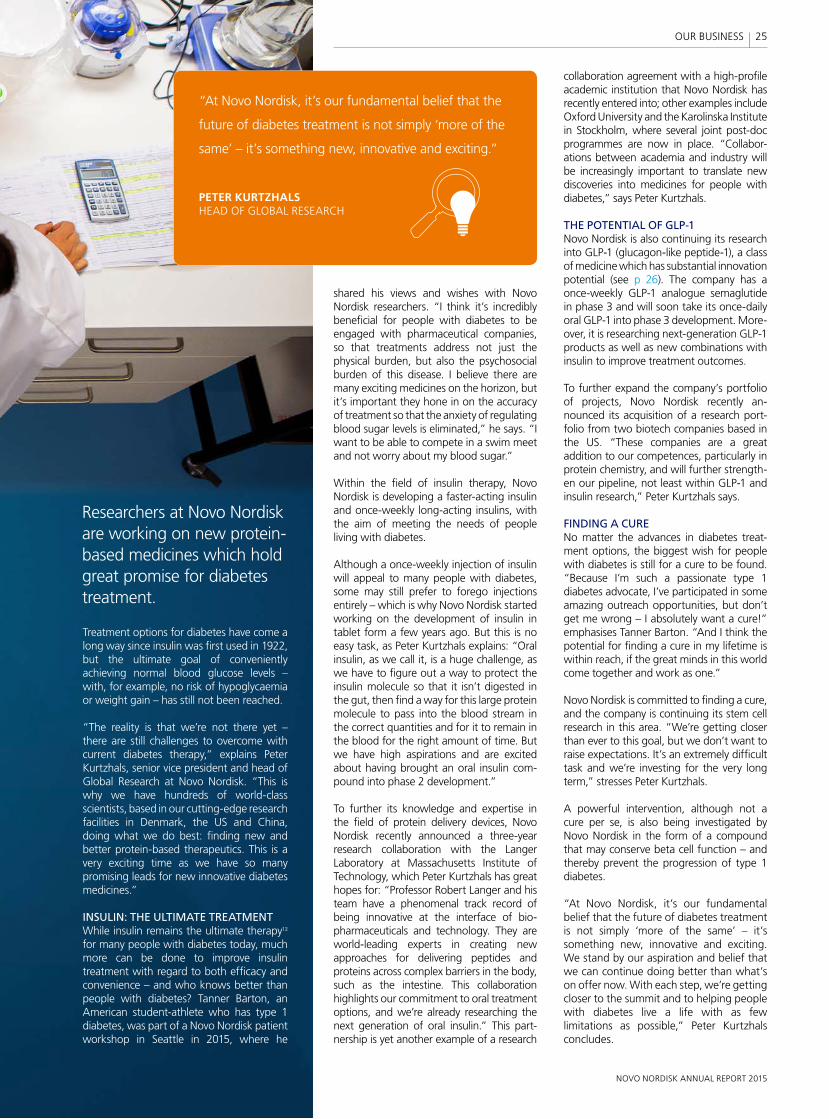
Treatment options for diabetes have come a long way since insulin was first used in 1922, but the ultimate goal of conveniently achieving normal blood glucose levels – with, for example, no risk of hypoglycaemia or weight gain – has still not been reached.
“The reality is that we’re not there yet – there are still challenges to overcome with current diabetes therapy,” explains Peter Kurtzhals, senior vice president and head of Global Research at Novo Nordisk. “This is why we have hundreds of world-class scientists, based in our cutting-edge research facilities in Denmark, the US and China, doing what we do best: finding new and better protein-based therapeutics. This is a very exciting time as we have so many promising leads for new innovative diabetes medicines.”
INSULIN: THE ULTIMATE TREATMENTWhile insulin remains the ultimate therapy13 for many people with diabetes today, much more can be done to improve insulin treatment with regard to both efficacy and convenience – and who knows better than people with diabetes? Tanner Barton, an American student-athlete who has type 1 diabetes, was part of a Novo Nordisk patient workshop in Seattle in 2015, where he
shared his views and wishes with Novo Nordisk researchers. “I think it’s incredibly beneficial for people with diabetes to be engaged with pharmaceutical companies, so that treatments address not just the physical burden, but also the psychosocial burden of this disease. I believe there are many exciting medicines on the horizon, but it’s important they hone in on the accuracy of treatment so that the anxiety of regulating blood sugar levels is eliminated,” he says. “I want to be able to compete in a swim meet and not worry about my blood sugar.”
Within the field of insulin therapy, Novo Nordisk is developing a faster-acting insulin and once-weekly long-acting insulins, with the aim of meeting the needs of people living with diabetes.
Although a once-weekly injection of insulin will appeal to many people with diabetes, some may still prefer to forego injections entirely – which is why Novo Nordisk started working on the development of insulin in tablet form a few years ago. But this is no easy task, as Peter Kurtzhals explains: “Oral insulin, as we call it, is a huge challenge, as we have to figure out a way to protect the insulin molecule so that it isn’t digested in the gut, then find a way for this large protein molecule to pass into the blood stream in the correct quantities and for it to remain in the blood for the right amount of time. But we have high aspirations and are excited about having brought an oral insulin com-pound into phase 2 development.”
To further its knowledge and expertise in the field of protein delivery devices, Novo Nordisk recently announced a three-year research collaboration with the Langer Laboratory at Massachusetts Institute of Technology, which Peter Kurtzhals has great hopes for: “Professor Robert Langer and his team have a phenomenal track record of being innovative at the interface of bio-pharmaceuticals and technology. They are world-leading experts in creating new approaches for delivering peptides and proteins across complex barriers in the body, such as the intestine. This collaboration highlights our commitment to oral treatment options, and we’re already researching the next generation of oral insulin.” This part-nership is yet another example of a research
collaboration agreement with a high-profile academic institution that Novo Nordisk has recently entered into; other examples include Oxford University and the Karolinska Institute in Stockholm, where several joint post-doc programmes are now in place. “Colla bor-ations between academia and industry will be increasingly important to translate new discoveries into medicines for people with diabetes,” says Peter Kurtzhals.
THE POTENTIAL OF GLP-1Novo Nordisk is also continuing its research into GLP-1 (glucagon-like peptide-1), a class of medicine which has substantial innovation potential (see p 26). The company has a once-weekly GLP-1 analogue semaglutide in phase 3 and will soon take its once-daily oral GLP-1 into phase 3 development. More-over, it is researching next-generation GLP-1 products as well as new combinations with insulin to improve treatment outcomes.
To further expand the company’s portfolio of projects, Novo Nordisk recently an-nounced its acquisition of a research port-folio from two biotech companies based in the US. “These companies are a great addition to our competences, particu larly in protein chemistry, and will further strength-en our pipeline, not least within GLP-1 and insulin research,” Peter Kurtzhals says.
FINDING A CURENo matter the advances in diabetes treat-ment options, the biggest wish for people with diabetes is still for a cure to be found. “Because I’m such a passionate type 1 diabetes advocate, I’ve participated in some amazing outreach opportunities, but don’t get me wrong – I absolutely want a cure!” emphasises Tanner Barton. “And I think the potential for finding a cure in my lifetime is within reach, if the great minds in this world come together and work as one.”
Novo Nordisk is committed to finding a cure, and the company is continuing its stem cell research in this area. “We’re getting closer than ever to this goal, but we don’t want to raise expectations. It’s an extremely difficult task and we’re investing for the very long term,” stresses Peter Kurtzhals.
A powerful intervention, although not a cure per se, is also being investigated by Novo Nordisk in the form of a compound that may conserve beta cell function – and thereby prevent the progression of type 1 diabetes.
“At Novo Nordisk, it’s our fundamental belief that the future of diabetes treatment is not simply ‘more of the same’ – it’s something new, innovative and exciting. We stand by our aspiration and belief that we can continue doing better than what’s on offer now. With each step, we’re getting closer to the summit and to helping people with diabetes live a life with as few limitations as possible,” Peter Kurtzhals concludes.
Researchers at Novo Nordisk are working on new protein-based medicines which hold great promise for diabetes treatment.
“At Novo Nordisk, it’s our fundamental belief that the
future of diabetes treatment is not simply ‘more of the
same’ – it’s something new, innovative and exciting.”
PETER KURTZHALSHEAD OF GLOBAL RESEARCH
25
NOVO NORDISK ANNUAL REPORT 2015
OUR BUSINESS
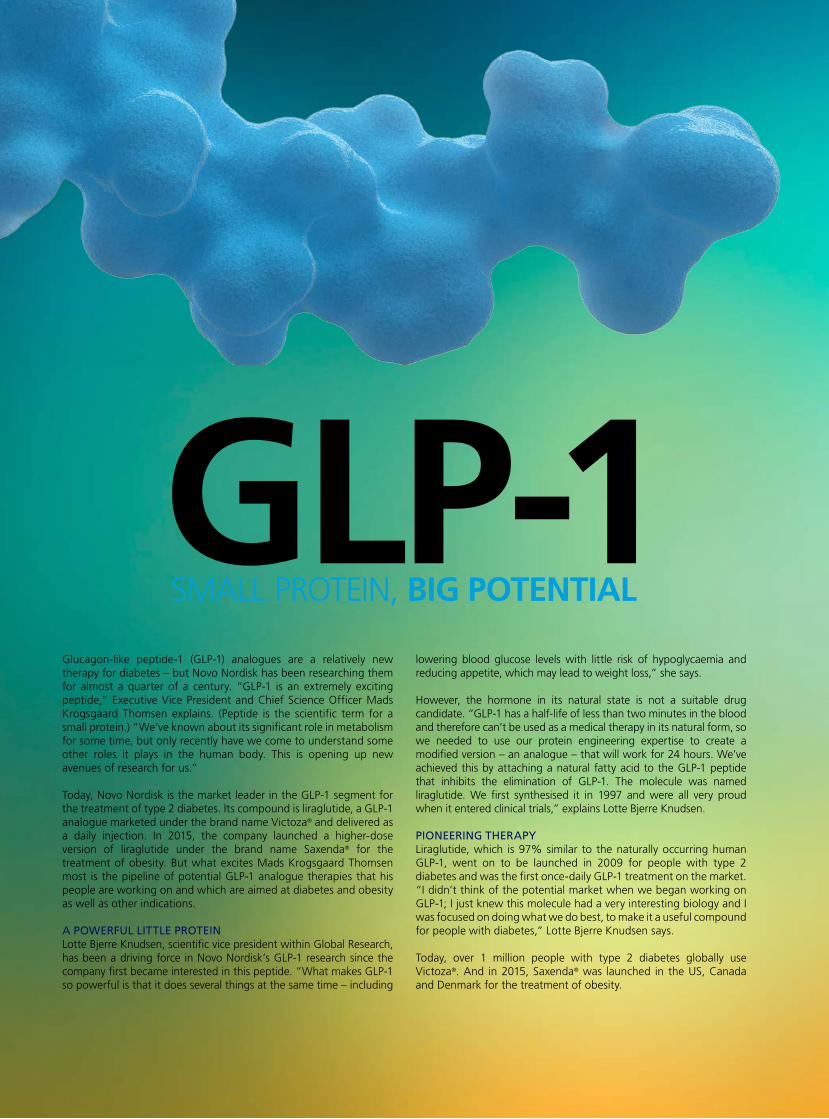
SMALL PROTEIN, BIG POTENTIALGLP-1
Glucagon-like peptide-1 (GLP-1) analogues are a relatively new therapy for diabetes – but Novo Nordisk has been researching them for almost a quarter of a century. “GLP-1 is an extremely exciting peptide,” Executive Vice President and Chief Science Officer Mads Krogsgaard Thomsen explains. (Peptide is the scientific term for a small protein.) “We’ve known about its significant role in metabolism for some time, but only recently have we come to understand some other roles it plays in the human body. This is opening up new avenues of research for us.”
Today, Novo Nordisk is the market leader in the GLP-1 segment for the treatment of type 2 diabetes. Its compound is liraglutide, a GLP-1 analogue marketed under the brand name Victoza® and delivered as a daily injection. In 2015, the company launched a higher-dose version of liraglutide under the brand name Saxenda® for the treatment of obesity. But what excites Mads Krogsgaard Thomsen most is the pipeline of potential GLP-1 analogue therapies that his people are working on and which are aimed at diabetes and obesity as well as other indications.
A POWERFUL LITTLE PROTEINLotte Bjerre Knudsen, scientific vice president within Global Research, has been a driving force in Novo Nordisk’s GLP-1 research since the company first became interested in this peptide. “What makes GLP-1 so powerful is that it does several things at the same time – including
lowering blood glucose levels with little risk of hypoglycaemia and reducing appetite, which may lead to weight loss,” she says.
However, the hormone in its natural state is not a suitable drug candidate. “GLP-1 has a half-life of less than two minutes in the blood and therefore can’t be used as a medical therapy in its natural form, so we needed to use our protein engineering expertise to create a modified version – an analogue – that will work for 24 hours. We’ve achieved this by attaching a natural fatty acid to the GLP-1 peptide that inhibits the elimination of GLP-1. The molecule was named liraglutide. We first synthesised it in 1997 and were all very proud when it entered clinical trials,” explains Lotte Bjerre Knudsen.
PIONEERING THERAPYLiraglutide, which is 97% similar to the naturally occurring human GLP-1, went on to be launched in 2009 for people with type 2 diabetes and was the first once-daily GLP-1 treatment on the market. “I didn’t think of the potential market when we began working on GLP-1; I just knew this molecule had a very interesting biology and I was focused on doing what we do best, to make it a useful compound for people with diabetes,” Lotte Bjerre Knudsen says.
Today, over 1 million people with type 2 diabetes globally use Victoza®. And in 2015, Saxenda® was launched in the US, Canada and Denmark for the treatment of obesity.
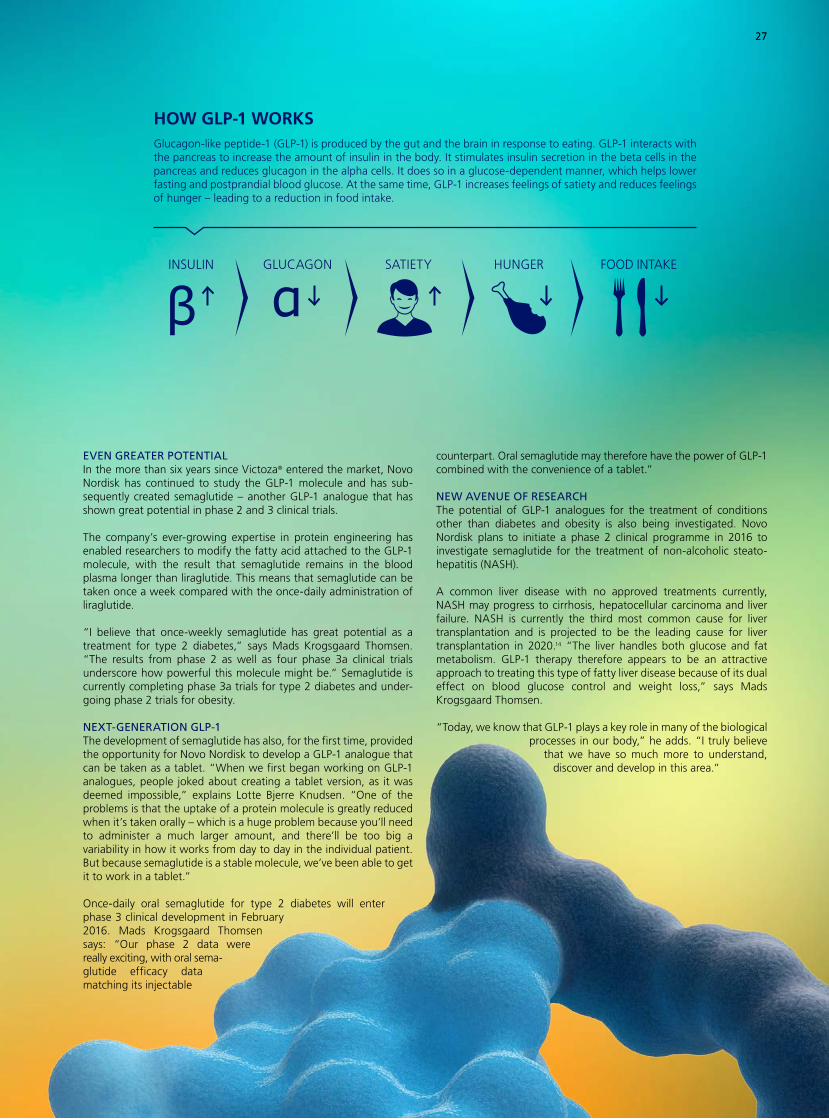
27
Glucagon-like peptide-1 (GLP-1) is produced by the gut and the brain in response to eating. GLP-1 interacts with the pancreas to increase the amount of insulin in the body. It stimulates insulin secretion in the beta cells in the pancreas and reduces glucagon in the alpha cells. It does so in a glucose-dependent manner, which helps lower fasting and postprandial blood glucose. At the same time, GLP-1 increases feelings of satiety and reduces feelings of hunger – leading to a reduction in food intake.
HOW GLP-1 WORKS
EVEN GREATER POTENTIALIn the more than six years since Victoza® entered the market, Novo Nordisk has continued to study the GLP-1 molecule and has sub-sequently created semaglutide – another GLP-1 analogue that has shown great potential in phase 2 and 3 clinical trials.
The company’s ever-growing expertise in protein engineering has enabled researchers to modify the fatty acid attached to the GLP-1 molecule, with the result that semaglutide remains in the blood plasma longer than liraglutide. This means that semaglutide can be taken once a week compared with the once-daily administration of liraglutide.
“I believe that once-weekly semaglutide has great potential as a treatment for type 2 diabetes,” says Mads Krogsgaard Thomsen. “The results from phase 2 as well as four phase 3a clinical trials underscore how powerful this molecule might be.” Semaglutide is currently completing phase 3a trials for type 2 diabetes and under-going phase 2 trials for obesity.
NEXT-GENERATION GLP-1The development of semaglutide has also, for the first time, provided the opportunity for Novo Nordisk to develop a GLP-1 analogue that can be taken as a tablet. “When we first began working on GLP-1 analogues, people joked about creating a tablet version, as it was deemed impossible,” explains Lotte Bjerre Knudsen. “One of the problems is that the uptake of a protein molecule is greatly reduced when it’s taken orally – which is a huge problem because you’ll need to administer a much larger amount, and there’ll be too big a variability in how it works from day to day in the individual patient. But because semaglutide is a stable molecule, we’ve been able to get it to work in a tablet.”
Once-daily oral semaglutide for type 2 diabetes will enter phase 3 clinical development in February 2016. Mads Krogsgaard Thomsen says: “Our phase 2 data were re ally exciting, with oral sema-glutide efficacy data matching its injectable
counterpart. Oral semaglutide may therefore have the power of GLP-1 combined with the convenience of a tablet.”
NEW AVENUE OF RESEARCHThe potential of GLP-1 analogues for the treatment of conditions other than diabetes and obesity is also being investigated. Novo Nordisk plans to initiate a phase 2 clinical programme in 2016 to investigate semaglutide for the treatment of non-alcoholic steato-hepatitis (NASH).
A common liver disease with no approved treatments currently, NASH may progress to cirrhosis, hepatocellular carcinoma and liver failure. NASH is currently the third most common cause for liver transplantation and is projected to be the leading cause for liver transplantation in 2020.14 “The liver handles both glucose and fat metabolism. GLP-1 therapy therefore appears to be an attractive approach to treating this type of fatty liver disease because of its dual effect on blood glucose control and weight loss,” says Mads Krogsgaard Thomsen.
“Today, we know that GLP-1 plays a key role in many of the biological processes in our body,” he adds. “I truly believe
that we have so much more to understand, discover and develop in this area.”
27
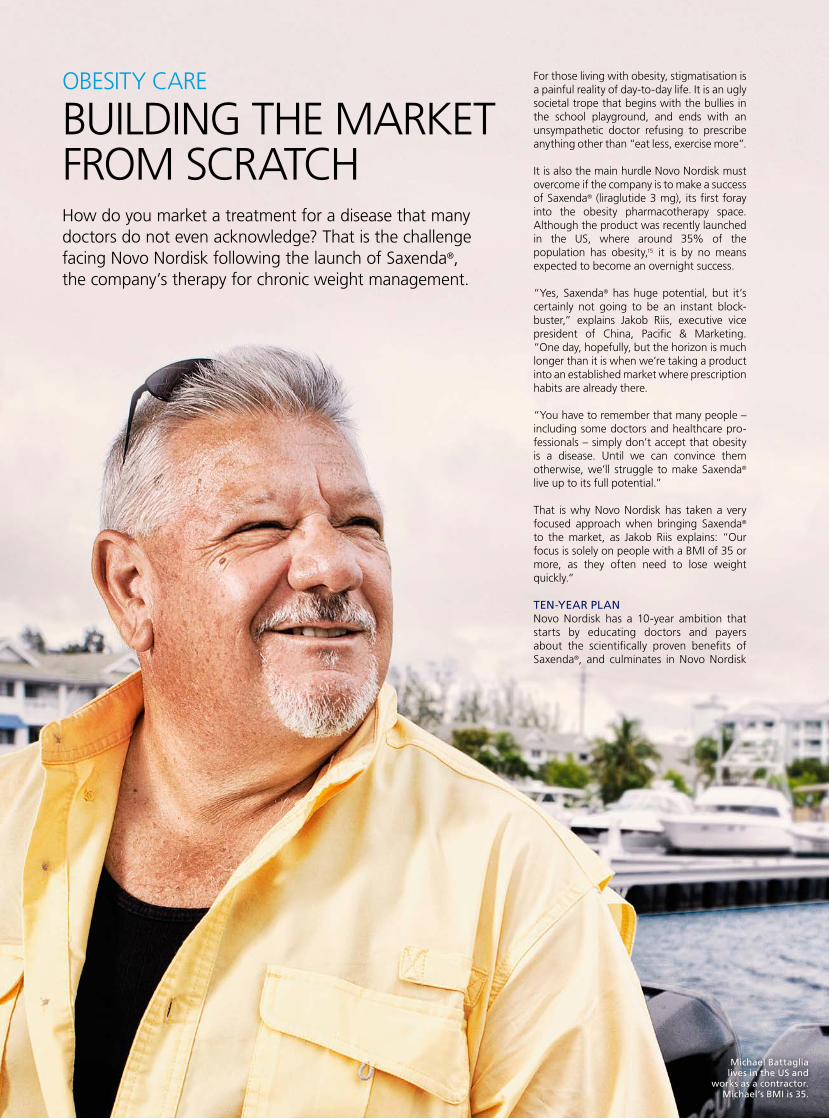
For those living with obesity, stigmatisation is a painful reality of day-to-day life. It is an ugly societal trope that begins with the bullies in the school playground, and ends with an unsympathetic doctor refusing to prescribe anything other than “eat less, exercise more”.
It is also the main hurdle Novo Nordisk must overcome if the company is to make a success of Saxenda® (liraglutide 3 mg), its first foray into the obesity pharmacotherapy space. Although the product was recently launched in the US, where around 35% of the population has obesity,15 it is by no means expected to become an overnight success.
“Yes, Saxenda® has huge potential, but it’s certainly not going to be an instant block-buster,” explains Jakob Riis, executive vice president of China, Pacific & Marketing. “One day, hopefully, but the horizon is much longer than it is when we’re taking a product into an established market where prescription habits are already there.
“You have to remember that many people – including some doctors and healthcare pro-fessionals – simply don’t accept that obesity is a disease. Until we can convince them otherwise, we’ll struggle to make Saxenda® live up to its full potential.”
That is why Novo Nordisk has taken a very focused approach when bringing Saxenda® to the market, as Jakob Riis explains: “Our focus is solely on people with a BMI of 35 or more, as they often need to lose weight quickly.”
TEN-YEAR PLANNovo Nordisk has a 10-year ambition that starts by educating doctors and payers about the scientifically proven benefits of Saxenda®, and culminates in Novo Nordisk
How do you market a treatment for a disease that many doctors do not even acknowledge? That is the challenge facing Novo Nordisk following the launch of Saxenda®, the company’s therapy for chronic weight management.
OBESITY CARE
BUILDING THE MARKET FROM SCRATCH
Michael Battaglia lives in the US and
works as a contractor. Michael’s BMI is 35.
establishing a leading position within the treatment of obesity.
“Our first aim is to make sure obesity is widely recognised as a chronic disease and that even a moderate weight loss of 5–10% could have an impact on weight-related comorbidities,” Jakob Riis explains.
Novo Nordisk’s ambition is to develop a leading obesity portfolio and pipeline that in 10 years’ time will include several phase 3 programmes – with at least one promising even greater weight loss efficacy.
“These are fairly daunting tasks and, of course, we’ll have to fine-tune our strategy as we go along,” he admits. “However, we think this ambition – set out over a 10-year horizon – strikes the right balance between being ambitious and being achievable.”
It is a plan that has already been put into action in the US, where Saxenda® was launched in April 2015. Thanks to the efforts of Novo Nordisk’s field sales force, who have been on the road educating potential prescribers about the product’s safety and efficacy profile since day one, Saxenda® is starting to reach those who need it the most.
PATIENTS BEFORE PROFITSAlthough Saxenda® may not be generating huge amounts of revenue for the company just yet, Jakob Riis is clear that – initially, at least – success will not be measured in dollars and cents. “In the short term, we’ll be measuring success more in terms of the benefits it provides to patients – are they happy with the level of weight loss? We’ll also be seeking acknowledgement from both pre-
scribers and payers that this product actually does what we say it does.”
One man who knows all about patient needs is Joe Nadglowski, chief executive officer of the Obesity Action Coalition (OAC) – a 50,000 member-strong patient orga n i-sation dedicated to giving a voice to those living with obesity across the US. For him, Novo Nordisk is already making a big difference – and he is proud to call the com-pany a partner in his organisation’s fight to help improve the lives of the 78.6 million adult Americans affected by the disease.15
“Novo Nordisk is laying the groundwork to be seen as industry leader in the obesity space for many years to come,” he says. “In the US, patients are looking for new options to treat obesity, so to now have weight-loss medications approved and available is a huge boon for those living with the disease.
“But more importantly, Novo Nordisk recog-nises the fact that not every therapy will work for every patient, and is therefore investing in a whole pipeline of future obe-sity treatments. Couple this with a genuine desire to engage with and listen to the patient community, and it’s a recipe for lasting success.”
THE BEGINNING OF THE BEGINNINGSo what is next on the obesity agenda? According to Executive Vice President and Chief Science Officer Mads Krogsgaard Thomsen, Saxenda® is just the beginning of an exciting new chapter for Novo Nordisk.
“With Saxenda®, we can help people under-stand that obesity is a disease often requiring medical intervention and gradually build the market,” he says. “My hope is then that our Seattle research site, together with our strong
academic network, will be able to pick up new targets and begin creating new bio l-ogics which can make an even bigger dif- fe rence in terms of both physical health and quality of life for people with obesity.”
One molecule already showing great poten-tial is semaglutide (see p 26). Like lira glutide, it is a long-acting glucagon-like peptide-1 (GLP-1) analogue, but recent phase 3 study results suggest it may be significantly more effective for the treatment of obesity.
According to Mads Krogsgaard Thomsen, the most impressive results may ultimately be derived from combination therapies – an area he describes as ’the playground’ of Novo Nordisk R&D.
“Ten years down the road we have some very strong ambitions for new obesity medicines – specifically, combination therapies that work synergistically,” he adds.
A glance at the pipeline gives a hint of what is in store. Aside from semaglutide, there are already three promising new candidates in development at Novo Nordisk for the treat-ment of obesity: NN9030, a novel glucagon analogue designed to be used in combination with liraglutide, NN9838, a novel long-acting amylin analogue, and NN9747, a novel long-acting PYY analogue (PYY is a human peptide, secreted in response to a meal, that has been shown to reduce appetite).
“This is only the beginning of the beginning,” Mads Krogsgaard Thomsen says. “With our obesity pipeline and strategy, we’re in a fantastic position to secure a leadership position within the field for many years to come, to the benefit of people who are struggling with obesity.”
WHAT IS OBESITY?Obesity is defined as abnormal or excessive fat accumulation that may impair health for people with a body mass index (BMI) of more than 30. BMI provides the most convenient population-level measure of overweight and obesity currently available.2 BMI itself, however, does not define health risk. BMI is a simple weight-for-height index that is commonly used to classify overweight and obesity in adults. It is calculated by dividing a person’s weight in kilograms by the square of the person’s height in metres (kg/m2).
* Ogden CL, Carroll MD, Kit BK & Flegal KM. Prevalence of Childhood and Adult Obesity in the United States, 2011–2012. The Journal of the American Medical Association 2014; 311(8):806–814.
OF THE US ADULT POPULATION (OVER THE AGE OF 20) HAS OBESITY (BMI >30)*
29
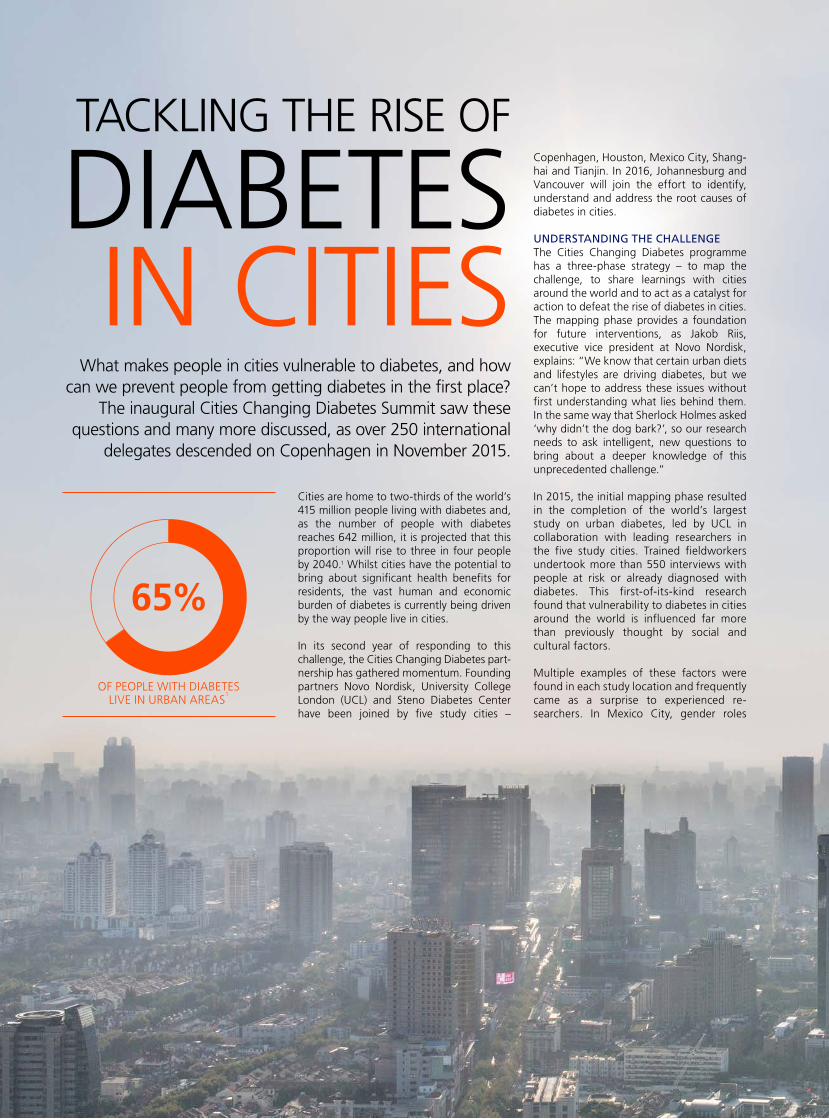
What makes people in cities vulnerable to diabetes, and how can we prevent people from getting diabetes in the first place?
The inaugural Cities Changing Diabetes Summit saw these questions and many more discussed, as over 250 international
delegates descended on Copenhagen in November 2015.
TACKLING THE RISE OF
DIABETES IN CITIES
Cities are home to two-thirds of the world’s 415 million people living with diabetes and, as the number of people with diabetes reaches 642 million, it is projected that this proportion will rise to three in four people by 2040.1 Whilst cities have the potential to bring about significant health benefits for residents, the vast human and economic burden of diabetes is currently being driven by the way people live in cities.
In its second year of responding to this challenge, the Cities Changing Diabetes part- nership has gathered momentum. Founding partners Novo Nordisk, University College London (UCL) and Steno Diabetes Center have been joined by five study cities –
Copenhagen, Houston, Mexico City, Shang-hai and Tianjin. In 2016, Johannesburg and Vancouver will join the effort to identify, understand and address the root causes of diabetes in cities.
UNDERSTANDING THE CHALLENGEThe Cities Changing Diabetes programme has a three-phase strategy – to map the challenge, to share learnings with cities around the world and to act as a catalyst for action to defeat the rise of diabetes in cities. The mapping phase provides a foundation for future interventions, as Jakob Riis, executive vice president at Novo Nordisk, explains: “We know that certain urban diets and lifestyles are driving diabetes, but we can’t hope to address these issues without first understanding what lies behind them. In the same way that Sherlock Holmes asked ‘why didn’t the dog bark?’, so our research needs to ask intelligent, new questions to bring about a deeper knowledge of this unprecedented challenge.”
In 2015, the initial mapping phase resulted in the completion of the world’s largest study on urban diabetes, led by UCL in collaboration with leading researchers in the five study cities. Trained fieldworkers under took more than 550 interviews with people at risk or already diagnosed with diabetes. This first-of-its-kind research found that vulnerability to diabetes in cities around the world is influenced far more than previously thought by social and cultural factors.
Multiple examples of these factors were found in each study location and frequently came as a surprise to experienced re-searchers. In Mexico City, gender roles
OF PEOPLE WITH DIABETES LIVE IN URBAN AREAS
1
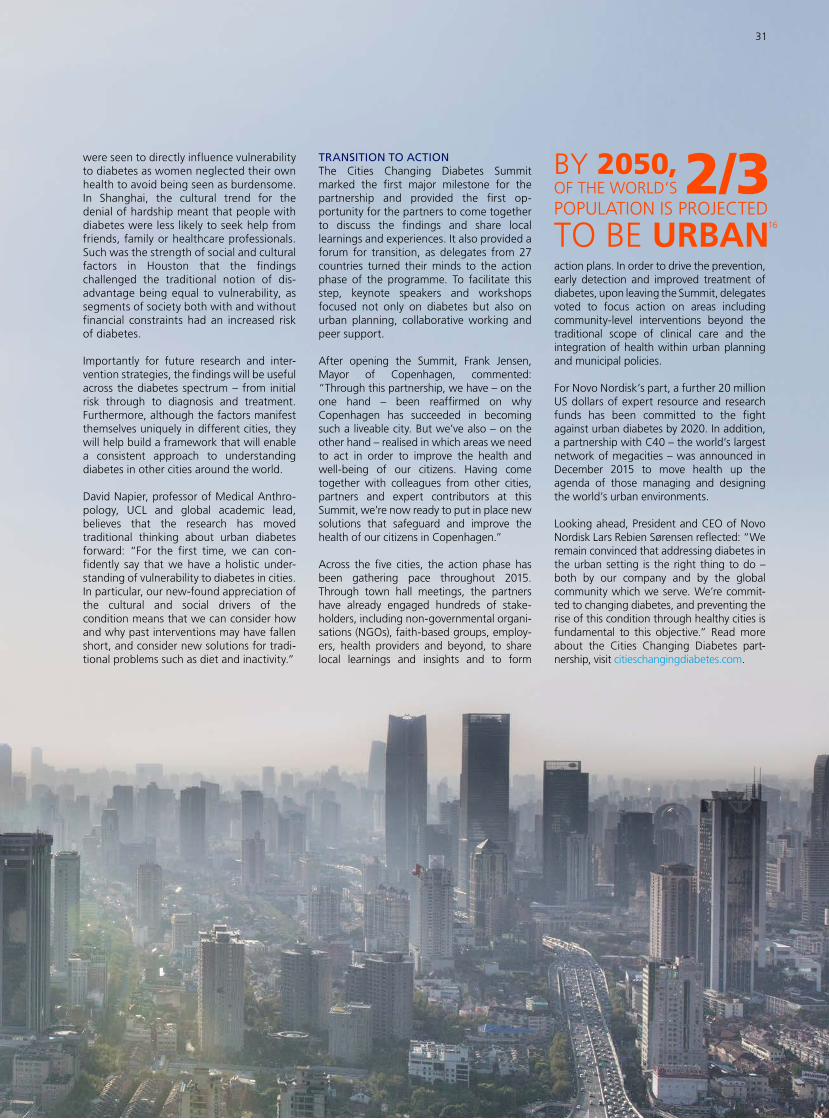
were seen to directly influence vulnerability to diabetes as women neglected their own health to avoid being seen as burdensome. In Shanghai, the cultural trend for the denial of hardship meant that people with diabetes were less likely to seek help from friends, family or healthcare professionals. Such was the strength of social and cultural factors in Houston that the findings challenged the traditional notion of dis-advantage being equal to vulnerability, as segments of society both with and without financial constraints had an increased risk of diabetes.
Importantly for future research and inter-vention strategies, the findings will be useful across the diabetes spectrum – from initial risk through to diagnosis and treat ment. Furthermore, although the factors manifest themselves uniquely in different cities, they will help build a framework that will enable a consistent approach to under standing diabetes in other cities around the world.
David Napier, professor of Medical Anthro-pology, UCL and global academic lead, believes that the research has moved traditional thinking about urban diabetes forward: “For the first time, we can con-fidently say that we have a holistic under-standing of vulnerability to diabetes in cities. In particular, our new-found appreciation of the cultural and social drivers of the condition means that we can consider how and why past interventions may have fallen short, and consider new solutions for tradi-tional problems such as diet and inactivity.”
TRANSITION TO ACTIONThe Cities Changing Diabetes Summit marked the first major milestone for the partnership and provided the first op-portunity for the partners to come together to discuss the findings and share local learnings and experiences. It also provided a forum for transition, as delegates from 27 countries turned their minds to the action phase of the programme. To facilitate this step, keynote speakers and workshops focused not only on diabetes but also on urban planning, collaborative working and peer support.
After opening the Summit, Frank Jensen, Mayor of Copenhagen, commented: “Through this partnership, we have – on the one hand – been reaffirmed on why Copenhagen has succeeded in becoming such a liveable city. But we’ve also – on the other hand – realised in which areas we need to act in order to improve the health and well-being of our citizens. Having come together with colleagues from other cities, partners and expert contributors at this Summit, we’re now ready to put in place new solutions that safeguard and improve the health of our citizens in Copenhagen.”
Across the five cities, the action phase has been gathering pace throughout 2015. Through town hall meetings, the partners have already engaged hundreds of sta ke-holders, including non-governmental or gani-sations (NGOs), faith-based groups, employ-ers, health providers and beyond, to share local learnings and insights and to form
action plans. In order to drive the prevention, early detection and improved treatment of diabetes, upon leaving the Summit, delegates voted to focus action on areas including community-level inter ventions beyond the traditional scope of clinical care and the integration of health within urban planning and municipal policies.
For Novo Nordisk’s part, a further 20 million US dollars of expert resource and research funds has been committed to the fight against urban diabetes by 2020. In addition, a partnership with C40 – the world’s largest network of megacities – was announced in December 2015 to move health up the agenda of those managing and designing the world’s urban environments.
Looking ahead, President and CEO of Novo Nordisk Lars Rebien Sørensen reflected: “We remain convinced that addressing diabetes in the urban setting is the right thing to do – both by our company and by the global community which we serve. We’re commit-ted to changing diabetes, and preventing the rise of this condition through healthy cities is fundamental to this objective.” Read more about the Cities Changing Diabetes part-nership, visit citieschangingdiabetes.com.
16
31

Not so long ago, the outlook for a person who developed antibodies (inhibitors) against standard haemophilia treatments was very bleak, but in June 1985, Novo Nordisk began a groundbreaking project to develop recombinant factor VIIa – the active ingredient in NovoSeven®. After more than a decade of development, NovoSeven® was launched, enabling the blood of inhibitor patients to form stable clots without the use of standard blood factor treatments. As NovoSeven® is not derived from human blood plasma, this innovative product also addressed concerns at the time regarding safety in relation to blood contamination.
Paul Huggins, who heads Novo Nordisk’s global marketing of bio-pharmaceuticals in Zurich, Switzerland, appreciates what a big – and risky – step the development of NovoSeven® was for the com pany. “The business case was not convincing as the patient popu lation was only a few thousand people globally. But the company’s management decided nevertheless that it couldn’t ignore the unmet medical need as Novo Nordisk had the capabilities to develop a compound that would potentially meet this need,” he explains.
NovoSeven® went on to become a very important treatment option, used for the on-demand treatment of bleeding episodes and the management of bleeding during surgery for people with haemophilia with inhibitors, acquired haemophilia, factor VII deficiency and Glanzmann’s thrombasthenia.
GIVING PEOPLE A CHOICEBy the mid-2000s, Novo Nordisk started developing new and innovative factor VIII, IX and XIII treatments for bleeding disorders.
WHAT IS HAEMOPHILIA?Haemophilia is an inherited or acquired bleeding disorder that prevents the blood from clotting. People with haemophilia either partially or completely lack an essential clotting factor needed to form stable blood clots. Without treatment, uncontrolled internal bleeding can cause stiffness, pain, severe joint damage and even death. Treatment with replacement clotting factors may be administered when bleeding occurs or, increasingly, on a preventive basis (prophylactic treatment). People with haemophilia A, an estimated 350,000,17 have absent, decreased or defective production of the blood clotting factor VIII. People with haemophilia B, of whom there are some 70,000,18 have deficiencies in producing clotting factor IX. Both types are inherited.
NOVO NORDISK HAEMOPHILIA FOUNDATIONOn 25 January 2015, the Novo Nordisk Haemophilia Foundation cele-brated its 10th anniversary. The Foundation is a grant-making non-profit organisation that strives to improve access to care for people with haemophilia and allied bleeding disorders. Since it was established, the Foundation has supported 168 programmes in 63 countries in the developing world, where many people with bleeding disorders still lack proper diagnosis or adequate care. Read more on nnhf.org.
“In 2012, we launched NovoThirteen®, which is marketed as Tretten® in some countries, for a very small and vulnerable community of people with congenital factor XIII deficiency, which is an extremely rare and serious bleeding disorder affecting only about 1,300 people globally,” says Paul Huggins. “We then had two products for patient communities which hadn’t previously attracted a lot of attention from companies engaged in haemophilia – which made the launch of NovoEight® last year very important to us, as it was our first treatment for the wider haemophilia community.”
At the time of approval, NovoEight® was the first new recombinant factor VIII treatment for people with haemophilia in Europe and Japan for over a decade. It was launched in Europe and Japan in 2014 and in the US in 2015. “NovoEight® has been very well received in the US; the uptake has exceeded our expectations. Patients like – and deserve – a choice, which is why I think the haemophilia community has welcomed NovoEight®,” explains Paul Huggins.
THREE DECADES OF RESEARCH AND DEVELOPMENTThirty years on, and Novo Nordisk’s commitment to the haemophilia community – which began with NovoSeven® – is undiminished.
With its long-acting versions of factor IX (N9-GP) and VIII (N8-GP), which Novo Nordisk expects to submit for regulatory approval in 2016 and 2018 respectively, the company aims to provide even more options for people with haemophilia.
Novo Nordisk also has a long-acting version of a re com bi-nant factor VIIa in pre-clinical development, which it hopes will make routine prophylaxis the norm for people with inhibitors. Moreover, the company is developing a monoclonal antibody against Tissue Fac-tor Pathway Inhibitor (TFPI), which is intended for prophylactic treatment after subcutaneous admin- i stration (see R&D pipeline on p 21).
30 YEARS OF CHANGING HAEMOPHILIABuilding on its experience with NovoSeven®, Novo Nordisk has in recent years expanded its presence in haemophilia with NovoThirteen® and NovoEight®, underscoring its commitment to help defeat this serious condition.
Carl lives with his mother, father and little sister in Lyngby, Denmark. Carl is 8 years old and in 2nd grade and was diagnosed with haemophilia at birth.
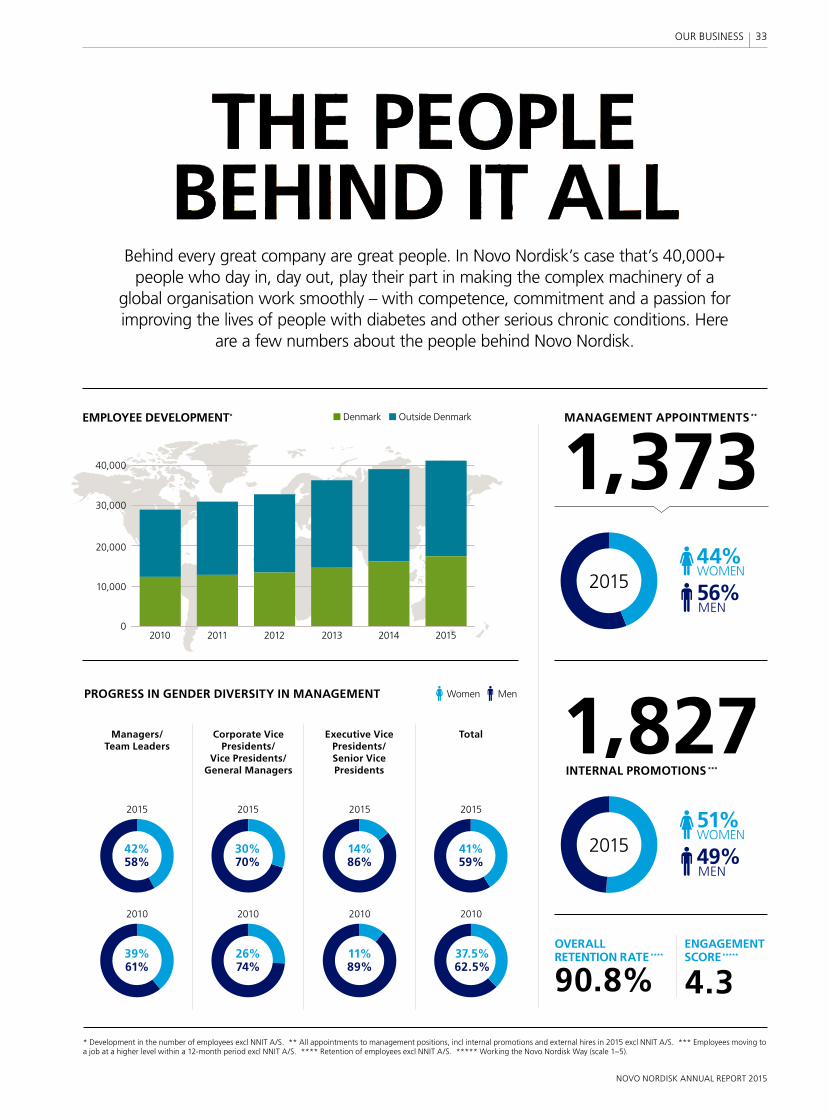
Behind every great company are great people. In Novo Nordisk’s case that’s 40,000+ people who day in, day out, play their part in making the complex machinery of a
global organisation work smoothly – with competence, commitment and a passion for improving the lives of people with diabetes and other serious chronic conditions. Here
are a few numbers about the people behind Novo Nordisk.
PROGRESS IN GENDER DIVERSITY IN MANAGEMENT
EMPLOYEE DEVELOPMENT*
* Development in the number of employees excl NNIT A/S. ** All appointments to management positions, incl internal promotions and external hires in 2015 excl NNIT A/S. *** Employees moving to a job at a higher level within a 12-month period excl NNIT A/S. **** Retention of employees excl NNIT A/S. ***** Working the Novo Nordisk Way (scale 1–5).
MANAGEMENT APPOINTMENTS **
1,373
1,827
90.8% 4.3
INTERNAL PROMOTIONS ***
OVERALL RETENTION RATE ****
ENGAGEMENT SCORE *****
MenWomen
Executive Vice Presidents/ Senior Vice Presidents
2010
11%89%
2015
14%86%
TotalCorporate Vice Presidents/
Vice Presidents/ General Managers
2010
26%74%
2015
30%70%
Managers/ Team Leaders
2010
39%61%
2015
42%58% 49%
MEN
56%MEN
51%WOMEN
44%WOMEN
20100
10,000
20,000
30,000
40,000
■ Denmark ■ Outside Denmark
2011 2012 2013 2014 2015
2010
37.5%62.5%
2015
41%59%
2015
2015
33
NOVO NORDISK ANNUAL REPORT 2015
OUR BUSINESS
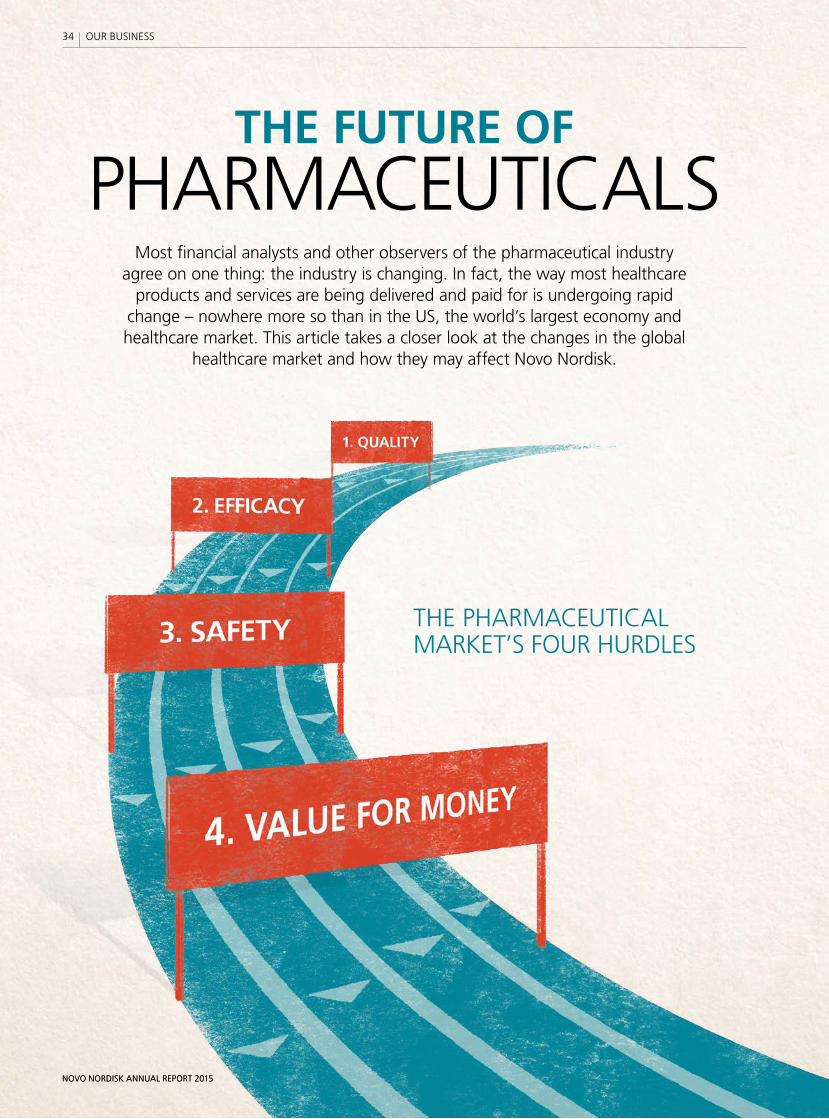
THE FUTURE OF PHARMACEUTICALS
Most financial analysts and other observers of the pharmaceutical industry agree on one thing: the industry is changing. In fact, the way most healthcare
products and services are being delivered and paid for is undergoing rapid change – nowhere more so than in the US, the world’s largest economy and healthcare market. This article takes a closer look at the changes in the global
healthcare market and how they may affect Novo Nordisk.
NOVO NORDISK ANNUAL REPORT 2015
THE PHARMACEUTICAL MARKET’S FOUR HURDLES
34
NOVO NORDISK ANNUAL REPORT 2015
OUR BUSINESS

CONTINUED
All over the world, governments, healthcare professionals, patients, pharmaceutical companies and a host of intermediaries are engaged in heated debates and tough negotiations about which patients should have access to which products and services, at what cost and, let us not forget, who should foot the bill.
Some will argue (and rightly so) that this is not a new discussion. For as long as there have been healthcare systems, there have been discussions about how to balance access, cost and quality – the three foundational elements of a healthcare system. However, what many patients have experienced in recent years is that cost containment has become the dominant consideration when healthcare systems implement new initiatives or reforms. One consequence is that more patients are finding themselves denied access to pharmaceuticals and healthcare services that they would previously have expected to be covered by their public healthcare system or insurance.
The pharmaceutical industry is feeling the effects of the strong focus on cost containment in the form of ever-tougher pricing and reimbursement negotiations, sometimes resulting in reimbursement being denied by a public healthcare system or, in the US, exclusion from the formularies of managed care organisations.
When introducing new products, research-based companies are facing what has become known as the ‘fourth hurdle’ – being required by payers to demonstrate that their new products, in addition to being of good quality, effective and safe, also represent good value for money. To clear this fourth hurdle, companies need to show that their products are more effective than relevant comparators and that the increased cost is offset by savings elsewhere in the healthcare system. While this may not sound like an unreasonable demand, it is often difficult to meet. One reason is that the benefits of using a newer product may only become apparent years later – which, for someone charged with making ends meet in this year’s budget, is not an attractive proposition.
Diabetes drugs serve as a case in point: a new treatment may help a person with diabetes achieve better control of their blood glucose than an older product. In the short term, this may give the person a better
quality of life – which is important – but the biggest cost savings are likely to come much later, from the reduced risk of developing serious long-term complications from diabetes: blindness, amputations and nerve damage. In the US, for example, it has been estimated that of the total healthcare spending on diagnosed diabetes, hospital inpatient care account for 43%, medicines to treat complications 18%, diabetes medicines and supplies 12% and other costs 27%.
REAL-WORLD EVIDENCENovo Nordisk Executive Vice President Jakob Riis, whose respon-sibilities include ensuring market access for the company’s products, mentions another complicating factor when pharmaceutical com-panies and payers negotiate the pricing and reimbursement of a product: “There’s no commonly agreed standard for evaluating whe ther a new treatment will lead to an improved health outcome for certain patients and the financial value of this. Each healthcare system seems to do this in its own way.”
One general trend, though, is that payers want more ‘real-world evidence’ of the benefits of a new product in addition to the data on efficacy and safety from the clinical trials that formed the basis of its approval by health authorities. Payers want to know whether similar results can be achieved in real life, when patients are not part of a clinical trial.
“We’ll have to find ways to collect and analyse real-world evidence in a way that satisfies payers. This will be a focus area for our development and market access organisations in the coming years,” says Jakob Riis.
In this context, he mentions the opportunities presented by an increasingly digitalised healthcare system and, as an example, highlights a partnership Novo Nordisk formed with IBM Watson Health in December 2015: “By combining our leadership in diabetes care with the analytical power of IBM Watson Health’s cognitive computing capability, we’ll explore possibilities for improving diabetes care through the gathering and analysis of real-time, real-world evidence from current diabetes treatment. If successful, this will not only help improve the lives of people with diabetes by making
Global market sales (2014–2020) • US • Emerging markets • Europe • China • Japan • Others
Sales (USD billion) CAGR % (2014–2020)
6.8%
7.4%3.4%
7.6%
1.3%4.2%
0
100
200
300
400
500
600
700
2014 2015 2016 2017 2018 2019 2020
Source: IMS Market Prognosis Global Sept 2015. At ex-manufacturer price levels, not including rebates and discounts.
THE GLOBAL PHARMA MARKET IS FORECASTED TO GROW 6% ANNUALLY IN THE PERIOD 2014–2020: THIS BRINGS THE TOTAL MARKET TO USD 1.4 TRILLION IN 2020.
35
NOVO NORDISK ANNUAL REPORT 2015
OUR BUSINESS
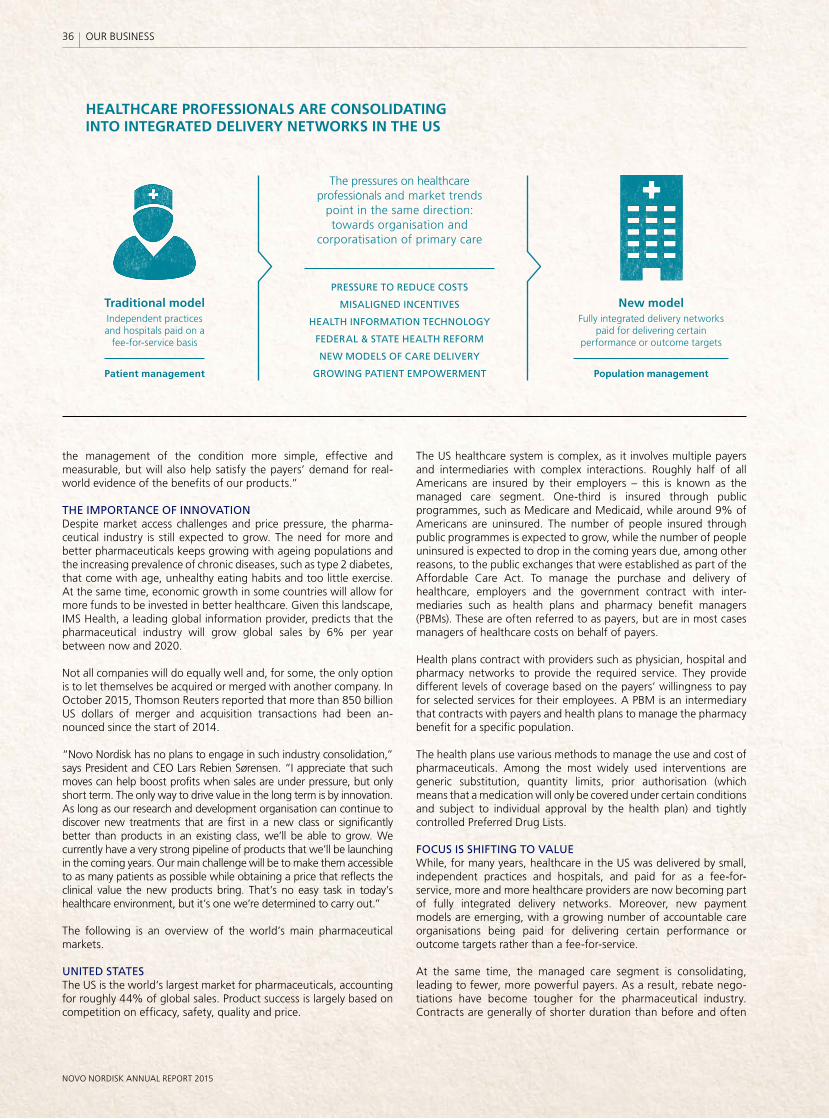
the management of the condition more simple, effective and measurable, but will also help satisfy the payers’ demand for real-world evidence of the benefits of our products.”
THE IMPORTANCE OF INNOVATIONDespite market access challenges and price pressure, the phar ma-ceutical industry is still expected to grow. The need for more and better pharmaceuticals keeps growing with ageing populations and the increasing prevalence of chronic diseases, such as type 2 diabetes, that come with age, unhealthy eating habits and too little exercise. At the same time, economic growth in some countries will allow for more funds to be invested in better healthcare. Given this landscape, IMS Health, a leading global information provider, predicts that the pharmaceutical industry will grow global sales by 6% per year between now and 2020.
Not all companies will do equally well and, for some, the only option is to let themselves be acquired or merged with another company. In October 2015, Thomson Reuters reported that more than 850 billion US dollars of merger and acquisition transactions had been an-nounced since the start of 2014.
“Novo Nordisk has no plans to engage in such industry consolidation,” says President and CEO Lars Rebien Sørensen. “I appreciate that such moves can help boost profits when sales are under pressure, but only short term. The only way to drive value in the long term is by innovation. As long as our research and development organisation can continue to discover new treatments that are first in a new class or significantly better than products in an existing class, we’ll be able to grow. We currently have a very strong pipeline of products that we’ll be launching in the coming years. Our main challenge will be to make them accessible to as many patients as possible while obtaining a price that reflects the clinical value the new products bring. That’s no easy task in today’s healthcare environment, but it’s one we’re determined to carry out.”
The following is an overview of the world’s main pharmaceutical markets.
UNITED STATESThe US is the world’s largest market for pharmaceuticals, accounting for roughly 44% of global sales. Product success is largely based on competition on efficacy, safety, quality and price.
The US healthcare system is complex, as it involves multiple payers and intermediaries with complex interactions. Roughly half of all Americans are insured by their employers – this is known as the managed care segment. One-third is insured through public programmes, such as Medicare and Medicaid, while around 9% of Americans are uninsured. The number of people insured through public programmes is expected to grow, while the number of people uninsured is expected to drop in the coming years due, among other reasons, to the public exchanges that were established as part of the Affordable Care Act. To manage the purchase and delivery of healthcare, employers and the government contract with inter-mediaries such as health plans and pharmacy benefit managers (PBMs). These are often referred to as payers, but are in most cases managers of healthcare costs on behalf of payers.
Health plans contract with providers such as physician, hospital and pharmacy networks to provide the required service. They provide different levels of coverage based on the payers’ willingness to pay for selected services for their employees. A PBM is an intermediary that contracts with payers and health plans to manage the pharmacy benefit for a specific population.
The health plans use various methods to manage the use and cost of pharmaceuticals. Among the most widely used interventions are generic substitution, quantity limits, prior authorisation (which means that a medication will only be covered under certain conditions and subject to individual approval by the health plan) and tightly controlled Preferred Drug Lists.
FOCUS IS SHIFTING TO VALUEWhile, for many years, healthcare in the US was delivered by small, independent practices and hospitals, and paid for as a fee-for-service, more and more healthcare providers are now becoming part of fully integrated delivery networks. Moreover, new payment models are emerging, with a growing number of accountable care organisations being paid for delivering certain performance or outcome targets rather than a fee-for-service.
At the same time, the managed care segment is consolidating, leading to fewer, more powerful payers. As a result, rebate nego-tiations have become tougher for the pharmaceutical industry. Contracts are generally of shorter duration than before and often
HEALTHCARE PROFESSIONALS ARE CONSOLIDATING INTO INTEGRATED DELIVERY NETWORKS IN THE US
New modelFully integrated delivery networks
paid for delivering certain performance or outcome targets
Traditional modelIndependent practices and hospitals paid on a
fee-for-service basis
Patient management
The pressures on healthcare professionals and market trends
point in the same direction: towards organisation and
corporatisation of primary care
PRESSURE TO REDUCE COSTS
MISALIGNED INCENTIVES
HEALTH INFORMATION TECHNOLOGY
FEDERAL & STATE HEALTH REFORM
NEW MODELS OF CARE DELIVERY
GROWING PATIENT EMPOWERMENT Population management
36
NOVO NORDISK ANNUAL REPORT 2015
OUR BUSINESS
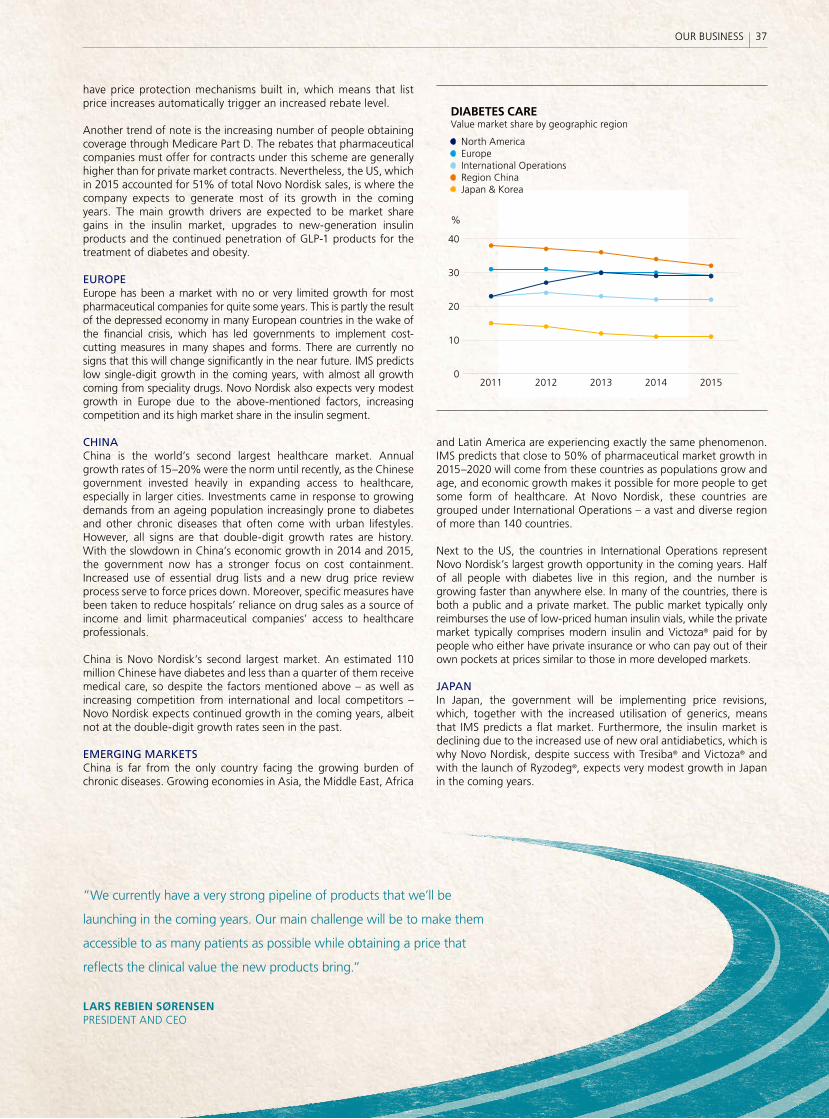
have price protection mechanisms built in, which means that list price increases automatically trigger an increased rebate level.
Another trend of note is the increasing number of people obtaining coverage through Medicare Part D. The rebates that pharmaceutical companies must offer for contracts under this scheme are generally higher than for private market contracts. Nevertheless, the US, which in 2015 accounted for 51% of total Novo Nordisk sales, is where the company expects to generate most of its growth in the coming years. The main growth drivers are expected to be market share gains in the insulin market, upgrades to new-generation insulin products and the continued penetration of GLP-1 products for the treatment of diabetes and obesity.
EUROPEEurope has been a market with no or very limited growth for most pharmaceutical companies for quite some years. This is partly the result of the depressed economy in many European countries in the wake of the financial crisis, which has led governments to implement cost-cutting measures in many shapes and forms. There are currently no signs that this will change significantly in the near future. IMS predicts low single-digit growth in the coming years, with almost all growth coming from speciality drugs. Novo Nordisk also expects very modest growth in Europe due to the above-mentioned factors, increasing competition and its high market share in the insulin segment.
CHINAChina is the world’s second largest healthcare market. Annual growth rates of 15–20% were the norm until recently, as the Chinese government invested heavily in expanding access to healthcare, especially in larger cities. Investments came in response to growing demands from an ageing population increasingly prone to diabetes and other chronic diseases that often come with urban lifestyles. However, all signs are that double-digit growth rates are history. With the slowdown in China’s economic growth in 2014 and 2015, the government now has a stronger focus on cost containment. Increased use of essential drug lists and a new drug price review process serve to force prices down. Moreover, specific measures have been taken to reduce hospitals’ reliance on drug sales as a source of income and limit pharmaceutical companies’ access to healthcare professionals.
China is Novo Nordisk’s second largest market. An estimated 110 million Chinese have diabetes and less than a quarter of them receive medical care, so despite the factors mentioned above – as well as increasing competition from international and local competitors – Novo Nordisk expects continued growth in the coming years, albeit not at the double-digit growth rates seen in the past.
EMERGING MARKETSChina is far from the only country facing the growing burden of chronic diseases. Growing economies in Asia, the Middle East, Africa
and Latin America are experiencing exactly the same phenomenon. IMS predicts that close to 50% of pharmaceutical market growth in 2015–2020 will come from these countries as populations grow and age, and economic growth makes it possible for more people to get some form of healthcare. At Novo Nordisk, these countries are grouped under International Operations – a vast and diverse region of more than 140 countries.
Next to the US, the countries in International Operations represent Novo Nordisk’s largest growth opportunity in the coming years. Half of all people with diabetes live in this region, and the number is growing faster than anywhere else. In many of the countries, there is both a public and a private market. The public market typically only reimburses the use of low-priced human insulin vials, while the private market typically comprises modern insulin and Victoza® paid for by people who either have private insurance or who can pay out of their own pockets at prices similar to those in more developed markets.
JAPANIn Japan, the government will be implementing price revisions, which, together with the increased utilisation of generics, means that IMS predicts a flat market. Furthermore, the insulin market is declining due to the increased use of new oral antidiabetics, which is why Novo Nordisk, despite success with Tresiba® and Victoza® and with the launch of Ryzodeg®, expects very modest growth in Japan in the coming years.
2011 2012 2013 2014 20150
10
20
30
40
DIABETES CARE Value market share by geographic region
• North America• Europe• International Operations• Region China• Japan & Korea
%
”We currently have a very strong pipeline of products that we’ll be
launching in the coming years. Our main challenge will be to make them
accessible to as many patients as possible while obtaining a price that
reflects the clinical value the new products bring.”
LARS REBIEN SØRENSENPRESIDENT AND CEO
37OUR BUSINESS
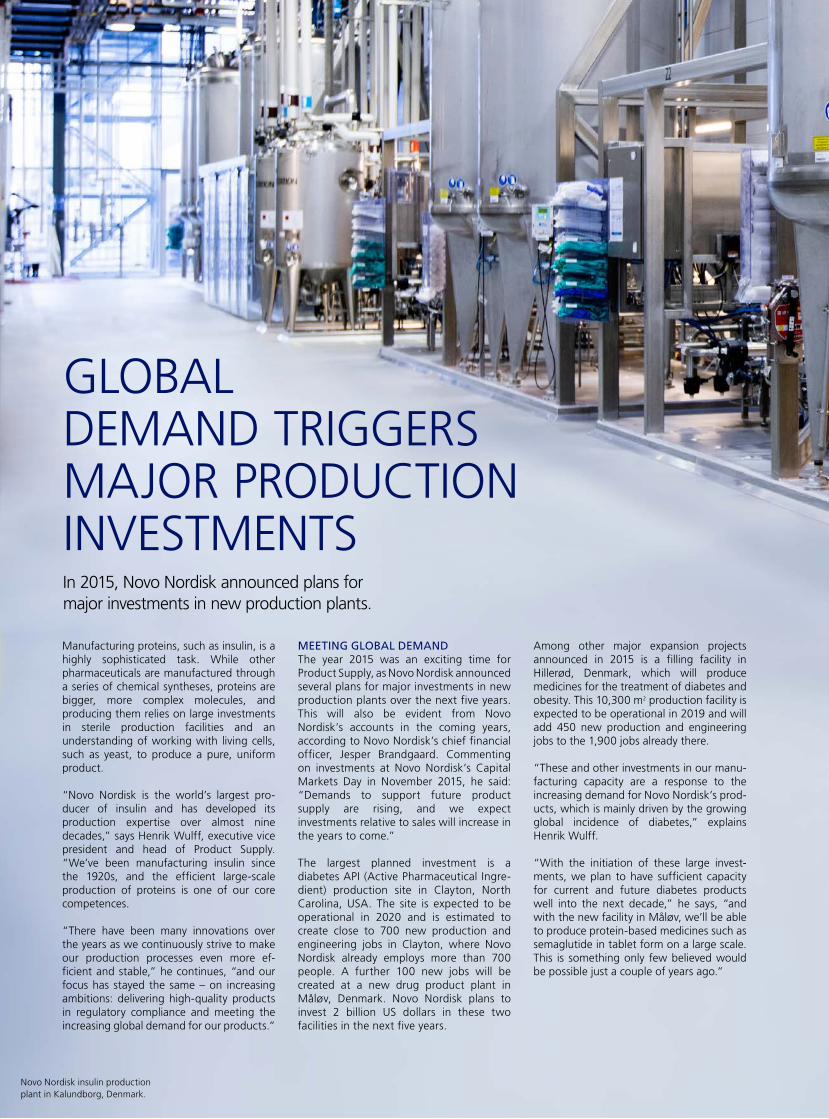
Novo Nordisk insulin production plant in Kalundborg, Denmark.
Manufacturing proteins, such as insulin, is a highly sophisticated task. While other pharmaceuticals are manufactured through a series of chemical syntheses, proteins are bigger, more complex molecules, and producing them relies on large investments in sterile production facilities and an understanding of working with living cells, such as yeast, to produce a pure, uniform product.
“Novo Nordisk is the world’s largest pro-ducer of insulin and has developed its production expertise over almost nine decades,” says Henrik Wulff, executive vice president and head of Product Supply. “We’ve been manufacturing insulin since the 1920s, and the efficient large-scale production of proteins is one of our core competences.
“There have been many innovations over the years as we continuously strive to make our production processes even more ef-ficient and stable,” he continues, “and our focus has stayed the same – on increasing ambitions: delivering high-quality products in regulatory compliance and meeting the increasing global demand for our products.”
MEETING GLOBAL DEMAND The year 2015 was an exciting time for Product Supply, as Novo Nordisk announced several plans for major investments in new production plants over the next five years. This will also be evident from Novo Nordisk’s accounts in the coming years, according to Novo Nordisk’s chief financial officer, Jesper Brandgaard. Commenting on investments at Novo Nordisk’s Capital Markets Day in November 2015, he said: “Demands to support future product supply are rising, and we expect investments relative to sales will increase in the years to come.”
The largest planned investment is a diabetes API (Active Pharmaceutical Ingre-dient) production site in Clayton, North Carolina, USA. The site is expected to be operational in 2020 and is estimated to create close to 700 new production and engineering jobs in Clayton, where Novo Nordisk already employs more than 700 people. A further 100 new jobs will be created at a new drug product plant in Måløv, Denmark. Novo Nordisk plans to invest 2 billion US dollars in these two facilities in the next five years.
Among other major expansion projects announced in 2015 is a filling facility in Hillerød, Denmark, which will produce me dicines for the treatment of diabetes and obesity. This 10,300 m2 production facility is expected to be operational in 2019 and will add 450 new production and engineering jobs to the 1,900 jobs already there.
“These and other investments in our manu-facturing capacity are a response to the increasing demand for Novo Nordisk’s prod-ucts, which is mainly driven by the growing global incidence of diabetes,” ex plains Henrik Wulff.
“With the initiation of these large invest-ments, we plan to have sufficient capacity for current and future diabetes products well into the next decade,” he says, “and with the new facility in Måløv, we’ll be able to produce protein-based medicines such as semaglutide in tablet form on a large scale. This is something only few believed would be possible just a couple of years ago.”
GLOBAL DEMAND TRIGGERS MAJOR PRODUCTION INVESTMENTSIn 2015, Novo Nordisk announced plans for major investments in new production plants.
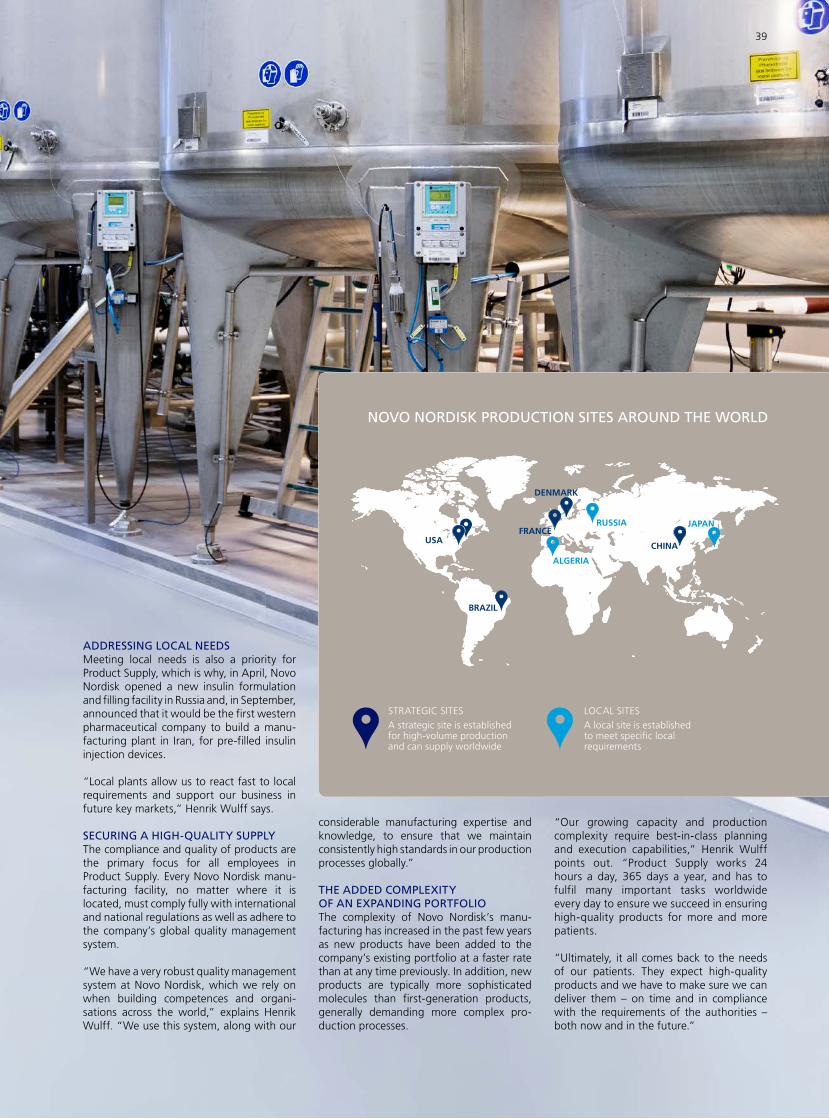
ADDRESSING LOCAL NEEDSMeeting local needs is also a priority for Product Supply, which is why, in April, Novo Nordisk opened a new insulin formulation and filling facility in Russia and, in September, announced that it would be the first western pharmaceutical company to build a manu-facturing plant in Iran, for pre-filled insulin injection devices.
“Local plants allow us to react fast to local requirements and support our business in future key markets,” Henrik Wulff says.
SECURING A HIGH-QUALITY SUPPLYThe compliance and quality of products are the primary focus for all employees in Product Supply. Every Novo Nordisk ma nu-facturing facility, no matter where it is located, must comply fully with international and national regulations as well as adhere to the company’s global quality management system.
“We have a very robust quality management system at Novo Nordisk, which we rely on when building competences and organi-sations across the world,” explains Henrik Wulff. “We use this system, along with our
considerable manufacturing expertise and knowledge, to ensure that we maintain consistently high standards in our production processes globally.”
THE ADDED COMPLEXITY OF AN EXPANDING PORTFOLIOThe complexity of Novo Nordisk’s manu-facturing has increased in the past few years as new products have been added to the company’s existing portfolio at a faster rate than at any time previously. In addition, new products are typically more sophis ticated molecules than first-generation products, generally demanding more com plex pro-duction processes.
“Our growing capacity and production complexity require best-in-class planning and execution capabilities,” Henrik Wulff points out. “Product Supply works 24 hours a day, 365 days a year, and has to fulfil many important tasks worldwide every day to ensure we succeed in ensuring high-quality products for more and more patients.
“Ultimately, it all comes back to the needs of our patients. They expect high-quality products and we have to make sure we can deliver them – on time and in compliance with the requirements of the authorities – both now and in the future.”
NOVO NORDISK PRODUCTION SITES AROUND THE WORLD
LOCAL SITESA local site is established to meet specific local requirements
STRATEGIC SITESA strategic site is established for high-volume production and can supply worldwide
USA
BRAZIL
FRANCE
DENMARK
RUSSIA
CHINA
JAPAN
ALGERIA
39
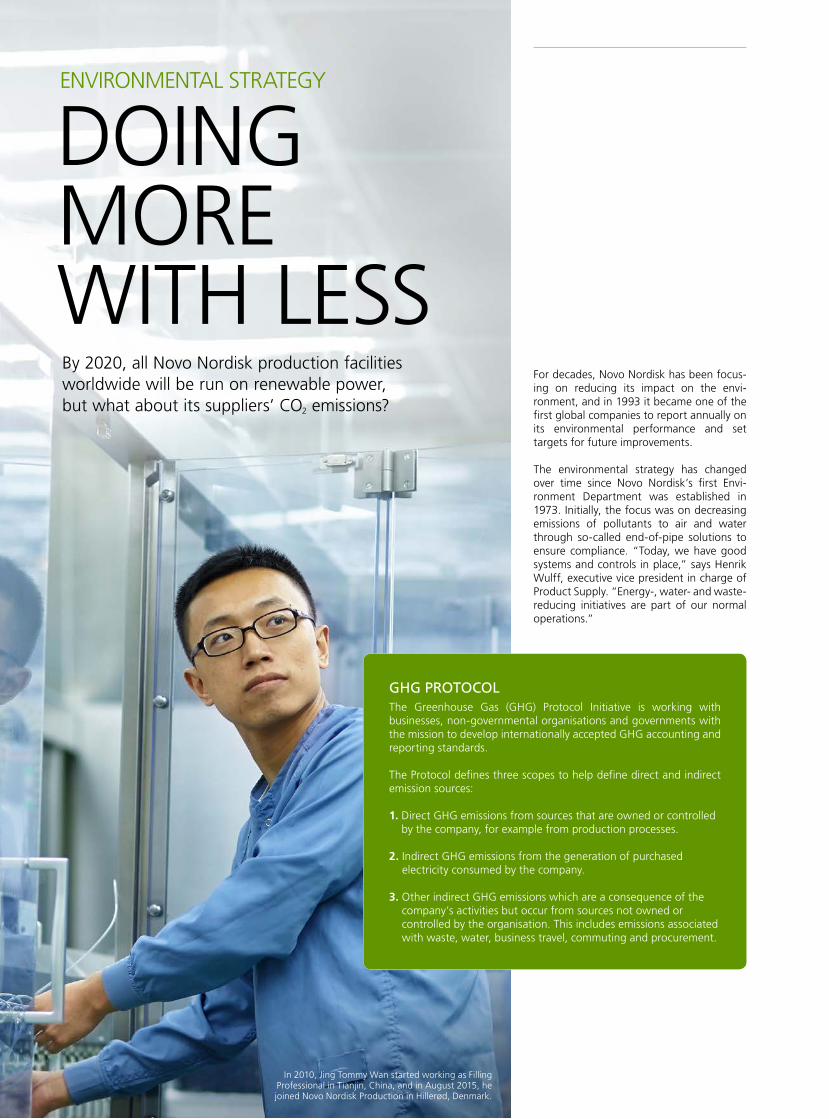
For decades, Novo Nordisk has been fo cus-ing on reducing its impact on the envi-ronment, and in 1993 it became one of the first global companies to report annually on its environmental performance and set targets for future improvements.
The environmental strategy has changed over time since Novo Nordisk’s first Envi-ronment Department was established in 1973. Initially, the focus was on decreasing emissions of pollutants to air and water through so-called end-of-pipe solutions to ensure compliance. “Today, we have good systems and controls in place,” says Henrik Wulff, executive vice president in charge of Product Supply. “Energy-, water- and waste-reducing initiatives are part of our normal operations.”
ENVIRONMENTAL STRATEGY
DOING MORE WITH LESSBy 2020, all Novo Nordisk production facilities worldwide will be run on renewable power, but what about its suppliers’ CO2 emissions?
GHG PROTOCOLThe Greenhouse Gas (GHG) Protocol Initiative is working with businesses, non-governmental organisations and governments with the mission to develop internationally accepted GHG accounting and reporting standards.
The Protocol defines three scopes to help define direct and indirect emission sources:
1. Direct GHG emissions from sources that are owned or controlled by the company, for example from production processes.
2. Indirect GHG emissions from the generation of purchased electricity consumed by the company.
3. Other indirect GHG emissions which are a consequence of the company’s activities but occur from sources not owned or controlled by the organisation. This includes emissions associated with waste, water, business travel, commuting and procurement.
In 2010, Jing Tommy Wan started working as Filling Professional in Tianjin, China, and in August 2015, he joined Novo Nordisk Production in Hillerød, Denmark.
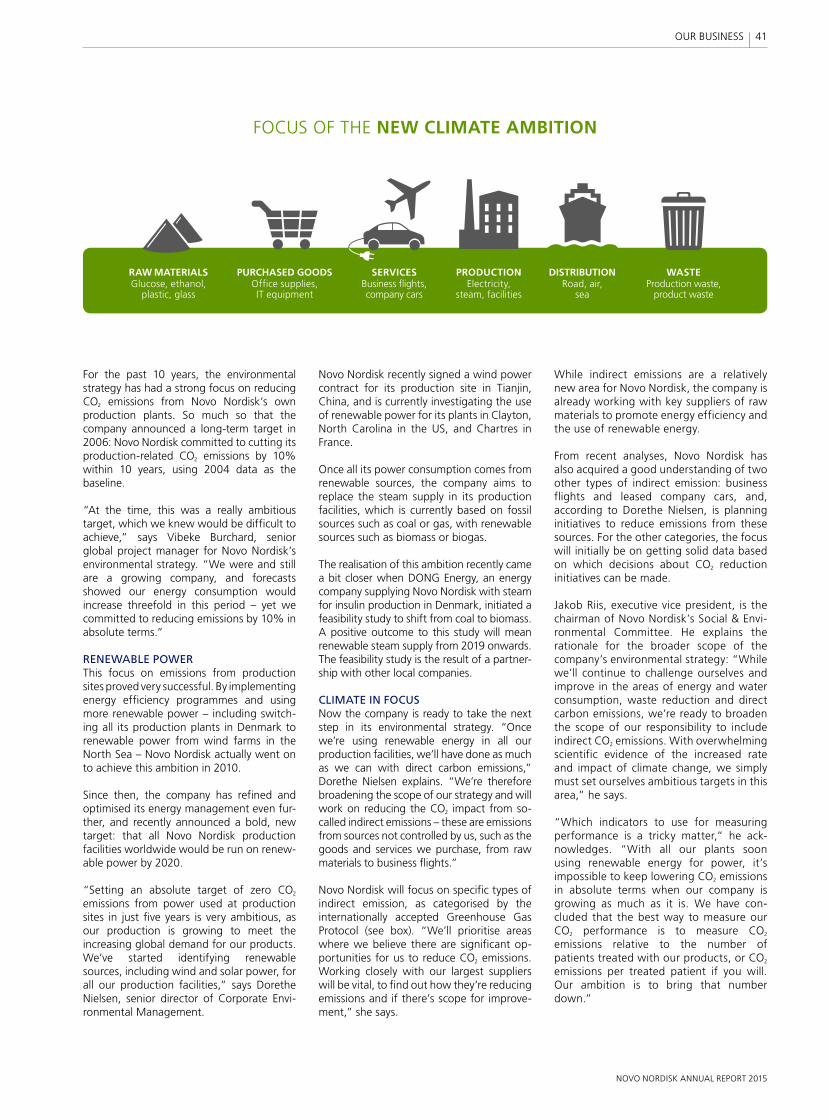
For the past 10 years, the environmental strategy has had a strong focus on reducing CO2 emissions from Novo Nordisk’s own production plants. So much so that the company announced a long-term target in 2006: Novo Nordisk committed to cutting its production-related CO2 emissions by 10% within 10 years, using 2004 data as the baseline.
“At the time, this was a really ambitious target, which we knew would be difficult to achieve,” says Vibeke Burchard, senior global project manager for Novo Nordisk’s environmental strategy. “We were and still are a growing company, and forecasts sho wed our energy consumption would in crease threefold in this period – yet we committed to reducing emissions by 10% in absolute terms.”
RENEWABLE POWERThis focus on emissions from production sites proved very successful. By implementing energy efficiency programmes and using more renewable power – including switch-ing all its production plants in Denmark to renewable power from wind farms in the North Sea – Novo Nordisk actually went on to achieve this ambition in 2010.
Since then, the company has refined and optimised its energy management even fur-ther, and recently announced a bold, new target: that all Novo Nordisk production facilities worldwide would be run on renew-able power by 2020.
“Setting an absolute target of zero CO2 emissions from power used at production sites in just five years is very ambitious, as our production is growing to meet the increasing global demand for our products. We’ve started identifying renewable sour ces, including wind and solar power, for all our production facilities,” says Dorethe Nielsen, senior director of Corporate Envi-ronmental Management.
Novo Nordisk recently signed a wind power contract for its production site in Tianjin, China, and is currently investigating the use of renewable power for its plants in Clayton, North Carolina in the US, and Chartres in France.
Once all its power consumption comes from renewable sources, the company aims to replace the steam supply in its production facilities, which is currently based on fossil sources such as coal or gas, with renewable sources such as biomass or biogas.
The realisation of this ambition recently came a bit closer when DONG Energy, an energy company supplying Novo Nordisk with steam for insulin production in Denmark, initiated a feasibility study to shift from coal to biomass. A positive outcome to this study will mean renewable steam supply from 2019 onwards. The feasibility study is the result of a partner-ship with other local companies.
CLIMATE IN FOCUSNow the company is ready to take the next step in its environmental strategy. “Once we’re using renewable energy in all our production facilities, we’ll have done as much as we can with direct carbon emis sions,” Dorethe Nielsen explains. “We’re therefore broadening the scope of our strategy and will work on reducing the CO2 impact from so-called indirect emissions – these are emissions from sources not controlled by us, such as the goods and services we purchase, from raw materials to business flights.”
Novo Nordisk will focus on specific types of indirect emission, as categorised by the internationally accepted Greenhouse Gas Protocol (see box). “We’ll prioritise areas where we believe there are significant op-portunities for us to reduce CO2 emissions. Working closely with our largest suppliers will be vital, to find out how they’re reducing emissions and if there’s scope for impro ve-ment,” she says.
While indirect emissions are a relatively new area for Novo Nordisk, the company is already working with key suppliers of raw materials to promote energy efficiency and the use of renewable energy.
From recent analyses, Novo Nordisk has also acquired a good understanding of two other types of indirect emission: business flights and leased company cars, and, according to Dorethe Nielsen, is planning initiatives to reduce emissions from these sources. For the other categories, the focus will initially be on getting solid data based on which decisions about CO2 reduction initiatives can be made. Jakob Riis, executive vice president, is the chairman of Novo Nordisk’s Social & Envi-ronmental Committee. He explains the rationale for the broader scope of the company’s environmental strategy: “While we’ll continue to challenge ourselves and improve in the areas of energy and water consumption, waste reduction and direct carbon emissions, we’re ready to broaden the scope of our responsibility to include indirect CO2 emissions. With overwhelming scientific evidence of the increased rate and impact of climate change, we simply must set ourselves ambitious targets in this area,” he says.
“Which indicators to use for measuring performance is a tricky matter,” he ack-nowledges. “With all our plants soon using renewable energy for power, it’s impossible to keep lowering CO2 emissions in absolute terms when our company is growing as much as it is. We have con-cluded that the best way to measure our CO2 performance is to measure CO2 emissions relative to the number of patients treated with our products, or CO2 emissions per treated patient if you will. Our ambition is to bring that number down.”
FOCUS OF THE NEW CLIMATE AMBITION
SERVICESBusiness flights, company cars
RAW MATERIALSGlucose, ethanol,
plastic, glass
WASTEProduction waste,
product waste
DISTRIBUTIONRoad, air,
sea
PRODUCTIONElectricity,
steam, facilities
PURCHASED GOODSOffice supplies, IT equipment
41
NOVO NORDISK ANNUAL REPORT 2015
OUR BUSINESS
Effective enterprise risk management is all about identifying risks early, assessing them accurately and taking action to mitigate them so that they will not prevent the company from achieving its business objectives. Sounds easy, but of course it is more complicated in reality. Fact is that a well-functioning risk management process is key to ensuring Novo Nordisk’s long-term business success because risks are everywhere and some of them can cause serious damage if managed poorly.
In the pharmaceutical industry, most risks fall into one of the seven categories listed on the notepad. And while Novo Nordisk’s overall risk profile – the consolidated assessment of all the risks facing Novo Nordisk – seldom changes significantly from year to year, individual risks do.
Jesper Brandgaard, Novo Nordisk’s chief financial officer, heads the company’s Risk Management Board. As an example of a risk that has increased in both likelihood and potential impact during 2015, he cites pressure on Novo Nordisk’s modern insulin prices in China, which is likely to grow in 2016 due to a new bidding reform which was implemented in June 2015.
Asked about risks that have become smaller during the year, Jesper Brandgaard mentions a regulatory risk associated with Tresiba®: “When we entered the year, we did not know whether the US FDA would approve Tresiba® based on interim data from the DEVOTE study. When it turned out that they did, we could remove that risk from our risk grid.” At the same time, he stresses that the final result of the DEVOTE study will not be known before the second half of 2016.
As another example, he mentions a specific legal risk, the product liability lawsuits in the US targeting incretin-based products, in-cluding Victoza®. In November, a federal judge handling most of the cases dismissed the cases against Novo Nordisk and other phar-maceutical companies. Although the ruling has been appealed, this means the likelihood of a significant financial impact from these cases has been reduced.
The following is an overview of the seven main types of risk that Novo Nordisk faces.
MANAGING
RISKSDELAYS OR FAILURE OF PIPELINE PRODUCTS Development of a new pharmaceutical product is an expensive undertaking that can take more than 10 years. It includes extensive non-clinical tests and clinical trials as well as an elaborate regulatory approval process, including approval of the production facilities. During the process, various hurdles may delay the development of a potential product candidate and add substantial expenses. In some cases, significant obstacles could lead to the company eventually deciding to abandon the development of the potential product candidate. Data from the pharmaceutical industry indicate that there is a less than 35% likelihood of a biologic diabetes product candidate in phase 1 ultimately being approved for marketing, while the like li-hood of success is around 60% for products in phase 2, rising to around 80% for products in phase 3. However, there is significant uncertainty regarding the timing and success of the regulatory approval process.
MARKET RISKS The principal market risks Novo Nordisk experiences are:• Price pressure and reimbursement restrictions by payers• The launch of new products by established competitors• Increased competition from producers of biosimilar medicines.
Europe, China and the US are all main markets for Novo Nordisk where payers – both governments and private payers – take measures to limit spending on medicines, typically by driving down prices, demanding higher rebates and/or restricting access to and reim-bursement of products. This is unlikely to change in the fore seeable future. For Novo Nordisk, reimbursement restrictions pose a sig-nificant risk when launching a new product such as Tresiba®. Despite the patient benefits and data supporting the health-eco nomic bene-fits of this new basal insulin, it is not always possible to obtain market access under what Novo Nordisk considers reason able conditions. In some countries, the company may therefore decide not to launch Tresiba® or other new products unless conditions change.
New products from established or new competitors are another inherent market risk. In the basal insulin segment, a competitor launched a biosimilar version of the best-selling modern insulin product in some markets in 2015 and is likely to launch in the US by the end of 2016. How and to what extent these events will change the market dynamics is difficult to assess at present. In addition to these global risks, in some countries in the International Operations region, political instability or armed conflicts may pose a risk to Novo Nordisk’s business for varying lengths of time.
SUPPLY DISRUPTIONS Failure or breakdown at one of Novo Nordisk’s or the company’s key suppliers’ vital production facilities could adversely affect business operations and potentially cause employee injuries or infrastructure damage. Mitigating actions include measures to prevent and respond to fires, annual inspections, back-up facilities and safety inventories. To reduce supply risks and optimise costs and logistics, Novo Nordisk has established production sites in several countries.
QUALITY AND PRODUCT SAFETY ISSUES Quality and product safety issues may arise if, for example, a production facility is not continuously in regulatory compliance, a product is not within specifications or if side effects that were not detected in clinical trials become apparent when a product is used for longer periods of time. Novo Nordisk proactively manages such risks through its quality
The pharmaceutical industry is associated with potentially serious risks that investors should keep in mind when making investment decisions. Novo Nordisk is no exception.
42
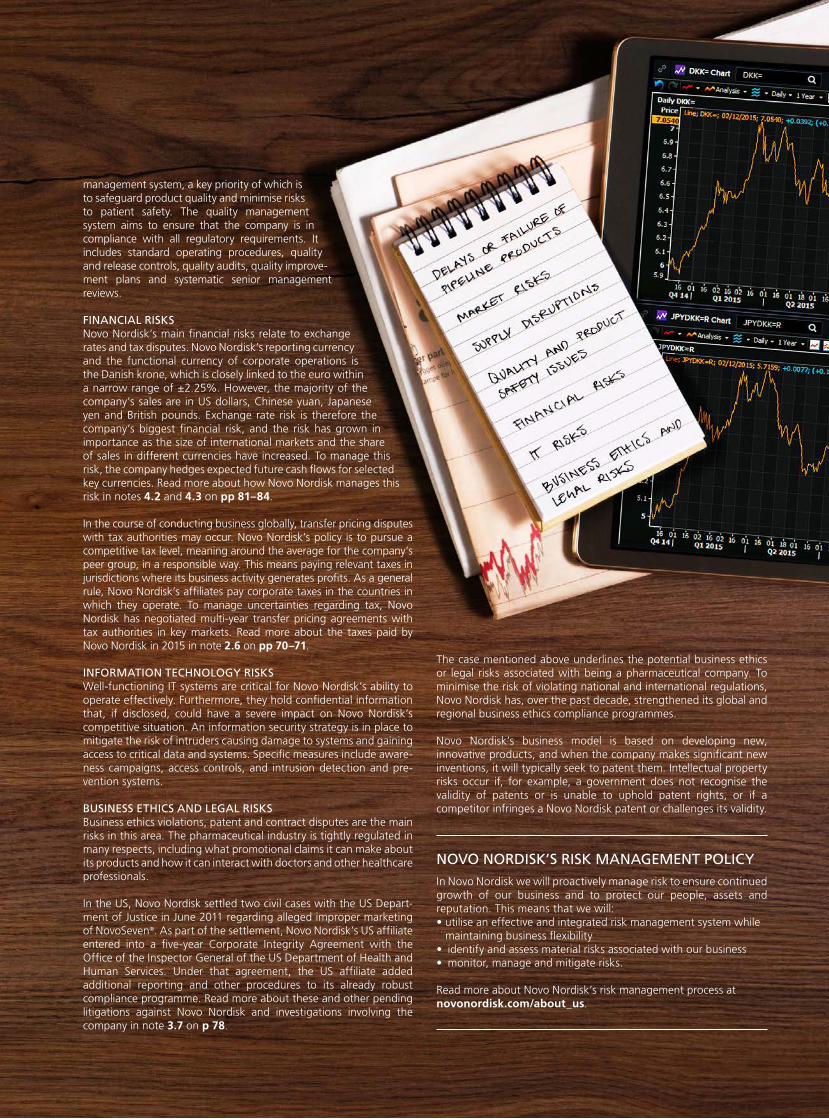
management system, a key priority of which is to safeguard product quality and minimise risks to patient safety. The quality management system aims to ensure that the company is in compliance with all regulatory requirements. It includes standard operating procedures, quality and release controls, quality audits, quality impro ve-ment plans and systematic senior manage ment reviews.
FINANCIAL RISKS Novo Nordisk’s main financial risks relate to exchange rates and tax disputes. Novo Nordisk’s reporting currency and the functional currency of corporate operations is the Danish krone, which is closely linked to the euro within a narrow range of ±2.25%. However, the majority of the company’s sales are in US dollars, Chinese yuan, Japanese yen and British pounds. Exchange rate risk is therefore the company’s biggest financial risk, and the risk has grown in importance as the size of international markets and the share of sales in different currencies have increased. To manage this risk, the company hedges expected future cash flows for selected key currencies. Read more about how Novo Nordisk manages this risk in notes 4.2 and 4.3 on pp 81–84.
In the course of conducting business globally, transfer pricing disputes with tax authorities may occur. Novo Nordisk’s policy is to pursue a competitive tax level, meaning around the average for the company’s peer group, in a responsible way. This means paying relevant taxes in jurisdictions where its business activity generates profits. As a general rule, Novo Nordisk’s affiliates pay corporate taxes in the countries in which they operate. To manage uncertainties regarding tax, Novo Nordisk has negotiated multi-year transfer pricing agreements with tax authorities in key markets. Read more about the taxes paid by Novo Nordisk in 2015 in note 2.6 on pp 70–71.
INFORMATION TECHNOLOGY RISKS Well-functioning IT systems are critical for Novo Nordisk’s ability to operate effectively. Furthermore, they hold confidential information that, if disclosed, could have a severe impact on Novo Nordisk’s competitive situation. An information security strategy is in place to mitigate the risk of intruders causing damage to systems and gaining access to critical data and systems. Specific measures include aware-ness campaigns, access controls, and intrusion detection and pre-vention systems.
BUSINESS ETHICS AND LEGAL RISKS Business ethics violations, patent and contract disputes are the main risks in this area. The pharmaceutical industry is tightly regulated in many respects, including what promotional claims it can make about its products and how it can interact with doctors and other healthcare professionals.
In the US, Novo Nordisk settled two civil cases with the US Depart-ment of Justice in June 2011 regarding alleged improper marketing of NovoSeven®. As part of the settlement, Novo Nordisk’s US affiliate entered into a five-year Corporate Integrity Agreement with the Office of the Inspector General of the US Department of Health and Human Services. Under that agreement, the US affiliate added additional reporting and other procedures to its already robust compliance programme. Read more about these and other pending litigations against Novo Nordisk and investigations involving the company in note 3.7 on p 78.
The case mentioned above underlines the potential business ethics or legal risks associated with being a pharmaceutical company. To minimise the risk of violating national and international regulations, Novo Nordisk has, over the past decade, strengthened its global and regional business ethics compliance programmes.
Novo Nordisk’s business model is based on developing new, innovative products, and when the company makes significant new inventions, it will typically seek to patent them. Intellectual property risks occur if, for example, a government does not recognise the validity of patents or is unable to uphold patent rights, or if a competitor infringes a Novo Nordisk patent or challenges its validity.
NOVO NORDISK’S RISK MANAGEMENT POLICYIn Novo Nordisk we will proactively manage risk to ensure continued growth of our business and to protect our people, assets and reputation. This means that we will: • utilise an effective and integrated risk management system while
maintaining business flexibility• identify and assess material risks associated with our business• monitor, manage and mitigate risks.
Read more about Novo Nordisk’s risk management process at novonordisk.com/about_us.

Through open and proactive communication, the company seeks to provide the basis for fair and efficient pricing of its shares.
SHARESAND CAPITAL STRUCTURE
SHARE CAPITAL AND OWNERSHIPNovo Nordisk’s total share capital of DKK 520,000,000 is divided into an A share capital of nominally DKK 107,487,200 and a B share capital of nominally DKK 412,512,800. The company’s A shares are not listed and are held by Novo A/S, a Danish public limited liability company wholly owned by the Novo Nordisk Foundation. The Foundation has a dual ob-jective: to provide a stable basis for the commercial and research activities conducted by the companies within the Novo Group (of which Novo Nordisk is the largest), and to support scientific and humanitarian purposes. According to the Articles of Association of the Foundation, the A shares cannot be divested. As of 31 December 2015, Novo A/S also held nominal value of DKK 32,762,800 of B share capital. Novo Nordisk’s B shares are listed on Nasdaq Copenhagen and on the New York Stock Exchange as American Depository Receipts (ADRs). Novo Nordisk’s A and B shares are calculated in units of DKK 0.20. Each A share carries 200 votes and each B share carries 20 votes. As Novo Nordisk’s B shares are in bearer form, no complete record of all shareholders exists. Based on available sources of information about the company’s shareholders as of 31 December 2015, it is estimated that shares were geographically distributed as shown in the chart on the opposite page. As of 31 December 2015, the free float of listed B shares was 89.5% (of which approximately 13.1% are listed as ADRs), excluding the Novo A/S holding and Novo Nordisk’s holding of treasury shares which, as of 31 December 2015, was DKK 10,433,741 nominally. For details about the share capital, see note 4.1 on pp 79–80.
CAPITAL STRUCTURE AND DIVIDEND POLICYNovo Nordisk’s Board of Directors and Executive Management consider that the current capital and share structure of Novo Nordisk serves the interests of the share-holders and the company well, providing strategic flexibility to pursue Novo Nordisk’s vision. Novo Nordisk’s capital structure stra t-egy offers a good balance between long-term shareholder value creation and com-petitive shareholder return in the short term. Novo Nordisk’s guiding principle is that any excess capital, after the funding of organic growth opportunities and potential acqui-sitions, should be returned to investors. The company’s dividend policy applies a pharma-
ceutical industry benchmark to ensure a competitive payout ratio for dividend pay-ments, which are complemented by share repurchase programmes. The Board of Dir-ectors plans to introduce an interim dividend in August, 2016. As illustrated on the right, Novo Nordisk has continuously increased both the payout ratio and the dividend paid over the last five years. The dividend for 2014 recorded in March 2015 was equal to DKK 5.00 per A and B share of DKK 0.20 as well as for ADRs. This corresponds to a payout ratio of 48.7%, which is broadly in-line with the 2014 pharma peer group average of 54%. For 2015, the Board of Directors will propose a dividend of DKK 6.40, which corresponds to a payout ratio of 46.6%. Adjusting for the partial divestment of NNIT A/S, where the net profit impact was returned to share-holders through a DKK 2.5 billion expansion of the 2015 share repurchase programme, the payout ratio will be 50.1%. Novo Nordisk does not pay a dividend on its holding of treasury shares. Shareholders’ enquiries concerning dividend payments and share-holder accounts should be addressed to Investor Service. Read more on the back cover.
During the 12-month period beginning 30 January 2015, Novo Nordisk repurchased shares worth DKK 17.5 billion. Since 2008, the share repurchase programme has primarily been conducted in accordance with the provisions of European Commission Regulation No 2273/2003 of 22 December 2003 (also known as the Safe Harbour Regulation). In such a programme, financial institutions are appointed as lead managers to execute the repurchases independently and without influence from Novo Nordisk.
SHARE REPURCHASE PROGRAMME FOR 2016/2017 For the next 12 months, Novo Nordisk has decided to implement a new share re-purchase programme. The expected total repurchase value of B shares amounts to a cash value of up to DKK 14 billion. Novo Nordisk expects to implement the majority of the new share repurchase programme according to the Safe Harbour Regulation. The size of the 2016 share repurchase programme is adjusted for the impact of the interim dividend. In March 2016, at the Annual General Meeting, the Board of Directors will propose a further reduction in the company’s B share capital, corresponding
to approximately 1.92% of the total share capital, by cancelling 50,000,000 treasury shares. After the imple mentation of the share capital reduction, Novo Nordisk’s share capital will amount to DKK 510,000,000, divided into A share ca pital of DKK 107,487,200 and B share capital of DKK 402,512,800.
SHARE PRICE DEVELOPMENTNovo Nordisk’s share price increased by 54% between its 2014 close of DKK 260.3 and the 30 December 2015 close of DKK 399.9. For comparison, the Danish OMXC20 CAP stock index increased by 29% and the pharma peer group increased by 4% during 2015. The increase in Novo Nordisk’s share price during 2015 reflects its sustained leadership position in the growing diabetes care market, coupled with a continued improvement in operating margins and the progress of key R&D projects, including the approval of Tresiba® in the US and the cli n-ical progress with the novel GLP-1 analogue semaglutide. The total market value of Novo Nordisk’s B shares, excluding treasury sha res, was DKK 804 billion as of 30 December 2015.
COMMUNICATION WITH SHAREHOLDERS To keep investors updated about perfor m-ance and the progress of clinical devel-opment programmes, Novo Nordisk hosts conference calls with Executive Management following key events and the release of financial results. Executive Management and Investor Relations also travel extensively to ensure that all investors with a major holding of Novo Nordisk shares can meet with the company on a regular basis and that a number of other investors and poten-tial investors also have access to the company’s Management and Investor Relations.
ANALYST COVERAGENovo Nordisk is currently covered by 37 sell-side analysts, including the major global investment banks that regularly produce research reports on Novo Nordisk. A list of analysts covering Novo Nordisk can be found at novonordisk.com under ‘Investors’. Company announcements from 1995 onwards, financial, social and environmental results, a calendar of investor-relevant events, investor presentations, background information and so on are also available.
44
NOVO NORDISK ANNUAL REPORT 2015
GOVERNANCE, LEADERSHIP AND SHARES
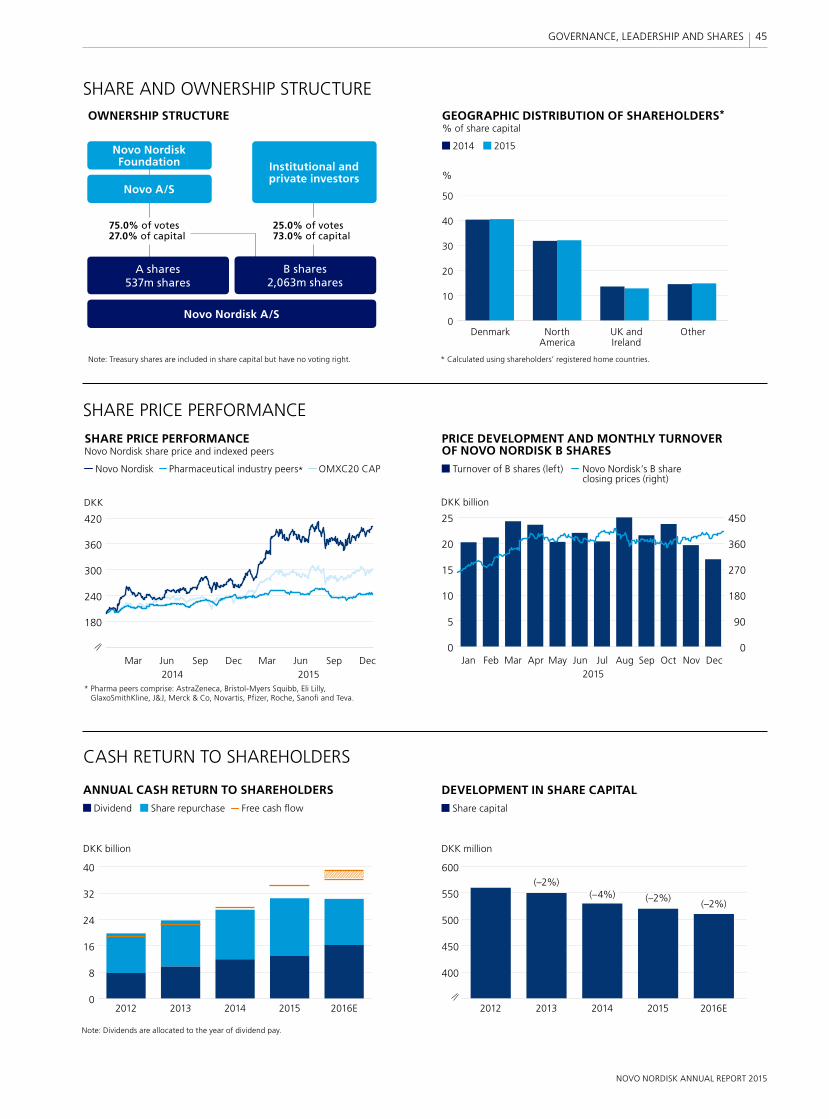
0
8
16
24
32
40
400
450
500
550
600
DEVELOPMENT IN SHARE CAPITAL Share capital
DKK million
%
DKK billion
SHARE AND OWNERSHIP STRUCTURE
SHARE PRICE PERFORMANCE
CASH RETURN TO SHAREHOLDERS
ANNUAL CASH RETURN TO SHAREHOLDERS Dividend Share repurchase Free cash flow
GEOGRAPHIC DISTRIBUTION OF SHAREHOLDERS*% of share capital
2014 2015
Denmark North UK and Other America Ireland
* Calculated using shareholders’ registered home countries.
Note: Dividends are allocated to the year of dividend pay.
0
10
20
30
40
50
2012 2012
(–2%)
(–2%)(–2%)
2013 20132014 20142015 20152016E 2016E
Note: Treasury shares are included in share capital but have no voting right.
OWNERSHIP STRUCTURE
Novo Nordisk Foundation
Novo A/S
Institutional and private investors
75.0% of votes27.0% of capital
25.0% of votes73.0% of capital
B shares2,063m shares
A shares537m shares
Novo Nordisk A/S
(–4%)
SHARE PRICE PERFORMANCE Novo Nordisk share price and indexed peers
Novo Nordisk Pharmaceutical industry peers* OMXC20 CAP
DKK
* Pharma peers comprise: AstraZeneca, Bristol-Myers Squibb, Eli Lilly, GlaxoSmithKline, J&J, Merck & Co, Novartis, Pfizer, Roche, Sanofi and Teva.
180
240
300
360
420
Mar Jun Sep Dec Mar Jun Sep Dec2014 2015
PRICE DEVELOPMENT AND MONTHLY TURNOVER OF NOVO NORDISK B SHARES Turnover of B shares (left) Novo Nordisk’s B share
closing prices (right)
0
5
10
15
20
25
0
90
180
270
360
450
Jan Feb Mar Apr May Jun Jul Aug Sep Oct Nov Dec2015
DKK billion
45
NOVO NORDISK ANNUAL REPORT 2015
GOVERNANCE, LEADERSHIP AND SHARES

GOVERNANCE STRUCTURESHAREHOLDERSShareholders have ultimate authority over the company and exercise their rights to make decisions at general meetings. Resolutions can generally be passed by a simple majority. However, resolutions to amend the Articles of Association require two-thirds of votes cast and capital represented, unless other adoption requirements are imposed by the Danish Companies Act.
At the annual general meeting, shareholders approve the annual report and any amendments to the company’s Articles of Association. Shareholders also elect board members and the independent auditor.
Novo Nordisk’s share capital is divided into A and B shares. Special rights attached to A shares include pre-emptive subscription rights in the event of an increase in the A share capital and pre-emptive purchase rights in the event of a sale of A shares, while B shares take priority for liquidation proceedings.* Read more about shares and capital structure on p 44.
BOARD OF DIRECTORSNovo Nordisk has a two-tier management structure consisting of the Board of Directors and Executive Management. The two bodies are separate and no one serves as a member of both. The Board of Directors determines the company’s overall strategy and follows up on its implementation, supervises the performance, ensures adequate management and organisation and, as such, actively contributes to developing the company as a focused, sustainable, global pharma-ceutical company. The Board of Directors supervises Executive Man-agement in its decisions and operations. The Board of Directors may also issue new shares or buy back shares in accordance with authorisations granted by the annual general meeting and recorded in the meeting minutes. For minutes from annual general meetings,
see novonordisk.com/about_us. The Board of Directors has 12 mem-bers, eight of whom are elected by shareholders and four by employees in Denmark. Novo Nordisk’s Board of Directors met seven times during 2015.
Shareholder-elected board members serve a one-year term and may be re-elected. Members must retire at the first annual general meeting after reaching the age of 70. Five of the eight shareholder-elected board members are independent as defined by the Danish
Corporate Governance Recommendations. Read more on pp 52–53.
A proposal for nomination of board members is presented by the Nomination Committee to the Board of Directors, taking
into account required competences as defined by the Board of Directors’ competence profile and reflecting
* A shares take priority for dividends below 0.5%. B shares take priority for dividends between 0.5 and 5%. However, in practice,
A shares and B shares receive the same amount of dividend per share. The dividend per share approved at the Annual
General Meeting in March 2015 was DKK 5 for all shares of DKK 0.20, equivalent to a dividend percentage of
2,500%, making the dividend differentiation in the Articles of Association less relevant.
In 2015, the Board of Directors reached its diversity targets as set out in 2013 and consequently increased its diversity ambition even further by setting out new targets for 2019. The Board of Directors established a Remuneration Committee to enhance the process for preparing proposals for the remuneration of the Board of Directors and Executive Management. Furthermore, the Board of Directors decided to reorganise Executive Management to enhance the Board’s visibility of Novo Nordisk’s international business operations and support further development of key leadership talents.
CORPORATE GOVERNANCE

CONTINUED
the result of a self-assessment process facilitated by internal or external consultants. The assessment process is based on written questionnaires and evaluates the Board of Directors’ composition and the skills of its members, including whether each board member and executive participates actively in board discussions and contributes with independent judgement.
To ensure that discussions include multiple perspectives representing the complex, global pharmaceutical environment, the Board of Directors aspires to be diverse in gender and nationality. Currently, three shareholder-elected board members are female and six of the eight shareholder-elected board members are non-Danes. In 2015, the Board of Directors increased its diversity ambition further and set out new targets with the aim that by 2019 it will consist of at least two shareholder-elected board members with Nordic nationality and at least two shareholder-elected board members with a nationality other than Nordic – and at least four shareholder-elected board members of each gender. In accordance with section 99b of the Danish Financial Statements Act, Novo Nordisk discloses its diversity policy, targets and current performance in the UN Global Compact Communication on Progress, which is available at novonordisk.com/annualreport.
The self-assessment conducted in 2015 was facilitated internally and revealed continued strong performance by the Board and Executive Management. The process also resulted in the identification of a number of areas within research, manufacturing and sales where more insight will be provided to the Board. In order to support continued fulfilment of the Novo Nordisk Way, criteria for board members include integrity, accountability, fairness, financial literacy, commitment and desire for innovation. Members are also expected to have experience of managing major companies that develop, manufacture and market products and services globally. The competence profile, which includes the nomination criteria, is avai l-able at novonordisk.com/about_us.
Under Danish law, Novo Nordisk’s employees in Denmark are entitled to be represented by half of the total number of board members elected at the annual general meeting. In 2014, employees elected four board members from among themselves – two male and two female, all Danes. Board members elected by employees serve a four-year term and have the same rights, duties and responsibilities as shareholder-elected board members.
CHAIRMANSHIPThe annual general meeting directly elects the chairman and the vice chairman of the Board of Directors. The Chairmanship carries out administrative tasks, such as planning board meetings to ensure a balance between overall strategy-setting and financial and managerial supervision of the company. Other tasks include review-ing the fixed asset investment portfolio. In March 2015, the Annual
General Meeting re-elected the Chairman, Göran Ando, and the Vice Chairman, Jeppe Christiansen. See novonordisk.com/about_us for a report on the Chairmanship’s activities.
AUDIT COMMITTEEThe four members of the Audit Committee are elected by the Board of Directors from among its members. Pursuant to the US Securities Exchange Act, two members qualify as independent while two members rely on an exemption to the independence requirements. In addition, two members have been designated as financial experts as defined by the US Securities and Exchange Commission (SEC). Under Danish law, two members qualify as independent – of whom one also qualifies as financial expert. One member is an employee representative. The Audit Committee assists the Board of Directors with oversight of the external auditors, the internal audit function, the procedure for handling complaints regarding accounting, internal accounting controls, auditing or financial reporting matters and business ethics matters, financial, social and environmental reporting, business ethics compliance, post-completion reviews and post-investment reviews, long-term incentive programmes and infor-mation security. In 2015, the Board of Directors elected Liz Hewitt as Chairman and Jeppe Christiansen, Sylvie Grégoire and Stig Strøbæk as members. Eivind Kolding was elected as an observer on the Audit Committee. See novonordisk.com/about_us for a report on the Audit Committee’s activities.
NOMINATION COMMITTEEThe Nomination Committee consists of five members. Three members qualify as independent, while one member is an employee representative. The Nomination Committee assists the Board with oversight of the competence profile and composition of the Board, nomination of members and committees, and other tasks on an ad hoc basis as specifically decided by the Board. In 2015, the Board of Directors elected Göran Ando as Chairman and Bruno Angelici, Liz Hewitt, Liselotte
Hyveled and Mary Szela as members. See novonordisk.com\about_us for a report on the Nomination Committee’s activities.
REMUNERATION COMMITTEEThe Board of Directors established a Remuneration Committee in 2015. The Remuneration Committee consists of five members. Two members qualify as independent, while one member is an employee representative. The chairman of the committee is not independent. The Remuneration Committee assists the Board with oversight of the remuneration policy as well as the actual remuneration of board members, its committees and Executive Management. In 2015, the Board of Directors elected Göran Ando as Chairman and Jeppe Christiansen, Thomas Paul Koestler, Søren Thuesen Pedersen and Mary Szela as members. See novonordisk.com\about_us for a report on the Remuneration Committee’s activities.
47
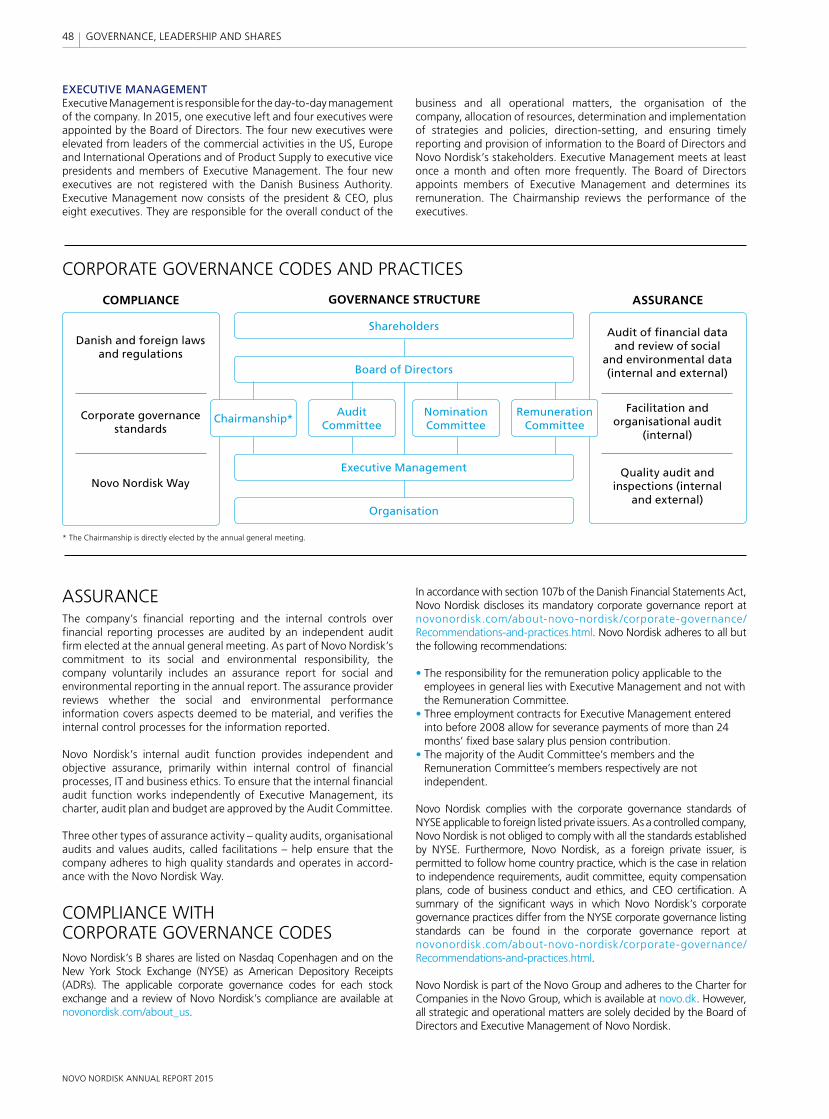
CORPORATE GOVERNANCE CODES AND PRACTICES
COMPLIANCE ASSURANCEGOVERNANCE STRUCTURE
Danish and foreign laws and regulations
Corporate governance standards
Novo Nordisk Way
Audit of financial data and review of social
and environmental data (internal and external)
Facilitation and organisational audit
(internal)
Quality audit and inspections (internal
and external)
Board of Directors
Shareholders
Executive Management
Organisation
Chairmanship*Nomination Committee
Remuneration Committee
Audit Committee
* The Chairmanship is directly elected by the annual general meeting.
EXECUTIVE MANAGEMENTExecutive Management is responsible for the day-to-day management of the company. In 2015, one executive left and four executives were appointed by the Board of Directors. The four new executives were elevated from leaders of the commercial activities in the US, Europe and International Operations and of Product Supply to executive vice presidents and members of Executive Management. The four new executives are not registered with the Danish Business Authority. Executive Management now consists of the president & CEO, plus eight executives. They are responsible for the overall conduct of the
business and all operational matters, the organisation of the company, allocation of resources, determination and implementation of strategies and policies, direction-setting, and ensuring timely reporting and provision of information to the Board of Directors and Novo Nordisk’s stakeholders. Executive Management meets at least once a month and often more frequently. The Board of Directors appoints members of Executive Management and determines its remuneration. The Chairmanship reviews the performance of the executives.
ASSURANCEThe company’s financial reporting and the internal controls over financial reporting processes are audited by an independent audit firm elected at the annual general meeting. As part of Novo Nordisk’s commitment to its social and environmental responsibility, the company voluntarily includes an assurance report for social and environmental reporting in the annual report. The assurance provider reviews whether the social and environmental performance information covers aspects deemed to be material, and verifies the internal control processes for the information reported.
Novo Nordisk’s internal audit function provides independent and objective assurance, primarily within internal control of financial processes, IT and business ethics. To ensure that the internal financial audit function works independently of Executive Management, its charter, audit plan and budget are approved by the Audit Committee.
Three other types of assurance activity – quality audits, organisational audits and values audits, called facilitations – help ensure that the company adheres to high quality standards and operates in accor d-ance with the Novo Nordisk Way.
COMPLIANCE WITH CORPORATE GOVERNANCE CODESNovo Nordisk’s B shares are listed on Nasdaq Copenhagen and on the New York Stock Exchange (NYSE) as American Depository Receipts (ADRs). The applicable corporate governance codes for each stock exchange and a review of Novo Nordisk’s compliance are available at novonordisk.com/about_us.
In accordance with section 107b of the Danish Financial Statements Act, Novo Nordisk discloses its mandatory corporate governance report at novonordisk.com/about-novo-nordisk /corporate-governance/Recommendations-and-practices.html. Novo Nordisk adheres to all but the following recommendations:
• The responsibility for the remuneration policy applicable to the employees in general lies with Executive Management and not with the Remuneration Committee.
• Three employment contracts for Executive Management entered into before 2008 allow for severance payments of more than 24 months’ fixed base salary plus pension contribution.
• The majority of the Audit Committee’s members and the Remuneration Committee’s members respectively are not independent.
Novo Nordisk complies with the corporate governance standards of NYSE applicable to foreign listed private issuers. As a controlled company, Novo Nordisk is not obliged to comply with all the standards established by NYSE. Furthermore, Novo Nordisk, as a foreign private issuer, is permitted to follow home country practice, which is the case in relation to independence requirements, audit committee, equity compensation plans, code of business conduct and ethics, and CEO certification. A summary of the significant ways in which Novo Nordisk’s corporate governance practices differ from the NYSE corporate governance listing standards can be found in the corporate governance report at novonordisk.com/about-novo-nordisk /corporate-governance/Recommendations-and-practices.html.
Novo Nordisk is part of the Novo Group and adheres to the Charter for Companies in the Novo Group, which is available at novo.dk. However, all strategic and operational matters are solely decided by the Board of Directors and Executive Management of Novo Nordisk.
48
NOVO NORDISK ANNUAL REPORT 2015
GOVERNANCE, LEADERSHIP AND SHARES
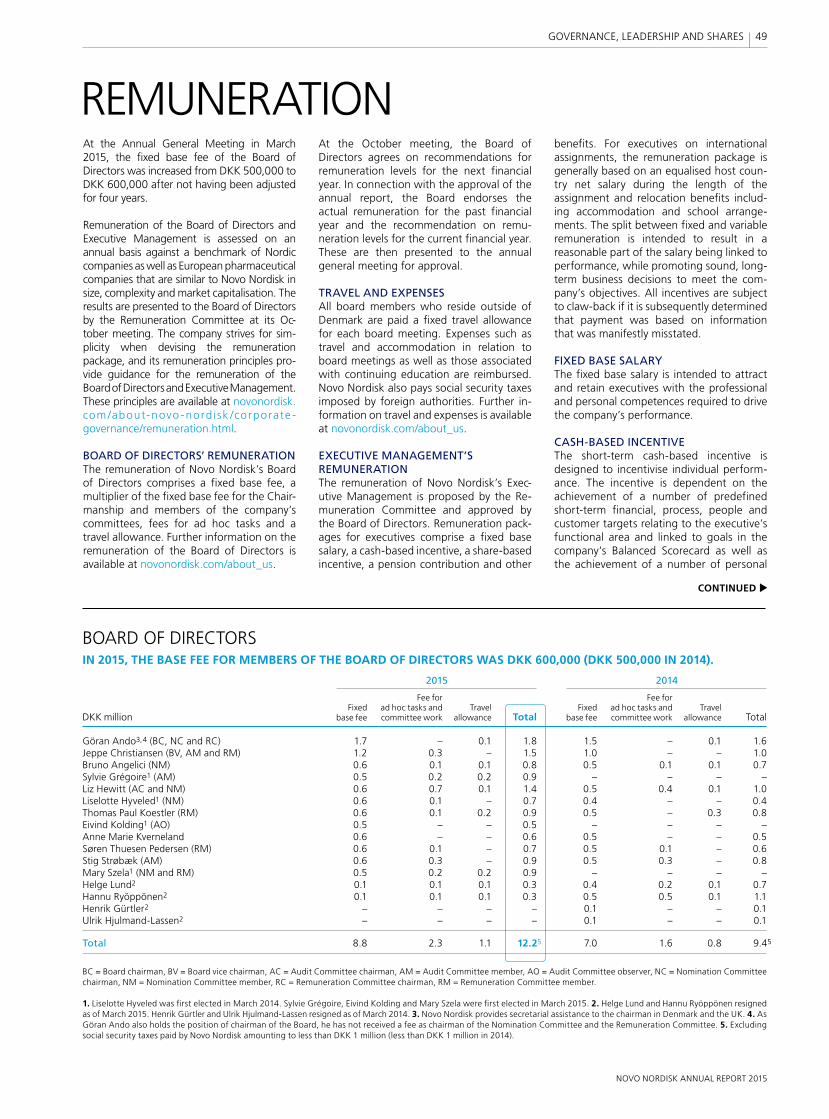
BOARD OF DIRECTORSIN 2015, THE BASE FEE FOR MEMBERS OF THE BOARD OF DIRECTORS WAS DKK 600,000 (DKK 500,000 IN 2014).
2015 2014
Fee for Fee for Fixed ad hoc tasks and Travel Fixed ad hoc tasks and Travel DKK million base fee committee work allowance Total base fee committee work allowance Total
Göran Ando3,4 (BC, NC and RC) 1.7 – 0.1 1.8 1.5 – 0.1 1.6Jeppe Christiansen (BV, AM and RM) 1.2 0.3 – 1.5 1.0 – – 1.0Bruno Angelici (NM) 0.6 0.1 0.1 0.8 0.5 0.1 0.1 0.7Sylvie Grégoire1 (AM) 0.5 0.2 0.2 0.9 – – – –Liz Hewitt (AC and NM) 0.6 0.7 0.1 1.4 0.5 0.4 0.1 1.0Liselotte Hyveled1 (NM) 0.6 0.1 – 0.7 0.4 – – 0.4Thomas Paul Koestler (RM) 0.6 0.1 0.2 0.9 0.5 – 0.3 0.8Eivind Kolding1 (AO) 0.5 – – 0.5 – – – –Anne Marie Kverneland 0.6 – – 0.6 0.5 – – 0.5Søren Thuesen Pedersen (RM) 0.6 0.1 – 0.7 0.5 0.1 – 0.6Stig Strøbæk (AM) 0.6 0.3 – 0.9 0.5 0.3 – 0.8Mary Szela1 (NM and RM) 0.5 0.2 0.2 0.9 – – – –Helge Lund2 0.1 0.1 0.1 0.3 0.4 0.2 0.1 0.7Hannu Ryöppönen2 0.1 0.1 0.1 0.3 0.5 0.5 0.1 1.1Henrik Gürtler2 – – – – 0.1 – – 0.1Ulrik Hjulmand-Lassen2 – – – – 0.1 – – 0.1
Total 8.8 2.3 1.1 12.25 7.0 1.6 0.8 9.45
BC = Board chairman, BV = Board vice chairman, AC = Audit Committee chairman, AM = Audit Committee member, AO = Audit Committee observer, NC = Nomination Committee chairman, NM = Nomination Committee member, RC = Remuneration Committee chairman, RM = Remuneration Committee member.
1. Liselotte Hyveled was fi rst elected in March 2014. Sylvie Grégoire, Eivind Kolding and Mary Szela were fi rst elected in March 2015. 2. Helge Lund and Hannu Ryöppönen resigned as of March 2015. Henrik Gürtler and Ulrik Hjulmand-Lassen resigned as of March 2014. 3. Novo Nordisk provides secretarial assistance to the chairman in Denmark and the UK. 4. As Göran Ando also holds the position of chairman of the Board, he has not received a fee as chairman of the Nomination Committee and the Remuneration Committee. 5. Excluding social security taxes paid by Novo Nordisk amounting to less than DKK 1 million (less than DKK 1 million in 2014).
REMUNERATIONAt the Annual General Meeting in March 2015, the fixed base fee of the Board of Directors was increased from DKK 500,000 to DKK 600,000 after not having been adjusted for four years.
Remuneration of the Board of Directors and Executive Management is assessed on an annual basis against a benchmark of Nordic companies as well as European pharmaceutical companies that are similar to Novo Nordisk in size, complexity and market capitalisation. The results are presented to the Board of Directors by the Remuneration Committee at its Oc-tober meeting. The company strives for sim-plicity when devising the remuneration package, and its remuneration principles pro-vide guidance for the remuneration of the Board of Directors and Executive Management. These principles are available at novonordisk.com /about-novo -nord isk /corporate -governance/remuneration.html.
BOARD OF DIRECTORS’ REMUNERATION The remuneration of Novo Nordisk’s Board of Directors comprises a fixed base fee, a multiplier of the fixed base fee for the Chair-manship and members of the company’s committees, fees for ad hoc tasks and a travel allowance. Further information on the remuneration of the Board of Directors is available at novonordisk.com/about_us.
At the October meeting, the Board of Directors agrees on recommendations for remuneration levels for the next financial year. In connection with the approval of the annual report, the Board endorses the actual remuneration for the past financial year and the recommendation on remu-neration levels for the current financial year. These are then presented to the annual general meeting for approval.
TRAVEL AND EXPENSESAll board members who reside outside of Denmark are paid a fixed travel allowance for each board meeting. Expenses such as travel and accommodation in relation to board meetings as well as those associated with continuing education are reimbursed. Novo Nordisk also pays social security taxes imposed by foreign authorities. Further in-formation on travel and expenses is available at novonordisk.com/about_us.
EXECUTIVE MANAGEMENT’S REMUNERATIONThe remuneration of Novo Nordisk’s Exec-utive Management is proposed by the Re-muneration Committee and approved by the Board of Directors. Remuneration pa ck-ages for executives comprise a fixed base salary, a cash-based incentive, a share-based incentive, a pension contribution and other
benefits. For executives on international assignments, the remuneration package is generally based on an equalised host co un-try net salary during the length of the assignment and relocation benefits includ-ing accommodation and school arrange-ments. The split between fixed and variable remuneration is intended to result in a reasonable part of the salary being linked to performance, while promoting sound, long-term business decisions to meet the com-pany’s objectives. All incentives are subject to claw-back if it is subsequently determined that payment was based on information that was manifestly misstated.
FIXED BASE SALARYThe fixed base salary is intended to attract and retain executives with the professional and personal competences required to drive the company’s performance.
CASH-BASED INCENTIVEThe short-term cash-based incentive is designed to incentivise individual perfor m-ance. The incentive is dependent on the achievement of a number of predefined short-term financial, process, people and customer targets relating to the executive’s functional area and linked to goals in the company’s Balanced Scorecard as well as the achievement of a number of personal
CONTINUED
49
NOVO NORDISK ANNUAL REPORT 2015
GOVERNANCE, LEADERSHIP AND SHARES
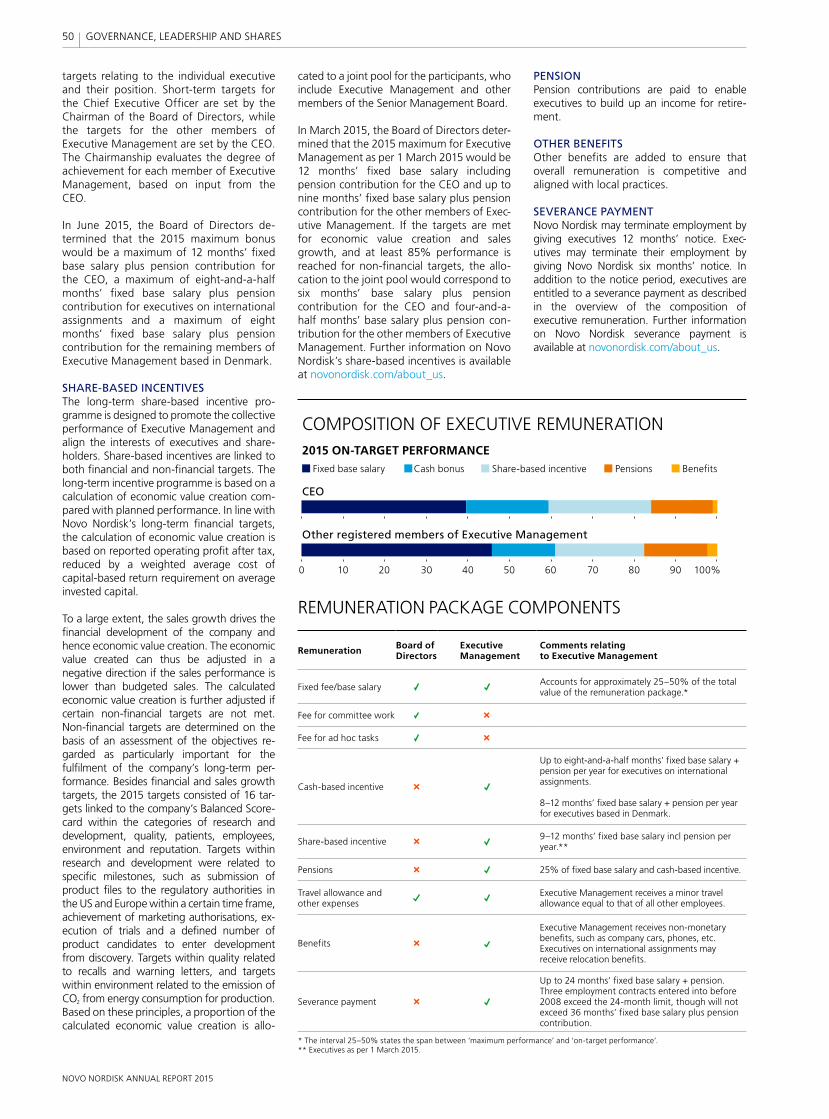
targets relating to the individual executive and their position. Short-term targets for the Chief Executive Officer are set by the Chairman of the Board of Directors, while the targets for the other members of Executive Management are set by the CEO. The Chairmanship evaluates the degree of achievement for each member of Executive Management, based on input from the CEO.
In June 2015, the Board of Directors de-termined that the 2015 maximum bonus would be a maximum of 12 months’ fixed base salary plus pension contribution for the CEO, a maximum of eight-and-a-half months’ fixed base salary plus pension contribution for executives on international assignments and a maximum of eight months’ fixed base salary plus pension contribution for the remaining members of Executive Management based in Denmark.
SHARE-BASED INCENTIVESThe long-term share-based incentive pro-gramme is designed to promote the collective performance of Executive Management and align the interests of executives and share-holders. Share-based incentives are linked to both financial and non-financial targets. The long-term incentive programme is based on a calculation of economic value creation com-pared with planned performance. In line with Novo Nordisk’s long-term financial targets, the calculation of economic value creation is based on reported operating profit after tax, reduced by a weighted average cost of cap i tal-based return requirement on average invested capital.
To a large extent, the sales growth drives the financial development of the company and hence economic value creation. The economic value created can thus be adjusted in a negative direction if the sales performance is lower than budgeted sales. The calculated economic value creation is further adjusted if certain non-financial targets are not met. Non-financial targets are determined on the basis of an assessment of the objectives re-garded as particularly important for the fulfilment of the company’s long-term per - for m ance. Besides financial and sales growth targets, the 2015 targets consisted of 16 tar-gets linked to the company’s Balanced Score-card within the categories of research and development, quality, patients, employees, environment and reputation. Targets within research and development were related to specific milestones, such as submission of product files to the regulatory authorities in the US and Europe within a certain time frame, achievement of marketing authorisations, ex-ecution of trials and a defined number of product candidates to enter development from discovery. Targets within quality related to recalls and warning letters, and targets within environment related to the emission of CO2 from energy consumption for production.Based on these principles, a proportion of the calculated economic value creation is allo-
cated to a joint pool for the participants, who include Executive Management and other members of the Senior Management Board. In March 2015, the Board of Directors deter-mined that the 2015 maximum for Executive Management as per 1 March 2015 would be 12 months’ fixed base salary including pension contribution for the CEO and up to nine months’ fixed base salary plus pension contribution for the other members of Exec-utive Management. If the targets are met for economic value creation and sales growth, and at least 85% performance is reached for non-financial targets, the allo-cation to the joint pool would correspond to six months’ base salary plus pension contribution for the CEO and four-and-a-half months’ base salary plus pension con-tribution for the other members of Executive Management. Further information on Novo Nordisk’s share-based incentives is available at novonordisk.com/about_us.
* The interval 25–50% states the span between ‘maximum performance’ and ‘on-target performance’.** Executives as per 1 March 2015.
REMUNERATION PACKAGE COMPONENTS
Remuneration Board of Directors
Executive Management
Comments relating to Executive Management
Fixed fee/base salary Accounts for approximately 25–50% of the total value of the remuneration package.*
Fee for committee work
Fee for ad hoc tasks
Cash-based incentive
Up to eight-and-a-half months’ fixed base salary + pension per year for executives on international assignments.
8–12 months’ fixed base salary + pension per year for executives based in Denmark.
Share-based incentive 9–12 months’ fixed base salary incl pension per year.**
Pensions 25% of fixed base salary and cash-based incentive.
Travel allowance and other expenses
Executive Management receives a minor travel allowance equal to that of all other employees.
Benefits
Executive Management receives non-monetary benefits, such as company cars, phones, etc. Executives on international assignments may receive relocation benefits.
Severance payment
Up to 24 months’ fixed base salary + pension. Three employment contracts entered into before 2008 exceed the 24-month limit, though will not exceed 36 months’ fixed base salary plus pension contribution.
PENSIONPension contributions are paid to enable executives to build up an income for retire-ment.
OTHER BENEFITSOther benefits are added to ensure that overall remuneration is competitive and aligned with local practices.
SEVERANCE PAYMENTNovo Nordisk may terminate employment by giving executives 12 months’ notice. Exec-utives may terminate their employment by giving Novo Nordisk six months’ notice. In addition to the notice period, executives are entitled to a severance payment as described in the overview of the composition of executive remuneration. Further information on Novo Nordisk severance payment is available at novonordisk.com/about_us.
COMPOSITION OF EXECUTIVE REMUNERATION
0
2015 ON-TARGET PERFORMANCE Fixed base salary Cash bonus Share-based incentive Pensions Benefits
CEO
10 20 30 40 50 60 70 80 90 100%
Other registered members of Executive Management
50
NOVO NORDISK ANNUAL REPORT 2015
GOVERNANCE, LEADERSHIP AND SHARES
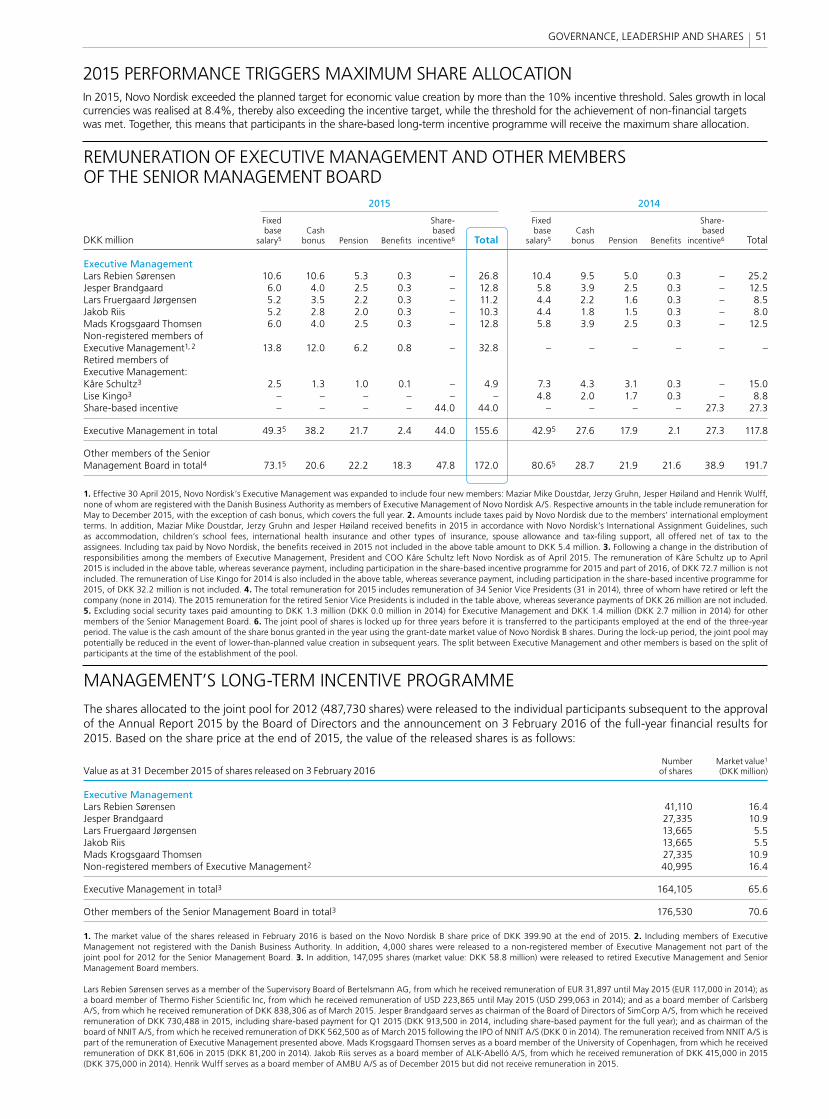
MANAGEMENT’S LONG-TERM INCENTIVE PROGRAMME
The shares allocated to the joint pool for 2012 (487,730 shares) were released to the individual participants subsequent to the approval of the Annual Report 2015 by the Board of Directors and the announcement on 3 February 2016 of the full-year fi nancial results for 2015. Based on the share price at the end of 2015, the value of the released shares is as follows:
Number Market value1
Value as at 31 December 2015 of shares released on 3 February 2016 of shares (DKK million)
Executive ManagementLars Rebien Sørensen 41,110 16.4Jesper Brandgaard 27,335 10.9Lars Fruergaard Jørgensen 13,665 5.5Jakob Riis 13,665 5.5Mads Krogsgaard Thomsen 27,335 10.9Non-registered members of Executive Management2 40,995 16.4
Executive Management in total3 164,105 65.6
Other members of the Senior Management Board in total3 176,530 70.6
1. The market value of the shares released in February 2016 is based on the Novo Nordisk B share price of DKK 399.90 at the end of 2015. 2. Including members of Executive Management not registered with the Danish Business Authority. In addition, 4,000 shares were released to a non-registered member of Executive Management not part of the joint pool for 2012 for the Senior Management Board. 3. In addition, 147,095 shares (market value: DKK 58.8 million) were released to retired Executive Management and Senior Management Board members.
Lars Rebien Sørensen serves as a member of the Supervisory Board of Bertelsmann AG, from which he received remuneration of EUR 31,897 until May 2015 (EUR 117,000 in 2014); as a board member of Thermo Fisher Scientifi c Inc, from which he received remuneration of USD 223,865 until May 2015 (USD 299,063 in 2014); and as a board member of Carlsberg A/S, from which he received remuneration of DKK 838,306 as of March 2015. Jesper Brandgaard serves as chairman of the Board of Directors of SimCorp A/S, from which he received remuneration of DKK 730,488 in 2015, including share-based payment for Q1 2015 (DKK 913,500 in 2014, including share-based payment for the full year); and as chairman of the board of NNIT A/S, from which he received remuneration of DKK 562,500 as of March 2015 following the IPO of NNIT A/S (DKK 0 in 2014). The remuneration received from NNIT A/S is part of the remuneration of Executive Management presented above. Mads Krogsgaard Thomsen serves as a board member of the University of Copenhagen, from which he received remuneration of DKK 81,606 in 2015 (DKK 81,200 in 2014). Jakob Riis serves as a board member of ALK-Abelló A/S, from which he received remuneration of DKK 415,000 in 2015 (DKK 375,000 in 2014). Henrik Wulff serves as a board member of AMBU A/S as of December 2015 but did not receive remuneration in 2015.
REMUNERATION OF EXECUTIVE MANAGEMENT AND OTHER MEMBERS OF THE SENIOR MANAGEMENT BOARD 2015 2014
Fixed Share- Fixed Share- base Cash based base Cash based DKK million salary5 bonus Pension Benefi ts incentive6 Total salary5 bonus Pension Benefi ts incentive6 Total
Executive ManagementLars Rebien Sørensen 10.6 10.6 5.3 0.3 – 26.8 10.4 9.5 5.0 0.3 – 25.2Jesper Brandgaard 6.0 4.0 2.5 0.3 – 12.8 5.8 3.9 2.5 0.3 – 12.5Lars Fruergaard Jørgensen 5.2 3.5 2.2 0.3 – 11.2 4.4 2.2 1.6 0.3 – 8.5Jakob Riis 5.2 2.8 2.0 0.3 – 10.3 4.4 1.8 1.5 0.3 – 8.0Mads Krogsgaard Thomsen 6.0 4.0 2.5 0.3 – 12.8 5.8 3.9 2.5 0.3 – 12.5Non-registered members of Executive Management1, 2 13.8 12.0 6.2 0.8 – 32.8 – – – – – –Retired members of Executive Management:Kåre Schultz3 2.5 1.3 1.0 0.1 – 4.9 7.3 4.3 3.1 0.3 – 15.0Lise Kingo3 – – – – – – 4.8 2.0 1.7 0.3 – 8.8Share-based incentive – – – – 44.0 44.0 – – – – 27.3 27.3
Executive Management in total 49.35 38.2 21.7 2.4 44.0 155.6 42.95 27.6 17.9 2.1 27.3 117.8
Other members of the Senior Management Board in total4 73.15 20.6 22.2 18.3 47.8 172.0 80.65 28.7 21.9 21.6 38.9 191.7
1. Effective 30 April 2015, Novo Nordisk’s Executive Management was expanded to include four new members: Maziar Mike Doustdar, Jerzy Gruhn, Jesper Høiland and Henrik Wulff, none of whom are registered with the Danish Business Authority as members of Executive Management of Novo Nordisk A/S. Respective amounts in the table include remuneration for May to December 2015, with the exception of cash bonus, which covers the full year. 2. Amounts include taxes paid by Novo Nordisk due to the members’ international employment terms. In addition, Maziar Mike Doustdar, Jerzy Gruhn and Jesper Høiland received benefi ts in 2015 in accordance with Novo Nordisk’s International Assignment Guidelines, such as accommodation, children’s school fees, international health insurance and other types of insurance, spouse allowance and tax-fi ling support, all offered net of tax to the assignees. Including tax paid by Novo Nordisk, the benefi ts received in 2015 not included in the above table amount to DKK 5.4 million. 3. Following a change in the distribution of responsibilities among the members of Executive Management, President and COO Kåre Schultz left Novo Nordisk as of April 2015. The remuneration of Kåre Schultz up to April 2015 is included in the above table, whereas severance payment, including participation in the share-based incentive programme for 2015 and part of 2016, of DKK 72.7 million is not included. The remuneration of Lise Kingo for 2014 is also included in the above table, whereas severance payment, including participation in the share-based incentive programme for 2015, of DKK 32.2 million is not included. 4. The total remuneration for 2015 includes remuneration of 34 Senior Vice Presidents (31 in 2014), three of whom have retired or left the company (none in 2014). The 2015 remuneration for the retired Senior Vice Presidents is included in the table above, whereas severance payments of DKK 26 million are not included. 5. Excluding social security taxes paid amounting to DKK 1.3 million (DKK 0.0 million in 2014) for Executive Management and DKK 1.4 million (DKK 2.7 million in 2014) for other members of the Senior Management Board. 6. The joint pool of shares is locked up for three years before it is transferred to the participants employed at the end of the three-year period. The value is the cash amount of the share bonus granted in the year using the grant-date market value of Novo Nordisk B shares. During the lock-up period, the joint pool may potentially be reduced in the event of lower-than-planned value creation in subsequent years. The split between Executive Management and other members is based on the split of participants at the time of the establishment of the pool.
2015 PERFORMANCE TRIGGERS MAXIMUM SHARE ALLOCATIONIn 2015, Novo Nordisk exceeded the planned target for economic value creation by more than the 10% incentive threshold. Sales growth in local currencies was realised at 8.4%, thereby also exceeding the incentive target, while the threshold for the achievement of non-financial targets was met. Together, this means that participants in the share-based long-term incentive programme will receive the maximum share allocation.
51GOVERNANCE, LEADERSHIP AND SHARES
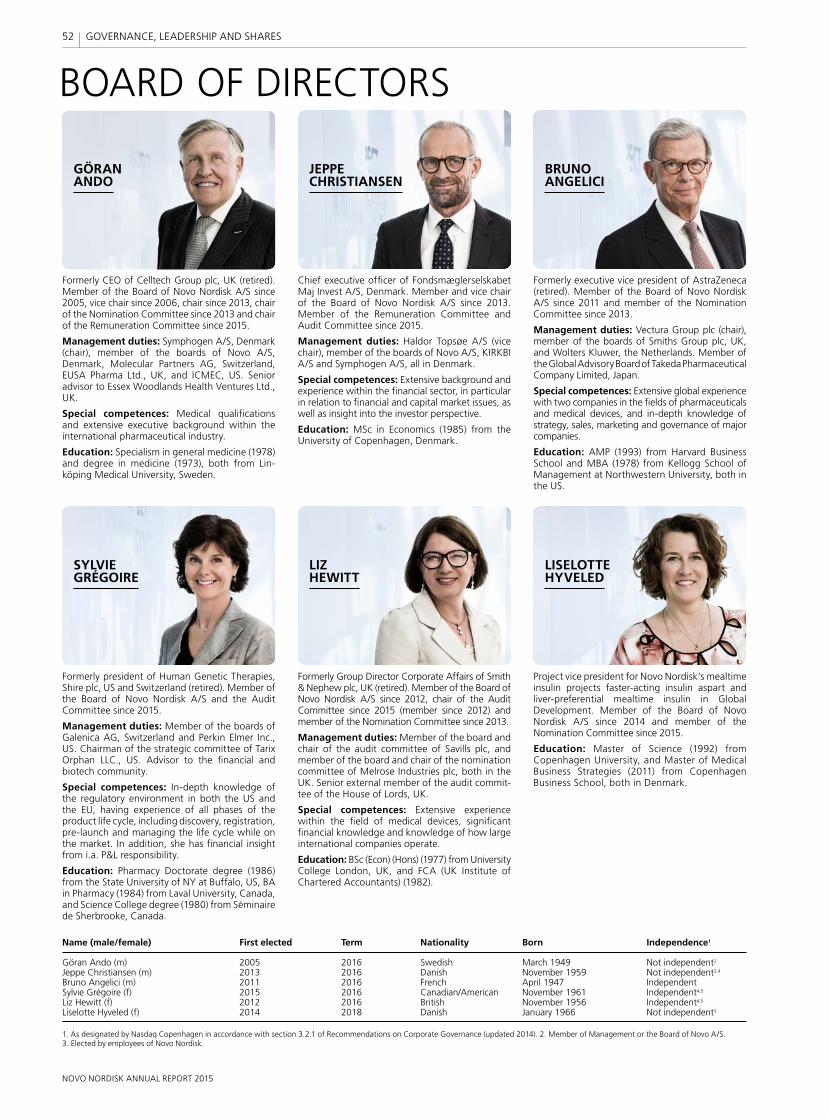
BOARD OF DIRECTORS
Name (male/female) First elected Term Nationality Born Independence1
Göran Ando (m) 2005 2016 Swedish March 1949 Not independent2
Jeppe Christiansen (m) 2013 2016 Danish November 1959 Not independent2,4
Bruno Angelici (m) 2011 2016 French April 1947 IndependentSylvie Grégoire (f) 2015 2016 Canadian/American November 1961 Independent4,5
Liz Hewitt (f) 2012 2016 British November 1956 Independent4,5
Liselotte Hyveled (f) 2014 2018 Danish January 1966 Not independent3
1. As designated by Nasdaq Copenhagen in accordance with section 3.2.1 of Recommendations on Corporate Governance (updated 2014). 2. Member of Management or the Board of Novo A/S. 3. Elected by employees of Novo Nordisk.
GÖRAN ANDO
JEPPE CHRISTIANSEN
BRUNO ANGELICI
LISELOTTE HYVELED
LIZ HEWITT
SYLVIE GRÉGOIRE
Formerly CEO of Celltech Group plc, UK (retired). Member of the Board of Novo Nordisk A/S since 2005, vice chair since 2006, chair since 2013, chair of the Nomination Committee since 2013 and chair of the Remuneration Committee since 2015.
Management duties: Symphogen A/S, Denmark (chair), member of the boards of Novo A/S, Denmark, Molecular Partners AG, Switzerland, EUSA Pharma Ltd., UK, and ICMEC, US. Senior advisor to Essex Woodlands Health Ventures Ltd., UK.
Special competences: Medical qualifications and extensive executive background within the international pharmaceutical industry.
Education: Specialism in general medicine (1978) and degree in medicine (1973), both from Lin-köping Medical University, Sweden.
Chief executive officer of Fondsmæglerselskabet Maj Invest A/S, Denmark. Member and vice chair of the Board of Novo Nordisk A/S since 2013. Member of the Remuneration Committee and Audit Committee since 2015.
Management duties: Haldor Topsøe A/S (vice chair), member of the boards of Novo A/S, KIRKBI A/S and Symphogen A/S, all in Denmark.
Special competences: Extensive background and experience within the financial sector, in particular in relation to financial and capital market issues, as well as insight into the investor perspective.
Education: MSc in Economics (1985) from the University of Copenhagen, Denmark.
Formerly executive vice president of AstraZeneca (retired). Member of the Board of Novo Nordisk A/S since 2011 and member of the Nomination Committee since 2013.
Management duties: Vectura Group plc (chair), member of the boards of Smiths Group plc, UK, and Wolters Kluwer, the Netherlands. Member of the Global Advisory Board of Takeda Pharmaceutical Company Limited, Japan.
Special competences: Extensive global experience with two companies in the fields of pharmaceuticals and medical devices, and in-depth knowledge of strategy, sales, marketing and governance of major companies.
Education: AMP (1993) from Harvard Business School and MBA (1978) from Kellogg School of Management at Northwestern University, both in the US.
Formerly Group Director Corporate Affairs of Smith & Nephew plc, UK (retired). Member of the Board of Novo Nordisk A/S since 2012, chair of the Audit Committee since 2015 (member since 2012) and member of the Nomination Committee since 2013.
Management duties: Member of the board and chair of the audit committee of Savills plc, and member of the board and chair of the nomination committee of Melrose Industries plc, both in the UK. Senior external member of the audit commit-tee of the House of Lords, UK.
Special competences: Extensive experience within the field of medical devices, significant financial knowledge and knowledge of how large international companies operate.
Education: BSc (Econ) (Hons) (1977) from University College London, UK, and FCA (UK Institute of Chartered Accountants) (1982).
Project vice president for Novo Nordisk’s mealtime insulin projects faster-acting insulin aspart and liver-preferential mealtime insulin in Global Development. Member of the Board of Novo Nordisk A/S since 2014 and member of the Nomination Committee since 2015.
Education: Master of Science (1992) from Copenhagen University, and Master of Medical Business Strategies (2011) from Copenhagen Business School, both in Denmark.
Formerly president of Human Genetic Therapies, Shire plc, US and Switzerland (retired). Member of the Board of Novo Nordisk A/S and the Audit Committee since 2015.
Management duties: Member of the boards of Galenica AG, Switzerland and Perkin Elmer Inc., US. Chairman of the strategic committee of Tarix Orphan LLC., US. Advisor to the financial and biotech community.
Special competences: In-depth knowledge of the regulatory environment in both the US and the EU, having experience of all phases of the product life cycle, including discovery, registration, pre-launch and managing the life cycle while on the market. In addition, she has financial insight from i.a. P&L responsibility.
Education: Pharmacy Doctorate degree (1986) from the State University of NY at Buffalo, US, BA in Pharmacy (1984) from Laval University, Canada, and Science College degree (1980) from Séminaire de Sherbrooke, Canada.
52
NOVO NORDISK ANNUAL REPORT 2015
GOVERNANCE, LEADERSHIP AND SHARES
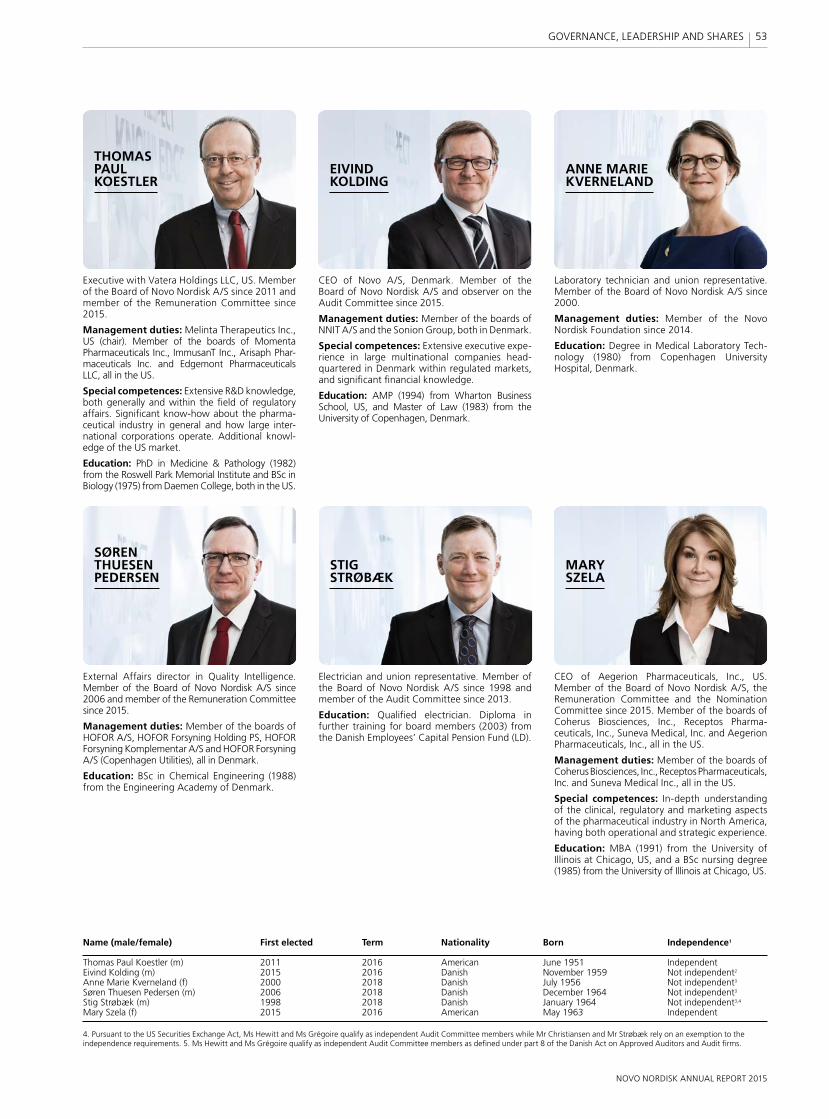
CEO of Novo A/S, Denmark. Member of the Board of Novo Nordisk A/S and observer on the Audit Committee since 2015.
Management duties: Member of the boards of NNIT A/S and the Sonion Group, both in Denmark.
Special competences: Extensive executive expe-rience in large multinational companies head-quartered in Denmark within regulated markets, and significant financial knowledge.
Education: AMP (1994) from Wharton Business School, US, and Master of Law (1983) from the University of Copenhagen, Denmark.
CEO of Aegerion Pharmaceuticals, Inc., US. Member of the Board of Novo Nordisk A/S, the Remuneration Committee and the Nomination Committee since 2015. Member of the boards of Coherus Biosciences, Inc., Receptos Pharma-ceuticals, Inc., Suneva Medical, Inc. and Aegerion Pharmaceuticals, Inc., all in the US.
Management duties: Member of the boards of Coherus Biosciences, Inc., Receptos Pharmaceuticals, Inc. and Suneva Medical Inc., all in the US.
Special competences: In-depth understanding of the clinical, regulatory and marketing aspects of the pharmaceutical industry in North America, having both operational and strategic experience.
Education: MBA (1991) from the University of Illinois at Chicago, US, and a BSc nursing degree (1985) from the University of Illinois at Chicago, US.
Name (male/female) First elected Term Nationality Born Independence1
Thomas Paul Koestler (m) 2011 2016 American June 1951 IndependentEivind Kolding (m) 2015 2016 Danish November 1959 Not independent2
Anne Marie Kverneland (f) 2000 2018 Danish July 1956 Not independent3
Søren Thuesen Pedersen (m) 2006 2018 Danish December 1964 Not independent3
Stig Strøbæk (m) 1998 2018 Danish January 1964 Not independent3,4
Mary Szela (f) 2015 2016 American May 1963 Independent
4. Pursuant to the US Securities Exchange Act, Ms Hewitt and Ms Grégoire qualify as independent Audit Committee members while Mr Christiansen and Mr Strøbæk rely on an exemption to the independence requirements. 5. Ms Hewitt and Ms Grégoire qualify as independent Audit Committee members as defined under part 8 of the Danish Act on Approved Auditors and Audit firms.
THOMAS PAUL KOESTLER
SØREN THUESEN PEDERSEN
ANNE MARIE KVERNELAND
STIG STRØBÆK
MARY SZELA
EIVIND KOLDING
Executive with Vatera Holdings LLC, US. Member of the Board of Novo Nordisk A/S since 2011 and member of the Remuneration Committee since 2015.
Management duties: Melinta Therapeutics Inc., US (chair). Member of the boards of Momenta Pharmaceuticals Inc., ImmusanT Inc., Arisaph Phar-maceuticals Inc. and Edgemont Pharmaceuticals LLC, all in the US.
Special competences: Extensive R&D knowledge, both generally and within the field of regulatory affairs. Significant know-how about the pharma-ceutical industry in general and how large inter-national corporations operate. Additional know l-edge of the US market.
Education: PhD in Medicine & Pathology (1982) from the Roswell Park Memorial Institute and BSc in Biology (1975) from Daemen College, both in the US.
Electrician and union representative. Member of the Board of Novo Nordisk A/S since 1998 and member of the Audit Committee since 2013.
Education: Qualified electrician. Diploma in further training for board members (2003) from the Danish Employees’ Capital Pension Fund (LD).
External Affairs director in Quality Intelligence. Member of the Board of Novo Nordisk A/S since 2006 and member of the Remuneration Committee since 2015.
Management duties: Member of the boards of HOFOR A/S, HOFOR Forsyning Holding PS, HOFOR Forsyning Komplementar A/S and HOFOR Forsyning A/S (Copenhagen Utilities), all in Denmark.
Education: BSc in Chemical Engineering (1988) from the Engineering Academy of Denmark.
Laboratory technician and union representative. Member of the Board of Novo Nordisk A/S since 2000.
Management duties: Member of the Novo Nordisk Foundation since 2014.
Education: Degree in Medical Laboratory Tec h-nology (1980) from Copenhagen University Hospital, Denmark.
53
NOVO NORDISK ANNUAL REPORT 2015
GOVERNANCE, LEADERSHIP AND SHARES
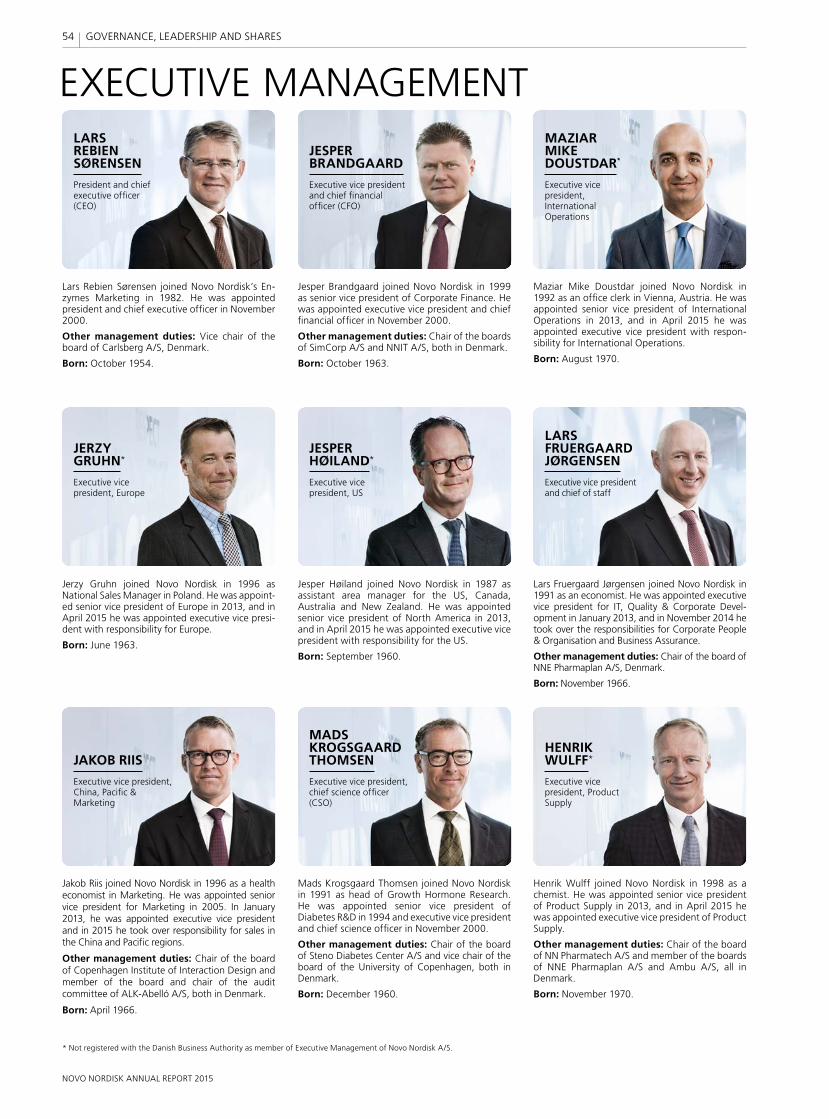
EXECUTIVE MANAGEMENTLARS REBIEN SØRENSEN
President and chief executive officer (CEO)
Lars Rebien Sørensen joined Novo Nordisk’s En-zymes Marketing in 1982. He was appointed president and chief executive officer in November 2000.
Other management duties: Vice chair of the board of Carlsberg A/S, Denmark.
Born: October 1954.
Jesper Brandgaard joined Novo Nordisk in 1999 as senior vice president of Corporate Finance. He was appointed executive vice president and chief financial officer in November 2000.
Other management duties: Chair of the boards of SimCorp A/S and NNIT A/S, both in Denmark.
Born: October 1963.
JESPER BRANDGAARD
Executive vice president and chief financial officer (CFO)
Mads Krogsgaard Thomsen joined Novo Nordisk in 1991 as head of Growth Hormone Research. He was appointed senior vice president of Diabetes R&D in 1994 and executive vice president and chief science officer in November 2000.
Other management duties: Chair of the board of Steno Diabetes Center A/S and vice chair of the board of the University of Copenhagen, both in Denmark.
Born: December 1960.
MADS KROGSGAARD THOMSEN
Executive vice president, chief science officer (CSO)
LARS FRUERGAARD JØRGENSEN
Executive vice president and chief of staff
Jakob Riis joined Novo Nordisk in 1996 as a health economist in Marketing. He was appointed senior vice president for Marketing in 2005. In January 2013, he was appointed executive vice president and in 2015 he took over responsibility for sales in the China and Pacific regions.
Other management duties: Chair of the board of Copenhagen Institute of Interaction Design and member of the board and chair of the audit committee of ALK-Abelló A/S, both in Denmark.
Born: April 1966.
JAKOB RIIS
Executive vice president, China, Pacific & Marketing
Lars Fruergaard Jørgensen joined Novo Nordisk in 1991 as an economist. He was appointed executive vice president for IT, Quality & Corporate Devel-opment in January 2013, and in November 2014 he took over the responsibilities for Corporate People & Organisation and Business Assurance.
Other management duties: Chair of the board of NNE Pharmaplan A/S, Denmark.
Born: November 1966.
Henrik Wulff joined Novo Nordisk in 1998 as a chemist. He was appointed senior vice president of Product Supply in 2013, and in April 2015 he was appointed executive vice president of Product Supply.
Other management duties: Chair of the board of NN Pharmatech A/S and member of the boards of NNE Pharmaplan A/S and Ambu A/S, all in Denmark.
Born: November 1970.
HENRIK WULFF
Executive vice president, Product Supply
Jesper Høiland joined Novo Nordisk in 1987 as assistant area manager for the US, Canada, Australia and New Zealand. He was appointed senior vice president of North America in 2013, and in April 2015 he was appointed executive vice president with responsibility for the US.
Born: September 1960.
JESPER HØILAND
Executive vice president, US
Jerzy Gruhn joined Novo Nordisk in 1996 as National Sales Manager in Poland. He was appoint-ed senior vice president of Europe in 2013, and in April 2015 he was appointed executive vice presi-dent with responsibility for Europe.
Born: June 1963.
JERZY GRUHN
Executive vice president, Europe
Maziar Mike Doustdar joined Novo Nordisk in 1992 as an office clerk in Vienna, Austria. He was appointed senior vice president of International Operations in 2013, and in April 2015 he was appointed executive vice president with respon-sibility for International Operations.
Born: August 1970.
MAZIAR MIKE DOUSTDAR*
Executive vice president, International Operations
* Not registered with the Danish Business Authority as member of Executive Management of Novo Nordisk A/S.
54
NOVO NORDISK ANNUAL REPORT 2015
GOVERNANCE, LEADERSHIP AND SHARES
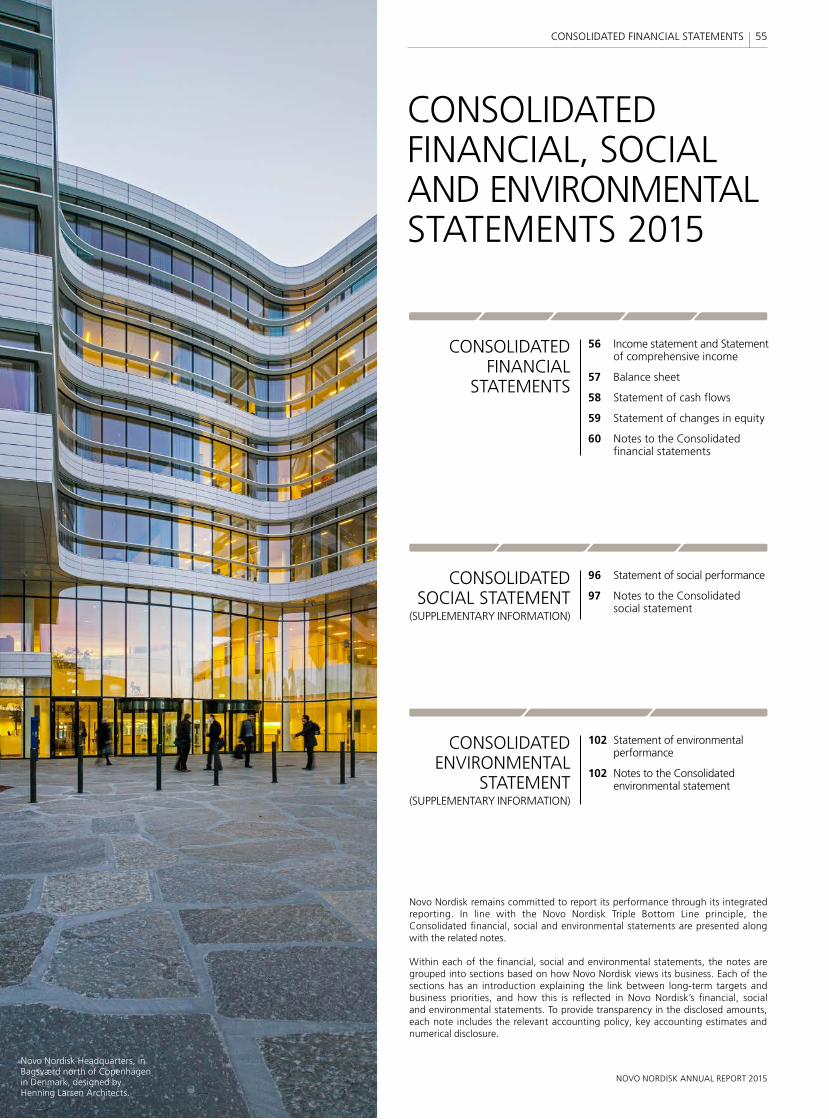
Novo Nordisk remains committed to report its performance through its integrated reporting. In line with the Novo Nordisk Triple Bottom Line principle, the Consolidated financial, social and environmental statements are presented along with the related notes.
Within each of the financial, social and environmental statements, the notes are grouped into sections based on how Novo Nordisk views its business. Each of the sections has an introduction explaining the link between long-term targets and business priorities, and how this is reflected in Novo Nordisk’s financial, social and environmental statements. To provide transparency in the disclosed amounts, each note includes the relevant accounting policy, key accounting estimates and numerical disclosure.
CONSOLIDATED FINANCIAL, SOCIAL AND ENVIRONMENTAL STATEMENTS 2015
56 Income statement and Statement of comprehensive income
57 Balance sheet
58 Statement of cash flows
59 Statement of changes in equity
60 Notes to the Consolidated financial statements
CONSOLIDATED FINANCIAL
STATEMENTS
96 Statement of social performance
97 Notes to the Consolidated social statement
CONSOLIDATED SOCIAL STATEMENT
(SUPPLEMENTARY INFORMATION)
102 Statement of environmental performance
102 Notes to the Consolidated environmental statement
CONSOLIDATED ENVIRONMENTAL
STATEMENT (SUPPLEMENTARY INFORMATION)
Novo Nordisk Headquarters, in Bagsværd north of Copenhagen in Denmark, designed by Henning Larsen Architects.
55
NOVO NORDISK ANNUAL REPORT 2015
CONSOLIDATED FINANCIAL STATEMENTS
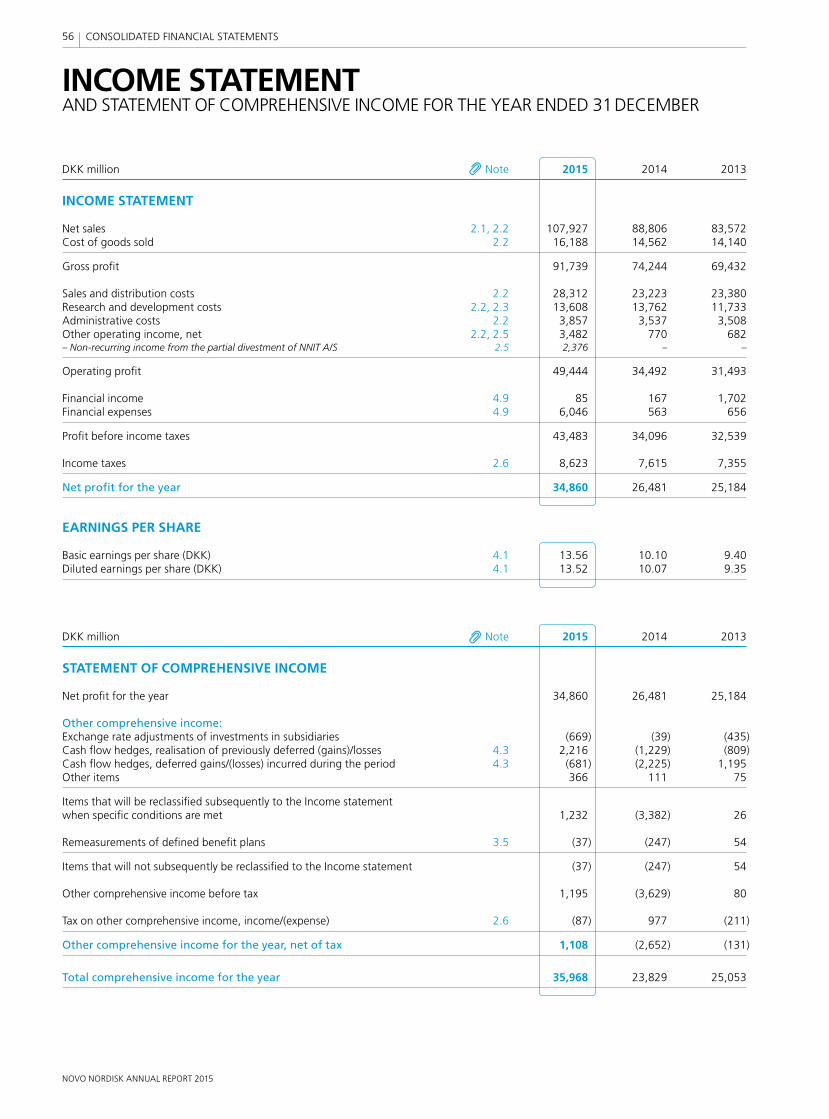
NOVO NORDISK ANNUAL REPORT 2015
56 CONSOLIDATED FINANCIAL STATEMENTS
INCOME STATEMENT AND STATEMENT OF COMPREHENSIVE INCOME FOR THE YEAR ENDED 31 DECEMBER
DKK million Note 2015 2014 2013
INCOME STATEMENT
Net sales 2.1, 2.2 107,927 88,806 83,572Cost of goods sold 2.2 16,188 14,562 14,140
Gross profi t 91,739 74,244 69,432
Sales and distribution costs 2.2 28,312 23,223 23,380Research and development costs 2.2, 2.3 13,608 13,762 11,733Administrative costs 2.2 3,857 3,537 3,508Other operating income, net 2.2, 2.5 3,482 770 682– Non-recurring income from the partial divestment of NNIT A/S 2.5 2,376 – –
Operating profi t 49,444 34,492 31,493
Financial income 4.9 85 167 1,702Financial expenses 4.9 6,046 563 656
Profi t before income taxes 43,483 34,096 32,539
Income taxes 2.6 8,623 7,615 7,355
Net profi t for the year 34,860 26,481 25,184
EARNINGS PER SHARE
Basic earnings per share (DKK) 4.1 13.56 10.10 9.40Diluted earnings per share (DKK) 4.1 13.52 10.07 9.35
DKK million Note 2015 2014 2013
STATEMENT OF COMPREHENSIVE INCOME
Net profi t for the year 34,860 26,481 25,184
Other comprehensive income:Exchange rate adjustments of investments in subsidiaries (669) (39) (435)Cash fl ow hedges, realisation of previously deferred (gains)/losses 4.3 2,216 (1,229) (809)Cash fl ow hedges, deferred gains/(losses) incurred during the period 4.3 (681) (2,225) 1,195Other items 366 111 75
Items that will be reclassifi ed subsequently to the Income statement when specifi c conditions are met 1,232 (3,382) 26
Remeasurements of defi ned benefi t plans 3.5 (37) (247) 54
Items that will not subsequently be reclassifi ed to the Income statement (37) (247) 54
Other comprehensive income before tax 1,195 (3,629) 80
Tax on other comprehensive income, income/(expense) 2.6 (87) 977 (211)
Other comprehensive income for the year, net of tax 1,108 (2,652) (131)
Total comprehensive income for the year 35,968 23,829 25,053
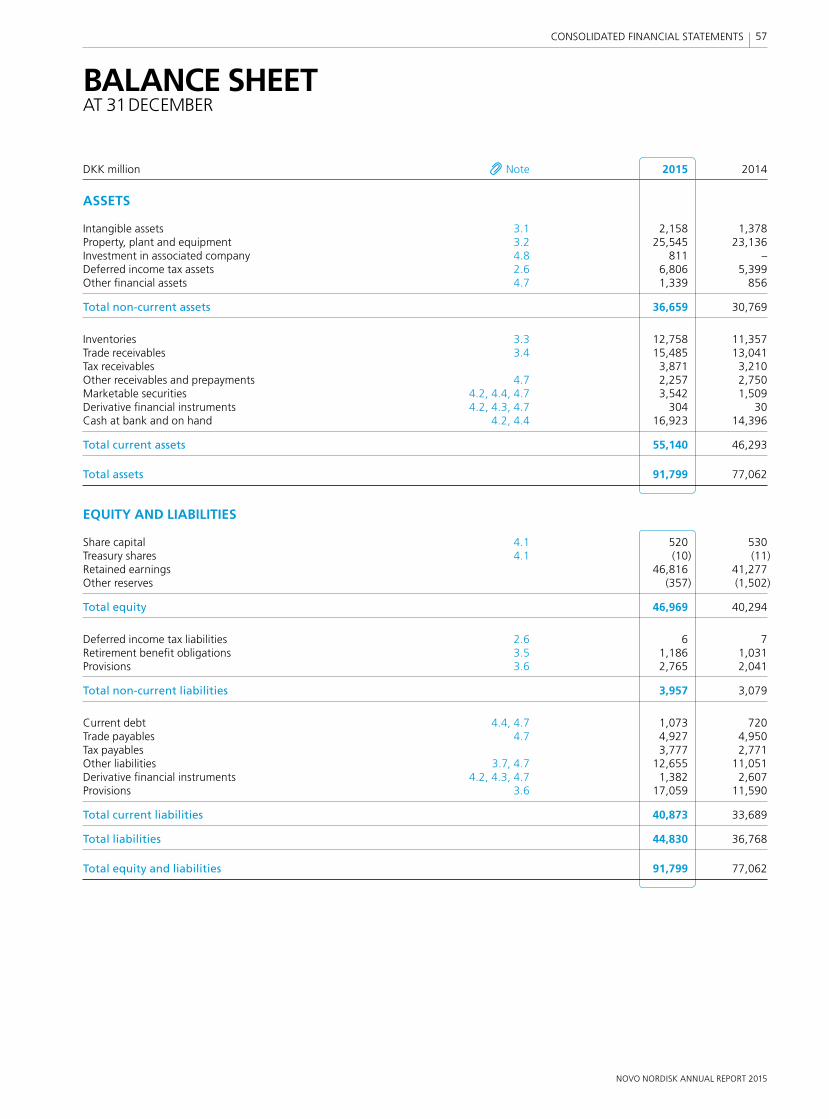
NOVO NORDISK ANNUAL REPORT 2015
57 CONSOLIDATED FINANCIAL STATEMENTS
BALANCE SHEETAT 31 DECEMBER
DKK million Note 2015 2014
ASSETS
Intangible assets 3.1 2,158 1,378Property, plant and equipment 3.2 25,545 23,136Investment in associated company 4.8 811 –Deferred income tax assets 2.6 6,806 5,399Other fi nancial assets 4.7 1,339 856
Total non-current assets 36,659 30,769
Inventories 3.3 12,758 11,357Trade receivables 3.4 15,485 13,041Tax receivables 3,871 3,210Other receivables and prepayments 4.7 2,257 2,750Marketable securities 4.2, 4.4, 4.7 3,542 1,509Derivative fi nancial instruments 4.2, 4.3, 4.7 304 30Cash at bank and on hand 4.2, 4.4 16,923 14,396
Total current assets 55,140 46,293
Total assets 91,799 77,062
EQUITY AND LIABILITIES
Share capital 4.1 520 530Treasury shares 4.1 (10) (11)Retained earnings 46,816 41,277Other reserves (357) (1,502)
Total equity 46,969 40,294
Deferred income tax liabilities 2.6 6 7Retirement benefi t obligations 3.5 1,186 1,031Provisions 3.6 2,765 2,041
Total non-current liabilities 3,957 3,079
Current debt 4.4, 4.7 1,073 720Trade payables 4.7 4,927 4,950Tax payables 3,777 2,771Other liabilities 3.7, 4.7 12,655 11,051Derivative fi nancial instruments 4.2, 4.3, 4.7 1,382 2,607Provisions 3.6 17,059 11,590
Total current liabilities 40,873 33,689
Total liabilities 44,830 36,768
Total equity and liabilities 91,799 77,062
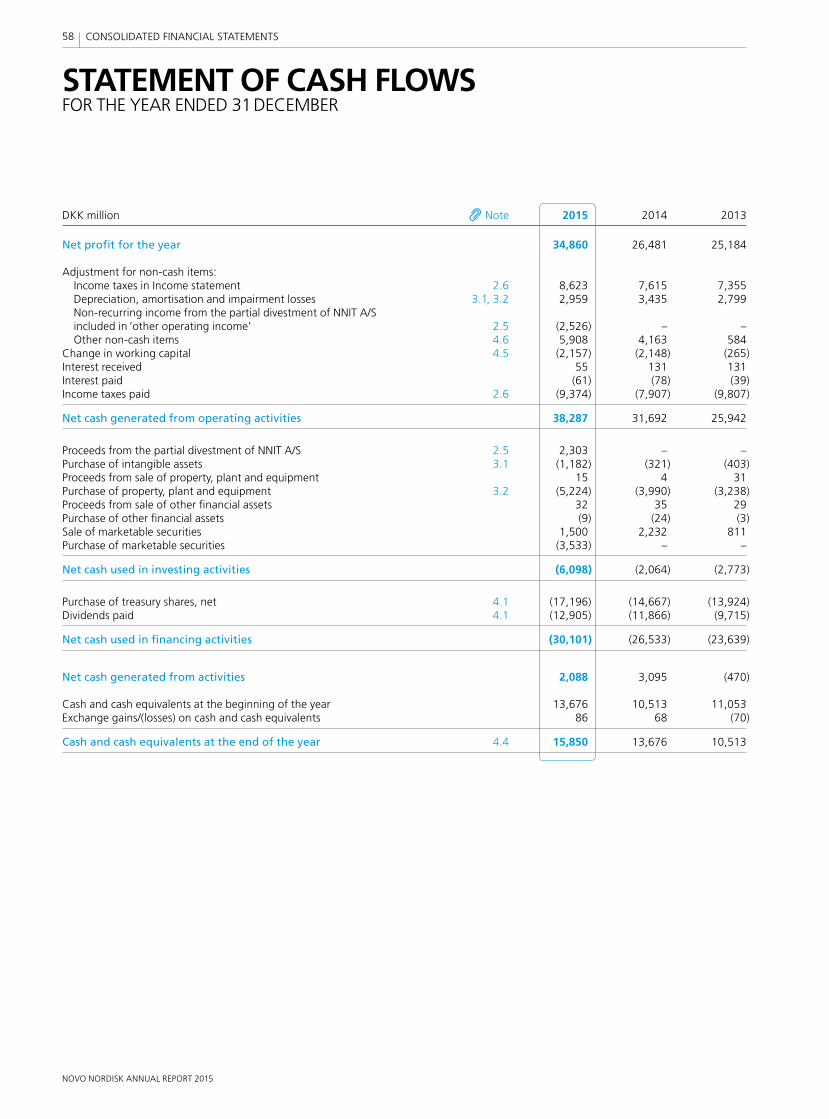
NOVO NORDISK ANNUAL REPORT 2015
58 CONSOLIDATED FINANCIAL STATEMENTS
STATEMENT OF CASH FLOWSFOR THE YEAR ENDED 31 DECEMBER
DKK million Note 2015 2014 2013
Net profi t for the year 34,860 26,481 25,184
Adjustment for non-cash items: Income taxes in Income statement 2.6 8,623 7,615 7,355 Depreciation, amortisation and impairment losses 3.1, 3.2 2,959 3,435 2,799 Non-recurring income from the partial divestment of NNIT A/S included in ‘other operating income’ 2.5 (2,526) – – Other non-cash items 4.6 5,908 4,163 584Change in working capital 4.5 (2,157) (2,148) (265)Interest received 55 131 131Interest paid (61) (78) (39)Income taxes paid 2.6 (9,374) (7,907) (9,807)
Net cash generated from operating activities 38,287 31,692 25,942
Proceeds from the partial divestment of NNIT A/S 2.5 2,303 – –Purchase of intangible assets 3.1 (1,182) (321) (403)Proceeds from sale of property, plant and equipment 15 4 31Purchase of property, plant and equipment 3.2 (5,224) (3,990) (3,238)Proceeds from sale of other fi nancial assets 32 35 29Purchase of other fi nancial assets (9) (24) (3)Sale of marketable securities 1,500 2,232 811Purchase of marketable securities (3,533) – –
Net cash used in investing activities (6,098) (2,064) (2,773)
Purchase of treasury shares, net 4.1 (17,196) (14,667) (13,924)Dividends paid 4.1 (12,905) (11,866) (9,715)
Net cash used in fi nancing activities (30,101) (26,533) (23,639)
Net cash generated from activities 2,088 3,095 (470)
Cash and cash equivalents at the beginning of the year 13,676 10,513 11,053Exchange gains/(losses) on cash and cash equivalents 86 68 (70)
Cash and cash equivalents at the end of the year 4.4 15,850 13,676 10,513
NOVO NORDISK ANNUAL REPORT 2015
59 CONSOLIDATED FINANCIAL STATEMENTS
STATEMENT OF CHANGES IN EQUITYAT 31 DECEMBER
Other reserves Exchange rate Cash Tax and Total Share Treasury Retained adjust- fl ow other other DKK million capital shares earnings ments hedges items reserves Total
2015Balance at the beginning of the year 530 (11) 41,277 (248) (2,221) 967 (1,502) 40,294
Net profi t for the year 34,860 34,860Other comprehensive income for the year (37) (669) 1,535 279 1,145 1,108
Total comprehensive income for the year 34,823 (669) 1,535 279 1,145 35,968
Transactions with owners:Dividends (note 4.1) (12,905) (12,905)Share-based payments (note 5.1) 442 442Tax credit related to restricted stock units (note 2.6) 366 366Purchase of treasury shares (note 4.1) (10) (17,219) (17,229)Sale of treasury shares (note 4.1) 1 32 33Reduction of the B share capital (note 4.1) (10) 10 –
Balance at the end of the year 520 (10) 46,816 (917) (686) 1,246 (357) 46,969
2014Balance at the beginning of the year 550 (21) 41,137 (209) 1,233 (121) 903 42,569
Net profi t for the year 26,481 26,481Other comprehensive income for the year (247) (39) (3,454) 1,088 (2,405) (2,652)
Total comprehensive income for the year 26,234 (39) (3,454) 1,088 (2,405) 23,829
Transactions with owners:Dividends (note 4.1) (11,866) (11,866)Share-based payments (note 5.1) 371 371Tax credit related to restricted stock units (note 2.6) 58 58Purchase of treasury shares (note 4.1) (11) (14,717) (14,728)Sale of treasury shares (note 4.1) 1 60 61Reduction of the B share capital (note 4.1) (20) 20 –
Balance at the end of the year 530 (11) 41,277 (248) (2,221) 967 (1,502) 40,294
2013Balance at the beginning of the year 560 (17) 39,001 226 847 15 1,088 40,632
Net profi t for the year 25,184 25,184Other comprehensive income for the year 54 (435) 386 (136) (185) (131)
Total comprehensive income for the year 25,238 (435) 386 (136) (185) 25,053
Transactions with owners:Dividends (note 4.1) (9,715) (9,715)Share-based payments (note 5.1) 409 409Tax credit related to restricted stock units (note 2.6) 114 114Purchase of treasury shares (note 4.1) (15) (13,974) (13,989)Sale of treasury shares (note 4.1) 1 64 65Reduction of the B share capital (note 4.1) (10) 10 –
Balance at the end of the year 550 (21) 41,137 (209) 1,233 (121) 903 42,569
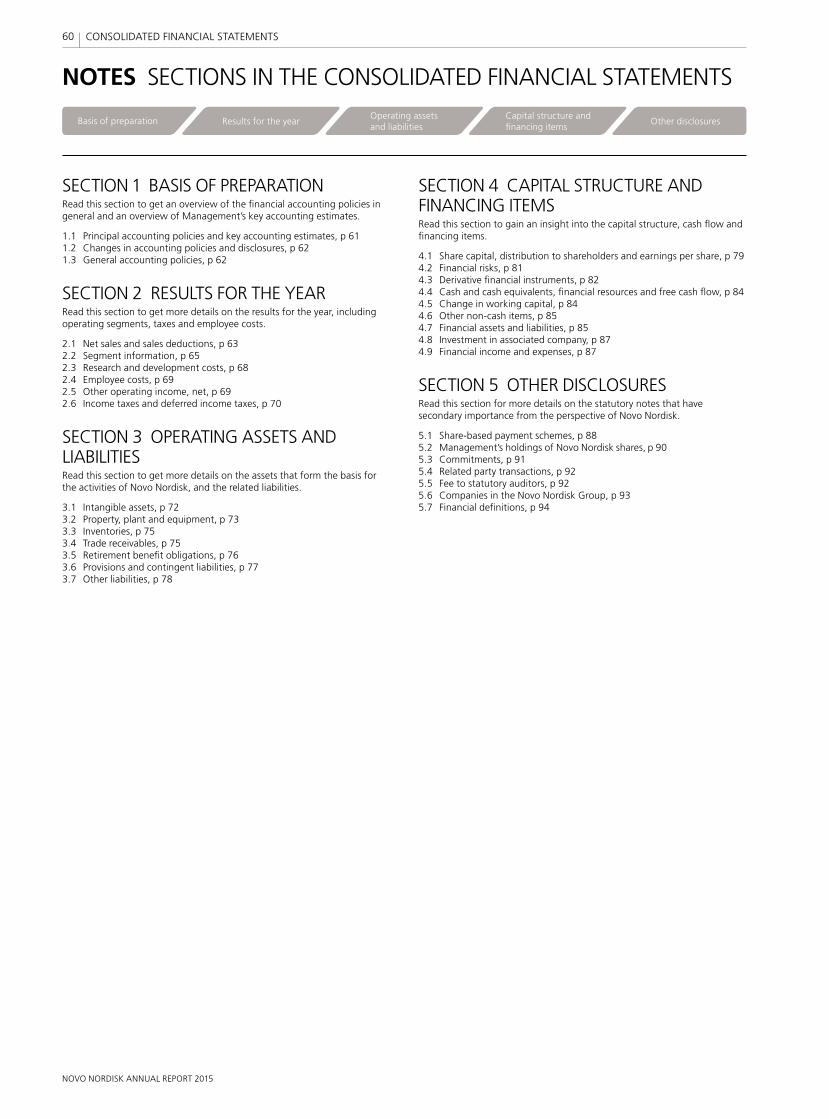
NOVO NORDISK ANNUAL REPORT 2015
60 CONSOLIDATED FINANCIAL STATEMENTS
SECTION 1 BASIS OF PREPARATIONRead this section to get an overview of the fi nancial accounting policies in general and an overview of Management’s key accounting estimates.
1.1 Principal accounting policies and key accounting estimates, p 611.2 Changes in accounting policies and disclosures, p 621.3 General accounting policies, p 62
SECTION 2 RESULTS FOR THE YEARRead this section to get more details on the results for the year, including operating segments, taxes and employee costs.
2.1 Net sales and sales deductions, p 632.2 Segment information, p 652.3 Research and development costs, p 682.4 Employee costs, p 692.5 Other operating income, net, p 692.6 Income taxes and deferred income taxes, p 70
SECTION 3 OPERATING ASSETS AND LIABILITIESRead this section to get more details on the assets that form the basis for the activities of Novo Nordisk, and the related liabilities.
3.1 Intangible assets, p 723.2 Property, plant and equipment, p 733.3 Inventories, p 753.4 Trade receivables, p 753.5 Retirement benefi t obligations, p 763.6 Provisions and contingent liabilities, p 773.7 Other liabilities, p 78
SECTION 4 CAPITAL STRUCTURE AND FINANCING ITEMSRead this section to gain an insight into the capital structure, cash fl ow and fi nancing items.
4.1 Share capital, distribution to shareholders and earnings per share, p 794.2 Financial risks, p 814.3 Derivative fi nancial instruments, p 824.4 Cash and cash equivalents, fi nancial resources and free cash fl ow, p 844.5 Change in working capital, p 844.6 Other non-cash items, p 854.7 Financial assets and liabilities, p 854.8 Investment in associated company, p 874.9 Financial income and expenses, p 87
SECTION 5 OTHER DISCLOSURESRead this section for more details on the statutory notes that have secondary importance from the perspective of Novo Nordisk.
5.1 Share-based payment schemes, p 885.2 Management’s holdings of Novo Nordisk shares, p 905.3 Commitments, p 915.4 Related party transactions, p 925.5 Fee to statutory auditors, p 925.6 Companies in the Novo Nordisk Group, p 935.7 Financial defi nitions, p 94
NOTES SECTIONS IN THE CONSOLIDATED FINANCIAL STATEMENTS
Basis of preparation Results for the yearOperating assetsand liabilities
Capital structure and financing items
Other disclosures
NOVO NORDISK ANNUAL REPORT 2015
61 CONSOLIDATED FINANCIAL STATEMENTS
SECTION 1 BASIS OF PREPARATION
Novo Nordisk presents its Consolidated fi nancial statements on the basis of the latest developments in international fi nancial reporting and strives for early adoption of EU-endorsed IFRS accounting standards. All entities in the Novo Nordisk Group follow the same Group accounting policies. This section gives a summary of the signifi cant accounting policies, Management’s key
accounting estimates, new IFRS requirements and other accounting policies in general. A detailed description of accounting policies and key accounting estimates related to specifi c reported amounts is presented in each note to the relevant fi nancial items.
1.1 PRINCIPAL ACCOUNTING POLICIES AND KEY ACCOUNTING ESTIMATES The Consolidated fi nancial statements included in this Annual Report have been prepared in accordance with International Financial Reporting Standards (IFRS) as issued by the International Accounting Standards Board (IASB), in accordance with IFRS as endorsed by the European Union and also in accordance with additional Danish disclosure requirements for annual reports of listed companies.
Measurement basisThe Consolidated fi nancial statements have been prepared on the historical cost basis except for derivative fi nancial instruments, associated company, equity investments and marketable securities measured at fair value.
The principal accounting policies set out below have been applied consistently in the preparation of the Consolidated fi nancial statements for all the years presented.
Principal accounting policiesNovo Nordisk’s accounting policies are described in each of the individual notes to the Consolidated fi nancial statements. Considering all the accounting policies applied, Management regards the ones listed in the table below as the most signifi cant accounting policies for the recognition and measurement of reported amounts.
Key accounting estimates and judgementsThe use of reasonable estimates and judgements is an essential part of the preparation of the Consolidated fi nancial statements. Given the uncertainties inherent in Novo Nordisk’s business activities, Management must make certain estimates and judgements that affect the application of accounting policies and reported amounts of assets, liabilities, sales, costs, cash fl ows and related disclosures at the date(s) of the Consolidated fi nancial statements. The estimates identifi ed are those that have a signifi cant risk of resulting in a material adjustment.
Management bases its estimates on historical experience and various other assumptions that are held to be reasonable under the circumstances. The estimates and underlying assumptions are reviewed on an ongoing basis and, if necessary, changes are recognised in the period in which the estimate is revised. Management considers the carrying amounts recognised in relation to the key accounting estimates mentioned below to be reasonable and appropriate based on currently available information. However, the actual amounts may differ from the amounts estimated as more detailed information becomes available.
Management regards those listed below to be the key accounting estimates and judgements used in the preparation of the Consolidated fi nancial statements. Please refer to the specifi c notes for further information on the key accounting estimates and judgements as well as assumptions applied.
Principal accounting policies Key accounting estimates and judgements Note
Net sales and sales deductions Sales deductions – estimate of unsettled obligations 2.1 Research and development – 2.3, 3.1 and 3.2Derivative fi nancial instruments – 4.3Income taxes and deferred income taxes Provision for uncertain tax positions, accrual for income taxes and deferred tax assets and liabilities 2.6Property, plant and equipment including impairment – 3.2Inventories Indirect production costs capitalised 3.3Trade receivables Allowance for doubtful trade receivables 3.4Provisions and contingent liabilities Provisions for sales rebates and ongoing legal disputes 3.6
Applying materialityThe Consolidated fi nancial statements are a result of processing large numbers of transactions and aggregating those transactions into classes according to their nature or function. When aggregated, the transactions are presented in classes of similar items in the Consolidated fi nancial statements. If a line item is not individually material, it is aggregated with other items of a similar nature in the Consolidated fi nancial statements or in the notes.
There are substantial disclosure requirements throughout IFRS. Management provides specifi c disclosures required by IFRS unless the information is considered immaterial to the economic decision-making of the users of these fi nancial statements or not applicable.
Basis of preparation Results for the yearOperating assetsand liabilities
Capital structure and financing items
Other disclosures
NOVO NORDISK ANNUAL REPORT 2015
62 CONSOLIDATED FINANCIAL STATEMENTS
1.2 CHANGES IN ACCOUNTING POLICIES AND DISCLOSURESAdoption of new or amended IFRSsBased on an assessment of new or amended and revised accounting standards and interpretations (‘IFRSs’) issued by IASB, and IFRSs endorsed by the European Union effective on or after 1 January 2015, it has been assessed that the application of these new IFRSs has not had a material impact on the Consolidated fi nancial statements in 2015, and Management does not anticipate any signifi cant impact on future periods from the adoption of these new IFRSs.
New or amended IFRSs that have been issued but have not yet come into effect and have not been early adoptedIn addition to the above, IASB has issued a number of new or amended and revised accounting standards and interpretations that have not yet come into effect. The following standards are in general expected to change current accounting regulation most signifi cantly:
• IASB has issued IFRS 9 ‘Financial Instruments’, with effective date 1 January 2018. It currently awaits EU endorsement. IFRS 9 is part of the IASB’s project to replace IAS 39, and the new standard will substantially change the classifi cation and measurement of fi nancial instruments and hedging requirements. Novo Nordisk has assessed the impact of the standard and determined that it will not have any signifi cant impact on the Consolidated fi nancial statements.
• IASB has issued IFRS 15 ‘Revenue from contracts with customers’, with effective date 1 January 2018. It currently awaits EU endorsement. IFRS 15 is part of the convergence project with FASB to replace IAS 18. The new standard will establish a single, comprehensive framework for revenue recognition. Novo Nordisk has completed a preliminary assessment of the impact of the standard and judged that it will not have any signifi cant impact on the Consolidated fi nancial statements.
• IASB has issued IFRS 16 ‘Leasing’ with effective date 1 January 2019. The change in lease accounting requires capitalisation of the majority of the Group’s operational lease contracts, representing up to 10% of total assets, which will have an impact on the Group’s assets, and a corresponding impact on the liabilities. Hence this will affect the fi nancial ratios related to the balance sheet. The change will have a minor impact on net profi t as IFRS 16 requires the lease payments to be split between a depreciation charge included in operating costs and an interest expense on lease liabilities included in fi nance costs.
1.3 GENERAL ACCOUNTING POLICIESPrinciples of consolidationThe Consolidated fi nancial statements incorporate the fi nancial statements of Novo Nordisk A/S and entities controlled by Novo Nordisk A/S. Control exists when Novo Nordisk has effective power over the entity and has the right to variable returns from the entity.
Where necessary, adjustments are made to the fi nancial statements of subsidiaries to bring their accounting policies in line with Novo Nordisk Group policies. All intra-Group transactions, balances, income and expenses are eliminated in full when consolidated.
The results of subsidiaries acquired or disposed of during the year are included in the consolidated income statement from the effective date of acquisition and up to the effective date of disposal, as appropriate. Comparative fi gures are not restated for disposed or acquired companies.
Translation of foreign currenciesFunctional and presentation currencyItems included in the fi nancial statements of each of Novo Nordisk’s entities are measured using the currency of the primary economic environment in which the entity operates (functional currency). The Consolidated fi nancial statements are presented in Danish kroner (DKK), which is also the functional and presentation currency of the parent company.
Translation of transactions and balancesForeign currency transactions are translated into the functional currency using the exchange rates prevailing at the transaction dates. Foreign exchange gains and losses resulting from the settlement of such trans actions and from the translation at year-end exchange rates of monetary assets and liabilities denominated in foreign currencies are recognised in the Income statement.
Translation differences on non-monetary items, such as equity investments classifi ed as fi nancial assets available for sale, are recognised in Other comprehensive income.
Translation of Group companiesFinancial statements of foreign subsidiaries are translated into Danish kroner at the exchange rates prevailing at the end of the reporting period for balance sheet items, and at average exchange rates for income statement items.
All effects of exchange rate adjustments are recognised in the Income statement, with the exception of exchange rate adjustments of investments in subsidiaries arising from:
• the translation of foreign subsidiaries’ net assets at the beginning of the year to the exchange rates at the end of the reporting period
• the translation of foreign subsidiaries’ statements of comprehensive income from average exchange rates to the exchange rates at the end of the reporting period
• the translation of non-current intra-Group receivables that are considered to be an addition to net investments in subsidiaries.
These specifi c exchange rate adjustments are recognised in Other com-prehensive income.
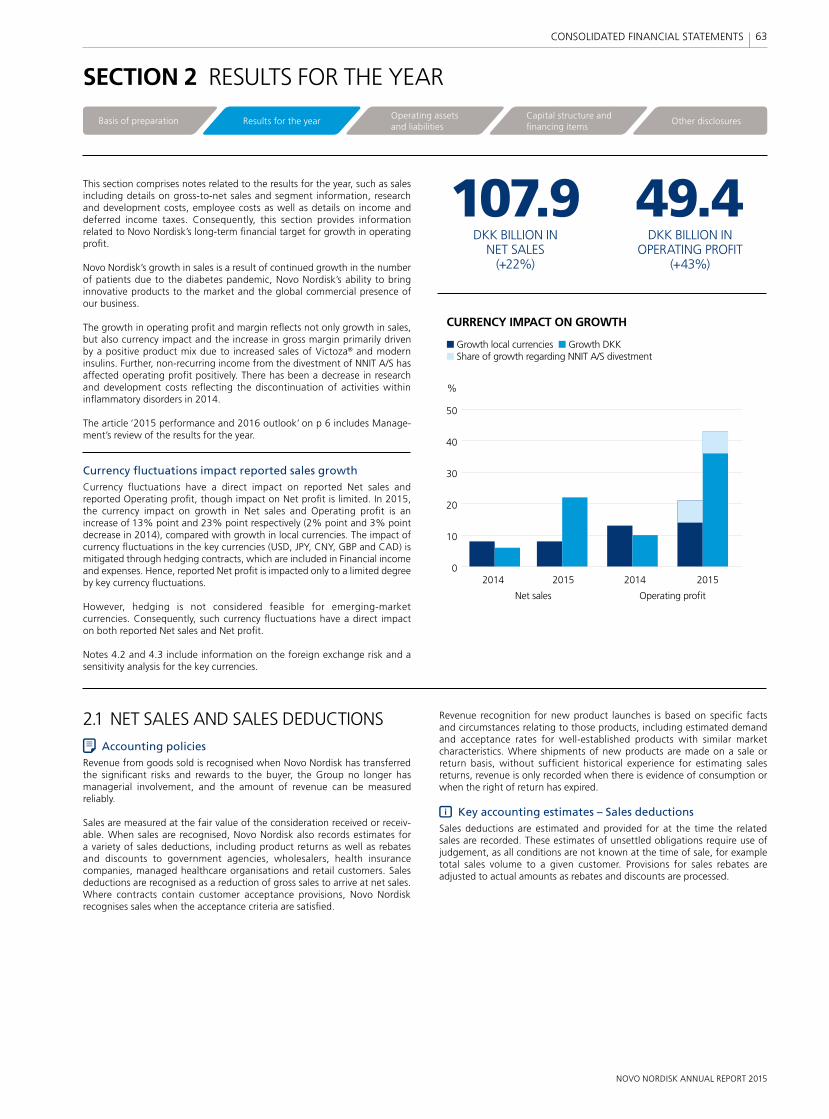
NOVO NORDISK ANNUAL REPORT 2015
63 CONSOLIDATED FINANCIAL STATEMENTS
DKK BILLION IN NET PROFIT (+32%)34.9
DKK BILLION IN NET SALES (+22%)107.9
0
10
20
30
40
50
%
2014
Net sales Operating profit
2015 20152014
Growth local currencies Growth DKK
CURRENCY IMPACT ON GROWTH
Share of growth regarding NNIT divestment
0
10
20
30
40
50
%
2014
Net sales Operating profit
2015 20152014
Growth local currencies Growth DKK Share of growth regarding NNIT A/S divestment
CURRENCY IMPACT ON GROWTH
DKK BILLION IN NET SALES
(+22%)
107.9 DKK BILLION IN
OPERATING PROFIT (+43%)
49.4 This section comprises notes related to the results for the year, such as sales including details on gross-to-net sales and segment information, research and development costs, employee costs as well as details on income and deferred income taxes. Consequently, this section provides information related to Novo Nordisk’s long-term fi nancial target for growth in operating profi t.
Novo Nordisk’s growth in sales is a result of continued growth in the number of patients due to the diabetes pandemic, Novo Nordisk’s ability to bring innovative products to the market and the global commercial presence of our business.
The growth in operating profi t and margin refl ects not only growth in sales, but also currency impact and the increase in gross margin primarily driven by a positive product mix due to increased sales of Victoza® and modern insulins. Further, non-recurring income from the divestment of NNIT A/S has affected operating profi t positively. There has been a decrease in research and development costs refl ecting the discontinuation of activities within infl ammatory disorders in 2014.
The article ‘2015 performance and 2016 outlook’ on p 6 includes Manage-ment’s review of the results for the year.
Currency fl uctuations impact reported sales growthCurrency fl uctuations have a direct impact on reported Net sales and reported Operating profi t, though impact on Net profi t is limited. In 2015, the currency impact on growth in Net sales and Operating profi t is an increase of 13% point and 23% point respectively (2% point and 3% point decrease in 2014), compared with growth in local currencies. The impact of currency fl uctuations in the key currencies (USD, JPY, CNY, GBP and CAD) is mitigated through hedging contracts, which are included in Financial income and expenses. Hence, reported Net profi t is impacted only to a limited degree by key currency fl uctuations.
However, hedging is not considered feasible for emerging-market currencies. Consequently, such currency fl uctuations have a direct impact on both reported Net sales and Net profi t.
Notes 4.2 and 4.3 include information on the foreign exchange risk and a sensitivity analysis for the key currencies.
SECTION 2 RESULTS FOR THE YEAR
2.1 NET SALES AND SALES DEDUCTIONSAccounting policies
Revenue from goods sold is recognised when Novo Nordisk has transferred the signifi cant risks and rewards to the buyer, the Group no longer has managerial involvement, and the amount of revenue can be measured reliably.
Sales are measured at the fair value of the consideration received or receiv-able. When sales are recognised, Novo Nordisk also records estimates for a variety of sales deductions, including product returns as well as rebates and discounts to government agencies, wholesalers, health insurance companies, managed healthcare organisations and retail customers. Sales deductions are recognised as a reduction of gross sales to arrive at net sales. Where contracts contain customer acceptance provisions, Novo Nordisk recognises sales when the acceptance criteria are satisfi ed.
Revenue recognition for new product launches is based on specifi c facts and circumstances relating to those products, including estimated demand and acceptance rates for well-established products with similar market characteristics. Where shipments of new products are made on a sale or return basis, without suffi cient historical experience for estimating sales returns, revenue is only recorded when there is evidence of consumption or when the right of return has expired.
Key accounting estimates – Sales deductionsSales deductions are estimated and provided for at the time the related sales are recorded. These estimates of unsettled obligations require use of judgement, as all conditions are not known at the time of sale, for example total sales volume to a given customer. Provisions for sales rebates are adjusted to actual amounts as rebates and discounts are processed.
Basis of preparation Results for the yearOperating assetsand liabilities
Capital structure and financing items
Other disclosures
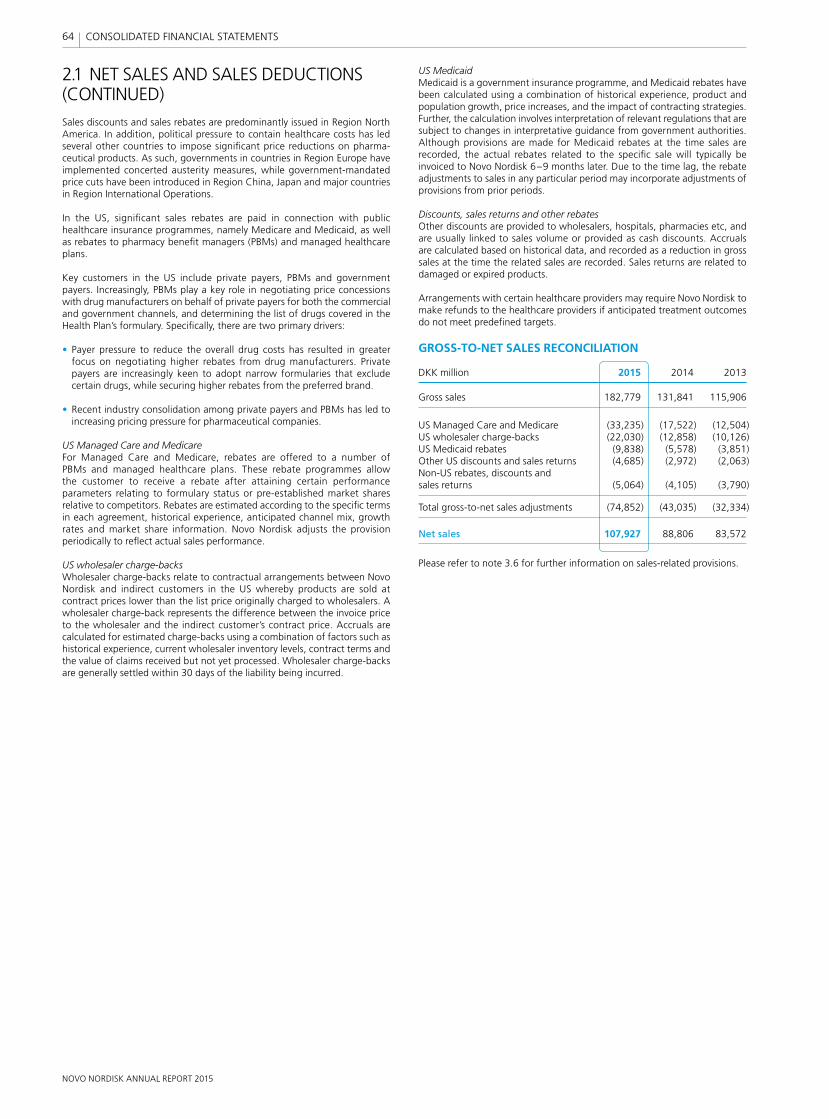
NOVO NORDISK ANNUAL REPORT 2015
64 CONSOLIDATED FINANCIAL STATEMENTS
2.1 NET SALES AND SALES DEDUCTIONS (CONTINUED)Sales discounts and sales rebates are predominantly issued in Region North America. In addition, political pressure to contain healthcare costs has led several other countries to impose signifi cant price reductions on pharma-ceutical products. As such, governments in countries in Region Europe have implemented concerted austerity measures, while government-mandated price cuts have been introduced in Region China, Japan and major countries in Region International Operations.
In the US, signifi cant sales rebates are paid in connection with public healthcare insurance programmes, namely Medicare and Medicaid, as well as rebates to pharmacy benefi t managers (PBMs) and managed healthcare plans.
Key customers in the US include private payers, PBMs and government payers. Increasingly, PBMs play a key role in negotiating price concessions with drug manufacturers on behalf of private payers for both the commercial and government channels, and determining the list of drugs covered in the Health Plan’s formulary. Specifi cally, there are two primary drivers:
• Payer pressure to reduce the overall drug costs has resulted in greater focus on negotiating higher rebates from drug manufacturers. Private payers are increasingly keen to adopt narrow formularies that exclude certain drugs, while securing higher rebates from the preferred brand.
• Recent industry consolidation among private payers and PBMs has led to increasing pricing pressure for pharmaceutical companies.
US Managed Care and MedicareFor Managed Care and Medicare, rebates are offered to a number of PBMs and managed healthcare plans. These rebate programmes allow the customer to receive a rebate after attaining certain performance parameters relating to formulary status or pre-established market shares relative to competitors. Rebates are estimated according to the specifi c terms in each agreement, historical experience, anticipated channel mix, growth rates and market share information. Novo Nordisk adjusts the provision periodically to refl ect actual sales performance.
US wholesaler charge-backsWholesaler charge-backs relate to contractual arrangements between Novo Nordisk and indirect customers in the US whereby products are sold at contract prices lower than the list price originally charged to wholesalers. A wholesaler charge-back represents the difference between the invoice price to the wholesaler and the indirect customer’s contract price. Accruals are calculated for estimated charge-backs using a combination of factors such as historical experience, current wholesaler inventory levels, contract terms and the value of claims received but not yet processed. Wholesaler charge-backs are generally settled within 30 days of the liability being incurred.
US Medicaid Medicaid is a government insurance programme, and Medicaid rebates have been calculated using a combination of historical experience, product and population growth, price increases, and the impact of contracting strategies. Further, the calculation involves interpretation of relevant regulations that are subject to changes in interpretative guidance from government authorities. Although provisions are made for Medicaid rebates at the time sales are recorded, the actual rebates related to the specifi c sale will typically be invoiced to Novo Nordisk 6–9 months later. Due to the time lag, the rebate adjustments to sales in any particular period may incorporate adjustments of provisions from prior periods.
Discounts, sales returns and other rebatesOther discounts are provided to wholesalers, hospitals, pharmacies etc, and are usually linked to sales volume or provided as cash discounts. Accruals are calculated based on historical data, and recorded as a reduction in gross sales at the time the related sales are recorded. Sales returns are related to damaged or expired products.
Arrangements with certain healthcare providers may require Novo Nordisk to make refunds to the healthcare providers if anticipated treatment outcomes do not meet predefi ned targets.
GROSS-TO-NET SALES RECONCILIATION
DKK million 2015 2014 2013
Gross sales 182,779 131,841 115,906
US Managed Care and Medicare (33,235) (17,522) (12,504)US wholesaler charge-backs (22,030) (12,858) (10,126)US Medicaid rebates (9,838) (5,578) (3,851)Other US discounts and sales returns (4,685) (2,972) (2,063)Non-US rebates, discounts and sales returns (5,064) (4,105) (3,790)
Total gross-to-net sales adjustments (74,852) (43,035) (32,334)
Net sales 107,927 88,806 83,572
Please refer to note 3.6 for further information on sales-related provisions.
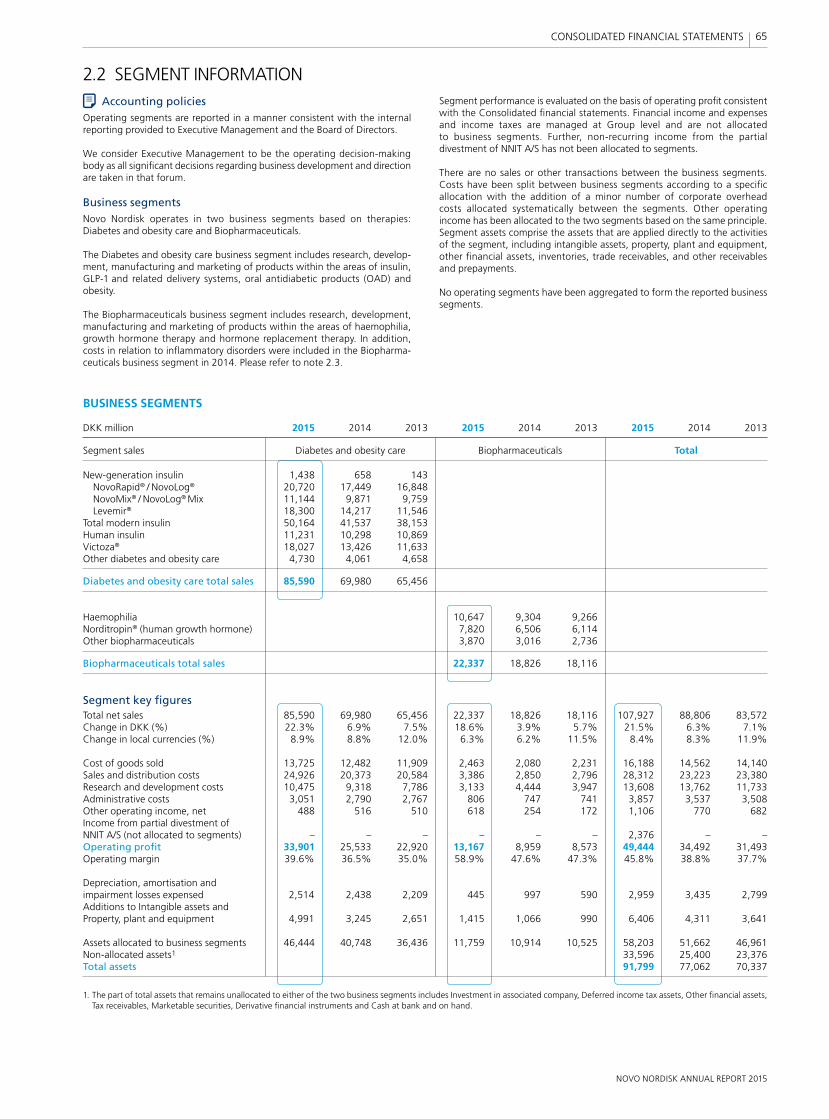
NOVO NORDISK ANNUAL REPORT 2015
65 CONSOLIDATED FINANCIAL STATEMENTS
2.2 SEGMENT INFORMATIONSegment performance is evaluated on the basis of operating profi t consistent with the Consolidated fi nancial statements. Financial income and expenses and income taxes are managed at Group level and are not allocated to business segments. Further, non-recurring income from the partial divestment of NNIT A/S has not been allocated to segments.
There are no sales or other transactions between the business segments. Costs have been split between business segments according to a specifi c allocation with the addition of a minor number of corporate overhead costs allocated systematically between the segments. Other operating income has been allocated to the two segments based on the same principle. Segment assets comprise the assets that are applied directly to the activities of the segment, including intangible assets, property, plant and equipment, other fi nancial assets, inventories, trade receivables, and other receivables and prepayments.
No operating segments have been aggregated to form the reported business segments.
Accounting policiesOperating segments are reported in a manner consistent with the internal reporting provided to Executive Management and the Board of Directors.
We consider Executive Management to be the operating decision-making body as all signifi cant decisions regarding business development and direction are taken in that forum.
Business segmentsNovo Nordisk operates in two business segments based on therapies: Diabetes and obesity care and Biopharmaceuticals.
The Diabetes and obesity care business segment includes research, develop-ment, manufacturing and marketing of products within the areas of insulin, GLP-1 and related delivery systems, oral antidiabetic products (OAD) and obesity.
The Biopharmaceuticals business segment includes research, development, manufacturing and marketing of products within the areas of haemophilia, growth hormone therapy and hormone replacement therapy. In addition, costs in relation to infl ammatory disorders were included in the Biopharma-ceuticals business segment in 2014. Please refer to note 2.3.
BUSINESS SEGMENTS
DKK million 2015 2014 2013 2015 2014 2013 2015 2014 2013
Segment sales Diabetes and obesity care Biopharmaceuticals Total
New-generation insulin 1,438 658 143 NovoRapid® / NovoLog® 20,720 17,449 16,848 NovoMix® / NovoLog® Mix 11,144 9,871 9,759 Levemir® 18,300 14,217 11,546 Total modern insulin 50,164 41,537 38,153 Human insulin 11,231 10,298 10,869 Victoza® 18,027 13,426 11,633 Other diabetes and obesity care 4,730 4,061 4,658
Diabetes and obesity care total sales 85,590 69,980 65,456
Haemophilia 10,647 9,304 9,266 Norditropin® (human growth hormone) 7,820 6,506 6,114 Other biopharmaceuticals 3,870 3,016 2,736
Biopharmaceuticals total sales 22,337 18,826 18,116
Segment key fi guresTotal net sales 85,590 69,980 65,456 22,337 18,826 18,116 107,927 88,806 83,572Change in DKK (%) 22.3% 6.9% 7.5% 18.6% 3.9% 5.7% 21.5% 6.3% 7.1%Change in local currencies (%) 8.9% 8.8% 12.0% 6.3% 6.2% 11.5% 8.4% 8.3% 11.9%
Cost of goods sold 13,725 12,482 11,909 2,463 2,080 2,231 16,188 14,562 14,140Sales and distribution costs 24,926 20,373 20,584 3,386 2,850 2,796 28,312 23,223 23,380Research and development costs 10,475 9,318 7,786 3,133 4,444 3,947 13,608 13,762 11,733Administrative costs 3,051 2,790 2,767 806 747 741 3,857 3,537 3,508Other operating income, net 488 516 510 618 254 172 1,106 770 682Income from partial divestment ofNNIT A/S (not allocated to segments) – – – – – – 2,376 – –Operating profi t 33,901 25,533 22,920 13,167 8,959 8,573 49,444 34,492 31,493Operating margin 39.6% 36.5% 35.0% 58.9% 47.6% 47.3% 45.8% 38.8% 37.7%
Depreciation, amortisation and impairment losses expensed 2,514 2,438 2,209 445 997 590 2,959 3,435 2,799Additions to Intangible assets and Property, plant and equipment 4,991 3,245 2,651 1,415 1,066 990 6,406 4,311 3,641
Assets allocated to business segments 46,444 40,748 36,436 11,759 10,914 10,525 58,203 51,662 46,961Non-allocated assets1 33,596 25,400 23,376Total assets 91,799 77,062 70,337
1. The part of total assets that remains unallocated to either of the two business segments includes Investment in associated company, Deferred income tax assets, Other fi nancial assets, Tax receivables, Marketable securities, Derivative fi nancial instruments and Cash at bank and on hand.
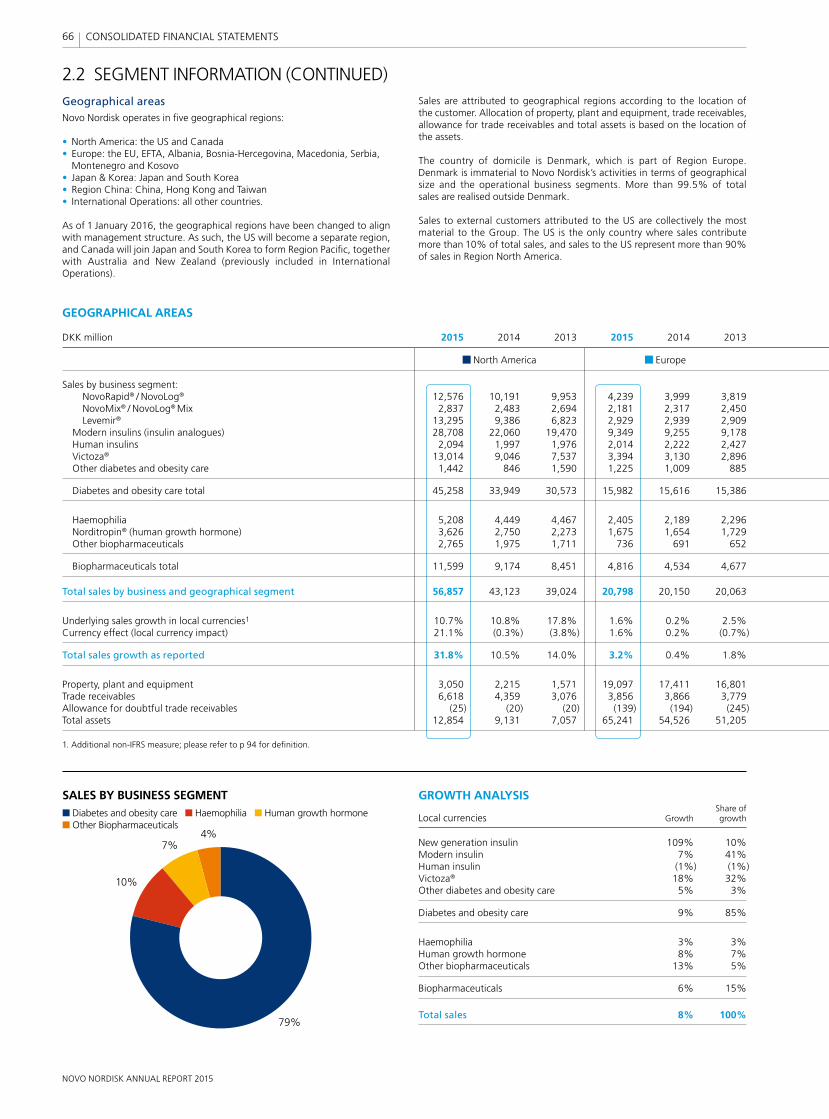
NOVO NORDISK ANNUAL REPORT 2015
66 CONSOLIDATED FINANCIAL STATEMENTS
Geographical areasNovo Nordisk operates in fi ve geographical regions:
• North America: the US and Canada• Europe: the EU, EFTA, Albania, Bosnia-Hercegovina, Macedonia, Serbia,
Montenegro and Kosovo• Japan & Korea: Japan and South Korea• Region China: China, Hong Kong and Taiwan• International Operations: all other countries.
As of 1 January 2016, the geographical regions have been changed to align with management structure. As such, the US will become a separate region, and Canada will join Japan and South Korea to form Region Pacifi c, together with Australia and New Zealand (previously included in International Operations).
Sales are attributed to geographical regions according to the location of the customer. Allocation of property, plant and equipment, trade receivables, allowance for trade receivables and total assets is based on the location of the assets.
The country of domicile is Denmark, which is part of Region Europe. Denmark is immaterial to Novo Nordisk’s activities in terms of geographical size and the operational business segments. More than 99.5% of total sales are realised outside Denmark.
Sales to external customers attributed to the US are collectively the most material to the Group. The US is the only country where sales contribute more than 10% of total sales, and sales to the US represent more than 90% of sales in Region North America.
2.2 SEGMENT INFORMATION (CONTINUED)
GROWTH ANALYSIS Share ofLocal currencies Growth growth
New generation insulin 109% 10%Modern insulin 7% 41%Human insulin (1%) (1%)Victoza® 18% 32%Other diabetes and obesity care 5% 3%
Diabetes and obesity care 9% 85%
Haemophilia 3% 3%Human growth hormone 8% 7%Other biopharmaceuticals 13% 5%
Biopharmaceuticals 6% 15%
Total sales 8% 100%
SALES BY BUSINESS SEGMENTDiabetes and obesity care Haemophilia Human growth hormone Other Biopharmaceuticals
79%
10%
7%4%
GEOGRAPHICAL AREAS
DKK million 2015 2014 2013 2015 2014 2013
North America Europe
Sales by business segment: NovoRapid® / NovoLog® 12,576 10,191 9,953 4,239 3,999 3,819 NovoMix® / NovoLog® Mix 2,837 2,483 2,694 2,181 2,317 2,450 Levemir® 13,295 9,386 6,823 2,929 2,939 2,909 Modern insulins (insulin analogues) 28,708 22,060 19,470 9,349 9,255 9,178 Human insulins 2,094 1,997 1,976 2,014 2,222 2,427 Victoza® 13,014 9,046 7,537 3,394 3,130 2,896 Other diabetes and obesity care 1,442 846 1,590 1,225 1,009 885
Diabetes and obesity care total 45,258 33,949 30,573 15,982 15,616 15,386
Haemophilia 5,208 4,449 4,467 2,405 2,189 2,296 Norditropin® (human growth hormone) 3,626 2,750 2,273 1,675 1,654 1,729 Other biopharmaceuticals 2,765 1,975 1,711 736 691 652
Biopharmaceuticals total 11,599 9,174 8,451 4,816 4,534 4,677
Total sales by business and geographical segment 56,857 43,123 39,024 20,798 20,150 20,063
Underlying sales growth in local currencies1 10.7% 10.8% 17.8% 1.6% 0.2% 2.5%Currency effect (local currency impact) 21.1% (0.3%) (3.8%) 1.6% 0.2% (0.7%)
Total sales growth as reported 31.8% 10.5% 14.0% 3.2% 0.4% 1.8%
Property, plant and equipment 3,050 2,215 1,571 19,097 17,411 16,801Trade receivables 6,618 4,359 3,076 3,856 3,866 3,779Allowance for doubtful trade receivables (25) (20) (20) (139) (194) (245)Total assets 12,854 9,131 7,057 65,241 54,526 51,205
1. Additional non-IFRS measure; please refer to p 94 for defi nition.
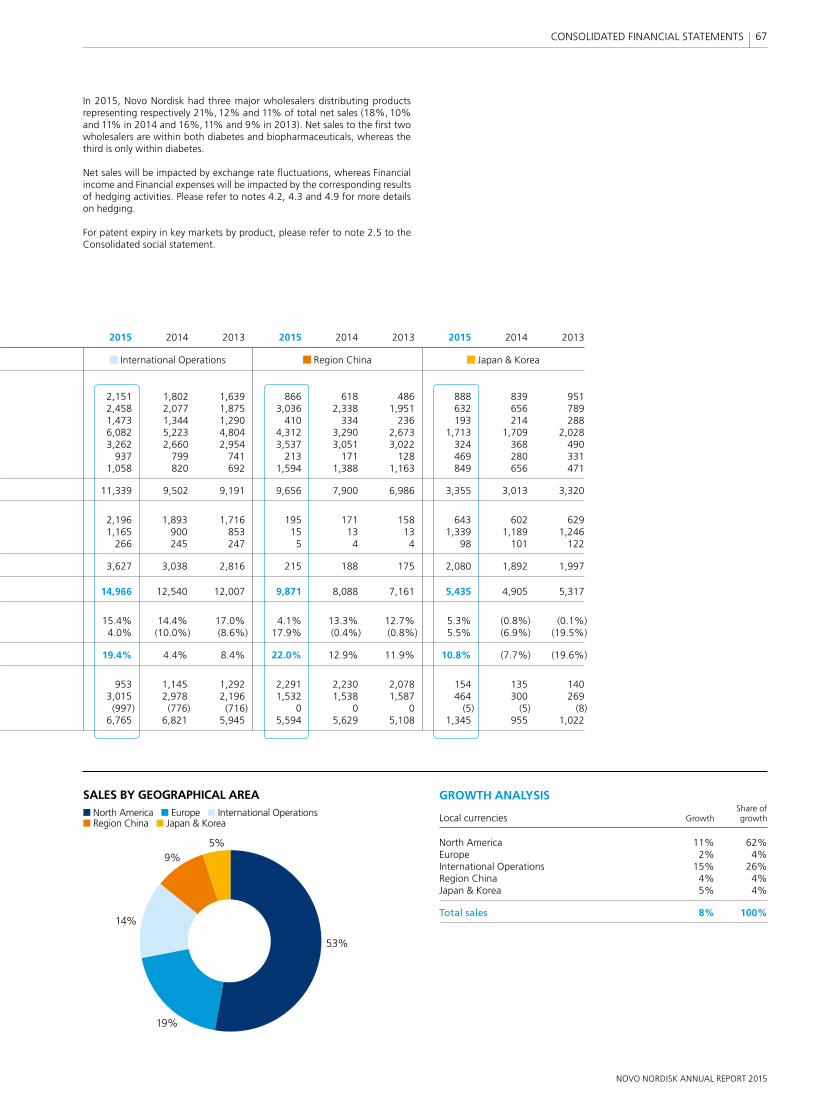
NOVO NORDISK ANNUAL REPORT 2015
67 CONSOLIDATED FINANCIAL STATEMENTS
In 2015, Novo Nordisk had three major wholesalers distributing products representing respectively 21%, 12% and 11% of total net sales (18%, 10% and 11% in 2014 and 16%, 11% and 9% in 2013). Net sales to the fi rst two wholesalers are within both diabetes and biopharmaceuticals, whereas the third is only within diabetes.
Net sales will be impacted by exchange rate fl uctuations, whereas Financial income and Financial expenses will be impacted by the corresponding results of hedging activities. Please refer to notes 4.2, 4.3 and 4.9 for more details on hedging.
For patent expiry in key markets by product, please refer to note 2.5 to the Consolidated social statement.
GROWTH ANALYSIS Share ofLocal currencies Growth growth
North America 11% 62%Europe 2% 4%International Operations 15% 26%Region China 4% 4%Japan & Korea 5% 4%
Total sales 8% 100%
SALES BY GEOGRAPHICAL AREANorth America Europe International Operations Region China Japan & Korea
53%
19%
14%
5%9%
2015 2014 2013 2015 2014 2013 2015 2014 2013
International Operations Region China Japan & Korea
2,151 1,802 1,639 866 618 486 888 839 951 2,458 2,077 1,875 3,036 2,338 1,951 632 656 789 1,473 1,344 1,290 410 334 236 193 214 288 6,082 5,223 4,804 4,312 3,290 2,673 1,713 1,709 2,028 3,262 2,660 2,954 3,537 3,051 3,022 324 368 490 937 799 741 213 171 128 469 280 331 1,058 820 692 1,594 1,388 1,163 849 656 471
11,339 9,502 9,191 9,656 7,900 6,986 3,355 3,013 3,320
2,196 1,893 1,716 195 171 158 643 602 629 1,165 900 853 15 13 13 1,339 1,189 1,246 266 245 247 5 4 4 98 101 122
3,627 3,038 2,816 215 188 175 2,080 1,892 1,997
14,966 12,540 12,007 9,871 8,088 7,161 5,435 4,905 5,317
15.4% 14.4% 17.0% 4.1% 13.3% 12.7% 5.3% (0.8%) (0.1%) 4.0% (10.0%) (8.6%) 17.9% (0.4%) (0.8%) 5.5% (6.9%) (19.5%)
19.4% 4.4% 8.4% 22.0% 12.9% 11.9% 10.8% (7.7%) (19.6%)
953 1,145 1,292 2,291 2,230 2,078 154 135 140 3,015 2,978 2,196 1,532 1,538 1,587 464 300 269 (997) (776) (716) 0 0 0 (5) (5) (8) 6,765 6,821 5,945 5,594 5,629 5,108 1,345 955 1,022
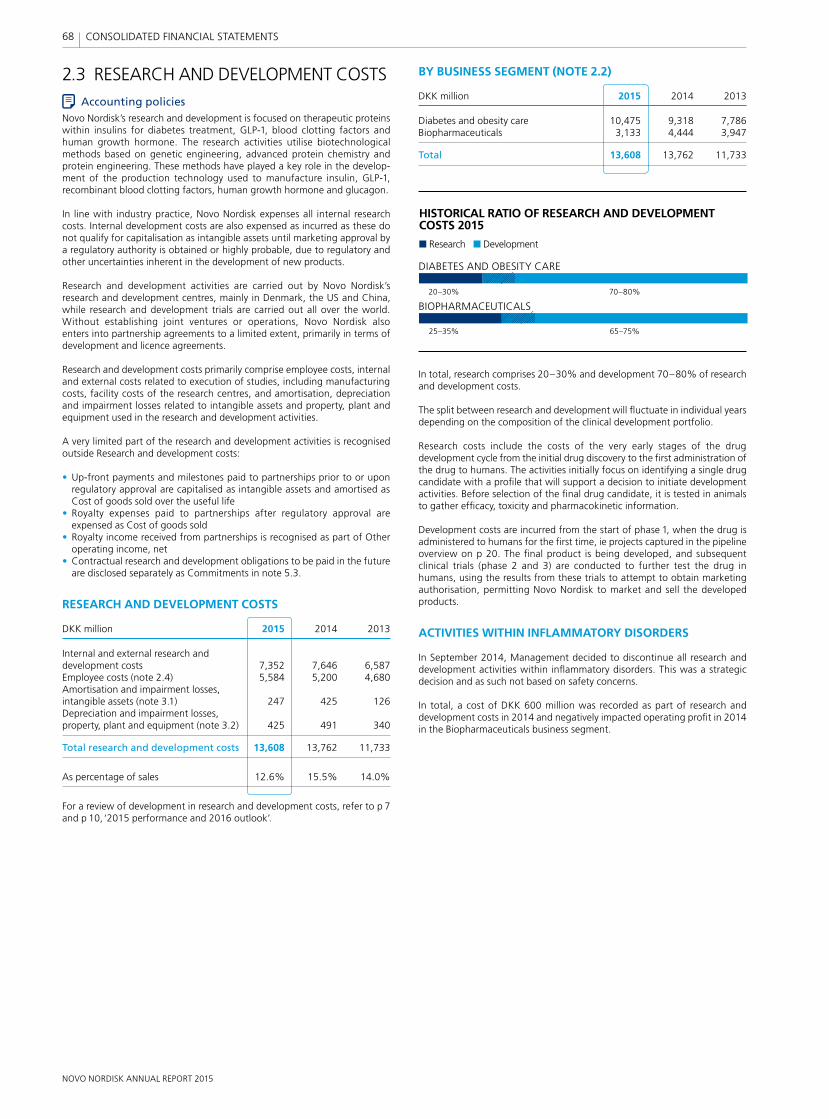
NOVO NORDISK ANNUAL REPORT 2015
68 CONSOLIDATED FINANCIAL STATEMENTS
In total, research comprises 20–30% and development 70–80% of research and development costs.
The split between research and development will fl uctuate in individual years depending on the composition of the clinical development portfolio.
Research costs include the costs of the very early stages of the drug development cycle from the initial drug discovery to the fi rst administration of the drug to humans. The activities initially focus on identifying a single drug candidate with a profi le that will support a decision to initiate development activities. Before selection of the fi nal drug candidate, it is tested in animals to gather effi cacy, toxicity and pharmacokinetic information.
Development costs are incurred from the start of phase 1, when the drug is administered to humans for the fi rst time, ie projects captured in the pipeline overview on p 20. The fi nal product is being developed, and subsequent clinical trials (phase 2 and 3) are conducted to further test the drug in humans, using the results from these trials to attempt to obtain marketing authorisation, permitting Novo Nordisk to market and sell the developed products.
ACTIVITIES WITHIN INFLAMMATORY DISORDERS
In September 2014, Management decided to discontinue all research and development activities within infl ammatory disorders. This was a strategic decision and as such not based on safety concerns.
In total, a cost of DKK 600 million was recorded as part of research and development costs in 2014 and negatively impacted operating profi t in 2014 in the Biopharmaceuticals business segment.
HISTORICAL RATIO OF RESEARCH AND DEVELOPMENT COSTS 2015
Research Development
25–35%
20–30%
65–75%
70–80%
DIABETES AND OBESITY CARE
BIOPHARMACEUTICALS
2.3 RESEARCH AND DEVELOPMENT COSTSAccounting policies
Novo Nordisk’s research and development is focused on therapeutic proteins within insulins for diabetes treatment, GLP-1, blood clotting factors and human growth hormone. The research activities utilise biotechnological methods based on genetic engineering, advanced protein chemistry and protein engineering. These methods have played a key role in the develop-ment of the production technology used to manufacture insulin, GLP-1, recombinant blood clotting factors, human growth hormone and glucagon.
In line with industry practice, Novo Nordisk expenses all internal research costs. Internal development costs are also expensed as incurred as these do not qualify for capitalisation as intangible assets until marketing approval by a regulatory authority is obtained or highly probable, due to regulatory and other uncertainties inherent in the development of new products.
Research and development activities are carried out by Novo Nordisk’s research and development centres, mainly in Denmark, the US and China, while research and development trials are carried out all over the world. Without establishing joint ventures or operations, Novo Nordisk also enters into partnership agreements to a limited extent, primarily in terms of development and licence agreements.
Research and development costs primarily comprise employee costs, internal and external costs related to execution of studies, including manufacturing costs, facility costs of the research centres, and amortisation, depreciation and impairment losses related to intangible assets and property, plant and equipment used in the research and development activities.
A very limited part of the research and development activities is recognised outside Research and development costs:
• Up-front payments and milestones paid to partnerships prior to or upon regulatory approval are capitalised as intangible assets and amortised as Cost of goods sold over the useful life
• Royalty expenses paid to partnerships after regulatory approval are expensed as Cost of goods sold
• Royalty income received from partnerships is recognised as part of Other operating income, net
• Contractual research and development obligations to be paid in the future are disclosed separately as Commitments in note 5.3.
RESEARCH AND DEVELOPMENT COSTS
DKK million 2015 2014 2013
Internal and external research and development costs 7,352 7,646 6,587Employee costs (note 2.4) 5,584 5,200 4,680Amortisation and impairment losses, intangible assets (note 3.1) 247 425 126Depreciation and impairment losses, property, plant and equipment (note 3.2) 425 491 340
Total research and development costs 13,608 13,762 11,733
As percentage of sales 12.6% 15.5% 14.0%
For a review of development in research and development costs, refer to p 7 and p 10, ‘2015 performance and 2016 outlook’.
BY BUSINESS SEGMENT (NOTE 2.2)
DKK million 2015 2014 2013
Diabetes and obesity care 10,475 9,318 7,786Biopharmaceuticals 3,133 4,444 3,947
Total 13,608 13,762 11,733
NOVO NORDISK ANNUAL REPORT 2015
69 CONSOLIDATED FINANCIAL STATEMENTS
2.4 EMPLOYEE COSTSAccounting policies
Wages, salaries, social security contributions, annual leave and sick leave, bonuses and non-monetary benefi ts are recognised in the year in which the associated services are rendered by employees of Novo Nordisk. Where Novo Nordisk provides long-term employee benefi ts, the costs are accrued to match the rendering of the services by the employees concerned.
EMPLOYEE COSTS
DKK million 2015 2014 2013
Wages and salaries 23,289 21,306 19,077Share-based payment costs (note 5.1) 442 371 409Pensions – defi ned contribution plans 1,715 1,607 1,428Pensions – defi ned benefi t plans (note 3.5) 154 142 113Other social security contributions 1,783 1,617 1,489Other employee costs 2,117 1,944 1,891
Total employee costs for the year 29,500 26,987 24,407
Employee costs included in intangible assets and property, plant and equipment1 (957) (866) (772)Change in employee costs included in inventories (191) (206) (29)
Total employee costs in the Income statement 28,352 25,915 23,606
Included in the Income statement:Cost of goods sold 7,239 6,224 5,160Sales and distribution costs 12,231 10,334 9,831Research and development costs 5,584 5,200 4,680Administrative costs 2,658 2,426 2,250Other operating income, net 640 1,731 1,685
Total employee costs in the Income statement 28,352 25,915 23,606
1. This refl ects annual gross employee costs included in intangible assets and property, plant and equipment that will subsequently be included in depreciation and impairment losses.
Average number of full-time employees2 40,342 40,164 36,144Year-end number of full-time employees2 40,638 40,957 37,978
2. Full-time equivalent employees in 2014 in NNIT A/S was approximately 2,400.
REMUNERATION TO EXECUTIVE MANAGEMENT AND BOARD OF DIRECTORS
Effective 30 April 2015, Novo Nordisk’s Executive Management was expanded to include four new members. Remuneration to the new members has been included from 30 April 2015.
DKK million 2015 2014 2013
Salary and cash bonus 89 71 58Pension 22 18 15Benefi ts4 7 2 2Share-based incentive 44 27 21Severance payments1,4 73 32 –
Executive Management in total1,2,3 235 150 96
Fee to Board of Directors 12 9 9
Total 247 159 105
1. Please refer to note 5.1 and ’Remuneration’, pp 49–51, for further information.2. EVP Kåre Schulz left Novo Nordisk as of 30 April 2015. The 2015 remuneration for
Kåre Schultz is included in the above table together with severance payments of DKK 72.7 million. In November 2014 EVP Lise Kingo decided to leave Novo Nordisk. The 2014 remuneration for Lise Kingo is included in the above table together with severance payments of DKK 32.2 million.
3. Total remuneration for registered members of Executive Management amounts to DKK 108 million.
4. Benefi ts is included in Other employee costs and severance payments is included in wages and salaries in the table to the left.
2.5 OTHER OPERATING INCOME, NETAccounting policies
Other operating income (net) comprises licence income and income of a secondary nature in relation to the main activities of Novo Nordisk. Licence income is recognised on an accrual basis in accordance with the terms and substance of the relevant agreement. Net profi t, not related to Novo Nordisk, from the wholly owned subsidiary NNE Pharmaplan A/S is recognised as Other operating income. Other operating income also includes income from sale of intellectual property rights.
Divested subsidiaries are recognised in the consolidated income statement until the time when control is lost. Net gain or loss on divestments is determined as the difference between the sales proceeds and the carrying amount of net assets.
FINANCIAL IMPACT OF PARTIAL DIVESTMENT OF NNIT A/S
As a result of the Initial Public Offering of NNIT A/S on 6 March 2015, Novo Nordisk A/S disposed of 74.5% of the 100% interest held in the company.
DKK million 2015
Sales proceeds from partial divestment 2,328Non-current assets (431)Current assets (836)Non-current liabilities 67Current liabilities 601Retained 25.5% investment in NNIT A/S 153Fair value revaluation of retained investment 644
Non-recurring income from divestment of 74.5% of NNIT A/S 2,526
Costs related to the divestment (150)
Net gain recognised in the Income statement as part of ‘Other operating income, net’ 2,376
Sales proceeds from partial divestment 2,328Cash balance disposed (25)
Consideration received recognised in the Cash fl ow statement 2,303
NOVO NORDISK ANNUAL REPORT 2015
70 CONSOLIDATED FINANCIAL STATEMENTS
2.6 INCOME TAXES AND DEFERRED INCOME TAXESINCOME TAXES
Accounting policiesThe tax expense for the period comprises current and deferred tax and interest on tax cases ongoing or settled during the year, including adjust-ments to previous years and changes in provision for uncertain tax positions. Tax is recognised in the Income statement, except to the extent that it relates to items recognised in Equity or in Other comprehensive income.
Ongoing tax disputes, primarily related to transfer pricing cases, are included individually as part of deferred tax assets, tax receivables and tax payables.
Key accounting estimate – Income taxesNovo Nordisk is subject to income taxes around the world. Signifi cant judgement is required in determining the worldwide accrual for income taxes, deferred income tax assets and liabilities, and provision for uncertain tax positions. Novo Nordisk recognises deferred income tax assets if it is probable that suffi cient taxable income will be available in the future against which the temporary differences and unused tax losses can be utilised. Management has considered future taxable income in assessing whether deferred income tax assets should be recognised. In the course of con ducting business globally, transfer pricing disputes with tax authorities may occur, and Management judgement is applied to assess the possible outcome of such disputes. The most probable outcome is used as the measurement method, and Novo Nordisk believes that the provision made for uncertain tax positions not yet settled with local tax authorities is adequate. However, the actual obligation may deviate and is dependent on the result of litigations and settlements with the relevant tax authorities.
INCOME TAXES EXPENSED
DKK million 2015 2014 2013
Current tax on profi t for the year 9,648 8,562 8,540Deferred tax on profi t for the year (1,130) (748) (682)
Tax on profi t for the year 8,518 7,814 7,858Adjustments recognised for current tax of prior periods 3 (313) (74)Adjustments recognised for deferred tax of prior periods 102 114 (429)
Income taxes in the Income statement 8,623 7,615 7,355
Tax on other comprehensive income for the year, (income)/expense 87 (977) 211
Adjustments recognised for prior periods include adjustments caused by events that occurred in the current year related to current and deferred tax of prior periods. Such adjustments predominantly arise from tax payments regarding tax disputes related to transfer pricing and reversal of associated tax liability recognised in prior periods.
Tax on other comprehensive income for the year relates to tax on deferred (gains)/losses on cash fl ow hedges and internal profi t in inventories. This loss is offset by currency adjustment of DKK 99 million in 2014 recognised as current tax in Other comprehensive income in 2015.
DKK million 2015 2014 2013
Computation of effective tax rate:Statutory corporate income tax rate in Denmark 23.5% 24.5% 25.0%Deviation in foreign subsidiaries’ tax rates compared with the Danish tax rate (net) (2.9%) (1.9%) (2.0%)Non-taxable income from partial divestment of NNIT A/S (1.3%) – –Non-taxable income less non-tax-deductible expenses (net) 0.1% (0.0%) (0.0%)Effect on deferred tax related to change in the Danish corporate tax rate – – (0.3%)Other 0.4% (0.3%) (0.1%)
Effective tax rate 19.8% 22.3% 22.6%
Computation of effective tax amount:Corporate income tax at tax rate in Denmark 10,218 8,354 8,135Impact from deviation in foreign subsidiaries’ tax rates compared with the Danish tax rate (net) (1,240) (623) (636)Non-taxable income from partial divestment of NNIT A/S (558) – –Non-taxable income less non-tax-deductible expenses (net) 6 (12) (8)Effect on deferred tax related to change in the Danish corporate tax rate – – (99)Other 197 (104) (37)
Effective tax amount 8,623 7,615 7,355
The impact of the deviation in foreign subsidiaries’ tax rates compared with the Danish tax rate is mainly driven by Swiss and US business activities.
INCOME TAXES PAID
DKK million 2015 2014 2013
Income taxes paid in Denmark 5,469 4,936 7,363Income taxes paid outside Denmark 3,905 2,971 2,444
Total income taxes paid 9,374 7,907 9,807
The income taxes paid in Denmark in 2013 include adjustments arising from ongoing tax disputes primarily related to transfer pricing from prior periods.
DEFERRED INCOME TAXES
Accounting policiesDeferred income taxes arise from temporary differences between the accounting and taxable values of the individual consolidated companies and from realisable tax loss carry-forwards using the liability method. The tax value of tax loss carry-forwards is included in deferred tax assets to the extent that the tax losses and other tax assets are expected to be utilised in future taxable income. The deferred income taxes are measured according to current tax rules and at the tax rates expected to be in force on elimina-tion of the temporary differences. In general, the Danish tax rules related to company distributions provide exemption from tax for most repatriated profi ts. No provision is made for income taxes that would be payable on the distribution of unremitted earnings unless a concrete distribution of earnings is planned. The potential withholding tax amounts to DKK 288 million for 2015 (DKK 212 million in 2014).
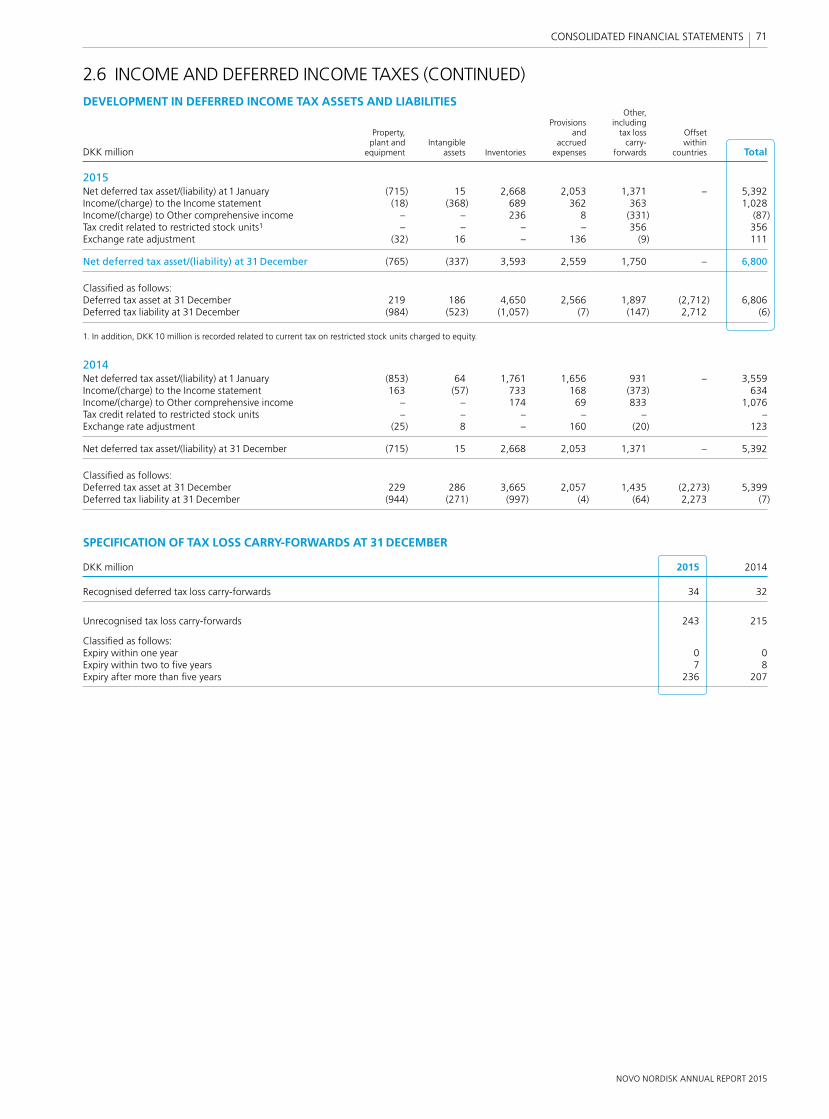
NOVO NORDISK ANNUAL REPORT 2015
71 CONSOLIDATED FINANCIAL STATEMENTS
2.6 INCOME AND DEFERRED INCOME TAXES (CONTINUED)DEVELOPMENT IN DEFERRED INCOME TAX ASSETS AND LIABILITIES Other, Provisions including Property, and tax loss Offset plant and Intangible accrued carry- within DKK million equipment assets Inventories expenses forwards countries Total
2015Net deferred tax asset/(liability) at 1 January (715) 15 2,668 2,053 1,371 – 5,392Income/(charge) to the Income statement (18) (368) 689 362 363 1,028Income/(charge) to Other comprehensive income – – 236 8 (331) (87)Tax credit related to restricted stock units1 – – – – 356 356Exchange rate adjustment (32) 16 – 136 (9) 111
Net deferred tax asset/(liability) at 31 December (765) (337) 3,593 2,559 1,750 – 6,800
Classifi ed as follows:Deferred tax asset at 31 December 219 186 4,650 2,566 1,897 (2,712) 6,806Deferred tax liability at 31 December (984) (523) (1,057) (7) (147) 2,712 (6)
1. In addition, DKK 10 million is recorded related to current tax on restricted stock units charged to equity.
2014Net deferred tax asset/(liability) at 1 January (853) 64 1,761 1,656 931 – 3,559Income/(charge) to the Income statement 163 (57) 733 168 (373) 634Income/(charge) to Other comprehensive income – – 174 69 833 1,076Tax credit related to restricted stock units – – – – – –Exchange rate adjustment (25) 8 – 160 (20) 123
Net deferred tax asset/(liability) at 31 December (715) 15 2,668 2,053 1,371 – 5,392
Classifi ed as follows:Deferred tax asset at 31 December 229 286 3,665 2,057 1,435 (2,273) 5,399Deferred tax liability at 31 December (944) (271) (997) (4) (64) 2,273 (7)
SPECIFICATION OF TAX LOSS CARRY-FORWARDS AT 31 DECEMBER
DKK million 2015 2014
Recognised deferred tax loss carry-forwards 34 32
Unrecognised tax loss carry-forwards 243 215
Classifi ed as follows:Expiry within one year 0 0Expiry within two to fi ve years 7 8Expiry after more than fi ve years 236 207
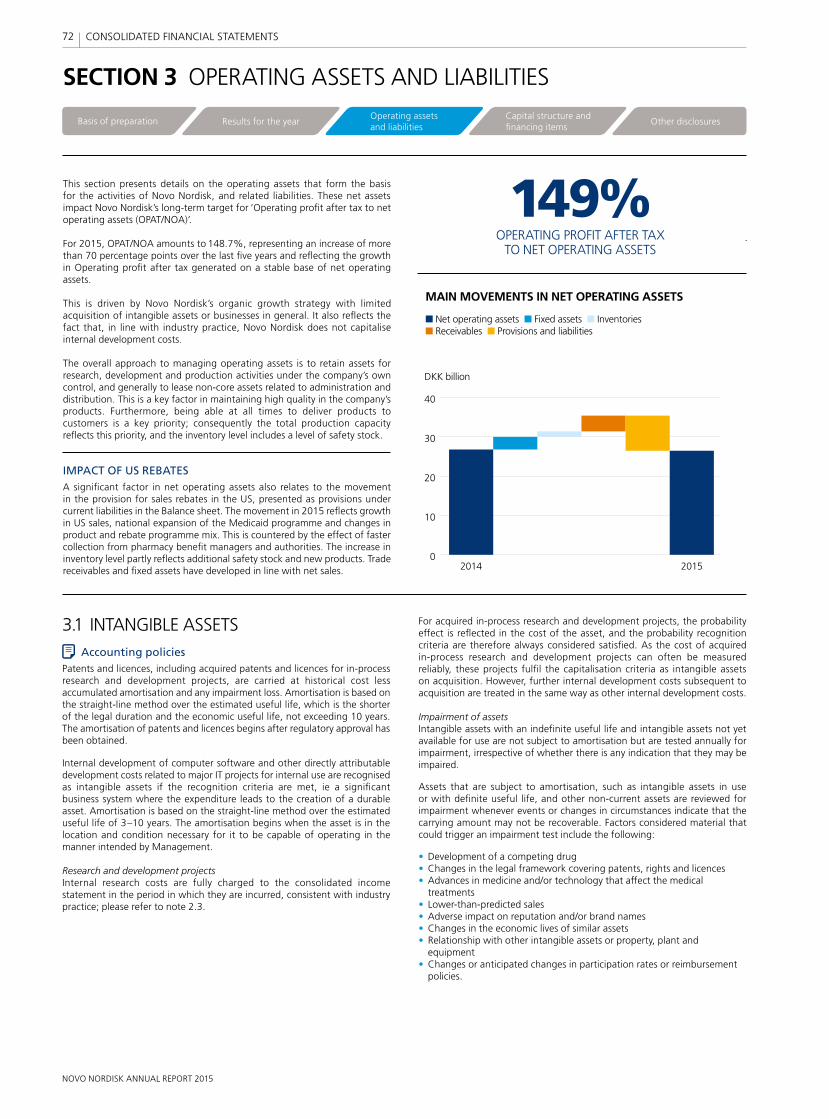
NOVO NORDISK ANNUAL REPORT 2015
72 CONSOLIDATED FINANCIAL STATEMENTS
148.7% OPERATING PROFITAFTER TAX TO NET OPERATING ASSETS
0
10
20
30
40
MAIN MOVEMENTS IN NET OPERATING ASSETS
DKK billion
Net operating assets Fixed assets Inventories
Receivables Provisions and liabilities
2014 2015
149%OPERATING PROFIT AFTER TAX
TO NET OPERATING ASSETS
0
10
20
30
40
MAIN MOVEMENTS IN NET OPERATING ASSETS
DKK billion
Net operating assets Fixed assets Inventories Receivables Provisions and liabilities
2014 2015
For acquired in-process research and development projects, the probability effect is refl ected in the cost of the asset, and the probability recognition criteria are therefore always considered satisfi ed. As the cost of acquired in-process research and development projects can often be measured reliably, these projects fulfi l the capitalisation criteria as intangible assets on acquisition. However, further internal development costs subsequent to acquisition are treated in the same way as other internal development costs.
Impairment of assets Intangible assets with an indefi nite useful life and intangible assets not yet available for use are not subject to amortisation but are tested annually for impairment, irrespective of whether there is any indication that they may be impaired.
Assets that are subject to amortisation, such as intangible assets in use or with defi nite useful life, and other non-current assets are reviewed for impairment whenever events or changes in circumstances indicate that the carrying amount may not be recoverable. Factors considered material that could trigger an impairment test include the following:
• Development of a competing drug• Changes in the legal framework covering patents, rights and licences• Advances in medicine and/or technology that affect the medical
treatments• Lower-than-predicted sales• Adverse impact on reputation and/or brand names• Changes in the economic lives of similar assets• Relationship with other intangible assets or property, plant and
equipment• Changes or anticipated changes in participation rates or reimbursement
policies.
This section presents details on the operating assets that form the basis for the activities of Novo Nordisk, and related liabilities. These net assets impact Novo Nordisk’s long-term target for ‘Operating profi t after tax to net operating assets (OPAT/NOA)’.
For 2015, OPAT/NOA amounts to 148.7%, representing an increase of more than 70 percentage points over the last fi ve years and refl ecting the growth in Operating profi t after tax generated on a stable base of net operating assets.
This is driven by Novo Nordisk’s organic growth strategy with limited acquisition of intangible assets or businesses in general. It also refl ects the fact that, in line with industry practice, Novo Nordisk does not capitalise internal development costs.
The overall approach to managing operating assets is to retain assets for research, development and production activities under the company’s own control, and generally to lease non-core assets related to administration and distribution. This is a key factor in maintaining high quality in the company’s products. Furthermore, being able at all times to deliver products to customers is a key priority; consequently the total production capacity refl ects this priority, and the inventory level includes a level of safety stock.
IMPACT OF US REBATESA signifi cant factor in net operating assets also relates to the movement in the provision for sales rebates in the US, presented as provisions under current liabilities in the Balance sheet. The movement in 2015 refl ects growth in US sales, national expansion of the Medicaid programme and changes in product and rebate programme mix. This is countered by the effect of faster collection from pharmacy benefi t managers and authorities. The increase in inventory level partly refl ects additional safety stock and new products. Trade receivables and fi xed assets have developed in line with net sales.
SECTION 3 OPERATING ASSETS AND LIABILITIES
3.1 INTANGIBLE ASSETSAccounting policies
Patents and licences, including acquired patents and licences for in-process research and development projects, are carried at historical cost less accumulated amortisation and any impairment loss. Amortisation is based on the straight-line method over the estimated useful life, which is the shorter of the legal duration and the economic useful life, not exceeding 10 years. The amortisation of patents and licences begins after regulatory approval has been obtained.
Internal development of computer software and other directly attributable development costs related to major IT projects for internal use are recognised as intangible assets if the recognition criteria are met, ie a signifi cant business system where the expenditure leads to the creation of a durable asset. Amortisation is based on the straight-line method over the estimated useful life of 3–10 years. The amortisation begins when the asset is in the location and condition necessary for it to be capable of operating in the manner intended by Management.
Research and development projectsInternal research costs are fully charged to the consolidated income statement in the period in which they are incurred, consistent with industry practice; please refer to note 2.3.
Basis of preparation Results for the yearOperating assetsand liabilities
Capital structure and financing items
Other disclosures
NOVO NORDISK ANNUAL REPORT 2015
73 CONSOLIDATED FINANCIAL STATEMENTS
3.2 PROPERTY, PLANT AND EQUIPMENTAccounting policies
Property, plant and equipment is measured at historical cost less accu-mulated depreciation and any impairment loss. The cost of self-constructed assets includes costs directly and indirectly attributable to the construction of the assets. Subsequent cost is included in the asset’s carrying amount or recognised as a separate asset only when it is probable that future economic benefi ts associated with the item will fl ow to Novo Nordisk and the cost of the item can be measured reliably. In general, construction of major investments is self-fi nanced and thus no interest on loans is capitalised as part of the cost. Depreciation is based on the straight-line method over the estimated useful lives of the assets:
• Buildings: 12–50 years• Plant and machinery: 5–16 years• Other equipment: 3–10 years• Land: not depreciated.
The depreciation commences when the asset is available for use, ie when it is in the location and condition necessary for it to be capable of operating in the manner intended by Management.
The assets’ residual values and useful lives are reviewed and adjusted, if appropriate, at the end of each reporting period. If the asset’s carrying amount is higher than its estimated recoverable amount, it is written down to the recoverable amount; please refer to note 3.1 for a description of impairment of assets. Gains and losses on disposals are determined by comparing the proceeds with the carrying amount and are recognised in the Income statement.
Plant and equipment with no alternative use developed as part of a research and development project is expensed. However, plant and equipment with an alternative use or used for general research and development purposes is capitalised and depreciated over its estimated useful life as research and development costs.
3.1 INTANGIBLE ASSETS (CONTINUED)If the carrying amount of intangible assets exceeds the recoverable amount based on the existence of one or more of the above indicators of impairment, any impairment is measured based on discounted projected cash fl ows. Impairments are reviewed at each reporting date for possible reversal.
INTANGIBLE ASSETS
DKK million 2015 2014
Patents and licences 1,139 454In-process and developed software 1,019 924
Total 2,158 1,378
In 2015, an impairment loss of DKK 243 million (DKK 423 million in 2014) related to patents and licences was recognised.
Intangible assets not yet in use amount to DKK 1,261 million (DKK 656 million in 2014), primarily patents and licences in relation to research and development projects. Impairment tests in 2015 and 2014 of patents and licences not yet in use are based on Management’s projections and anticipated net present value of estimated future cash flows from marketable products. Management has used a pre-tax discount rate (WACC) of 8% based on the risk inherent in the related activity’s current business model and industry comparisons. Terminal values used are based on the expected life of products, forecasted life cycle and cash fl ow over that period, and the useful life of the underlying assets.
AMORTISATION AND IMPAIRMENT LOSSES
DKK million 2015 2014
Cost of goods sold 127 105Sales and distribution costs 11 28Research and development costs 247 425Other operating income, net 7 8
Total amortisation and impairment losses 392 566
For further information regarding 2014 impairment of infl ammation projects, please refer to note 2.3.

NOVO NORDISK ANNUAL REPORT 2015
74 CONSOLIDATED FINANCIAL STATEMENTS
3.2 PROPERTY, PLANT AND EQUIPMENT (CONTINUED)PROPERTY, PLANT AND EQUIPMENT Assets in Land and Plant and Other course of DKK million buildings machinery equipment construction Total
2015Cost at the beginning of the year 17,391 20,410 3,882 5,801 47,484Additions during the year 334 456 222 4,212 5,224Disposals during the year (159) (366) (228) – (753)Disposals related to partial divestment of NNIT A/S (188) (2) (657) – (847)Transfer from/(to) other items 658 1,565 264 (2,487) 0Effect of exchange rate adjustment (33) (28) 33 90 62
Cost at the end of the year 18,003 22,035 3,516 7,616 51,170
Depreciation and impairment losses at the beginning of the year 6,933 14,910 2,505 – 24,348Depreciation for the year 761 1,381 328 – 2,470Impairment losses for the year 8 65 24 – 97Depreciation and impairment losses reversed on disposals during the year (140) (332) (215) – (687)Depreciation reversed related to partial divestment of NNIT A/S (61) (2) (387) – (450)Effect of exchange rate adjustment (53) (122) 22 – (153)
Depreciation and impairment losses at the end of the year 7,448 15,900 2,277 – 25,625
Carrying amount at the end of the year 10,555 6,135 1,239 7,616 25,545
2014Cost at the beginning of the year 16,184 18,964 3,457 5,432 44,037Additions during the year 234 459 384 2,913 3,990Disposals during the year (392) (324) (279) – (995)Transfer from/(to) other items 1,156 1,168 250 (2,574) 0Effect of exchange rate adjustment 209 143 70 30 452
Cost at the end of the year 17,391 20,410 3,882 5,801 47,484
Depreciation and impairment losses at the beginning of the year 6,267 13,614 2,274 – 22,155Depreciation for the year 855 1,436 362 – 2,653Impairment losses for the year 94 42 80 – 216Depreciation and impairment losses reversed on disposals during the year (297) (265) (260) – (822)Effect of exchange rate adjustment 14 83 49 – 146
Depreciation and impairment losses at the end of the year 6,933 14,910 2,505 – 24,348
Carrying amount at the end of the year 10,458 5,500 1,377 5,801 23,136
DEPRECIATION AND IMPAIRMENT LOSSES
DKK million 2015 2014
Cost of goods sold 2,008 2,141Sales and distribution costs 54 36Research and development costs 425 491Administrative costs 53 83Other operating income, net 27 118
Total depreciation and impairment losses 2,567 2,869
NOVO NORDISK ANNUAL REPORT 2015
75 CONSOLIDATED FINANCIAL STATEMENTS
3.3 INVENTORIESAccounting policies
Inventories are stated at the lower of cost and net realisable value. Cost is determined using the fi rst-in, fi rst-out method. Cost comprises direct production costs such as raw materials, consumables and labour as well as indirect production costs. Production costs for work in progress and fi nished goods include indirect production costs such as employee costs, deprecia-tion, maintenance etc.
If the expected sales price less completion costs to execute sales (net realis-able value) is lower than the carrying amount, a write-down is recognised for the amount by which the carrying amount exceeds its net realisable value.
Inventory manufactured prior to regulatory approval (pre-launch inventory) is capitalised but immediately provided for, until there is a high probability of regulatory approval of the product. Before that point, a provision is made against the carrying amount of inventory to its recoverable amount and recorded as research and development costs. At the point when a high probability of regulatory approval is obtained, the provision recorded is reversed, up to no more than the original cost.
Key accounting estimate – Indirect production costsIndirect production costs account for 50% of the net inventory value, refl ecting a lengthy production process compared with low direct raw material cost. The production of both diabetes and obesity care and Biopharmaceutical products is highly complex from fermentation to purifi cation and formulation, including quality control of all production processes. Furthermore, the process is very sensitive to manufacturing conditions. These factors all infl uence the parameters for capitalisation of indirect production costs in Novo Nordisk and full cost of the products. Indirect production costs are measured using a standard cost method, which is reviewed regularly to ensure relevant measures of capacity utilisation, production lead time, cost base and other relevant factors, hence inventory is valued at actual cost. When calculating total inventory, Management must make certain judgements about cost of production, standard cost variances and idle capacity in estimating indirect production costs for capitalisation. Changes in the parameters for calculation of indirect production costs could have an impact on the gross margin and the overall valuation of inventories.
INVENTORIES
DKK million 2015 2014
Raw materials 2,020 1,723Work in progress 8,549 7,539Finished goods 3,608 3,260
Total inventories (gross) 14,177 12,522
Inventory write-downs at year-end 1,419 1,165
Total inventories (net) 12,758 11,357
Indirect production costs included in work in progress and fi nished goods 6,436 5,759Share of total inventories (net) 50% 51%
MOVEMENTS IN INVENTORY WRITE-DOWNSInventory write-downs at the beginning of the year 1,165 960Inventory write-downs during the year 698 467Utilisation of inventory write-downs (192) (123)Reversal of inventory write-downs (252) (139)
Inventory write-downs at the end of the year 1,419 1,165
There is no inventory carried at net realisable value at 31 December for either 2014 or 2015, except for the fully impaired inventory disclosed in the table.
3.4 TRADE RECEIVABLES Accounting policies
Trade receivables are recognised initially at fair value and subsequently measured at amortised cost using the effective interest method, less allowance for doubtful trade receivables.
The allowance is deducted from the carrying amount of Trade receivables and the amount of the loss is recognised in the Income statement under Sales and distribution costs. Subsequent recoveries of amounts previously written off are credited against Sales and distribution costs.
Key accounting estimate – Allowance for doubtful trade receivablesThe customer base of Novo Nordisk comprises government agencies, whole-salers, retail pharmacies, managed care and other customers. Management makes allowance for doubtful trade receivables in anticipation of estimated losses resulting from the subsequent inability of customers to make required payments. If the fi nancial circumstances of customers were to deteriorate, resulting in an impairment of their ability to make payments, an additional allowance could be required in future periods. When evaluating the adequacy of the allowance for doubtful trade receivables, Management analyses trade receivables and examines historical bad debt, customer concentrations, customer creditworthiness and payment history, current economic trends and changes in customer payment terms. Please refer to note 4.2 for a general description of credit risk.
As a result of the signifi cant sales to countries within Region International Operations, and the fact that many of these countries have low credit ratings, the relative impact of countries within Region International Operations on the allowance for doubtful trade receivables is increasing. The political climate in Russia and Argentina is impacted by instability and sharp currency depreciation. Novo Nordisk is monitoring developments closely. Payment history as well as current economic conditions and indicators are taken into account in the valuation of trade receivables.
Please refer to note 2.2 for a geographical split of trade receivables and allowance for doubtful trade receivables.
TRADE RECEIVABLES
DKK million 2015 2014
Trade receivables (gross) 16,651 14,036Allowance for doubtful trade receivables 1,166 995
Trade receivables (net) 15,485 13,041
Trade receivables (net) equals a credit period of 52 days (54 days in 2014).
Age analysis of trade receivables Non-impaired trade receivables– Not yet due 14,605 12,664– Overdue by between 1 and 179 days 880 337– Overdue by between 180 and 360 days 0 40
Trade receivables with credit risk exposure 15,485 13,041
MOVEMENTS IN ALLOWANCE FOR DOUBTFUL TRADE RECEIVABLESCarrying amount at the beginning of the year 995 989Confi rmed losses (28) (13)Reversal of allowance for confi rmed losses (26) (11)Allowance for possible losses during the year 257 57Effect of exchange rate adjustment (32) (27)
Allowance at the end of the year 1,166 995
NOVO NORDISK ANNUAL REPORT 2015
76 CONSOLIDATED FINANCIAL STATEMENTS
3.5 RETIREMENT BENEFIT OBLIGATIONSAccounting policies
Novo Nordisk operates a number of defi ned contribution plans throughout the world. Novo Nordisk’s contributions to the defi ned contribution plans are charged to the Income statement in the year to which they relate. In a few countries, Novo Nordisk still operates defi ned benefi t plans. The defi ned benefi t plans for Germany cover all employees employed before November 2003. Obligations relating to employees employed after 2003 are covered by a defi ned contribution plan. In Switzerland the employee pension scheme is set up as a combined defi ned benefi t and defi ned contribution plan, and is mandatory. The plan in Japan covers all employees and is set up as a combined defi ned benefi t and defi ned contribution plan. The plan in the US is structured as a post-retirement healthcare plan covering all employees. From 2012 this plan was changed into a defi ned contribution plan covering all US employees.
The costs for the year for defi ned benefi t plans are determined using the projected unit credit method. This refl ects services rendered by employees to the valuation dates and is based on actuarial assumptions primarily regarding discount rates used in determining the present value of benefi ts and projected rates of remuneration growth. Discount rates are based on the market yields of high-rated corporate bonds in the country concerned.
Actuarial gains and losses arising from experience adjustments and changes in actuarial assumptions are charged or credited to Other comprehensive income in the period in which they arise. Past service costs are recognised immediately in the Income statement.
Pension plan assets are only recognised to the extent that Novo Nordisk is able to derive future economic benefi ts such as refunds from the plan or reductions of future contributions. Novo Nordisk manages the allocation and investment of pension plan assets with the purpose of meeting the long- term objectives. The main objectives are to meet present and future benefi t obligations, provide suffi cient liquidity to meet such payment requirements and provide a total return that maximises the ratio of the plan assets to the plan liabilities by maximising return on the assets at an appropriate level of risk.
The Group’s defi ned benefi t plans are pension plans and medical plans and are usually funded by payments from Group companies and by employees to funds independent of Novo Nordisk. Where a plan is unfunded, a liability for the retirement benefi t obligation is recognised in the Balance sheet. Costs recognised for retirement benefi ts are included in Cost of goods sold, Sales and distribution costs, Research and development costs, and Administrative costs.
The net obligation recognised in the Balance sheet is reported as non-current liabilities.
RETIREMENT BENEFIT OBLIGATIONS
2015 2014DKK million Germany Switzerland Japan US Other Total Total
At the beginning of the year 710 246 318 381 320 1,975 1,544Current service costs 28 31 31 26 32 148 121Past service costs and settlements – (11) – – (35) (46) (2)Interest costs 18 4 3 15 7 47 49Remeasurement (gains)/losses1 10 39 1 (24) 18 44 250Plan participant contributions etc – 11 – – 14 25 15Benefi ts paid to employees (5) (4) (17) (9) 1 (34) (41)Exchange rate adjustment 2 28 34 44 1 109 39
At the end of the year 763 344 370 433 358 2,2682 1,9752
FAIR VALUE OF PLAN ASSETS
At the beginning of the year 441 169 250 – 84 944 856Interest income 12 3 2 – 3 20 24Settlements – – – – (22) (22) –Remeasurement gains/(losses) 1 – 6 – – 7 3Employer contributions 22 24 28 9 13 96 85Plan participant contributions etc – 11 – – 11 22 17Benefi ts paid to employees (5) (4) (17) (9) 1 (34) (41)Exchange rate adjustment 1 20 27 – 1 49 –
At the end of the year 472 223 296 – 91 1,082 944
Net retirement benefi t obligations at the end of the year 291 121 74 433 267 1,186 1,031
1. Remeasurement relates primarily to changes in fi nancial assumptions.2. Present value of partly funded retirement benefi t obligations amounts to DKK 1,711 million (DKK 1,478 million in 2014). Present value of unfunded retirement benefi t obligations
amounts to DKK 557 million (DKK 497 million in 2014).
NOVO NORDISK ANNUAL REPORT 2015
77 CONSOLIDATED FINANCIAL STATEMENTS
3.6 PROVISIONS AND CONTINGENT LIABILITIES
Accounting policiesProvisions for sales rebates and discounts granted to government agencies, wholesalers, retail pharmacies, managed care and other customers are recorded at the time the related revenues are recorded or when the incentives are offered. Provisions are calculated based on historical experience and the specifi c terms in the individual agreements.
Provisions for legal disputes are recognised where a legal or constructive obligation has been incurred as a result of past events and it is probable that there will be an outfl ow of resources that can be reliably estimated. In this case, Novo Nordisk arrives at an estimate based on an evaluation of the most likely outcome. Disputes for which no reliable estimate can be made are disclosed as contingent liabilities.
Novo Nordisk issues credit notes for expired goods as a part of normal business. Where there is historical experience or a reasonably accurate estimate of expected future returns can otherwise be made, a provision for estimated product returns is recorded. The provision is measured at gross sales value.
Provisions are measured at the present value of the anticipated expenditure for settlement of the legal or constructive obligation using a pre-tax discount rate that refl ects current market assessments of the time value of money and the risks specifi c to the obligation. The increase in the provision due to the passage of time is recognised as a fi nancial expense.
Key accounting estimate – Provisions for sales rebatesNovo Nordisk records provisions for expected sales rebates, including Medicaid and Medicare in the US. Expected rebates are recognised as Provisions when timing or amount is uncertain. Where absolute amounts are known, the rebates are recognised as Other liabilities.
Such estimates are based on analyses of existing contractual obligations and historical experience. Provisions are calculated on the basis of a percentage of sales for each product as defi ned by the contracts with the various customer groups.
Provisions for sales rebates are adjusted to actual amounts as rebates, discounts and returns are processed. Please refer to note 2.1 for further information on sales rebates and provisions.
Novo Nordisk considers the provisions established for sales rebates to be reasonable and appropriate based on currently available information. However, the actual amount of rebates and discounts may differ from the amounts estimated by Management as more detailed information becomes available.
Key accounting estimate – Provisions for legal disputesProvisions for legal disputes consist of various types of provision linked to ongoing legal disputes. Management makes judgements about provisions and contingencies, including the probability of pending and potential future litigation outcomes, which, by their very nature, are dependent on inherently uncertain future events. When determining likely outcomes of litigations etc, Management considers the input of external counsels on each case, as well as known outcomes in case law.
Although Management believes that the total provisions for legal pro ceedings are adequate based on currently available information, there can be no assurance that there will not be any changes in facts or matters, or that any future lawsuits, claims, proceedings or investigations will not be material.
3.5 RETIREMENT BENEFIT OBLIGATIONS (CONTINUED)
NET RETIREMENT BENEFIT OBLIGATIONS
DKK million 2015 2014
At the beginning of the year 1,031 688Costs recognised in the Income statement1 154 142Remeasurements recognised in Other comprehensive income 37 247Employer contributions (96) (85)Exchange rate adjustment2 60 39
At the end of the year 1,186 1,031
1. Employee costs comprising service costs, net interest, settlements and plan participant contributions etc. Please refer to note 2.4.
2. As part of exchange rate adjustments in subsidiaries recognised in Other com-prehensive income.
Please refer to note 5.3 for a maturity analysis of the net retirement benefi t obligation.
Novo Nordisk does not expect the contributions over the next fi ve years to differ signifi cantly from current contributions.
WEIGHTED AVERAGE ASSET ALLOCATION OF FUNDED RETIREMENT OBLIGATIONS
2015 2014
DKK DKK million % million %
Coverage insurance1 695 64% 632 67%Bonds 244 23% 204 22%Equities 91 8% 76 8%Cash at bank 36 3% 21 2%Property 16 2% 11 1%
Total 1,082 100% 944 100%
1. Novo Nordisk’s defi ned benefi t plans, mainly in Germany and Switzerland, are reimbursed by the international insurer Allianz regardless of the value of the plan assets. The risk related to the plan assets in these countries is therefore counterparty risk against Allianz.
KEY ASSUMPTIONS USED FOR VALUATION
2015 2014 Weighted Weighted average average
Discount rate 2% 2%Projected future remuneration increases 2% 2%
Actuarial valuations are performed annually for all major defi ned benefi t plans. Assumptions regarding future mortality are based on actuarial advice in accordance with published statistics and experience in each country. Other assumptions such as medical cost trend rate and infl ation are also considered in the calculation.
Signifi cant actuarial assumptions for the determination of the retirement benefi t obligation are discount rate and expected future remuneration increases. The sensitivity analysis below has been determined based on reasonably likely changes in the assumptions occurring at the end of the period.
1 %-point 1 %-pointDKK million increase decrease
Discount rate (323) 414Future remuneration 94 (84)
The sensitivities above consider the single change shown with the other assumptions assumed to be unchanged. In practice, changes in one assumption may be accompanied by offsetting changes in another assump-tion (although this is not always the case).
NOVO NORDISK ANNUAL REPORT 2015
78 CONSOLIDATED FINANCIAL STATEMENTS
On 21 January 2016, the Centers for Medicare & Medicaid Services (CMS) in the US published its fi nal rule implementing Affordable Care Act changes to the Medicaid Drug Rebate Program and Medicaid reimbursement for covered outpatient drugs. The rule creates a regulatory defi nition for Average Manufacturer Price, the key metric for determining manufacturer rebates and pharmacy reimbursement under the Medicaid programme, including Norditropin®. Management has reviewed the implications of the fi nal rule and assessed that the rule does not have a material impact on Novo Nordisk’s fi nancial position, operating profi t or cash fl ow for the period ended 31 December 2015.
Contingent liabilitiesNovo Nordisk is currently involved in pending litigations, claims and investiga-tions arising out of the normal conduct of its business. While provisions that Management deems to be reasonable and appropriate have been made for probable losses, there are uncertainties connected with these estimates. Novo Nordisk does not expect the pending litigations, claims and investiga-tions, individually and in the aggregate, to have a material impact on Novo Nordisk’s fi nancial position, operating profi t or cash fl ow in addition to the amounts accrued as provision for legal disputes.
Pending litigation against Novo NordiskIn the US, a number of claims alleging pancreatic cancer and pancreatitis have been fi led against various incretin-based product manufacturers, including Novo Nordisk. As of 1 February 2016, Novo Nordisk was named by 194 plaintiffs in product liability cases related to Victoza® and other GLP-1/DPP-IV products, predominantly alleging pancreatic cancer. 134 of the Novo Nordisk plaintiffs have also named other defendants in their lawsuits.
3.6 PROVISIONS AND CONTINGENT LIABILITIES (CONTINUED)PROVISIONS Provisions Provisions Provisions for sales for legal for product Other 2015 2014DKK million rebates disputes returns provisions1 Total Total
At the beginning of the year 11,002 936 797 896 13,631 10,493Additional provisions, including increases to existing provisions 45,190 602 319 507 46,618 27,208Amount used during the year (40,958) (126) (313) (324) (41,721) (24,754)Adjustments, including unused amounts reversed during the year – (52) – (4) (56) (462)Effect of exchange rate adjustment 1,274 37 – 41 1,352 1,146
At the end of the year 16,508 1,397 803 1,116 19,824 13,631
Non-current liabilities – 1,397 482 886 2,765 2,041Current liabilities 16,508 – 321 230 17,059 11,590
1. Other provisions consist of various types of provision, including employee benefi ts such as jubilee benefi ts, company-owned life insurance etc. Assets related to company-owned life insurance are presented as part of Other fi nancial assets.
For non-current liabilities, provisions for product returns will be utilised in 2017 and 2018 and other provisions will be utilised in 2017. For provisions for legal disputes, the time of settlement cannot be determined.
PROVISIONS FOR SALES REBATES
2014 2015
0
1500
3000
4500
6000
7500
US Medicaid US Medicare US Managed Care
Other Sales Rebates
DKK million
Judgement of dismissal has been entered in Novo Nordisk’s favour in the vast majority of cases naming the company as a defendant. A notice of appeal has been fi led in both state and federal cases. Currently, Novo Nordisk does not have any individual trials scheduled in 2016. Novo Nordisk does not expect the pending claims to have a material impact on Novo Nordisk’s fi nancial position, operating profi t or cash fl ow.
Pending claims against Novo Nordisk and investigations involving Novo NordiskIn February 2011, the offi ce of the US Attorney for the District of Massa-chusetts served Novo Nordisk with a subpoena calling for the production of documents regarding potential civil and criminal offences relating to the company’s marketing and promotional practices for the following products: NovoLog®, Levemir® and Victoza®. This matter is being conducted by the US Attorney for the District of Columbia. Novo Nordisk continues to cooperate with the US Attorney in this investigation. Novo Nordisk does not expect the investigation to have a material impact on Novo Nordisk’s fi nancial position, operating profi t or cash fl ow.
Following the launch of NovoEight® (‘N8’) in April 2015, Baxter (now Baxalta) fi led a complaint regarding patent infringement with the US International Trade Commission (‘ITC’). The Baxalta patents, which expire in June 2018, all relate to manufacturing therapeutic protein products, such as Factor VIII. A parallel lawsuit is pending in the US District Court for the District of New Jersey but has been stayed pending resolution of the matter in the ITC. Novo Nordisk does not expect these matters to have a material impact on Novo Nordisk’s fi nancial position, operating profi t or cash fl ow.
In addition to the above, the Novo Nordisk Group is engaged in certain litigation proceedings and various ongoing audits and investigations. In the opinion of Management, neither settlement or continuation of such proceedings nor such pending audits and investigations are expected to have a material effect on Novo Nordisk’s fi nancial position, operating profi t or cash fl ow.
3.7 OTHER LIABILITIES
OTHER LIABILITIES
DKK million 2015 2014
Employee costs payable 4,545 4,454Accruals 4,285 3,684Accrued rebates 1,555 912VAT and duties payable 896 744Research and development clinical trials 532 763Amount owed to associated company 259 –Other payables 583 494
Total other liabilities 12,655 11,051
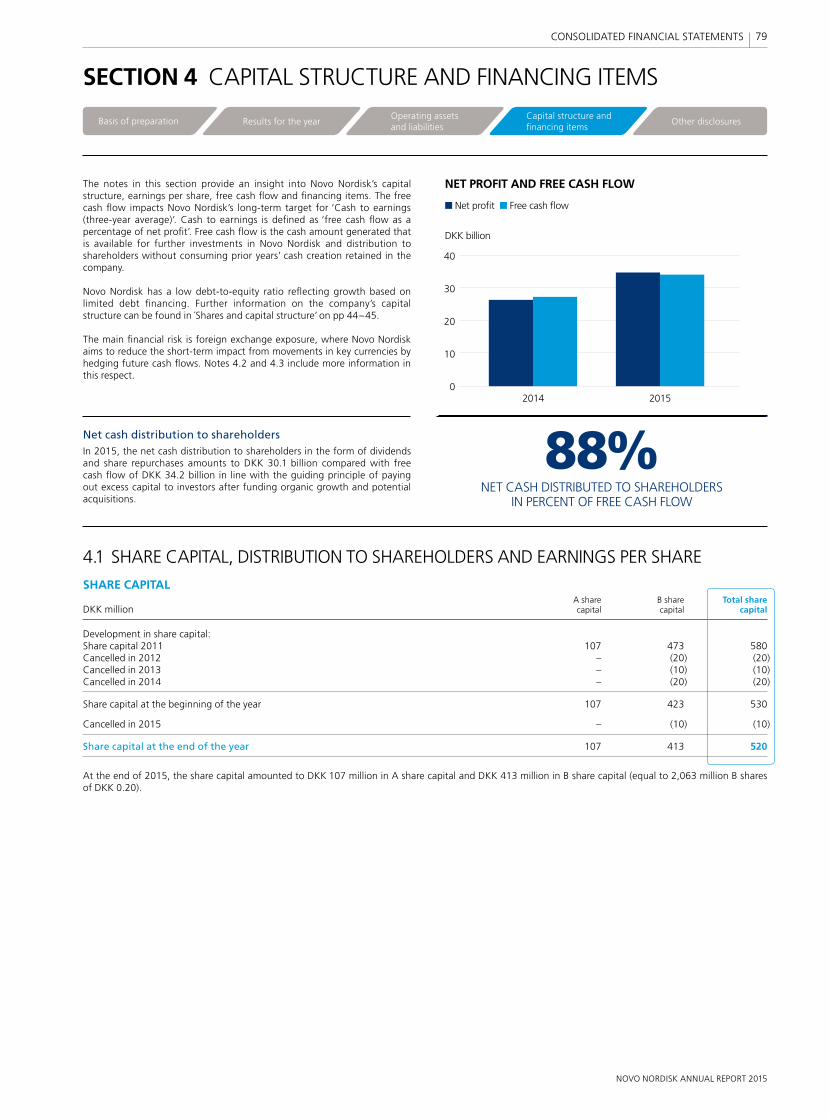
NOVO NORDISK ANNUAL REPORT 2015
79 CONSOLIDATED FINANCIAL STATEMENTS
0
10
20
30
40
2014 2015
NET PROFIT AND FREE CASH FLOW
DKK billion
Net profit Free cash flow
88% NET CASH DISTRIBUTED TO SHAREHOLDERS IN PERCENT OF FREE CASH FLOW
88%NET CASH DISTRIBUTED TO SHAREHOLDERS
IN PERCENT OF FREE CASH FLOW
0
10
20
30
40
2014 2015
NET PROFIT AND FREE CASH FLOW
DKK billion
Net profit Free cash flow
The notes in this section provide an insight into Novo Nordisk’s capital structure, earnings per share, free cash fl ow and fi nancing items. The free cash fl ow impacts Novo Nordisk’s long-term target for ‘Cash to earnings (three-year average)’. Cash to earnings is defi ned as ‘free cash fl ow as a percentage of net profi t’. Free cash fl ow is the cash amount generated that is available for further investments in Novo Nordisk and distribution to shareholders without consuming prior years’ cash creation retained in the company.
Novo Nordisk has a low debt-to-equity ratio refl ecting growth based on limited debt fi nancing. Further information on the company’s capital structure can be found in Shares and capital structure’ on pp 44–45.
The main fi nancial risk is foreign exchange exposure, where Novo Nordisk aims to reduce the short-term impact from movements in key currencies by hedging future cash fl ows. Notes 4.2 and 4.3 include more information in this respect.
Net cash distribution to shareholdersIn 2015, the net cash distribution to shareholders in the form of dividends and share repurchases amounts to DKK 30.1 billion compared with free cash fl ow of DKK 34.2 billion in line with the guiding principle of paying out excess capital to investors after funding organic growth and potential acquisitions.
SECTION 4 CAPITAL STRUCTURE AND FINANCING ITEMS
4.1 SHARE CAPITAL, DISTRIBUTION TO SHAREHOLDERS AND EARNINGS PER SHARE
SHARE CAPITAL A share B share Total shareDKK million capital capital capital
Development in share capital:Share capital 2011 107 473 580Cancelled in 2012 – (20) (20)Cancelled in 2013 – (10) (10)Cancelled in 2014 – (20) (20)
Share capital at the beginning of the year 107 423 530
Cancelled in 2015 – (10) (10)
Share capital at the end of the year 107 413 520
At the end of 2015, the share capital amounted to DKK 107 million in A share capital and DKK 413 million in B share capital (equal to 2,063 million B shares of DKK 0.20).
Basis of preparation Results for the yearOperating assetsand liabilities
Capital structure and financing items
Other disclosures
NOVO NORDISK ANNUAL REPORT 2015
80 CONSOLIDATED FINANCIAL STATEMENTS
4.1 SHARE CAPITAL, DISTRIBUTION TO SHAREHOLDERS AND EARNINGS PER SHARE (CONTINUED)
TREASURY SHARES
Accounting policiesTreasury shares are deducted from the share capital on cancellation at their nominal value of DKK 0.20 per share. Differences between this amount and the amount paid to acquire or received for disposing of treasury shares are deducted directly in equity.
2015 2014 Number of Number of As % of share As % of share B shares B shares Market value capital before capital after of DKK 0.20 of DKK 0.20 DKK million cancellation cancellation (million) (million)
Holding at the beginning of the year 14,787 2.1% 57 103Cancellation of treasury shares (13,015) (1.8%) (50) (100)
Holding of treasury shares, adjusted for cancellation 1,772 0.3% 0.3% 7 3Transfer regarding options and restricted stock units (242) 0.0% (1) (2)Purchase during the year 17,229 1.8% 48 59Sale during the year (33) (0.1%) (2) (3)Value adjustment 2,136 – – –
Holding at the end of the year 20,862 2.0% 52 57
Treasury shares are primarily acquired to reduce the company’s share capital. In addition, a limited part is used to fi nance Novo Nordisk’s long-term share-based incentive programme (restricted stock units) and restricted stock units to employees.
Novo Nordisk’s guiding principle is that any excess capital, after the funding of organic growth opportunities and potential acquisitions, should be returned to investors. Novo Nordisk applies a pharmaceutical industry payout ratio to dividend payments, which are complemented by share repurchase programmes.
The purchase of treasury shares during the year relates to the remaining part of the 2014 share repurchase programme totalling DKK 1.0 billion and the DKK 17.5 billion share repurchase programme of Novo Nordisk B shares for 2015, of which DKK 1.6 billion remains at year-end. The programme ends on 1 February 2016. Transfer of treasury shares relates to exercised share options, long-term share-based incentive programme and restricted stock units to employees.
The holding of treasury shares amounts to 52,168,703 shares of DKK 0.20 at year-end, corresponding to DKK 10 million of the share capital (56,807,153 shares and DKK 11 million of the share capital in 2014). At year-end, 7.2 million shares of the holding of treasury B shares are regarded as hedges for the long-term share-based incentive programme and restricted stock units to employees.
NET CASH DISTRIBUTION TO SHAREHOLDERS
DKK million 2015 2014 2013
Dividends 12,905 11,866 9,715Share repurchases 17,196 14,667 13,924
Total 30,101 26,533 23,639
At the end of 2015, proposed dividends (not yet declared) of DKK 16,230 million (DKK 6.40 per share) are included in Retained earnings. The declared dividend included in Retained earnings was DKK 12,905 million (DKK 5.0 per share) in 2014 and DKK 11,866 million (DKK 4.50 per share) in 2013. No dividend is declared on treasury shares.
EARNINGS PER SHARE
Accounting policiesEarnings per share is presented as both basic and diluted earnings per share. Basic earnings per share is calculated as net profi t divided by the average number of shares outstanding. Diluted earnings per share is calculated as net profi t divided by the sum of average number of shares outstanding, including the dilutive effect of the outstanding share bonus pool and options ‘in the money’. Please refer to ‘Financial defi nitions’ on p 94 for a description of the calculation of the dilutive effect.
DKK million 2015 2014 2013
Net profi t for the year 34,860 26,481 25,184
Average number of shares outstanding in 1,000 shares 2,571,219 2,621,226 2,679,362Dilutive effect of outstanding share bonus pool and options ‘in the money’1 in 1,000 shares 6,479 8,992 14,263
Average number of shares outstanding, including dilutive effect of options ‘in the money’ in 1,000 shares 2,577,698 2,630,218 2,693,625
Basic earnings per share DKK 13.56 10.10 9.40Diluted earnings per share DKK 13.52 10.07 9.35
1. The dilutive effect has been reduced as the exercise period for options related to the 2006 programme has matured. For further information on the outstanding share bonus pool and options, please refer to note 5.1.
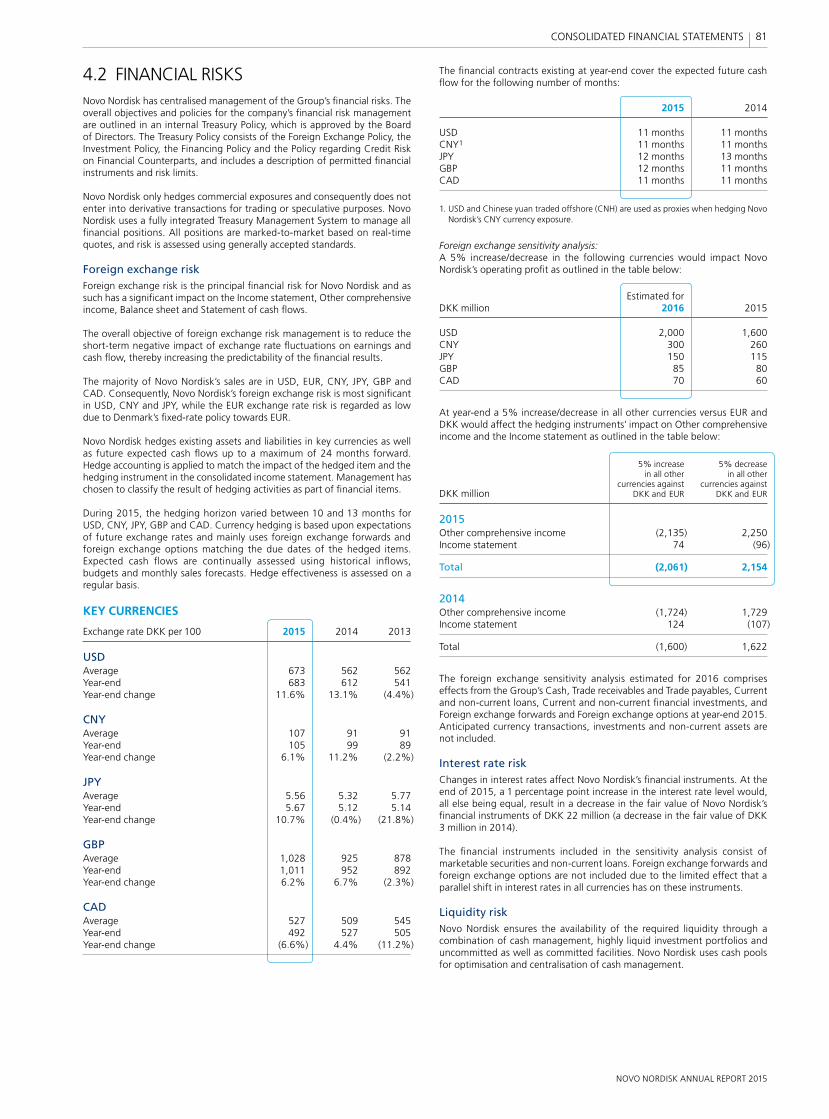
NOVO NORDISK ANNUAL REPORT 2015
81 CONSOLIDATED FINANCIAL STATEMENTS
4.2 FINANCIAL RISKSNovo Nordisk has centralised management of the Group’s fi nancial risks. The overall objectives and policies for the company’s fi nancial risk management are outlined in an internal Treasury Policy, which is approved by the Board of Directors. The Treasury Policy consists of the Foreign Exchange Policy, the Investment Policy, the Financing Policy and the Policy regarding Credit Risk on Financial Counterparts, and includes a description of permitted fi nancial instruments and risk limits.
Novo Nordisk only hedges commercial exposures and consequently does not enter into derivative transactions for trading or speculative purposes. Novo Nordisk uses a fully integrated Treasury Management System to manage all fi nancial positions. All positions are marked-to-market based on real-time quotes, and risk is assessed using generally accepted standards.
Foreign exchange riskForeign exchange risk is the principal fi nancial risk for Novo Nordisk and as such has a signifi cant impact on the Income statement, Other comprehensive income, Balance sheet and Statement of cash fl ows.
The overall objective of foreign exchange risk management is to reduce the short-term negative impact of exchange rate fl uctuations on earnings and cash fl ow, thereby increasing the predictability of the fi nancial results.
The majority of Novo Nordisk’s sales are in USD, EUR, CNY, JPY, GBP and CAD. Consequently, Novo Nordisk’s foreign exchange risk is most signifi cant in USD, CNY and JPY, while the EUR exchange rate risk is regarded as low due to Denmark’s fi xed-rate policy towards EUR.
Novo Nordisk hedges existing assets and liabilities in key currencies as well as future expected cash fl ows up to a maximum of 24 months forward. Hedge accounting is applied to match the impact of the hedged item and the hedging instrument in the consolidated income statement. Management has chosen to classify the result of hedging activities as part of fi nancial items.
During 2015, the hedging horizon varied between 10 and 13 months for USD, CNY, JPY, GBP and CAD. Currency hedging is based upon expectations of future exchange rates and mainly uses foreign exchange forwards and foreign exchange options matching the due dates of the hedged items. Expected cash fl ows are continually assessed using historical infl ows, budgets and monthly sales forecasts. Hedge effectiveness is assessed on a regular basis.
KEY CURRENCIES
Exchange rate DKK per 100 2015 2014 2013
USDAverage 673 562 562Year-end 683 612 541Year-end change 11.6% 13.1% (4.4%)
CNYAverage 107 91 91Year-end 105 99 89Year-end change 6.1% 11.2% (2.2%)
JPYAverage 5.56 5.32 5.77Year-end 5.67 5.12 5.14Year-end change 10.7% (0.4%) (21.8%)
GBPAverage 1,028 925 878Year-end 1,011 952 892Year-end change 6.2% 6.7% (2.3%)
CADAverage 527 509 545Year-end 492 527 505Year-end change (6.6%) 4.4% (11.2%)
The fi nancial contracts existing at year-end cover the expected future cash fl ow for the following number of months:
2015 2014
USD 11 months 11 monthsCNY1 11 months 11 monthsJPY 12 months 13 monthsGBP 12 months 11 monthsCAD 11 months 11 months
1. USD and Chinese yuan traded offshore (CNH) are used as proxies when hedging Novo Nordisk’s CNY currency exposure.
Foreign exchange sensitivity analysis:A 5% increase/decrease in the following currencies would impact Novo Nordisk’s operating profi t as outlined in the table below:
Estimated for DKK million 2016 2015
USD 2,000 1,600CNY 300 260JPY 150 115GBP 85 80CAD 70 60
At year-end a 5% increase/decrease in all other currencies versus EUR and DKK would affect the hedging instruments’ impact on Other comprehensive income and the Income statement as outlined in the table below:
5% increase 5% decrease in all other in all other currencies against currencies againstDKK million DKK and EUR DKK and EUR
2015Other comprehensive income (2,135) 2,250Income statement 74 (96)
Total (2,061) 2,154
2014Other comprehensive income (1,724) 1,729Income statement 124 (107)
Total (1,600) 1,622
The foreign exchange sensitivity analysis estimated for 2016 comprises effects from the Group’s Cash, Trade receivables and Trade payables, Current and non-current loans, Current and non-current fi nancial investments, and Foreign exchange forwards and Foreign exchange options at year-end 2015. Anticipated currency transactions, investments and non-current assets are not included.
Interest rate riskChanges in interest rates affect Novo Nordisk’s fi nancial instruments. At the end of 2015, a 1 percentage point increase in the interest rate level would, all else being equal, result in a decrease in the fair value of Novo Nordisk’s fi nancial instruments of DKK 22 million (a decrease in the fair value of DKK 3 million in 2014).
The fi nancial instruments included in the sensitivity analysis consist of marketable securities and non-current loans. Foreign exchange forwards and foreign exchange options are not included due to the limited effect that a parallel shift in interest rates in all currencies has on these instruments.
Liquidity riskNovo Nordisk ensures the availability of the required liquidity through a com bination of cash management, highly liquid investment portfolios and uncommitted as well as committed facilities. Novo Nordisk uses cash pools for optimisation and centralisation of cash management.
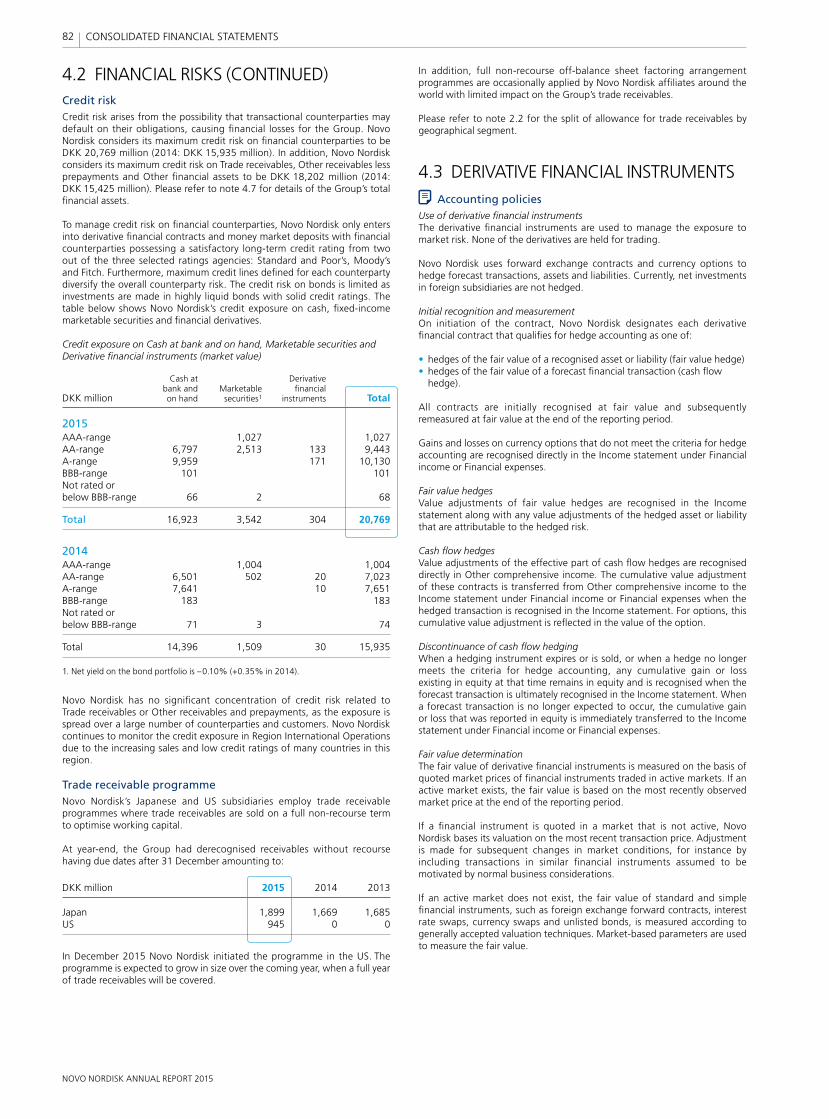
NOVO NORDISK ANNUAL REPORT 2015
82 CONSOLIDATED FINANCIAL STATEMENTS
In addition, full non-recourse off-balance sheet factoring arrangement programmes are occasionally applied by Novo Nordisk affi liates around the world with limited impact on the Group’s trade receivables.
Please refer to note 2.2 for the split of allowance for trade receivables by geographical segment.
4.3 DERIVATIVE FINANCIAL INSTRUMENTSAccounting policies
Use of derivative fi nancial instrumentsThe derivative fi nancial instruments are used to manage the exposure to market risk. None of the derivatives are held for trading.
Novo Nordisk uses forward exchange contracts and currency options to hedge forecast transactions, assets and liabilities. Currently, net investments in foreign subsidiaries are not hedged.
Initial recognition and measurementOn initiation of the contract, Novo Nordisk designates each derivative fi nancial contract that qualifi es for hedge accounting as one of: • hedges of the fair value of a recognised asset or liability (fair value hedge)• hedges of the fair value of a forecast fi nancial transaction (cash fl ow
hedge).
All contracts are initially recognised at fair value and subsequently remeasured at fair value at the end of the reporting period.
Gains and losses on currency options that do not meet the criteria for hedge accounting are recognised directly in the Income statement under Financial income or Financial expenses.
Fair value hedgesValue adjustments of fair value hedges are recognised in the Income statement along with any value adjustments of the hedged asset or liability that are attributable to the hedged risk.
Cash fl ow hedgesValue adjustments of the effective part of cash fl ow hedges are recognised directly in Other comprehensive income. The cumulative value adjustment of these contracts is transferred from Other comprehensive income to the Income statement under Financial income or Financial expenses when the hedged transaction is recognised in the Income statement. For options, this cumulative value adjustment is refl ected in the value of the option.
Discontinuance of cash fl ow hedgingWhen a hedging instrument expires or is sold, or when a hedge no longer meets the criteria for hedge accounting, any cumulative gain or loss existing in equity at that time remains in equity and is recognised when the forecast transaction is ultimately recognised in the Income statement. When a forecast transaction is no longer expected to occur, the cumulative gain or loss that was reported in equity is immediately transferred to the Income statement under Financial income or Financial expenses.
Fair value determinationThe fair value of derivative fi nancial instruments is measured on the basis of quoted market prices of fi nancial instruments traded in active markets. If an active market exists, the fair value is based on the most recently observed market price at the end of the reporting period.
If a fi nancial instrument is quoted in a market that is not active, Novo Nordisk bases its valuation on the most recent transaction price. Adjustment is made for subsequent changes in market conditions, for instance by including transactions in similar fi nancial instruments assumed to be motivated by normal business considerations.
If an active market does not exist, the fair value of standard and simple fi nancial instruments, such as foreign exchange forward contracts, interest rate swaps, currency swaps and unlisted bonds, is measured according to generally accepted valuation techniques. Market-based parameters are used to measure the fair value.
4.2 FINANCIAL RISKS (CONTINUED)Credit riskCredit risk arises from the possibility that transactional counterparties may default on their obligations, causing fi nancial losses for the Group. Novo Nordisk considers its maximum credit risk on fi nancial counterparties to be DKK 20,769 million (2014: DKK 15,935 million). In addition, Novo Nordisk considers its maximum credit risk on Trade receivables, Other receivables less prepayments and Other fi nancial assets to be DKK 18,202 million (2014: DKK 15,425 million). Please refer to note 4.7 for details of the Group’s total fi nancial assets.
To manage credit risk on fi nancial counterparties, Novo Nordisk only enters into derivative fi nancial contracts and money market deposits with fi nancial counterparties possessing a satisfactory long-term credit rating from two out of the three selected ratings agencies: Standard and Poor’s, Moody’s and Fitch. Furthermore, maximum credit lines defi ned for each counterparty diversify the overall counterparty risk. The credit risk on bonds is limited as investments are made in highly liquid bonds with solid credit ratings. The table below shows Novo Nordisk’s credit exposure on cash, fi xed-income marketable securities and fi nancial derivatives.
Credit exposure on Cash at bank and on hand, Marketable securities and Derivative fi nancial instruments (market value)
Cash at Derivative bank and Marketable fi nancial DKK million on hand securities1 instruments Total
2015AAA-range 1,027 1,027AA-range 6,797 2,513 133 9,443A-range 9,959 171 10,130BBB-range 101 101Not rated or below BBB-range 66 2 68
Total 16,923 3,542 304 20,769
2014AAA-range 1,004 1,004AA-range 6,501 502 20 7,023A-range 7,641 10 7,651BBB-range 183 183Not rated or below BBB-range 71 3 74
Total 14,396 1,509 30 15,935
1. Net yield on the bond portfolio is –0.10% (+0.35% in 2014).
Novo Nordisk has no signifi cant concentration of credit risk related to Trade receivables or Other receivables and prepayments, as the exposure is spread over a large number of counterparties and customers. Novo Nordisk continues to monitor the credit exposure in Region International Operations due to the increasing sales and low credit ratings of many countries in this region.
Trade receivable programmeNovo Nordisk’s Japanese and US subsidiaries employ trade receivable programmes where trade receivables are sold on a full non-recourse term to optimise working capital.
At year-end, the Group had derecognised receivables without recourse having due dates after 31 December amounting to:
DKK million 2015 2014 2013
Japan 1,899 1,669 1,685US 945 0 0
In December 2015 Novo Nordisk initiated the programme in the US. The programme is expected to grow in size over the coming year, when a full year of trade receivables will be covered.
NOVO NORDISK ANNUAL REPORT 2015
83 CONSOLIDATED FINANCIAL STATEMENTS
4.3 DERIVATIVE FINANCIAL INSTRUMENTS (CONTINUED)
HEDGING ACTIVITIES 2015 2014
Contract Positive Negative Contract Positive Negative amount fair value fair value amount fair value fair valueDKK million at year-end at year-end at year-end at year-end at year-end at year-end
Forward contracts, cash fl ow hedges 41,630 202 911 32,095 10 2,252Currency options, cash fl ow hedges1 5,533 66 – 2,429 29 –Forward contracts, fair value hedges 2,753 59 471 3,490 – 355
Total hedging activities 49,916 327 1,382 38,014 39 2,607
Total fair value adjustments recognised in the Income statement 102 471 8 355Total fair value adjustments recognised in Other comprehensive income2 225 911 31 2,252
Presented in the Balance sheet as:Derivative fi nancial instruments (current assets) 304 30 Derivative fi nancial instruments (current liabilities) 1,382 2,607Cash at bank 23 9
1. Includes expired currency options of DKK 23 million deferred for realisation in 2016.2. Realisation in 2015 of previously deferred loss amounts to DKK 2,216 million as the remaining DKK 5 million was not realised until 2016. Furthermore, an additional loss of DKK
681 million per 31 December 2015 is deferred for realisation in 2016.
HEDGING OF FORECAST TRANSACTIONS (CASH FLOW HEDGE)
2015 2014
Contract Positive Negative Contract Positive Negative amount fair value fair value amount fair value fair valueDKK million at year-end at year-end at year-end at year-end at year-end at year-end
Hedging of forecast transactions qualifying for hedge accounting
USD 34,279 85 819 26,540 – 2,252CNH, JPY, GBP and other currencies 7,351 117 92 5,555 10 –
Total forward contracts (forecast cash fl ow) 41,630 202 911 32,095 10 2,252
USD 5,285 20 – 2,051 – –JPY 248 3 – 378 21 –
Total currency options (forecast cash fl ow) 5,533 23 – 2,429 21 –
Total cash fl ow hedges for which hedge accounting is applied 47,163 225 911 34,524 31 2,252
Other forecast transaction hedges for which hedge accounting is not applied
Currency options for which hedge accounting is not applied – 43 – – 8 –
Total contracts for forecast transactions 47,163 268 911 34,524 39 2,252
The above fi nancial contracts are expected to impact the Income statement within the periods shown below. The split is based on an estimate of when the cash fl ow hedges are expected to be reclassifi ed to fair value hedges, and the fair value thereby transferred to Financial income or Financial expenses.
2015 2014
Positive Negative Positive Negative fair value fair value fair value fair valueDKK million at year-end at year-end at year-end at year-end
Expected timing of Income statement impact
0–12 months 225 907 28 2,251More than 12 months – 4 3 1
Total cash fl ow hedges for which hedge accounting is applied 225 911 31 2,252
NOVO NORDISK ANNUAL REPORT 2015
84 CONSOLIDATED FINANCIAL STATEMENTS
4.4 CASH AND CASH EQUIVALENTS, FINANCIAL RESOURCES AND FREE CASH FLOW
Accounting policiesThe Statement of cash fl ows shows how income and changes in balance sheet items affect cash and cash equivalents, ie the cash generated or used in the period.
Cash from operating activities converts income statement items from the accrual basis of accounting to cash basis. As such, starting with net profi t, non-cash items are reversed and actual payments included. Further, change in working capital is taken into account as this shows the development in money tied up in the balance sheet. Cash from investing activities shows payments related to the purchase and sale of Novo Nordisk’s long-term investments. This includes fi xed assets such as construction of new production sites, intangible assets such as patents and licences, and fi nancial assets. Cash from fi nancing activities reports purchase and sale of Novo Nordisk’s own shares and payment of dividends.
Cash and cash equivalents consist of cash offset by short-term bank loans. Financial resources consist of cash and cash equivalents, marketable securities with original maturity of less than three months and undrawn committed credit facilities expiring after more than one year. The Statement of cash fl ows is presented in accordance with the indirect method commencing with Net profi t for the year. Cash fl ows in foreign currencies are translated to DKK at the average exchange rate for the respective month.
DKK million 2015 2014 2013
CASH AND CASH EQUIVALENTS
Cash at bank and on hand (note 4.2) 16,923 14,396 10,728Current debt (bank overdrafts) (1,073) (720) (215)
Cash and cash equivalents at the end of the year 15,850 13,676 10,513
FINANCIAL RESOURCES
Cash and cash equivalents 15,850 13,676 10,513Marketable securities (note 4.2) 3,542 1,509 3,741Undrawn committed credit facility1 8,209 8,188 4,849
Total fi nancial resources 27,601 23,373 19,103
1. The undrawn committed credit facility in 2015 is a EUR 1,100 million facility (EUR 1,100 million in 2014 and EUR 650 million in 2013) committed by a portfolio of international banks. The facility matures in 2019.
4.3 DERIVATIVE FINANCIAL INSTRUMENTS (CONTINUED)HEDGING OF ASSETS AND LIABILITIES (FAIR VALUE HEDGE)
2015 2014
Contract Positive Negative Contract Positive Negative amount fair value fair value amount fair value fair valueDKK million at year-end at year-end at year-end at year-end at year-end at year-end
USD 1,891 42 400 2,367 – 333JPY, GBP and other currencies 862 17 71 1,123 – 22
Total fair value contracts 2,753 59 471 3,490 – 355
The table above shows the fair value of fair value-hedging activities for 2015 and 2014. Value adjustments of fair value hedges are recognised in Financial income and Financial expenses along with any value adjustments to the hedged asset or liability that are attributable to the hedged risk. The changes in fair values recognised in the Income statement amount to a net loss of DKK 412 million in 2015 (a net loss of DKK 355 million in 2014).
The portfolio of fair value hedges also includes the recycled fair value of cash fl ow hedges as the hedged transactions are recognised as assets or liabilities at year-end.
The fi nancial contracts existing at year-end hedge the currency exposure on assets and liabilities in the Group’s major currencies excluding DKK and EUR. The contract amounts of other currencies at year-end are JPY at DKK 91 million (DKK 310 million in 2014), GBP at DKK 329 million (DKK 313 million in 2014), and ‘other’ comprising CAD at DKK 190 million (DKK 444 million in 2014) and AUD at DKK 252 million (DKK 56 million in 2014).
FREE CASH FLOW
DKK million 2015 2014 2013
Net cash generated from operating activities 38,287 31,692 25,942Net cash used in investing activities (6,098) (2,064) (2,773)Net purchase of marketable securities 2,033 (2,232) (811)
Free cash fl ow2 34,222 27,396 22,358
2. Additional non-IFRS measure; please refer to p 94 for defi nitions.
4.5 CHANGE IN WORKING CAPITALAccounting policies
Working capital is defi ned as current assets less current liabilities and measures the liquid assets Novo Nordisk has available for the business.
CHANGE IN WORKING CAPITAL
DKK million 2015 2014 2013
Inventories (1,401) (1,805) (9)Trade receivables (2,444) (2,134) (1,268)Other receivables and prepayments 493 (296) 251Trade payables (23) 858 233Other liabilities 1,604 1,665 404Adjustment for the partial divestment of NNIT A/S (207) – –
Change in working capital before exchange rate adjustments (1,978) (1,712) (389)
Exchange rate adjustments (179) (436) 124
Cash fl ow change in working capital (2,157) (2,148) (265)
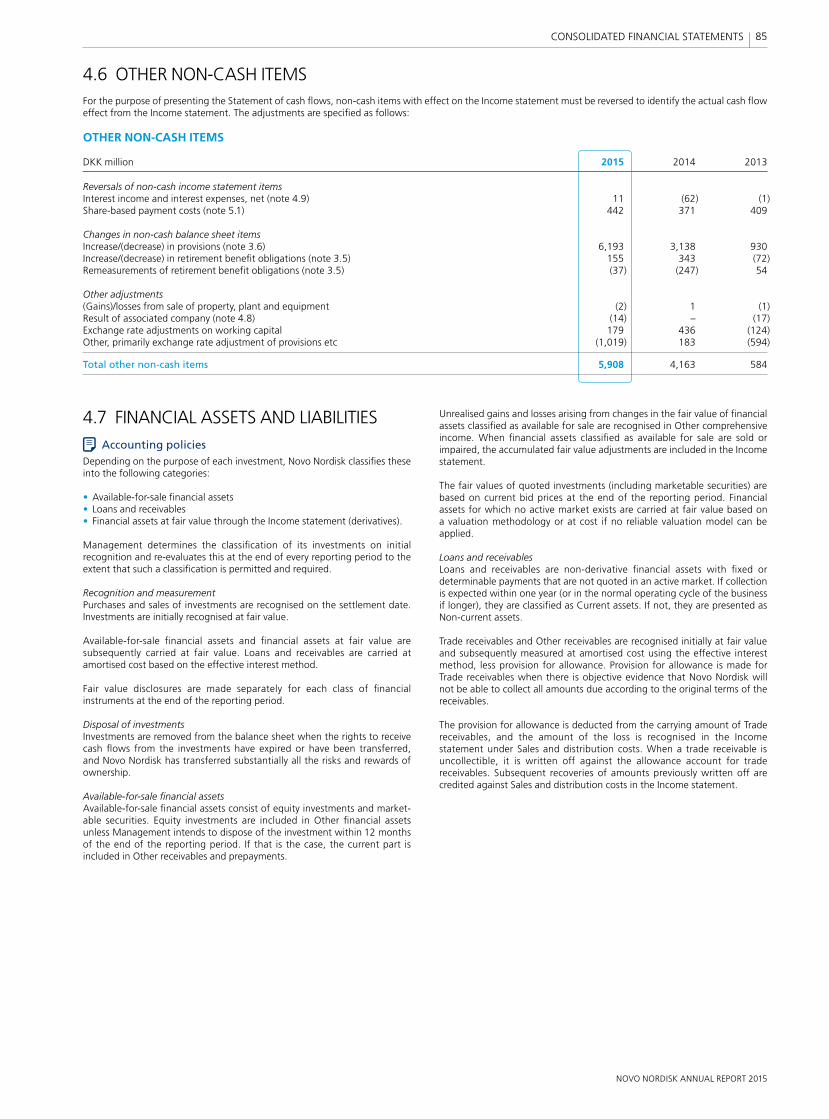
NOVO NORDISK ANNUAL REPORT 2015
85 CONSOLIDATED FINANCIAL STATEMENTS
Unrealised gains and losses arising from changes in the fair value of fi nancial assets classifi ed as available for sale are recognised in Other comprehensive income. When fi nancial assets classifi ed as available for sale are sold or impaired, the accumulated fair value adjustments are included in the Income statement.
The fair values of quoted investments (including marketable securities) are based on current bid prices at the end of the reporting period. Financial assets for which no active market exists are carried at fair value based on a valuation methodology or at cost if no reliable valuation model can be applied.
Loans and receivablesLoans and receivables are non-derivative fi nancial assets with fi xed or deter minable payments that are not quoted in an active market. If collection is expected within one year (or in the normal operating cycle of the business if longer), they are classifi ed as Current assets. If not, they are presented as Non-current assets.
Trade receivables and Other receivables are recognised initially at fair value and subsequently measured at amortised cost using the effective interest method, less provision for allowance. Provision for allowance is made for Trade receivables when there is objective evidence that Novo Nordisk will not be able to collect all amounts due according to the original terms of the receivables. The provision for allowance is deducted from the carrying amount of Trade receivables, and the amount of the loss is recognised in the Income statement under Sales and distribution costs. When a trade receivable is uncollectible, it is written off against the allowance account for trade receivables. Sub sequent recoveries of amounts previously written off are credited against Sales and distribution costs in the Income statement.
4.7 FINANCIAL ASSETS AND LIABILITIESAccounting policies
Depending on the purpose of each investment, Novo Nordisk classifi es these into the following categories:
• Available-for-sale fi nancial assets • Loans and receivables• Financial assets at fair value through the Income statement (derivatives).
Management determines the classifi cation of its investments on initial recognition and re-evaluates this at the end of every reporting period to the extent that such a classifi cation is permitted and required.
Recognition and measurementPurchases and sales of investments are recognised on the settlement date. Investments are initially recognised at fair value.
Available-for-sale fi nancial assets and fi nancial assets at fair value are subsequently carried at fair value. Loans and receivables are carried at amortised cost based on the effective interest method.
Fair value disclosures are made separately for each class of fi nancial instruments at the end of the reporting period.
Disposal of investmentsInvestments are removed from the balance sheet when the rights to receive cash fl ows from the investments have expired or have been transferred, and Novo Nordisk has transferred substantially all the risks and rewards of ownership.
Available-for-sale fi nancial assetsAvailable-for-sale fi nancial assets consist of equity investments and market-able securities. Equity investments are included in Other fi nancial assets unless Management intends to dispose of the investment within 12 months of the end of the reporting period. If that is the case, the current part is included in Other receivables and prepayments.
4.6 OTHER NON-CASH ITEMSFor the purpose of presenting the Statement of cash fl ows, non-cash items with effect on the Income statement must be reversed to identify the actual cash fl ow effect from the Income statement. The adjustments are specifi ed as follows:
OTHER NON-CASH ITEMS
DKK million 2015 2014 2013
Reversals of non-cash income statement itemsInterest income and interest expenses, net (note 4.9) 11 (62) (1)Share-based payment costs (note 5.1) 442 371 409
Changes in non-cash balance sheet itemsIncrease/(decrease) in provisions (note 3.6) 6,193 3,138 930Increase/(decrease) in retirement benefi t obligations (note 3.5) 155 343 (72)Remeasurements of retirement benefi t obligations (note 3.5) (37) (247) 54
Other adjustments(Gains)/losses from sale of property, plant and equipment (2) 1 (1)Result of associated company (note 4.8) (14) – (17)Exchange rate adjustments on working capital 179 436 (124)Other, primarily exchange rate adjustment of provisions etc (1,019) 183 (594)
Total other non-cash items 5,908 4,163 584
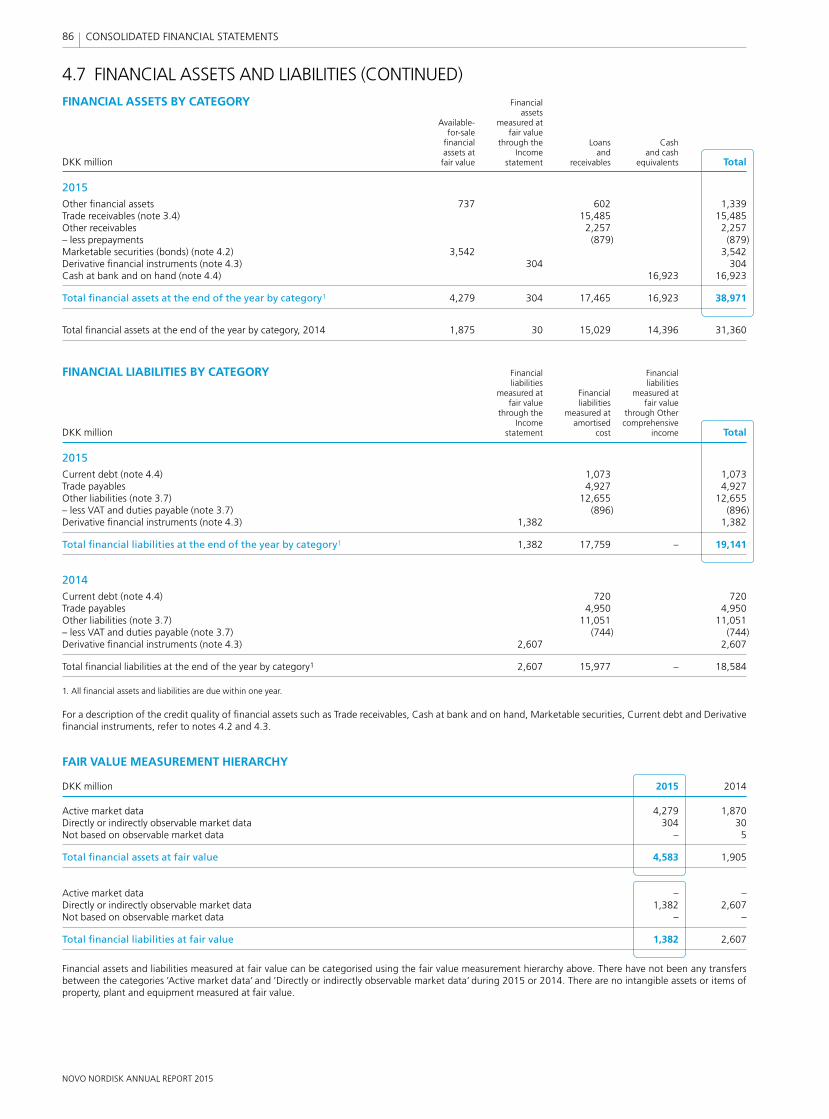
NOVO NORDISK ANNUAL REPORT 2015
86 CONSOLIDATED FINANCIAL STATEMENTS
4.7 FINANCIAL ASSETS AND LIABILITIES (CONTINUED)FINANCIAL ASSETS BY CATEGORY Financial assets Available- measured at for-sale fair value fi nancial through the Loans Cash assets at Income and and cash DKK million fair value statement receivables equivalents Total
2015Other fi nancial assets 737 602 1,339Trade receivables (note 3.4) 15,485 15,485Other receivables 2,257 2,257– less prepayments (879) (879)Marketable securities (bonds) (note 4.2) 3,542 3,542Derivative fi nancial instruments (note 4.3) 304 304Cash at bank and on hand (note 4.4) 16,923 16,923
Total fi nancial assets at the end of the year by category1 4,279 304 17,465 16,923 38,971
Total fi nancial assets at the end of the year by category, 2014 1,875 30 15,029 14,396 31,360
FINANCIAL LIABILITIES BY CATEGORY Financial Financial liabilities liabilities measured at Financial measured at fair value liabilities fair value through the measured at through Other Income amortised comprehensive DKK million statement cost income Total
2015Current debt (note 4.4) 1,073 1,073Trade payables 4,927 4,927Other liabilities (note 3.7) 12,655 12,655– less VAT and duties payable (note 3.7) (896) (896)Derivative fi nancial instruments (note 4.3) 1,382 1,382
Total fi nancial liabilities at the end of the year by category1 1,382 17,759 – 19,141
2014Current debt (note 4.4) 720 720Trade payables 4,950 4,950Other liabilities (note 3.7) 11,051 11,051– less VAT and duties payable (note 3.7) (744) (744)Derivative fi nancial instruments (note 4.3) 2,607 2,607
Total fi nancial liabilities at the end of the year by category1 2,607 15,977 – 18,584
1. All fi nancial assets and liabilities are due within one year.
For a description of the credit quality of fi nancial assets such as Trade receivables, Cash at bank and on hand, Marketable securities, Current debt and Derivative fi nancial instruments, refer to notes 4.2 and 4.3.
FAIR VALUE MEASUREMENT HIERARCHY
DKK million 2015 2014
Active market data 4,279 1,870Directly or indirectly observable market data 304 30Not based on observable market data – 5
Total fi nancial assets at fair value 4,583 1,905
Active market data – –Directly or indirectly observable market data 1,382 2,607Not based on observable market data – –
Total fi nancial liabilities at fair value 1,382 2,607
Financial assets and liabilities measured at fair value can be categorised using the fair value measurement hierarchy above. There have not been any transfers between the categories ’Active market data’ and ’Directly or indirectly observable market data’ during 2015 or 2014. There are no intangible assets or items of property, plant and equipment measured at fair value.
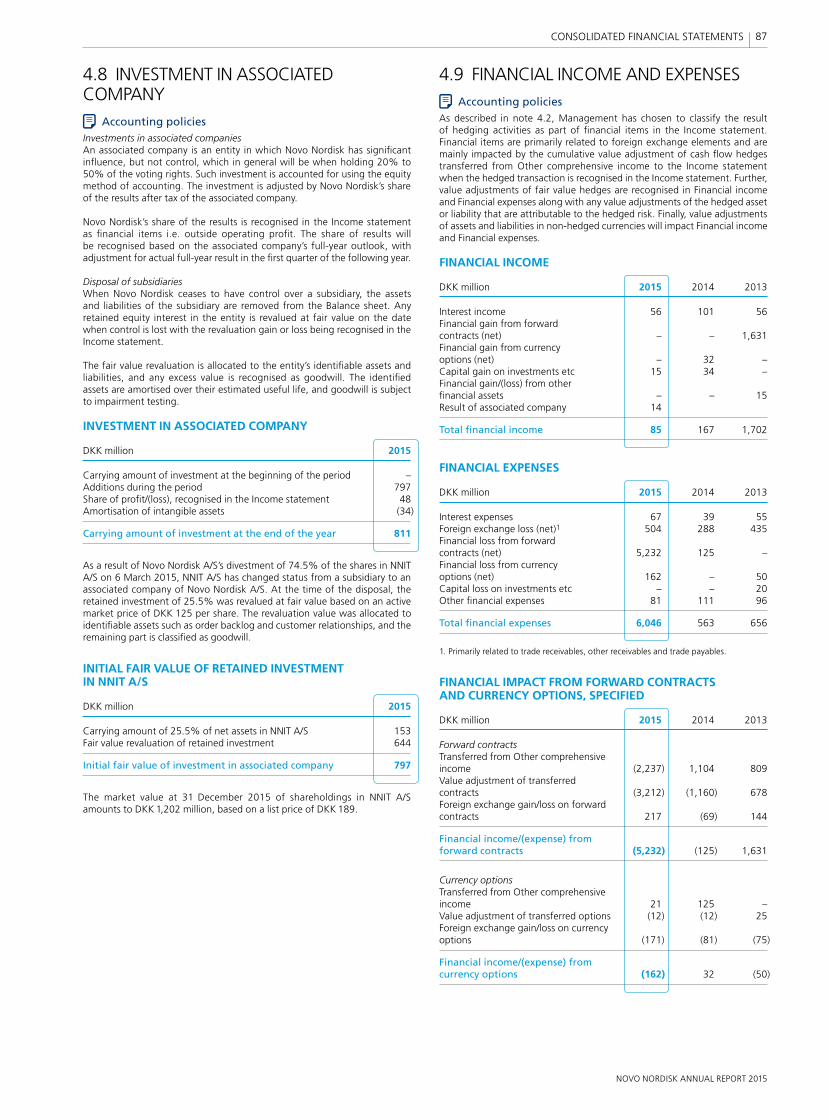
NOVO NORDISK ANNUAL REPORT 2015
87 CONSOLIDATED FINANCIAL STATEMENTS
4.8 INVESTMENT IN ASSOCIATED COMPANY
Accounting policiesInvestments in associated companiesAn associated company is an entity in which Novo Nordisk has signifi cant infl uence, but not control, which in general will be when holding 20% to 50% of the voting rights. Such investment is accounted for using the equity method of accounting. The investment is adjusted by Novo Nordisk’s share of the results after tax of the associated company.
Novo Nordisk’s share of the results is recognised in the Income statement as fi nancial items i.e. outside operating profi t. The share of results will be recognised based on the associated company’s full-year outlook, with adjustment for actual full-year result in the fi rst quarter of the following year.
Disposal of subsidiariesWhen Novo Nordisk ceases to have control over a subsidiary, the assets and liabilities of the subsidiary are removed from the Balance sheet. Any retained equity interest in the entity is revalued at fair value on the date when control is lost with the revaluation gain or loss being recognised in the Income statement.
The fair value revaluation is allocated to the entity’s identifi able assets and liabilities, and any excess value is recognised as goodwill. The identifi ed assets are amortised over their estimated useful life, and goodwill is subject to impairment testing.
INVESTMENT IN ASSOCIATED COMPANY
DKK million 2015
Carrying amount of investment at the beginning of the period –Additions during the period 797Share of profi t/(loss), recognised in the Income statement 48Amortisation of intangible assets (34)
Carrying amount of investment at the end of the year 811
As a result of Novo Nordisk A/S’s divestment of 74.5% of the shares in NNIT A/S on 6 March 2015, NNIT A/S has changed status from a subsidiary to an associated company of Novo Nordisk A/S. At the time of the disposal, the retained investment of 25.5% was revalued at fair value based on an active market price of DKK 125 per share. The revaluation value was allocated to identifi able assets such as order backlog and customer relationships, and the remaining part is classifi ed as goodwill.
INITIAL FAIR VALUE OF RETAINED INVESTMENT IN NNIT A/S
DKK million 2015
Carrying amount of 25.5% of net assets in NNIT A/S 153Fair value revaluation of retained investment 644
Initial fair value of investment in associated company 797
The market value at 31 December 2015 of shareholdings in NNIT A/S amounts to DKK 1,202 million, based on a list price of DKK 189.
4.9 FINANCIAL INCOME AND EXPENSESAccounting policies
As described in note 4.2, Management has chosen to classify the result of hedging activities as part of fi nancial items in the Income statement. Financial items are primarily related to foreign exchange elements and are mainly impacted by the cumulative value adjustment of cash fl ow hedges transferred from Other comprehensive income to the Income statement when the hedged transaction is recognised in the Income statement. Further, value adjustments of fair value hedges are recognised in Financial income and Financial expenses along with any value adjustments of the hedged asset or liability that are attributable to the hedged risk. Finally, value adjustments of assets and liabilities in non-hedged currencies will impact Financial income and Financial expenses.
FINANCIAL INCOME
DKK million 2015 2014 2013
Interest income 56 101 56Financial gain from forward contracts (net) – – 1,631Financial gain from currency options (net) – 32 –Capital gain on investments etc 15 34 –Financial gain/(loss) from other fi nancial assets – – 15Result of associated company 14
Total fi nancial income 85 167 1,702
FINANCIAL EXPENSES
DKK million 2015 2014 2013
Interest expenses 67 39 55Foreign exchange loss (net)1 504 288 435Financial loss from forward contracts (net) 5,232 125 –Financial loss from currency options (net) 162 – 50Capital loss on investments etc – – 20Other fi nancial expenses 81 111 96
Total fi nancial expenses 6,046 563 656
1. Primarily related to trade receivables, other receivables and trade payables.
FINANCIAL IMPACT FROM FORWARD CONTRACTS AND CURRENCY OPTIONS, SPECIFIED
DKK million 2015 2014 2013
Forward contractsTransferred from Other comprehensive income (2,237) 1,104 809Value adjustment of transferred contracts (3,212) (1,160) 678Foreign exchange gain/loss on forward contracts 217 (69) 144
Financial income/(expense) from forward contracts (5,232) (125) 1,631
Currency optionsTransferred from Other comprehensive income 21 125 –Value adjustment of transferred options (12) (12) 25Foreign exchange gain/loss on currency options (171) (81) (75)
Financial income/(expense) from currency options (162) 32 (50)
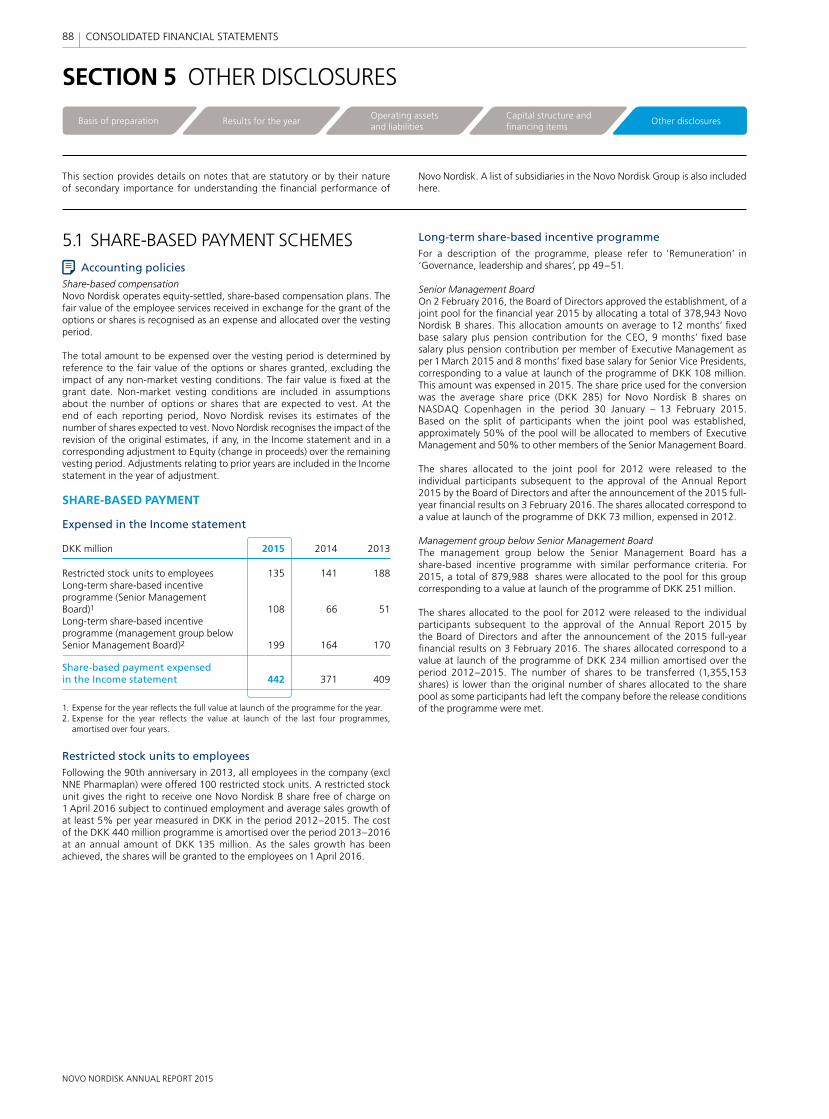
NOVO NORDISK ANNUAL REPORT 2015
88 CONSOLIDATED FINANCIAL STATEMENTS
SECTION 5 OTHER DISCLOSURES
This section provides details on notes that are statutory or by their nature of secondary importance for understanding the fi nancial performance of
Novo Nordisk. A list of subsidiaries in the Novo Nordisk Group is also included here.
Long-term share-based incentive programmeFor a description of the programme, please refer to ‘Remuneration’ in ‘Governance, leadership and shares’, pp 49–51.
Senior Management BoardOn 2 February 2016, the Board of Directors approved the establishment, of a joint pool for the fi nancial year 2015 by allocating a total of 378,943 Novo Nordisk B shares. This allocation amounts on average to 12 months’ fi xed base salary plus pension contribution for the CEO, 9 months’ fi xed base salary plus pension contribution per member of Executive Management as per 1 March 2015 and 8 months’ fi xed base salary for Senior Vice Presidents, corresponding to a value at launch of the programme of DKK 108 million. This amount was expensed in 2015. The share price used for the conversion was the average share price (DKK 285) for Novo Nordisk B shares on NASDAQ Copenhagen in the period 30 January – 13 February 2015. Based on the split of participants when the joint pool was established, approximately 50% of the pool will be allocated to members of Executive Management and 50% to other members of the Senior Management Board.
The shares allocated to the joint pool for 2012 were released to the individual participants subsequent to the approval of the Annual Report 2015 by the Board of Directors and after the announcement of the 2015 full-year fi nancial results on 3 February 2016. The shares allocated correspond to a value at launch of the programme of DKK 73 million, expensed in 2012.
Management group below Senior Management BoardThe management group below the Senior Management Board has a share-based incentive programme with similar performance criteria. For 2015, a total of 879,988 shares were allocated to the pool for this group corresponding to a value at launch of the programme of DKK 251 million.
The shares allocated to the pool for 2012 were released to the individual participants subsequent to the approval of the Annual Report 2015 by the Board of Directors and after the announcement of the 2015 full-year fi nancial results on 3 February 2016. The shares allocated correspond to a value at launch of the programme of DKK 234 million amortised over the period 2012–2015. The number of shares to be transferred (1,355,153 shares) is lower than the original number of shares allocated to the share pool as some participants had left the company before the release conditions of the programme were met.
Basis of preparation Results for the yearOperating assetsand liabilities
Capital structure and financing items
Other disclosures
5.1 SHARE-BASED PAYMENT SCHEMESAccounting policies
Share-based compensationNovo Nordisk operates equity-settled, share-based compensation plans. The fair value of the employee services received in exchange for the grant of the options or shares is recognised as an expense and allocated over the vesting period.
The total amount to be expensed over the vesting period is determined by reference to the fair value of the options or shares granted, excluding the impact of any non-market vesting conditions. The fair value is fi xed at the grant date. Non-market vesting conditions are included in assumptions about the number of options or shares that are expected to vest. At the end of each reporting period, Novo Nordisk revises its estimates of the number of shares expected to vest. Novo Nordisk recognises the impact of the revision of the original estimates, if any, in the Income statement and in a corresponding adjustment to Equity (change in proceeds) over the remaining vesting period. Adjustments relating to prior years are included in the Income statement in the year of adjustment.
SHARE-BASED PAYMENT
Expensed in the Income statement
DKK million 2015 2014 2013
Restricted stock units to employees 135 141 188Long-term share-based incentive programme (Senior Management Board)1 108 66 51Long-term share-based incentive programme (management group below Senior Management Board)2 199 164 170
Share-based payment expensed in the Income statement 442 371 409
1. Expense for the year refl ects the full value at launch of the programme for the year.2. Expense for the year refl ects the value at launch of the last four programmes,
amortised over four years.
Restricted stock units to employeesFollowing the 90th anniversary in 2013, all employees in the company (excl NNE Pharmaplan) were offered 100 restricted stock units. A restricted stock unit gives the right to receive one Novo Nordisk B share free of charge on 1 April 2016 subject to continued employment and average sales growth of at least 5% per year measured in DKK in the period 2012–2015. The cost of the DKK 440 million programme is amortised over the period 2013–2016 at an annual amount of DKK 135 million. As the sales growth has been achieved, the shares will be granted to the employees on 1 April 2016.
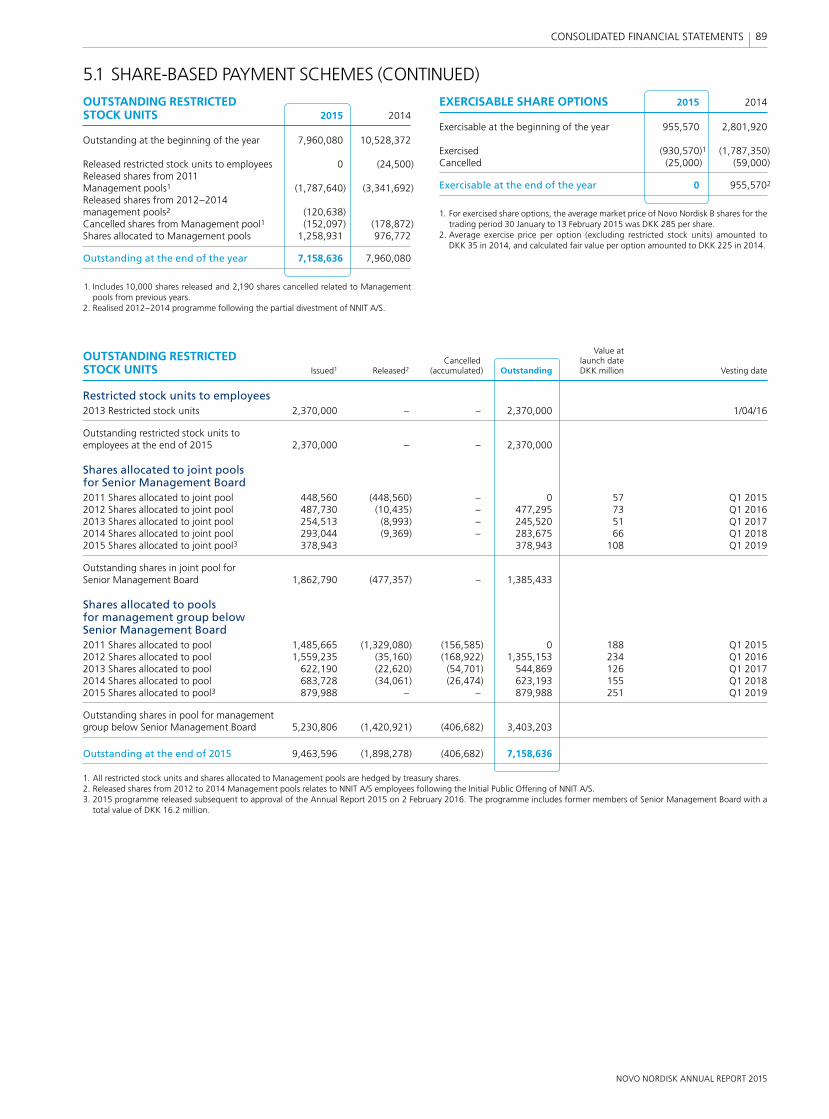
NOVO NORDISK ANNUAL REPORT 2015
89 CONSOLIDATED FINANCIAL STATEMENTS
EXERCISABLE SHARE OPTIONS 2015 2014
Exercisable at the beginning of the year 955,570 2,801,920
Exercised (930,570)1 (1,787,350)Cancelled (25,000) (59,000)
Exercisable at the end of the year 0 955,5702
1. For exercised share options, the average market price of Novo Nordisk B shares for the trading period 30 January to 13 February 2015 was DKK 285 per share.
2. Average exercise price per option (excluding restricted stock units) amounted to DKK 35 in 2014, and calculated fair value per option amounted to DKK 225 in 2014.
Value at
OUTSTANDING RESTRICTED Cancelled launch date
STOCK UNITS Issued1 Released2 (accumulated) Outstanding DKK million Vesting date
Restricted stock units to employees2013 Restricted stock units 2,370,000 – – 2,370,000 1/04/16
Outstanding restricted stock units to employees at the end of 2015 2,370,000 – – 2,370,000
Shares allocated to joint pools for Senior Management Board2011 Shares allocated to joint pool 448,560 (448,560) – 0 57 Q1 20152012 Shares allocated to joint pool 487,730 (10,435) – 477,295 73 Q1 20162013 Shares allocated to joint pool 254,513 (8,993) – 245,520 51 Q1 20172014 Shares allocated to joint pool 293,044 (9,369) – 283,675 66 Q1 20182015 Shares allocated to joint pool3 378,943 378,943 108 Q1 2019
Outstanding shares in joint pool for Senior Management Board 1,862,790 (477,357) – 1,385,433
Shares allocated to pools for management group below Senior Management Board2011 Shares allocated to pool 1,485,665 (1,329,080) (156,585) 0 188 Q1 20152012 Shares allocated to pool 1,559,235 (35,160) (168,922) 1,355,153 234 Q1 20162013 Shares allocated to pool 622,190 (22,620) (54,701) 544,869 126 Q1 20172014 Shares allocated to pool 683,728 (34,061) (26,474) 623,193 155 Q1 20182015 Shares allocated to pool3 879,988 – – 879,988 251 Q1 2019
Outstanding shares in pool for management group below Senior Management Board 5,230,806 (1,420,921) (406,682) 3,403,203
Outstanding at the end of 2015 9,463,596 (1,898,278) (406,682) 7,158,636
1. All restricted stock units and shares allocated to Management pools are hedged by treasury shares.2. Released shares from 2012 to 2014 Management pools relates to NNIT A/S employees following the Initial Public Offering of NNIT A/S.3. 2015 programme released subsequent to approval of the Annual Report 2015 on 2 February 2016. The programme includes former members of Senior Management Board with a
total value of DKK 16.2 million.
5.1 SHARE-BASED PAYMENT SCHEMES (CONTINUED)
OUTSTANDING RESTRICTED STOCK UNITS 2015 2014
Outstanding at the beginning of the year 7,960,080 10,528,372
Released restricted stock units to employees 0 (24,500)Released shares from 2011 Management pools1 (1,787,640) (3,341,692)Released shares from 2012–2014 management pools2 (120,638) Cancelled shares from Management pool1 (152,097) (178,872)Shares allocated to Management pools 1,258,931 976,772
Outstanding at the end of the year 7,158,636 7,960,080
1. Includes 10,000 shares released and 2,190 shares cancelled related to Management pools from previous years.
2. Realised 2012–2014 programme following the partial divestment of NNIT A/S.
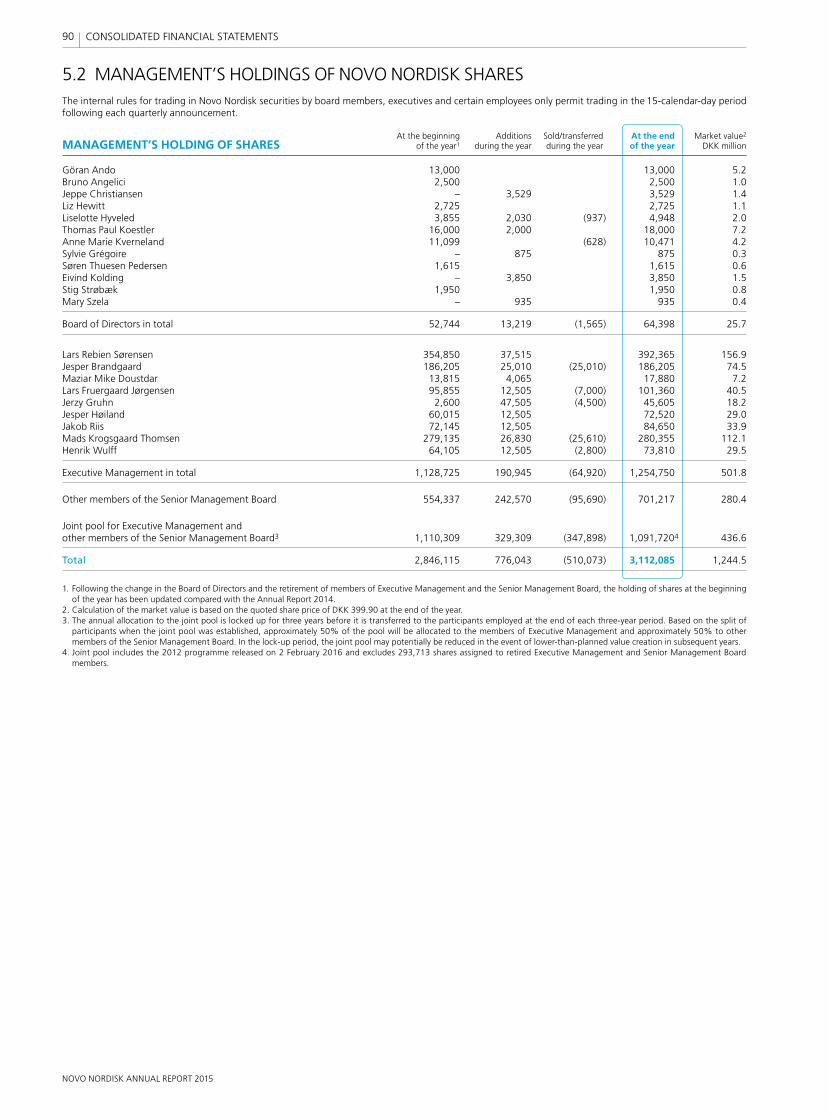
NOVO NORDISK ANNUAL REPORT 2015
90 CONSOLIDATED FINANCIAL STATEMENTS
5.2 MANAGEMENT’S HOLDINGS OF NOVO NORDISK SHARESThe internal rules for trading in Novo Nordisk securities by board members, executives and certain employees only permit trading in the 15-calendar-day period following each quarterly announcement.
At the beginning Additions Sold/transferred At the end Market value2
MANAGEMENT’S HOLDING OF SHARES of the year1 during the year during the year of the year DKK million
Göran Ando 13,000 13,000 5.2Bruno Angelici 2,500 2,500 1.0Jeppe Christiansen – 3,529 3,529 1.4Liz Hewitt 2,725 2,725 1.1Liselotte Hyveled 3,855 2,030 (937) 4,948 2.0Thomas Paul Koestler 16,000 2,000 18,000 7.2Anne Marie Kverneland 11,099 (628) 10,471 4.2Sylvie Grégoire – 875 875 0.3Søren Thuesen Pedersen 1,615 1,615 0.6Eivind Kolding – 3,850 3,850 1.5Stig Strøbæk 1,950 1,950 0.8Mary Szela – 935 935 0.4
Board of Directors in total 52,744 13,219 (1,565) 64,398 25.7
Lars Rebien Sørensen 354,850 37,515 392,365 156.9Jesper Brandgaard 186,205 25,010 (25,010) 186,205 74.5Maziar Mike Doustdar 13,815 4,065 17,880 7.2Lars Fruergaard Jørgensen 95,855 12,505 (7,000) 101,360 40.5Jerzy Gruhn 2,600 47,505 (4,500) 45,605 18.2Jesper Høiland 60,015 12,505 72,520 29.0Jakob Riis 72,145 12,505 84,650 33.9Mads Krogsgaard Thomsen 279,135 26,830 (25,610) 280,355 112.1Henrik Wulff 64,105 12,505 (2,800) 73,810 29.5
Executive Management in total 1,128,725 190,945 (64,920) 1,254,750 501.8
Other members of the Senior Management Board 554,337 242,570 (95,690) 701,217 280.4
Joint pool for Executive Management and other members of the Senior Management Board3 1,110,309 329,309 (347,898) 1,091,7204 436.6
Total 2,846,115 776,043 (510,073) 3,112,085 1,244.5
1. Following the change in the Board of Directors and the retirement of members of Executive Management and the Senior Management Board, the holding of shares at the beginning of the year has been updated compared with the Annual Report 2014.
2. Calculation of the market value is based on the quoted share price of DKK 399.90 at the end of the year.3. The annual allocation to the joint pool is locked up for three years before it is transferred to the participants employed at the end of each three-year period. Based on the split of
participants when the joint pool was established, approximately 50% of the pool will be allocated to the members of Executive Management and approximately 50% to other members of the Senior Management Board. In the lock-up period, the joint pool may potentially be reduced in the event of lower-than-planned value creation in subsequent years.
4. Joint pool includes the 2012 programme released on 2 February 2016 and excludes 293,713 shares assigned to retired Executive Management and Senior Management Board members.
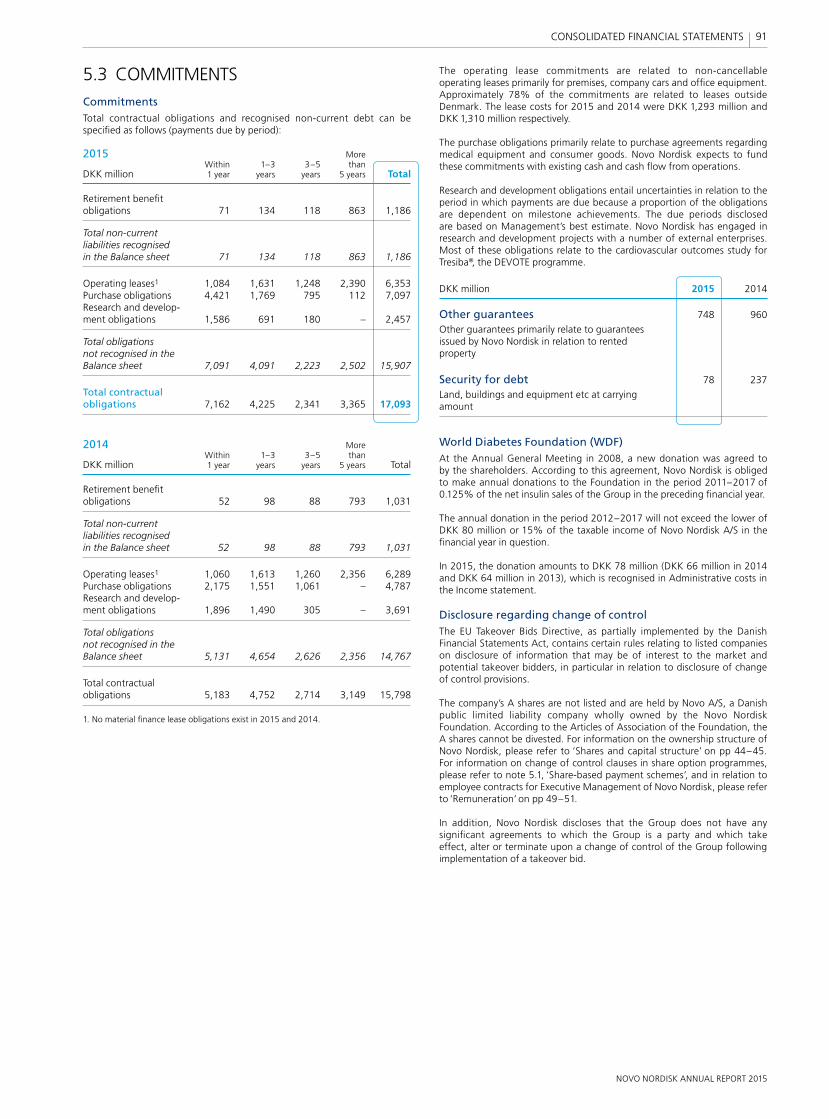
NOVO NORDISK ANNUAL REPORT 2015
91 CONSOLIDATED FINANCIAL STATEMENTS
5.3 COMMITMENTSCommitmentsTotal contractual obligations and recognised non-current debt can be specifi ed as follows (payments due by period):
2015 More Within 1–3 3–5 than DKK million 1 year years years 5 years Total
Retirement benefi t obligations 71 134 118 863 1,186
Total non-current liabilities recognised in the Balance sheet 71 134 118 863 1,186
Operating leases1 1,084 1,631 1,248 2,390 6,353Purchase obligations 4,421 1,769 795 112 7,097Research and develop-ment obligations 1,586 691 180 – 2,457
Total obligations not recognised in the Balance sheet 7,091 4,091 2,223 2,502 15,907
Total contractual obligations 7,162 4,225 2,341 3,365 17,093
2014 More Within 1–3 3–5 than DKK million 1 year years years 5 years Total
Retirement benefi t obligations 52 98 88 793 1,031
Total non-current liabilities recognised in the Balance sheet 52 98 88 793 1,031
Operating leases1 1,060 1,613 1,260 2,356 6,289Purchase obligations 2,175 1,551 1,061 – 4,787Research and develop-ment obligations 1,896 1,490 305 – 3,691
Total obligations not recognised in the Balance sheet 5,131 4,654 2,626 2,356 14,767
Total contractual obligations 5,183 4,752 2,714 3,149 15,798
1. No material fi nance lease obligations exist in 2015 and 2014.
The operating lease commitments are related to non-cancellable operating leases primarily for premises, company cars and offi ce equipment. Approximately 78% of the commitments are related to leases outside Denmark. The lease costs for 2015 and 2014 were DKK 1,293 million and DKK 1,310 million respectively.
The purchase obligations primarily relate to purchase agreements regarding medical equipment and consumer goods. Novo Nordisk expects to fund these commitments with existing cash and cash fl ow from operations.
Research and development obligations entail uncertainties in relation to the period in which payments are due because a proportion of the obligations are dependent on milestone achievements. The due periods disclosed are based on Management’s best estimate. Novo Nordisk has engaged in research and development projects with a number of external enterprises. Most of these obligations relate to the cardiovascular outcomes study for Tresiba®, the DEVOTE programme.
DKK million 2015 2014
Other guarantees 748 960
Other guarantees primarily relate to guarantees issued by Novo Nordisk in relation to rented property
Security for debt 78 237
Land, buildings and equipment etc at carrying amount
World Diabetes Foundation (WDF)At the Annual General Meeting in 2008, a new donation was agreed to by the shareholders. According to this agreement, Novo Nordisk is obliged to make annual donations to the Foundation in the period 2011–2017 of 0.125% of the net insulin sales of the Group in the preceding fi nancial year.
The annual donation in the period 2012–2017 will not exceed the lower of DKK 80 million or 15% of the taxable income of Novo Nordisk A/S in the fi nancial year in question.
In 2015, the donation amounts to DKK 78 million (DKK 66 million in 2014 and DKK 64 million in 2013), which is recognised in Administrative costs in the Income statement.
Disclosure regarding change of controlThe EU Takeover Bids Directive, as partially implemented by the Danish Financial Statements Act, contains certain rules relating to listed companies on disclosure of information that may be of interest to the market and potential takeover bidders, in particular in relation to disclosure of change of control provisions.
The company’s A shares are not listed and are held by Novo A/S, a Danish public limited liability company wholly owned by the Novo Nordisk Foundation. According to the Articles of Association of the Foundation, the A shares cannot be divested. For information on the ownership structure of Novo Nordisk, please refer to ‘Shares and capital structure’ on pp 44–45. For information on change of control clauses in share option programmes, please refer to note 5.1, ‘Share-based payment schemes’, and in relation to employee contracts for Executive Management of Novo Nordisk, please refer to ‘Remuneration’ on pp 49–51.
In addition, Novo Nordisk discloses that the Group does not have any signifi cant agreements to which the Group is a party and which take effect, alter or terminate upon a change of control of the Group following implementation of a takeover bid.
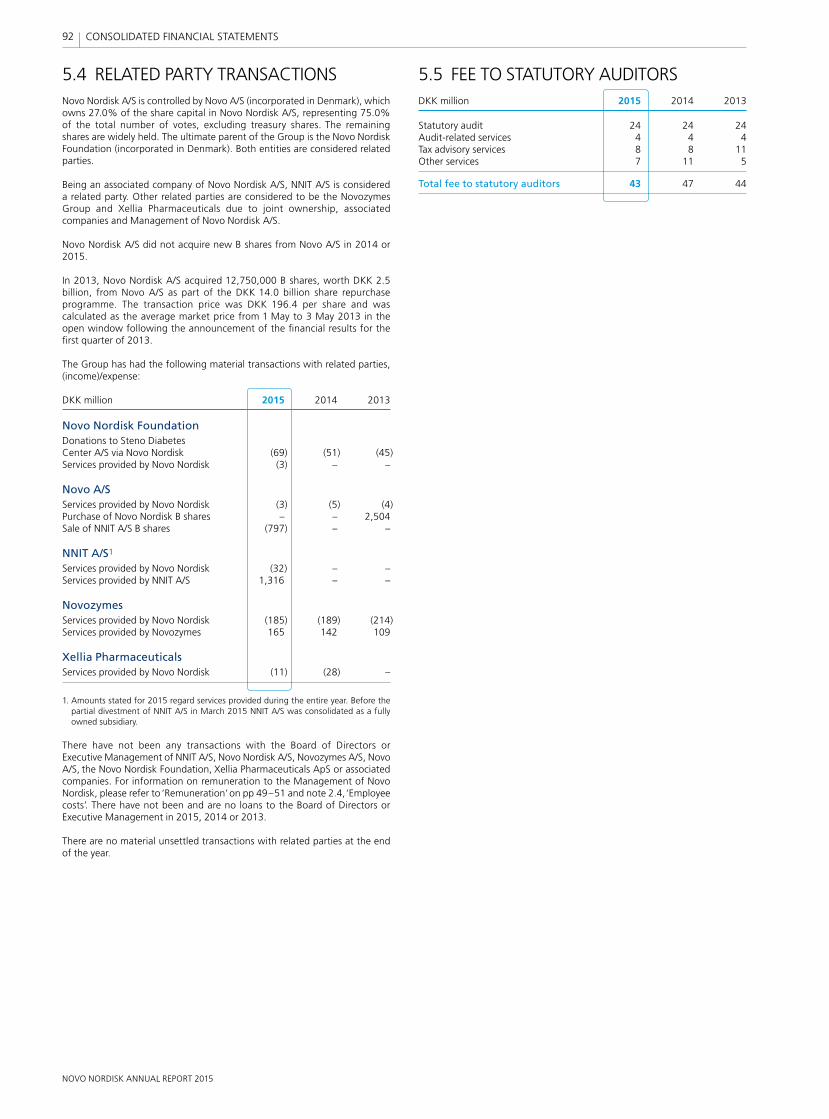
NOVO NORDISK ANNUAL REPORT 2015
92 CONSOLIDATED FINANCIAL STATEMENTS
5.5 FEE TO STATUTORY AUDITORSDKK million 2015 2014 2013
Statutory audit 24 24 24Audit-related services 4 4 4Tax advisory services 8 8 11Other services 7 11 5
Total fee to statutory auditors 43 47 44
5.4 RELATED PARTY TRANSACTIONSNovo Nordisk A/S is controlled by Novo A/S (incorporated in Denmark), which owns 27.0% of the share capital in Novo Nordisk A/S, representing 75.0% of the total number of votes, excluding treasury shares. The remaining shares are widely held. The ultimate parent of the Group is the Novo Nordisk Foundation (incorporated in Denmark). Both entities are considered related parties.
Being an associated company of Novo Nordisk A/S, NNIT A/S is considered a related party. Other related parties are considered to be the Novozymes Group and Xellia Pharmaceuticals due to joint ownership, associated companies and Management of Novo Nordisk A/S.
Novo Nordisk A/S did not acquire new B shares from Novo A/S in 2014 or 2015.
In 2013, Novo Nordisk A/S acquired 12,750,000 B shares, worth DKK 2.5 billion, from Novo A/S as part of the DKK 14.0 billion share repurchase programme. The transaction price was DKK 196.4 per share and was calculated as the average market price from 1 May to 3 May 2013 in the open window following the announcement of the fi nancial results for the fi rst quarter of 2013.
The Group has had the following material transactions with related parties, (income)/expense:
DKK million 2015 2014 2013
Novo Nordisk FoundationDonations to Steno Diabetes Center A/S via Novo Nordisk (69) (51) (45)Services provided by Novo Nordisk (3) – –
Novo A/SServices provided by Novo Nordisk (3) (5) (4)Purchase of Novo Nordisk B shares – – 2,504Sale of NNIT A/S B shares (797) – –
NNIT A/S1
Services provided by Novo Nordisk (32) – –Services provided by NNIT A/S 1,316 – –
NovozymesServices provided by Novo Nordisk (185) (189) (214)Services provided by Novozymes 165 142 109
Xellia PharmaceuticalsServices provided by Novo Nordisk (11) (28) –
1. Amounts stated for 2015 regard services provided during the entire year. Before the partial divestment of NNIT A/S in March 2015 NNIT A/S was consolidated as a fully owned subsidiary.
There have not been any transactions with the Board of Directors or Executive Management of NNIT A/S, Novo Nordisk A/S, Novozymes A/S, Novo A/S, the Novo Nordisk Foundation, Xellia Pharmaceuticals ApS or associated companies. For information on remuneration to the Management of Novo Nordisk, please refer to ‘Remuneration’ on pp 49–51 and note 2.4, ‘Employee costs’. There have not been and are no loans to the Board of Directors or Executive Management in 2015, 2014 or 2013.
There are no material unsettled transactions with related parties at the end of the year.
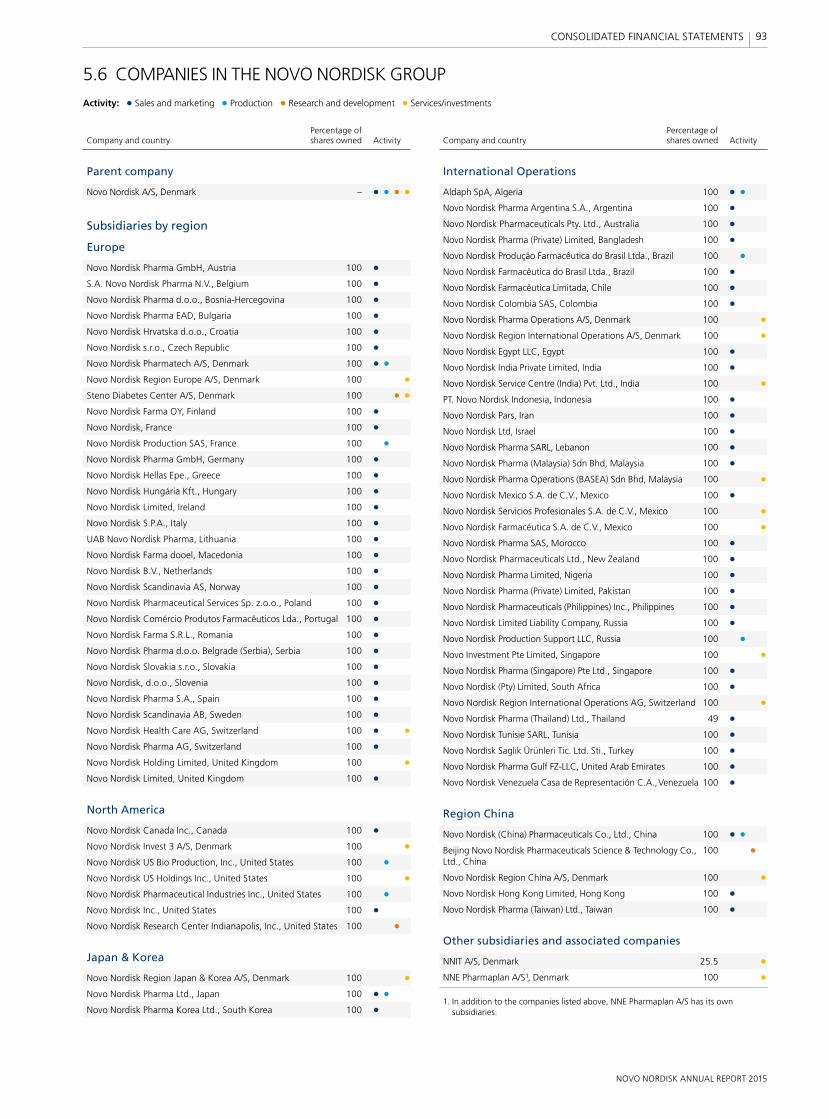
NOVO NORDISK ANNUAL REPORT 2015
93 CONSOLIDATED FINANCIAL STATEMENTS
5.6 COMPANIES IN THE NOVO NORDISK GROUP
Activity: • Sales and marketing • Production • Research and development • Services/investments
Percentage of Company and country shares owned Activity
Parent company
Novo Nordisk A/S, Denmark – • • • •
Subsidiaries by region
Europe
Novo Nordisk Pharma GmbH, Austria 100 • S.A. Novo Nordisk Pharma N.V., Belgium 100 • Novo Nordisk Pharma d.o.o., Bosnia-Hercegovina 100 • Novo Nordisk Pharma EAD, Bulgaria 100 • Novo Nordisk Hrvatska d.o.o., Croatia 100 • Novo Nordisk s.r.o., Czech Republic 100 • Novo Nordisk Pharmatech A/S, Denmark 100 • • Novo Nordisk Region Europe A/S, Denmark 100 • Steno Diabetes Center A/S, Denmark 100 • • Novo Nordisk Farma OY, Finland 100 • Novo Nordisk, France 100 • Novo Nordisk Production SAS, France 100 • Novo Nordisk Pharma GmbH, Germany 100 • Novo Nordisk Hellas Epe., Greece 100 • Novo Nordisk Hungária Kft., Hungary 100 • Novo Nordisk Limited, Ireland 100 • Novo Nordisk S.P.A., Italy 100 • UAB Novo Nordisk Pharma, Lithuania 100 • Novo Nordisk Farma dooel, Macedonia 100 • Novo Nordisk B.V., Netherlands 100 • Novo Nordisk Scandinavia AS, Norway 100 • Novo Nordisk Pharmaceutical Services Sp. z.o.o., Poland 100 • Novo Nordisk Comércio Produtos Farmaceuticos Lda., Portugal 100 • Novo Nordisk Farma S.R.L., Romania 100 • Novo Nordisk Pharma d.o.o. Belgrade (Serbia), Serbia 100 • Novo Nordisk Slovakia s.r.o., Slovakia 100 • Novo Nordisk, d.o.o., Slovenia 100 • Novo Nordisk Pharma S.A., Spain 100 • Novo Nordisk Scandinavia AB, Sweden 100 • Novo Nordisk Health Care AG, Switzerland 100 • • Novo Nordisk Pharma AG, Switzerland 100 • Novo Nordisk Holding Limited, United Kingdom 100 • Novo Nordisk Limited, United Kingdom 100 •
North America
Novo Nordisk Canada Inc., Canada 100 • Novo Nordisk Invest 3 A/S, Denmark 100 • Novo Nordisk US Bio Production, Inc., United States 100 • Novo Nordisk US Holdings Inc., United States 100 • Novo Nordisk Pharmaceutical Industries Inc., United States 100 • Novo Nordisk Inc., United States 100 • Novo Nordisk Research Center Indianapolis, Inc., United States 100 •
Japan & Korea
Novo Nordisk Region Japan & Korea A/S, Denmark 100 • Novo Nordisk Pharma Ltd., Japan 100 • • Novo Nordisk Pharma Korea Ltd., South Korea 100 •
Percentage of Company and country shares owned Activity
International Operations
Aldaph SpA, Algeria 100 • • Novo Nordisk Pharma Argentina S.A., Argentina 100 • Novo Nordisk Pharmaceuticals Pty. Ltd., Australia 100 • Novo Nordisk Pharma (Private) Limited, Bangladesh 100 • Novo Nordisk Produção Farmacêutica do Brasil Ltda., Brazil 100 • Novo Nordisk Farmacêutica do Brasil Ltda., Brazil 100 • Novo Nordisk Farmacêutica Limitada, Chile 100 • Novo Nordisk Colombia SAS, Colombia 100 • Novo Nordisk Pharma Operations A/S, Denmark 100 • Novo Nordisk Region International Operations A/S, Denmark 100 • Novo Nordisk Egypt LLC, Egypt 100 • Novo Nordisk India Private Limited, India 100 • Novo Nordisk Service Centre (India) Pvt. Ltd., India 100 • PT. Novo Nordisk Indonesia, Indonesia 100 • Novo Nordisk Pars, Iran 100 • Novo Nordisk Ltd, Israel 100 • Novo Nordisk Pharma SARL, Lebanon 100 • Novo Nordisk Pharma (Malaysia) Sdn Bhd, Malaysia 100 • Novo Nordisk Pharma Operations (BASEA) Sdn Bhd, Malaysia 100 • Novo Nordisk Mexico S.A. de C.V., Mexico 100 • Novo Nordisk Servicios Profesionales S.A. de C.V., Mexico 100 • Novo Nordisk Farmacéutica S.A. de C.V., Mexico 100 • Novo Nordisk Pharma SAS, Morocco 100 • Novo Nordisk Pharmaceuticals Ltd., New Zealand 100 • Novo Nordisk Pharma Limited, Nigeria 100 • Novo Nordisk Pharma (Private) Limited, Pakistan 100 • Novo Nordisk Pharmaceuticals (Philippines) Inc., Philippines 100 • Novo Nordisk Limited Liability Company, Russia 100 • Novo Nordisk Production Support LLC, Russia 100 • Novo Investment Pte Limited, Singapore 100 • Novo Nordisk Pharma (Singapore) Pte Ltd., Singapore 100 • Novo Nordisk (Pty) Limited, South Africa 100 • Novo Nordisk Region International Operations AG, Switzerland 100 • Novo Nordisk Pharma (Thailand) Ltd., Thailand 49 • Novo Nordisk Tunisie SARL, Tunisia 100 • Novo Nordisk Saglik Ürünleri Tic. Ltd. Sti., Turkey 100 • Novo Nordisk Pharma Gulf FZ-LLC, United Arab Emirates 100 • Novo Nordisk Venezuela Casa de Representación C.A., Venezuela 100 •
Region China
Novo Nordisk (China) Pharmaceuticals Co., Ltd., China 100 • • Beijing Novo Nordisk Pharmaceuticals Science & Technology Co., 100 • Ltd., China
Novo Nordisk Region China A/S, Denmark 100 • Novo Nordisk Hong Kong Limited, Hong Kong 100 • Novo Nordisk Pharma (Taiwan) Ltd., Taiwan 100 •
Other subsidiaries and associated companies
NNIT A/S, Denmark 25.5 • NNE Pharmaplan A/S1, Denmark 100 •
1. In addition to the companies listed above, NNE Pharmaplan A/S has its own subsidiaries.
NOVO NORDISK ANNUAL REPORT 2015
94 CONSOLIDATED FINANCIAL STATEMENTS
5.7 FINANCIAL DEFINITIONSADRAn American Depositary Receipt (or ADR) represents ownership in the shares of a non-US company and trades in US fi nancial markets.
Basic earnings per share (EPS) Net profi t divided by the average number of shares outstanding.
Diluted earnings per share Net profi t divided by average number of shares outstanding, including the dilutive effect of the outstanding restricted stock units.
Effective tax rate Income taxes as a percentage of profi t before income taxes.
Equity ratio Total equity at year-end as a percentage of total assets at year-end.
Gross margin Gross profi t as a percentage of sales.
Net profi t margin Net profi t as a percentage of sales.
Number of shares outstanding The total number of shares, excluding the holding of treasury shares.
Operating margin Operating profi t as a percentage of sales.
Other comprehensive income (OCI)Other comprehensive income comprises all items recognised in Equity for the year other than those related to transactions with owners of the com pany. Examples of items that are required to be presented in OCI are:
• Exchange rate adjustments of investments in subsidiaries• Remeasurements of defi ned benefi t plans• Changes in fair value of fi nancial instruments in a cash fl ow hedge.
Payout ratio Total dividends for the year as a percentage of net profi t.
Return on equity (ROE)Net profi t for the year as a percentage of shareholders’ equity (average).
Non-IFRS fi nancial measuresIn the Annual Report, Novo Nordisk discloses certain fi nancial measures of the Group’s fi nancial performance, fi nancial position and cash fl ows that refl ect adjustments to the most directly comparable measures calculated and presented in accordance with IFRS. These non-IFRS fi nancial measures may not be defi ned and calculated by other companies in the same manner, and may thus not be comparable with such measures.
The non-IFRS fi nancial measures presented in the Annual Report are:
• Cash to earnings• Financial resources at the end of the year• Free cash fl ow• Operating profi t after tax to net operating assets• Underlying sales growth in local currencies.
Cash to earningsCash to earnings is defi ned as ‘free cash fl ow as a percentage of net profi t’.
Financial resources at the end of the yearFinancial resources at the end of the year is defi ned as the sum of cash and cash equivalents at the end of the year, bonds with original term to maturity exceeding three months and undrawn committed credit facilities.
Free cash fl owNovo Nordisk defi nes free cash fl ow as ‘net cash generated from operating activities’ less ‘net cash used in investing activities’ excluding ‘net change in marketable securities’.
Net asset value per shareDefi ned as the company value per share, calculated by dividing the total net asset value of Novo Nordisk A/S by the number of shares outstanding.
Operating profi t after tax to net operating assets (OPAT/NOA)Operating profi t after tax to net operating assets is defi ned as ‘operating profi t after tax (using the effective tax rate) as a percentage of average inventories, receivables, property, plant and equipment, intangible assets and deferred tax assets less non-interest-bearing liabilities including provisions and deferred tax liabilities (where average is the sum of the above assets and liabilities at the beginning of the year and at year-end divided by two)’.
Underlying sales growth in local currenciesUnderlying sales growth in local currencies is defi ned as sales for the year measured at prior-year average exchange rates compared with sales for the prior year measured at prior-year average exchange rates.
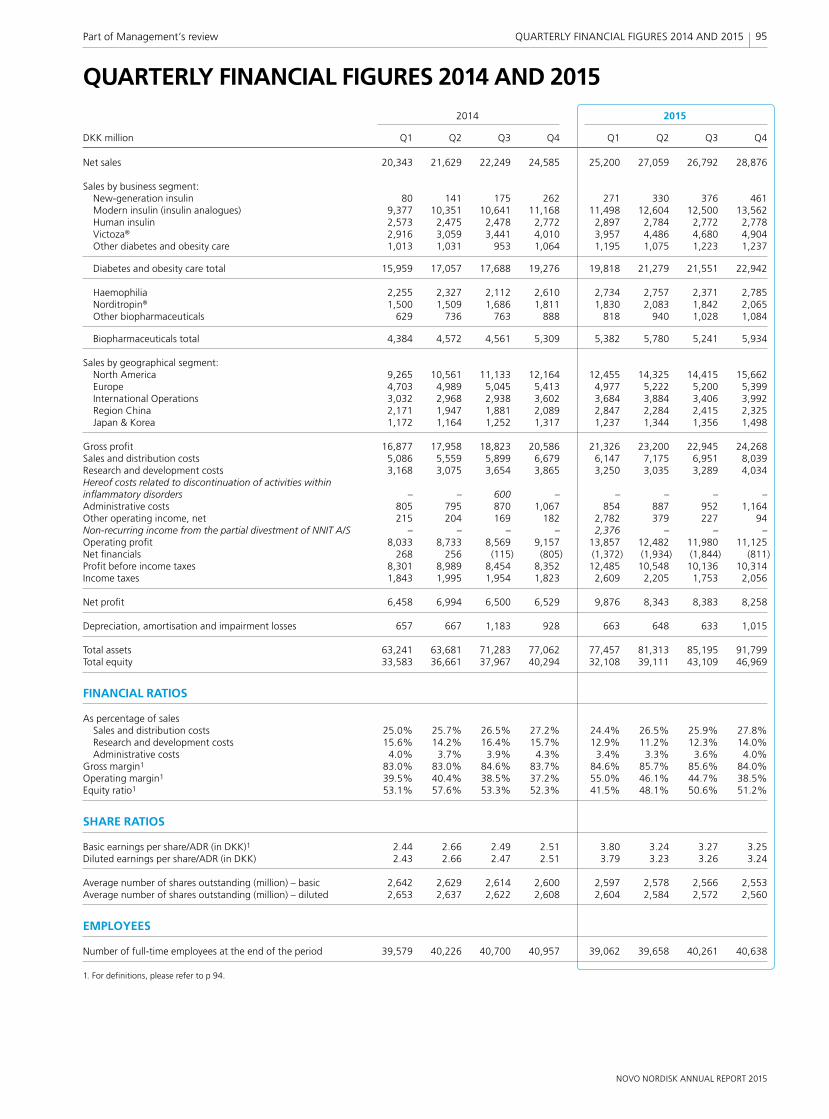
NOVO NORDISK ANNUAL REPORT 2015
95Part of Management’s review QUARTERLY FINANCIAL FIGURES 2014 AND 2015
QUARTERLY FINANCIAL FIGURES 2014 AND 2015 2014 2015
DKK million Q1 Q2 Q3 Q4 Q1 Q2 Q3 Q4
Net sales 20,343 21,629 22,249 24,585 25,200 27,059 26,792 28,876
Sales by business segment: New-generation insulin 80 141 175 262 271 330 376 461 Modern insulin (insulin analogues) 9,377 10,351 10,641 11,168 11,498 12,604 12,500 13,562 Human insulin 2,573 2,475 2,478 2,772 2,897 2,784 2,772 2,778 Victoza® 2,916 3,059 3,441 4,010 3,957 4,486 4,680 4,904 Other diabetes and obesity care 1,013 1,031 953 1,064 1,195 1,075 1,223 1,237
Diabetes and obesity care total 15,959 17,057 17,688 19,276 19,818 21,279 21,551 22,942
Haemophilia 2,255 2,327 2,112 2,610 2,734 2,757 2,371 2,785 Norditropin® 1,500 1,509 1,686 1,811 1,830 2,083 1,842 2,065 Other biopharmaceuticals 629 736 763 888 818 940 1,028 1,084
Biopharmaceuticals total 4,384 4,572 4,561 5,309 5,382 5,780 5,241 5,934
Sales by geographical segment: North America 9,265 10,561 11,133 12,164 12,455 14,325 14,415 15,662 Europe 4,703 4,989 5,045 5,413 4,977 5,222 5,200 5,399 International Operations 3,032 2,968 2,938 3,602 3,684 3,884 3,406 3,992 Region China 2,171 1,947 1,881 2,089 2,847 2,284 2,415 2,325 Japan & Korea 1,172 1,164 1,252 1,317 1,237 1,344 1,356 1,498
Gross profi t 16,877 17,958 18,823 20,586 21,326 23,200 22,945 24,268Sales and distribution costs 5,086 5,559 5,899 6,679 6,147 7,175 6,951 8,039Research and development costs 3,168 3,075 3,654 3,865 3,250 3,035 3,289 4,034Hereof costs related to discontinuation of activities within infl ammatory disorders – – 600 – – – – –Administrative costs 805 795 870 1,067 854 887 952 1,164Other operating income, net 215 204 169 182 2,782 379 227 94Non-recurring income from the partial divestment of NNIT A/S – – – – 2,376 – – –Operating profi t 8,033 8,733 8,569 9,157 13,857 12,482 11,980 11,125Net fi nancials 268 256 (115) (805) (1,372) (1,934) (1,844) (811)Profi t before income taxes 8,301 8,989 8,454 8,352 12,485 10,548 10,136 10,314Income taxes 1,843 1,995 1,954 1,823 2,609 2,205 1,753 2,056
Net profi t 6,458 6,994 6,500 6,529 9,876 8,343 8,383 8,258
Depreciation, amortisation and impairment losses 657 667 1,183 928 663 648 633 1,015
Total assets 63,241 63,681 71,283 77,062 77,457 81,313 85,195 91,799Total equity 33,583 36,661 37,967 40,294 32,108 39,111 43,109 46,969
FINANCIAL RATIOS
As percentage of sales Sales and distribution costs 25.0% 25.7% 26.5% 27.2% 24.4% 26.5% 25.9% 27.8% Research and development costs 15.6% 14.2% 16.4% 15.7% 12.9% 11.2% 12.3% 14.0% Administrative costs 4.0% 3.7% 3.9% 4.3% 3.4% 3.3% 3.6% 4.0%Gross margin1 83.0% 83.0% 84.6% 83.7% 84.6% 85.7% 85.6% 84.0%Operating margin1 39.5% 40.4% 38.5% 37.2% 55.0% 46.1% 44.7% 38.5%Equity ratio1 53.1% 57.6% 53.3% 52.3% 41.5% 48.1% 50.6% 51.2%
SHARE RATIOS
Basic earnings per share/ADR (in DKK)1 2.44 2.66 2.49 2.51 3.80 3.24 3.27 3.25Diluted earnings per share/ADR (in DKK) 2.43 2.66 2.47 2.51 3.79 3.23 3.26 3.24
Average number of shares outstanding (million) – basic 2,642 2,629 2,614 2,600 2,597 2,578 2,566 2,553Average number of shares outstanding (million) – diluted 2,653 2,637 2,622 2,608 2,604 2,584 2,572 2,560
EMPLOYEES
Number of full-time employees at the end of the period 39,579 40,226 40,700 40,957 39,062 39,658 40,261 40,638
1. For defi nitions, please refer to p 94.
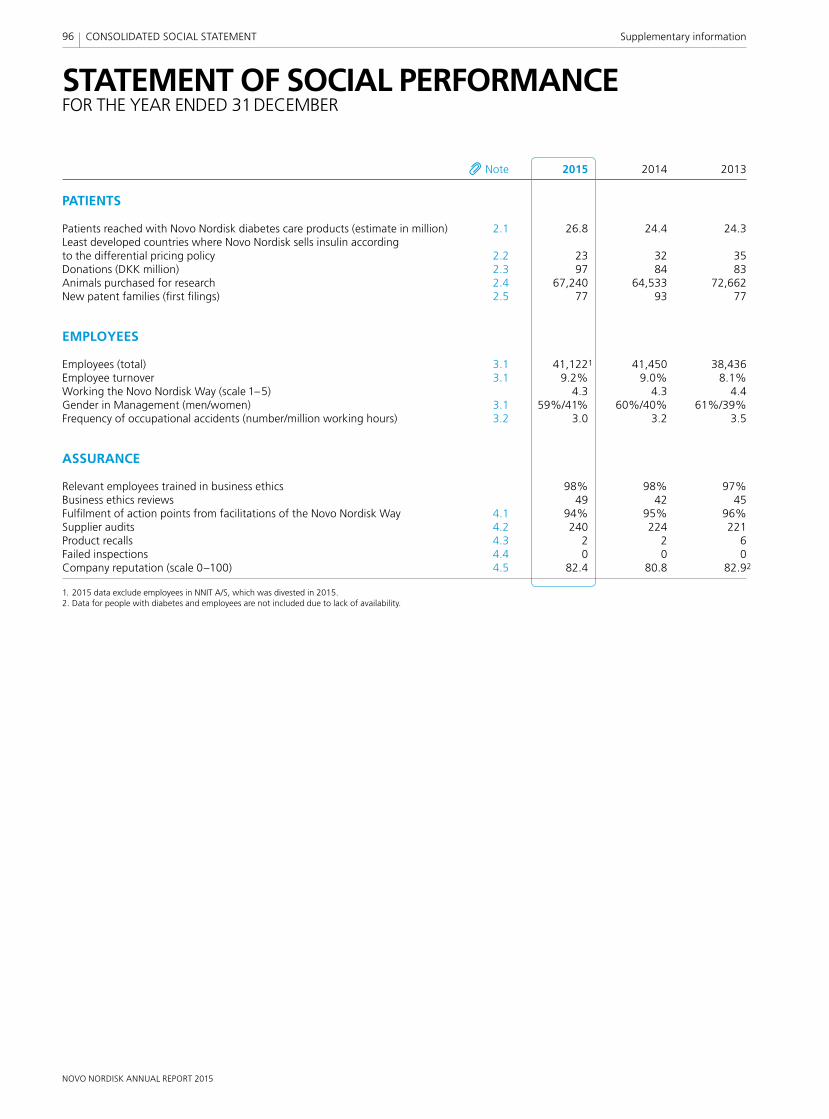
NOVO NORDISK ANNUAL REPORT 2015
96 CONSOLIDATED SOCIAL STATEMENT Supplementary information
STATEMENT OF SOCIAL PERFORMANCEFOR THE YEAR ENDED 31 DECEMBER
Note 2015 2014 2013
PATIENTS
Patients reached with Novo Nordisk diabetes care products (estimate in million) 2.1 26.8 24.4 24.3Least developed countries where Novo Nordisk sells insulin according to the differential pricing policy 2.2 23 32 35Donations (DKK million) 2.3 97 84 83Animals purchased for research 2.4 67,240 64,533 72,662New patent families (fi rst fi lings) 2.5 77 93 77
EMPLOYEES
Employees (total) 3.1 41,1221 41,450 38,436Employee turnover 3.1 9.2% 9.0% 8.1%Working the Novo Nordisk Way (scale 1–5) 4.3 4.3 4.4Gender in Management (men/women) 3.1 59%/41% 60%/40% 61%/39%Frequency of occupational accidents (number/million working hours) 3.2 3.0 3.2 3.5
ASSURANCE
Relevant employees trained in business ethics 98% 98% 97%Business ethics reviews 49 42 45Fulfi lment of action points from facilitations of the Novo Nordisk Way 4.1 94% 95% 96%Supplier audits 4.2 240 224 221Product recalls 4.3 2 2 6Failed inspections 4.4 0 0 0Company reputation (scale 0–100) 4.5 82.4 80.8 82.92
1. 2015 data exclude employees in NNIT A/S, which was divested in 2015.2. Data for people with diabetes and employees are not included due to lack of availability.
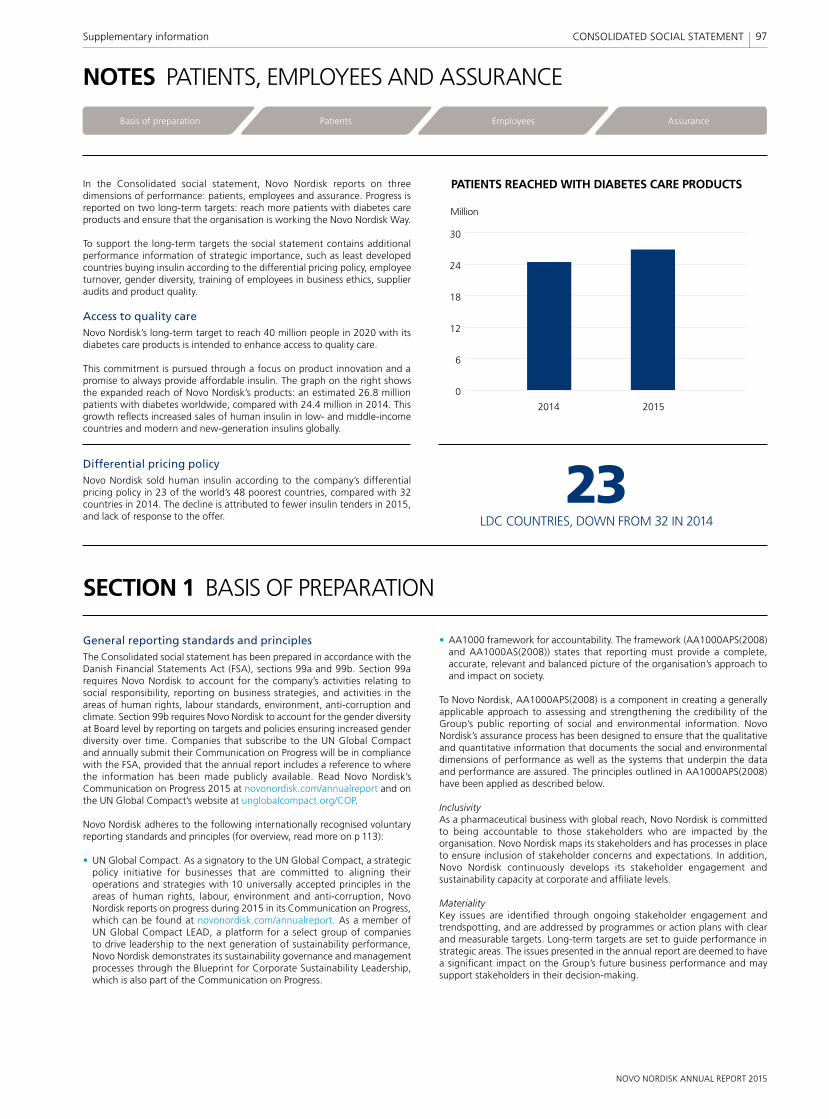
NOVO NORDISK ANNUAL REPORT 2015
97Supplementary information CONSOLIDATED SOCIAL STATEMENT
General reporting standards and principlesThe Consolidated social statement has been prepared in accordance with the Danish Financial Statements Act (FSA), sections 99a and 99b. Section 99a requires Novo Nordisk to account for the company’s activities relating to social responsibility, reporting on business strategies, and activities in the areas of human rights, labour standards, environment, anti-corruption and climate. Section 99b requires Novo Nordisk to account for the gender diversity at Board level by reporting on targets and policies ensuring increased gender diversity over time. Companies that subscribe to the UN Global Compact and annually submit their Communication on Progress will be in compliance with the FSA, provided that the annual report includes a reference to where the information has been made publicly available. Read Novo Nordisk’s Communication on Progress 2015 at novonordisk.com/annualreport and on the UN Global Compact’s website at unglobalcompact.org/COP.
Novo Nordisk adheres to the following internationally recognised voluntary reporting standards and principles (for overview, read more on p 113):
• UN Global Compact. As a signatory to the UN Global Compact, a strategic policy initiative for businesses that are committed to aligning their operations and strategies with 10 universally accepted principles in the areas of human rights, labour, environment and anti-corruption, Novo Nordisk reports on progress during 2015 in its Communication on Progress, which can be found at novonordisk.com/annualreport. As a member of UN Global Compact LEAD, a platform for a select group of companies to drive leadership to the next generation of sustainability performance, Novo Nordisk demonstrates its sustainability governance and management processes through the Blueprint for Corporate Sustainability Leadership, which is also part of the Communication on Progress.
SECTION 1 BASIS OF PREPARATION
• AA1000 framework for accountability. The framework (AA1000APS(2008) and AA1000AS(2008)) states that reporting must provide a complete, accurate, relevant and balanced picture of the organisation’s approach to and impact on society.
To Novo Nordisk, AA1000APS(2008) is a component in creating a generally applicable approach to assessing and strengthening the credibility of the Group’s public reporting of social and environmental information. Novo Nordisk’s assurance process has been designed to ensure that the qualitative and quantitative information that documents the social and environmental dimensions of performance as well as the systems that underpin the data and performance are assured. The principles outlined in AA1000APS(2008) have been applied as described below.
InclusivityAs a pharmaceutical business with global reach, Novo Nordisk is committed to being accountable to those stakeholders who are impacted by the organisation. Novo Nordisk maps its stakeholders and has processes in place to ensure inclusion of stakeholder concerns and expectations. In addition, Novo Nordisk continuously develops its stakeholder engagement and sustainability capacity at corporate and affi liate levels.
MaterialityKey issues are identifi ed through ongoing stakeholder engagement and trendspotting, and are addressed by programmes or action plans with clear and measurable targets. Long-term targets are set to guide performance in strategic areas. The issues presented in the annual report are deemed to have a signifi cant impact on the Group’s future business performance and may support stakeholders in their decision-making.
NOTES PATIENTS, EMPLOYEES AND ASSURANCE
In the Consolidated social statement, Novo Nordisk reports on three dimensions of performance: patients, employees and assurance. Progress is reported on two long-term targets: reach more patients with diabetes care products and ensure that the organisation is working the Novo Nordisk Way.
To support the long-term targets the social statement contains additional performance information of strategic importance, such as least developed countries buying insulin according to the differential pricing policy, employee turnover, gender diversity, training of employees in business ethics, supplier audits and product quality.
Access to quality careNovo Nordisk’s long-term target to reach 40 million people in 2020 with its diabetes care products is intended to enhance access to quality care.
This commitment is pursued through a focus on product innovation and a promise to always provide affordable insulin. The graph on the right shows the expanded reach of Novo Nordisk’s products: an estimated 26.8 million patients with diabetes worldwide, compared with 24.4 million in 2014. This growth refl ects increased sales of human insulin in low- and middle-income countries and modern and new-generation insulins globally.
Differential pricing policyNovo Nordisk sold human insulin according to the company’s differential pricing policy in 23 of the world’s 48 poorest countries, compared with 32 countries in 2014. The decline is attributed to fewer insulin tenders in 2015, and lack of response to the offer.
0
6
12
18
24
30
Million
2014 2015
PATIENTS REACHED WITH DIABETES CARE PRODUCTS
LDC COUNTRIES, DOWN FROM 32 IN 2014
23
Basis of preparation AssurancePatients Employees
NOVO NORDISK ANNUAL REPORT 2015
98 CONSOLIDATED SOCIAL STATEMENT Supplementary information
ResponsivenessThe report reaches out to a wide range of stakeholders, each with their specifi c needs and interests. To most stakeholders, however, the annual report is just one element of interaction and communication with the com-pany. The annual report refl ects how the company is managing operations in ways that respond to and consider stakeholder concerns and interests.
In addition, Novo Nordisk uses the content elements and guiding principles of the International Integrated Reporting Framework, <IR>, developed by the International Integrated Reporting Council to guide the reporting.
Applying materialityIt is Novo Nordisk’s responsibility to ensure that Management priorities and those areas in which the Group has signifi cant impact are addressed. Issues with respect to social and environmental reporting are prioritised, and the issues considered most material are included in the annual report.
In assessing which information to include in the annual report, legal require-ments and disclosure commitments made by Novo Nordisk are considered. Furthermore, it is assessed whether information is tied directly or indirectly to Novo Nordisk’s ability to create value. Short- and long-term value creation is taken into consideration.
The outcomes of formal reviews, research, stakeholder engagement and internal materiality discussions are presented as a proposal for annual reporting content to Executive Management and the Board of Directors.
The conclusion from the external assurance provider is available in the Independent assurance report on p 111.
Principles of consolidationThe Consolidated social statement and disclosures cover the Novo Nordisk Group comprising Novo Nordisk A/S and entities controlled by Novo Nordisk A/S.
SOCIAL ACCOUNTING POLICIES
The accounting policies set out below and in the notes have been applied consistently in the preparation of the Consolidated social statement for all the years presented with the following exceptions.
Changes to accounting policies and disclosuresThe following disclosure changes have been made to align with Management priorities:
• ‘Diverse senior management teams’ is replaced by ‘Gender in Management (men/women)’ to refl ect the updated policy focus on all managerial levels. External reporting on diversity in terms of nationality has been discontinued as it is not legal in the US to record employees’ nationality. Ensuring a diverse workforce remains a focus area for Novo Nordisk.
• ‘Warning Letters and re-inspections’ is replaced by ‘Failed inspections’ for consistency with conformance indicators.
• ‘Company reputation’ is reported using a new methodology covering more stakeholders.
OTHER ACCOUNTING POLICIES
Working the Novo Nordisk WayWorking the Novo Nordisk Way is an employee assessment measured on a scale of 1–5, with 5 being the best, and is a simple average of respondents’ answers to all mandatory questions in the annual employee survey, eVoice, covering the Novo Nordisk Way. For 2015, the eVoice response rate was 91%, compared with 94% in 2014.
Relevant employees trained in business ethicsThe mandatory business ethics training is based on globally applicable e-learning, standard operating procedures (SOPs) and related tests released annually by the Novo Nordisk Business Ethics Compliance Offi ce. The target groups for the individual SOPs vary in size and are defi ned by Novo Nordisk in each SOP. The target groups are all employees in Novo Nordisk at the end of the reporting period except employees on leave, student assistants, PhDs and post docs. The percentage of employees completing the training is calculated as the percentage of completion of both the SOPs and the related tests, based on internal registrations.
Business ethics reviewsThe number of business ethics reviews is recorded as the number of conducted business ethics reviews performed by Group Internal Audit in affi liates, production sites and headquarter areas. Furthermore, the number includes other business ethics assurance activities such as trend reports and third-party reviews.
SECTION 2 PATIENTS
2.1 PATIENTS REACHED WITH NOVO NORDISK DIABETES CARE PRODUCTS (ESTIMATE)
Accounting policiesThe number of full-year patients reached with Novo Nordisk diabetes care products, except devices and PrandiMet®, is estimated by dividing Novo Nordisk’s annual sales volume by the annual usage dose per patient for each product class as defi ned by the WHO. PrandiMet® is not included as no WHO-defi ned dosage exists.
The WHO-defi ned daily dosage has not changed since 1982 and it may not refl ect the recommended or prescribed daily dose precisely. Actual doses are based on individual characteristics (eg age and weight) and pharmacokinetic considerations. Despite this uncertainty, it is Novo Nordisk’s assessment that this is the most consistent way of reporting.
DevelopmentThe estimated number of full-year patients reached with Novo Nordisk’s diabetes care products increased from 24.4 million in 2014 to 26.8 million in 2015. The development refl ects an overall increase in the number of people treated with Novo Nordisk’s insulin products and was mainly driven by human insulin (1.2 million people) and modern and new-generation insulins (0.9 million people).
2.2 LEAST DEVELOPED COUNTRIES WHERE NOVO NORDISK SELLS INSULIN ACCORDING TO THE DIFFERENTIAL PRICING POLICY
Accounting policiesNovo Nordisk has formulated a differential pricing policy for the least developed countries (LDCs) as defi ned by the UN. The differential pricing policy is part of Novo Nordisk’s global initiative to promote access to healthcare for all LDCs. The purpose of the policy is to offer human insulin in vials to all LDCs at or below a market price of 20% of the average prices for human insulin in vials in the western world. The western world is defi ned as Europe (the EU, Switzerland and Norway), the US, Canada and Japan. The number of LDCs where Novo Nordisk sells human insulin in vials according to the differential pricing policy is measured by direct or indirect sales by Novo Nordisk via government tender or private market sales to wholesalers, distributors or non-governmental organisations.
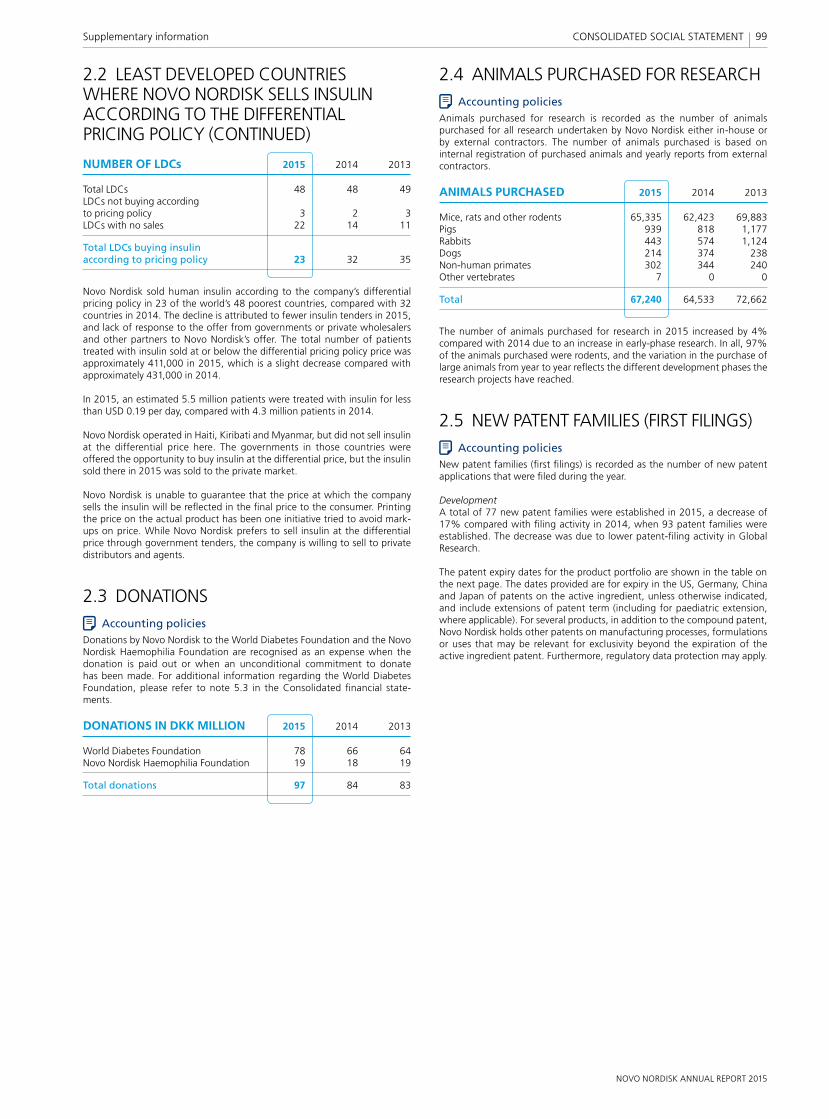
NOVO NORDISK ANNUAL REPORT 2015
99Supplementary information CONSOLIDATED SOCIAL STATEMENT
2.2 LEAST DEVELOPED COUNTRIES WHERE NOVO NORDISK SELLS INSULIN ACCORDING TO THE DIFFERENTIAL PRICING POLICY (CONTINUED)
NUMBER OF LDCs 2015 2014 2013
Total LDCs 48 48 49LDCs not buying according to pricing policy 3 2 3LDCs with no sales 22 14 11
Total LDCs buying insulin according to pricing policy 23 32 35
Novo Nordisk sold human insulin according to the company’s differential pricing policy in 23 of the world’s 48 poorest countries, compared with 32 countries in 2014. The decline is attributed to fewer insulin tenders in 2015, and lack of response to the offer from governments or private wholesalers and other partners to Novo Nordisk’s offer. The total number of patients treated with insulin sold at or below the differential pricing policy price was approximately 411,000 in 2015, which is a slight decrease compared with approximately 431,000 in 2014.
In 2015, an estimated 5.5 million patients were treated with insulin for less than USD 0.19 per day, compared with 4.3 million patients in 2014.
Novo Nordisk operated in Haiti, Kiribati and Myanmar, but did not sell insulin at the differential price here. The governments in those countries were offered the opportunity to buy insulin at the differential price, but the insulin sold there in 2015 was sold to the private market.
Novo Nordisk is unable to guarantee that the price at which the company sells the insulin will be refl ected in the fi nal price to the consumer. Printing the price on the actual product has been one initiative tried to avoid mark-ups on price. While Novo Nordisk prefers to sell insulin at the differential price through government tenders, the company is willing to sell to private distributors and agents.
2.3 DONATIONSAccounting policies
Donations by Novo Nordisk to the World Diabetes Foundation and the Novo Nordisk Haemophilia Foundation are recognised as an expense when the donation is paid out or when an unconditional commitment to donate has been made. For additional information regarding the World Diabetes Foundation, please refer to note 5.3 in the Consolidated fi nancial state-ments.
DONATIONS IN DKK MILLION 2015 2014 2013
World Diabetes Foundation 78 66 64Novo Nordisk Haemophilia Foundation 19 18 19
Total donations 97 84 83
2.4 ANIMALS PURCHASED FOR RESEARCHAccounting policies
Animals purchased for research is recorded as the number of animals purchased for all research undertaken by Novo Nordisk either in-house or by external contractors. The number of animals purchased is based on internal registration of purchased animals and yearly reports from external contractors.
ANIMALS PURCHASED 2015 2014 2013
Mice, rats and other rodents 65,335 62,423 69,883Pigs 939 818 1,177Rabbits 443 574 1,124Dogs 214 374 238Non-human primates 302 344 240Other vertebrates 7 0 0
Total 67,240 64,533 72,662
The number of animals purchased for research in 2015 increased by 4% compared with 2014 due to an increase in early-phase research. In all, 97% of the animals purchased were rodents, and the variation in the purchase of large animals from year to year refl ects the different development phases the research projects have reached.
2.5 NEW PATENT FAMILIES (FIRST FILINGS)Accounting policies
New patent families (fi rst fi lings) is recorded as the number of new patent applications that were fi led during the year.
DevelopmentA total of 77 new patent families were established in 2015, a decrease of 17% compared with fi ling activity in 2014, when 93 patent families were established. The decrease was due to lower patent-fi ling activity in Global Research.
The patent expiry dates for the product portfolio are shown in the table on the next page. The dates provided are for expiry in the US, Germany, China and Japan of patents on the active ingredient, unless otherwise indicated, and include extensions of patent term (including for paediatric extension, where applicable). For several products, in addition to the compound patent, Novo Nordisk holds other patents on manufacturing processes, formulations or uses that may be relevant for exclusivity beyond the expiration of the active ingredient patent. Furthermore, regulatory data protection may apply.
NOVO NORDISK ANNUAL REPORT 2015
SECTION 3 EMPLOYEES
100 CONSOLIDATED SOCIAL STATEMENT Supplementary information
1. Formulation patent until 2017. 2. Current estimate.3. Formulation patent providing exclusivity to the composition of excipients used in the
drug products.4. Room temperature-stable formulation patent until 2023.
5. Process patents until 2028 in China, Germany and Japan and until 2030 in the US.6. Data protection runs until 2025.7. Formulation patent expiring in 2016.8. Patent covers low-dose treatment regimen.9. Licensed to three generic manufacturers beginning in October 2016.
2.5 NEW PATENT FAMILIES (FIRST FILINGS) (CONTINUED)MARKETED PRODUCTS IN KEY MARKETS (ACTIVE INGREDIENTS) US Germany China Japan
Diabetes care:NovoRapid® (NovoLog®) Expired1 Expired1 Expired1 Expired1
NovoMix® 30 (NovoLog® Mix 70/30) Expired1 Expired Expired ExpiredLevemir® 2019 2019 Expired 2019NovoNorm® (Prandin®) Expired Expired Expired 2016Victoza® 2022 2022 2017 2022Tresiba® 20292 2028 2024 2027Ryzodeg® 20292 2028 2024 2027Xultophy® 20292 2028 2024 2027
Obesity:Saxenda® 2022 2022 2017 2017
Biopharmaceuticals:Norditropin® (Norditropin® SimpleXx®) 20173 20173 20173 20173
NovoSeven® Expired4 Expired4 Expired4 Expired4
NovoEight® N/A5 N/A5 N/A5 N/A5
NovoThirteen® (TRETTEN®) 20216 Expired7 N/A7 Expired7
Vagifem® 10 mcg 20228, 9 20218 N/A 20218
3.1 EMPLOYEES Accounting policies
The number of employees is recorded as all employees except externals, employees on unpaid leave, interns, bachelor and master thesis employees, and substitutes at year-end.
The rate of turnover is measured as the number of employees, excluding temporary employees, who left the Group during the fi nancial year compared with the average number of employees, excluding temporary employees.
Diversity in Novo Nordisk is reported as the percentage split by gender in all managerial positions and for newly appointed managers. Managerial positions are defi ned as all managers in Novo Nordisk (global job level incl CEO, EVP, SVP, CVP, VP, Director, Manager and Team Leader). New managers are defi ned as all employees who have moved to a managerial position within the last 12 months – both promoted and externally hired.
EMPLOYEES 2015 2014 2013
North America 6,439 6,465 6,162Europe 21,871 22,136 20,286– of which in Denmark 17,398 17,664 16,027International Operations 7,304 6,666 6,054Japan & Korea 1,119 1,086 1,084Region China 4,389 5,097 4,850
Total employees 41,122 41,450 38,436
Employees (FTEs) 40,638 40,957 37,978
Employee turnover 9.2% 9.0% 8.1%
Increase in employees (1%) 8% 11%
Gender in Management (men/women) 59%/41% 60%/40% 61%/39%
Share of women among newly appointed managers 44% 42% 41%
The slight decrease in the total headcount is due to the divestment of NNIT A/S in 2015. The underlying growth (5%) is in line with expectations and is primarily driven by expansion within the sales region International Operations and in the research & development and production organisa-tions, primarily in Denmark. Employee turnover increased slightly, primarily driven by Region China.
Among employees as a whole, the gender split was 50/50 in 2015, which is the same as in 2014.
3.2 FREQUENCY OF OCCUPATIONAL ACCIDENTS
Accounting policiesThe frequency of occupational accidents with absence is measured as the internally reported number of accidents for all employees (FTEs), excluding externals, employees on unpaid leave, interns, bachelor and master thesis employees, and substitutes, per million nominal working hours. An occupational accident with absence is any work-related accident causing at least one day of absence in addition to the day of the accident.
DevelopmentIn 2015, a sales representative in India died in a traffi c accident while on duty. Prior to this tragic accident, Novo Nordisk had not had any fatal occupational accidents since 2011. The number of occupational accidents with absence decreased by 7% compared with 2014. The frequency of occupational accidents decreased from 3.2 per million working hours in 2014 to 3.0 per million working hours in 2015. Novo Nordisk is working with a zero-injury mindset and the long-term commitment is to continuously improve performance. Focus is on strengthening risk awareness and preventing occupational accidents for all employees.
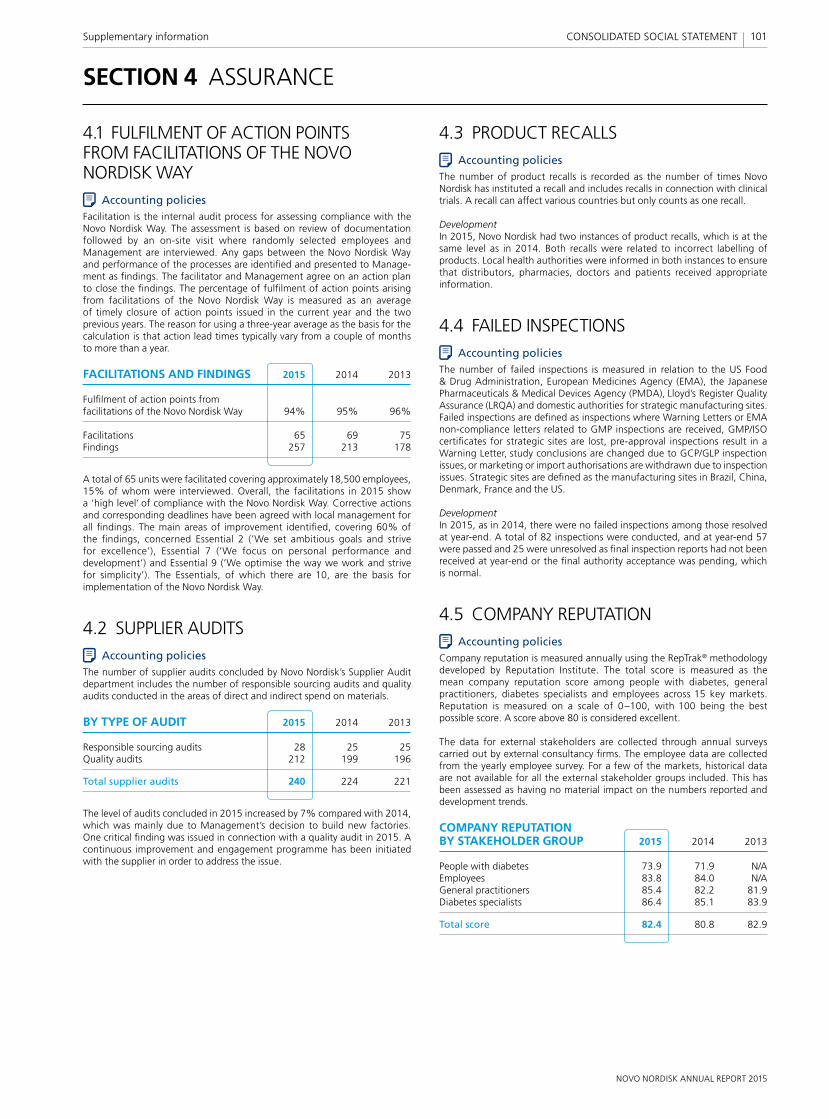
NOVO NORDISK ANNUAL REPORT 2015
101Supplementary information CONSOLIDATED SOCIAL STATEMENT
SECTION 4 ASSURANCE
4.1 FULFILMENT OF ACTION POINTS FROM FACILITATIONS OF THE NOVO NORDISK WAY
Accounting policiesFacilitation is the internal audit process for assessing compliance with the Novo Nordisk Way. The assessment is based on review of documentation followed by an on-site visit where randomly selected employees and Management are interviewed. Any gaps between the Novo Nordisk Way and performance of the processes are identifi ed and presented to Manage-ment as fi ndings. The facilitator and Management agree on an action plan to close the fi ndings. The percentage of fulfi lment of action points arising from facilitations of the Novo Nordisk Way is measured as an average of timely closure of action points issued in the current year and the two previous years. The reason for using a three-year average as the basis for the calculation is that action lead times typically vary from a couple of months to more than a year.
FACILITATIONS AND FINDINGS 2015 2014 2013
Fulfi lment of action points from facilitations of the Novo Nordisk Way 94% 95% 96%
Facilitations 65 69 75Findings 257 213 178
A total of 65 units were facilitated covering approximately 18,500 employees, 15% of whom were interviewed. Overall, the facilitations in 2015 show a ’high level’ of compliance with the Novo Nordisk Way. Corrective actions and corresponding deadlines have been agreed with local management for all fi ndings. The main areas of improvement identifi ed, covering 60% of the fi ndings, concerned Essential 2 (’We set ambitious goals and strive for excellence’), Essential 7 (’We focus on personal performance and development’) and Essential 9 (’We optimise the way we work and strive for simplicity’). The Essentials, of which there are 10, are the basis for implementation of the Novo Nordisk Way.
4.2 SUPPLIER AUDITSAccounting policies
The number of supplier audits concluded by Novo Nordisk’s Supplier Audit department includes the number of responsible sourcing audits and quality audits conducted in the areas of direct and indirect spend on materials.
BY TYPE OF AUDIT 2015 2014 2013
Responsible sourcing audits 28 25 25Quality audits 212 199 196
Total supplier audits 240 224 221
The level of audits concluded in 2015 increased by 7% compared with 2014, which was mainly due to Management’s decision to build new factories. One critical fi nding was issued in connection with a quality audit in 2015. A continuous improvement and engagement programme has been initiated with the supplier in order to address the issue.
4.3 PRODUCT RECALLSAccounting policies
The number of product recalls is recorded as the number of times Novo Nordisk has instituted a recall and includes recalls in connection with clinical trials. A recall can affect various countries but only counts as one recall.
DevelopmentIn 2015, Novo Nordisk had two instances of product recalls, which is at the same level as in 2014. Both recalls were related to incorrect labelling of products. Local health authorities were informed in both instances to ensure that distributors, pharmacies, doctors and patients received appropriate information.
4.4 FAILED INSPECTIONSAccounting policies
The number of failed inspections is measured in relation to the US Food & Drug Administration, European Medicines Agency (EMA), the Japanese Pharmaceuticals & Medical Devices Agency (PMDA), Lloyd’s Register Quality Assurance (LRQA) and domestic authorities for strategic manufacturing sites. Failed inspections are defi ned as inspections where Warning Letters or EMA non-compliance letters related to GMP inspections are received, GMP/ISO certifi cates for strategic sites are lost, pre-approval inspections result in a Warning Letter, study conclusions are changed due to GCP/GLP inspection issues, or marketing or import authorisations are withdrawn due to inspection issues. Strategic sites are defi ned as the manufacturing sites in Brazil, China, Denmark, France and the US.
DevelopmentIn 2015, as in 2014, there were no failed inspections among those resolved at year-end. A total of 82 inspections were conducted, and at year-end 57 were passed and 25 were unresolved as fi nal inspection reports had not been received at year-end or the fi nal authority acceptance was pending, which is normal.
4.5 COMPANY REPUTATIONAccounting policies
Company reputation is measured annually using the RepTrak® methodology developed by Reputation Institute. The total score is measured as the mean company reputation score among people with diabetes, general practitioners, diabetes specialists and employees across 15 key markets. Reputation is measured on a scale of 0–100, with 100 being the best possible score. A score above 80 is considered excellent.
The data for external stakeholders are collected through annual surveys carried out by external consultancy fi rms. The employee data are collected from the yearly employee survey. For a few of the markets, historical data are not available for all the external stakeholder groups included. This has been assessed as having no material impact on the numbers reported and development trends.
COMPANY REPUTATION BY STAKEHOLDER GROUP 2015 2014 2013
People with diabetes 73.9 71.9 N/AEmployees 83.8 84.0 N/AGeneral practitioners 85.4 82.2 81.9Diabetes specialists 86.4 85.1 83.9
Total score 82.4 80.8 82.9
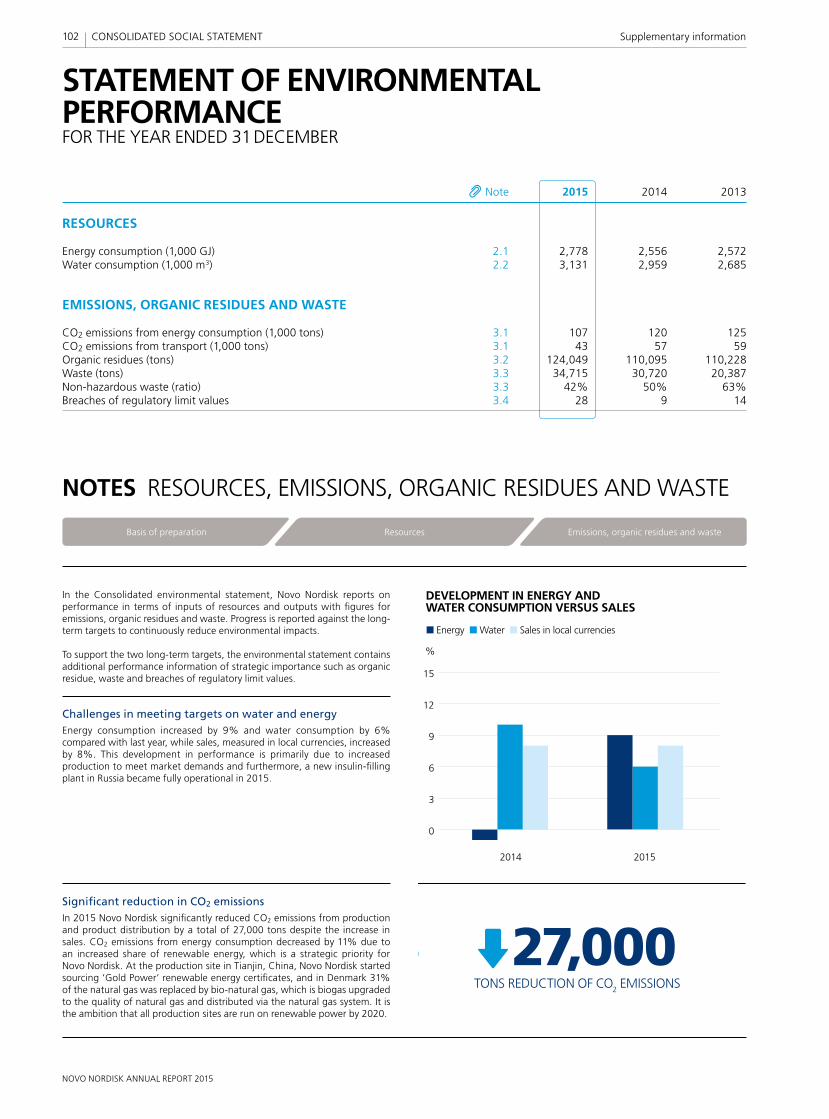
NOVO NORDISK ANNUAL REPORT 2015
In the Consolidated environmental statement, Novo Nordisk reports on performance in terms of inputs of resources and outputs with fi gures for emissions, organic residues and waste. Progress is reported against the long-term targets to continuously reduce environmental impacts.
To support the two long-term targets, the environmental statement contains additional performance information of strategic importance such as organic residue, waste and breaches of regulatory limit values.
Challenges in meeting targets on water and energy Energy consumption increased by 9% and water consumption by 6% compared with last year, while sales, measured in local currencies, increased by 8%. This development in performance is primarily due to increased production to meet market demands and furthermore, a new insulin-fi lling plant in Russia became fully operational in 2015.
Signifi cant reduction in CO2 emissionsIn 2015 Novo Nordisk signifi cantly reduced CO2 emissions from production and product distribution by a total of 27,000 tons despite the increase in sales. CO2 emissions from energy consumption decreased by 11% due to an increased share of renewable energy, which is a strategic priority for Novo Nordisk. At the production site in Tianjin, China, Novo Nordisk started sourcing ‘Gold Power’ renewable energy certifi cates, and in Denmark 31% of the natural gas was replaced by bio-natural gas, which is biogas upgraded to the quality of natural gas and distributed via the natural gas system. It is the ambition that all production sites are run on renewable power by 2020.
102 CONSOLIDATED SOCIAL STATEMENT Supplementary information
STATEMENT OF ENVIRONMENTAL PERFORMANCEFOR THE YEAR ENDED 31 DECEMBER
NOTES RESOURCES, EMISSIONS, ORGANIC RESIDUES AND WASTE
Note 2015 2014 2013
RESOURCES
Energy consumption (1,000 GJ) 2.1 2,778 2,556 2,572Water consumption (1,000 m3) 2.2 3,131 2,959 2,685
EMISSIONS, ORGANIC RESIDUES AND WASTE
CO2 emissions from energy consumption (1,000 tons) 3.1 107 120 125CO2 emissions from transport (1,000 tons) 3.1 43 57 59Organic residues (tons) 3.2 124,049 110,095 110,228Waste (tons) 3.3 34,715 30,720 20,387Non-hazardous waste (ratio) 3.3 42% 50% 63%Breaches of regulatory limit values 3.4 28 9 14
Basis of preparation Emissions, organic residues and wasteResources
0
3
6
9
12
15
DEVELOPMENT IN ENERGY AND WATER CONSUMPTION VERSUS SALES
2014 2015
%
Energy Water Sales in local currencies
0
3
6
9
12
15
DEVELOPMENT IN ENERGY AND WATER CONSUMPTION VERSUS SALES
2014 2015
%
Energy Water Sales in local currencies
TONS REDUCTION OF CO2 EMISSIONS27,000
TONS REDUCTION OF CO2 EMISSIONS
27,000
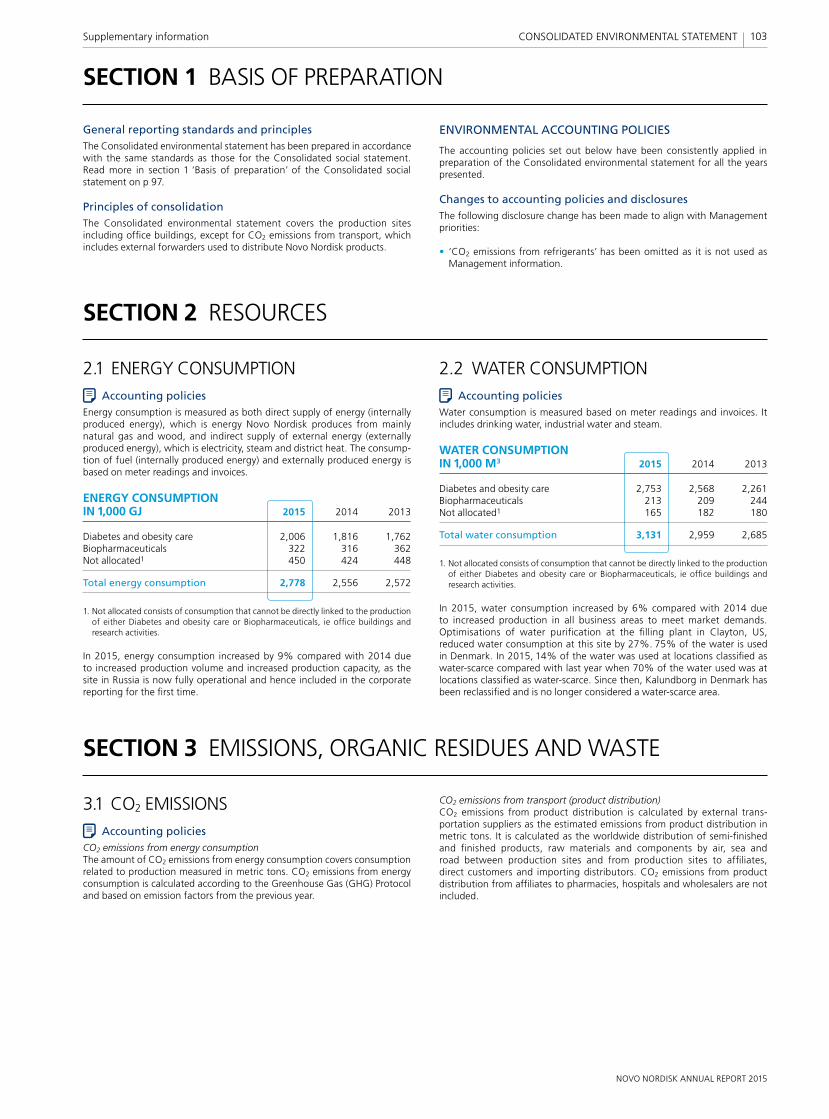
NOVO NORDISK ANNUAL REPORT 2015
103Supplementary information CONSOLIDATED ENVIRONMENTAL STATEMENT
General reporting standards and principlesThe Consolidated environmental statement has been prepared in accordance with the same standards as those for the Consolidated social statement. Read more in section 1 ‘Basis of preparation’ of the Consolidated social statement on p 97.
Principles of consolidationThe Consolidated environmental statement covers the production sites including offi ce buildings, except for CO2 emissions from transport, which includes external forwarders used to distribute Novo Nordisk products.
ENVIRONMENTAL ACCOUNTING POLICIES
The accounting policies set out below have been consistently applied in preparation of the Consolidated environmental statement for all the years presented.
Changes to accounting policies and disclosuresThe following disclosure change has been made to align with Management priorities:
• ‘CO2 emissions from refrigerants’ has been omitted as it is not used as Management information.
SECTION 1 BASIS OF PREPARATION
SECTION 2 RESOURCES
SECTION 3 EMISSIONS, ORGANIC RESIDUES AND WASTE
3.1 CO2 EMISSIONSAccounting policies
CO2 emissions from energy consumptionThe amount of CO2 emissions from energy consumption covers consumption related to production measured in metric tons. CO2 emissions from energy consumption is calculated according to the Greenhouse Gas (GHG) Protocol and based on emission factors from the previous year.
CO2 emissions from transport (product distribution)CO2 emissions from product distribution is calculated by external trans-portation suppliers as the estimated emissions from product distribution in metric tons. It is calculated as the worldwide distribution of semi-fi nished and fi nished products, raw materials and components by air, sea and road between production sites and from production sites to affi liates, direct customers and importing distributors. CO2 emissions from product distribution from affi liates to pharmacies, hospitals and wholesalers are not included.
2.1 ENERGY CONSUMPTIONAccounting policies
Energy consumption is measured as both direct supply of energy (internally produced energy), which is energy Novo Nordisk produces from mainly natural gas and wood, and indirect supply of external energy (externally produced energy), which is electricity, steam and district heat. The consump-tion of fuel (internally produced energy) and externally produced energy is based on meter readings and invoices.
ENERGY CONSUMPTION IN 1,000 GJ 2015 2014 2013
Diabetes and obesity care 2,006 1,816 1,762Biopharmaceuticals 322 316 362Not allocated1 450 424 448
Total energy consumption 2,778 2,556 2,572
1. Not allocated consists of consumption that cannot be directly linked to the production of either Diabetes and obesity care or Biopharmaceuticals, ie offi ce buildings and research activities.
In 2015, energy consumption increased by 9% compared with 2014 due to increased production volume and increased production capacity, as the site in Russia is now fully operational and hence included in the corporate reporting for the fi rst time.
2.2 WATER CONSUMPTIONAccounting policies
Water consumption is measured based on meter readings and invoices. It includes drinking water, industrial water and steam.
WATER CONSUMPTION IN 1,000 M3 2015 2014 2013
Diabetes and obesity care 2,753 2,568 2,261Biopharmaceuticals 213 209 244Not allocated1 165 182 180
Total water consumption 3,131 2,959 2,685
1. Not allocated consists of consumption that cannot be directly linked to the production of either Diabetes and obesity care or Biopharmaceuticals, ie offi ce buildings and research activities.
In 2015, water consumption increased by 6% compared with 2014 due to increased production in all business areas to meet market demands. Optimisations of water purifi cation at the fi lling plant in Clayton, US, reduced water consumption at this site by 27%. 75% of the water is used in Denmark. In 2015, 14% of the water was used at locations classifi ed as water-scarce compared with last year when 70% of the water used was at locations classifi ed as water-scarce. Since then, Kalundborg in Denmark has been reclassifi ed and is no longer considered a water-scarce area.

NOVO NORDISK ANNUAL REPORT 2015
3.1 CO2 EMISSIONS (CONTINUED)CO2 EMISSIONS IN 1,000 TONS 2015 2014 2013
– Diabetes and obesity care 88 94 96– Biopharmaceuticals 6 10 11– Not allocated1 13 16 18CO2 emissions from energy consumption 107 120 125CO2 emissions from transport 43 57 59
Total CO2 emissions 150 177 184
1. Not allocated consists of consumption that cannot be directly linked to the production of either Diabetes and obesity care or Biopharmaceuticals, ie offi ce buildings and research activities.
CO2 emissions from energy consumption decreased by 11% in 2015 despite increased energy consumption. The decrease is a result of the continued priority of increasing the share of renewable energy. In 2015, the fi lling plant in Tianjin, China, started to source renewable energy certifi cates from a windfarm, and about one-third of the natural gas in Denmark was replaced by bio-natural gas. This is biogas upgraded to the quality of natural gas.
CO2 emissions from transport (product distribution) decreased signifi cantly, by 25%, compared with 2014. This is mainly due to an increase in the volume of products being distributed via sea from 72% in 2014 to 83% in 2015. In 2015, CO2 emissions from sea freight accounted for 16%, transport via trucks 5% and air transport 79% of total emissions. Distributing as many products as possible by sea is a priority for Novo Nordisk, as it reduces both CO2 emissions and costs.
3.2 ORGANIC RESIDUESAccounting policies
Organic residues consist of recycled biomass and ethanol from the production of the active ingredients. The biomass is measured in m3 and converted to tons. The amount of ethanol is calculated based on volume and concentration and then converted to tons. The residues are primarily used in biogas plants where energy is recovered. The biomass is used as fertilizers on local farmland after the biogas production.
ORGANIC RESIDUES (TONS) 2015 2014 2013
Biomass 113,453 101,729 104,324Ethanol 10,596 8,366 5,904
Total organic residues 124,049 110,095 110,228
Biomass increased by 12% and recycled ethanol by 27% in 2015 compared with 2014 due to increased production activities in the Diabetes and obesity care business. The relatively high increase in recyclable ethanol is due to less internal re-use following start-up of new production lines and challenges with impurities.
104 CONSOLIDATED ENVIRONMENTAL STATEMENT Supplementary information
3.3 WASTEAccounting policies
Waste is measured as the sum of non-hazardous and hazardous waste disposed of based on weight receipts.
Non-hazardous waste (ratio) is calculated as a percentage of the total amount of waste disposed of.
TONS OF WASTE 2015 2014 2013
Non-hazardous waste 14,500 15,492 12,813Hazardous waste 20,215 15,228 7,574
Total waste 34,715 30,720 20,387
Non-hazardous waste (ratio) 42% 50% 63%
WASTERecycling Incineration with energy recovery Incineration without energy recovery Special treatment Landfilling
2015201420130
20
40
60
80
100
%
Waste increased by 13% from 2014 to 2015, primarily due to increased production of diabetes and obesity care products, which led to a 33% increase in the amount of hazardous waste of which the majority was non-recyclable ethanol. This ethanol is disposed of in special incineration plants with energy recovery. Non-hazardous waste decreased by 6% which was mainly due to re-classifi cation of urea from waste to fertilizer.
3.4 BREACHES OF REGULATORY LIMIT VALUES
Accounting policiesBreaches of regulatory limit values covers all breaches reported to the environmental authorities.
DevelopmentBreaches of regulatory limit values increased from 9 in 2014 to 28 in 2015. All breaches have been reported to the authorities. 24 breaches are related to wastewater with only minor impact on the environment. The large increase is due to a change of cleaning agent at one fi lling plant. This change was a requirement from the local authorities and corrective actions are being taken.
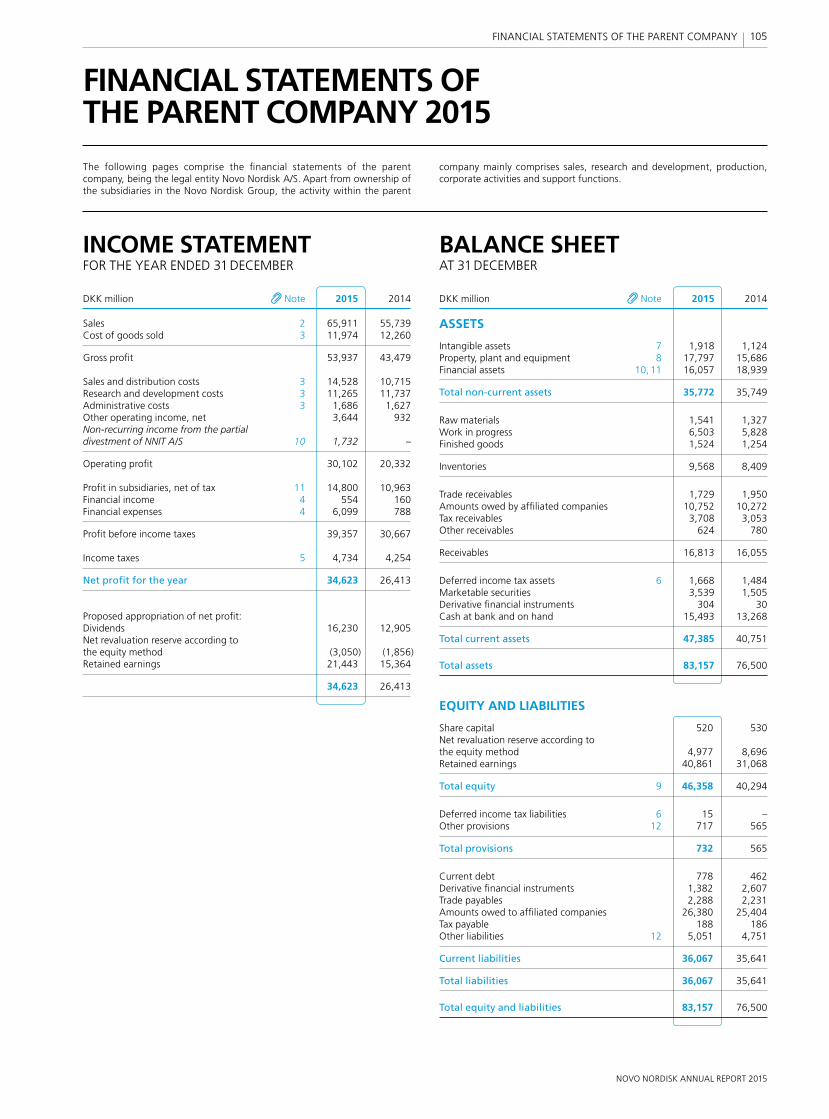
NOVO NORDISK ANNUAL REPORT 2015
105 FINANCIAL STATEMENTS OF THE PARENT COMPANY
INCOME STATEMENTFOR THE YEAR ENDED 31 DECEMBER
BALANCE SHEETAT 31 DECEMBER
FINANCIAL STATEMENTS OFTHE PARENT COMPANY 2015
The following pages comprise the fi nancial statements of the parent company, being the legal entity Novo Nordisk A/S. Apart from ownership of the subsidiaries in the Novo Nordisk Group, the activity within the parent
company mainly comprises sales, research and development, production, corporate activities and support functions.
DKK million Note 2015 2014
Sales 2 65,911 55,739Cost of goods sold 3 11,974 12,260
Gross profi t 53,937 43,479
Sales and distribution costs 3 14,528 10,715Research and development costs 3 11,265 11,737Administrative costs 3 1,686 1,627Other operating income, net 3,644 932Non-recurring income from the partial divestment of NNIT A/S 10 1,732 –
Operating profi t 30,102 20,332
Profi t in subsidiaries, net of tax 11 14,800 10,963Financial income 4 554 160Financial expenses 4 6,099 788
Profi t before income taxes 39,357 30,667
Income taxes 5 4,734 4,254
Net profi t for the year 34,623 26,413
Proposed appropriation of net profi t:Dividends 16,230 12,905Net revaluation reserve according to the equity method (3,050) (1,856)Retained earnings 21,443 15,364
34,623 26,413
DKK million Note 2015 2014
ASSETS
Intangible assets 7 1,918 1,124Property, plant and equipment 8 17,797 15,686Financial assets 10, 11 16,057 18,939
Total non-current assets 35,772 35,749
Raw materials 1,541 1,327Work in progress 6,503 5,828Finished goods 1,524 1,254
Inventories 9,568 8,409
Trade receivables 1,729 1,950Amounts owed by affi liated companies 10,752 10,272Tax receivables 3,708 3,053Other receivables 624 780
Receivables 16,813 16,055
Deferred income tax assets 6 1,668 1,484Marketable securities 3,539 1,505Derivative fi nancial instruments 304 30Cash at bank and on hand 15,493 13,268
Total current assets 47,385 40,751
Total assets 83,157 76,500
EQUITY AND LIABILITIES
Share capital 520 530Net revaluation reserve according to the equity method 4,977 8,696Retained earnings 40,861 31,068
Total equity 9 46,358 40,294
Deferred income tax liabilities 6 15 –Other provisions 12 717 565
Total provisions 732 565
Current debt 778 462Derivative fi nancial instruments 1,382 2,607Trade payables 2,288 2,231Amounts owed to affi liated companies 26,380 25,404Tax payable 188 186Other liabilities 12 5,051 4,751
Current liabilities 36,067 35,641
Total liabilities 36,067 35,641
Total equity and liabilities 83,157 76,500
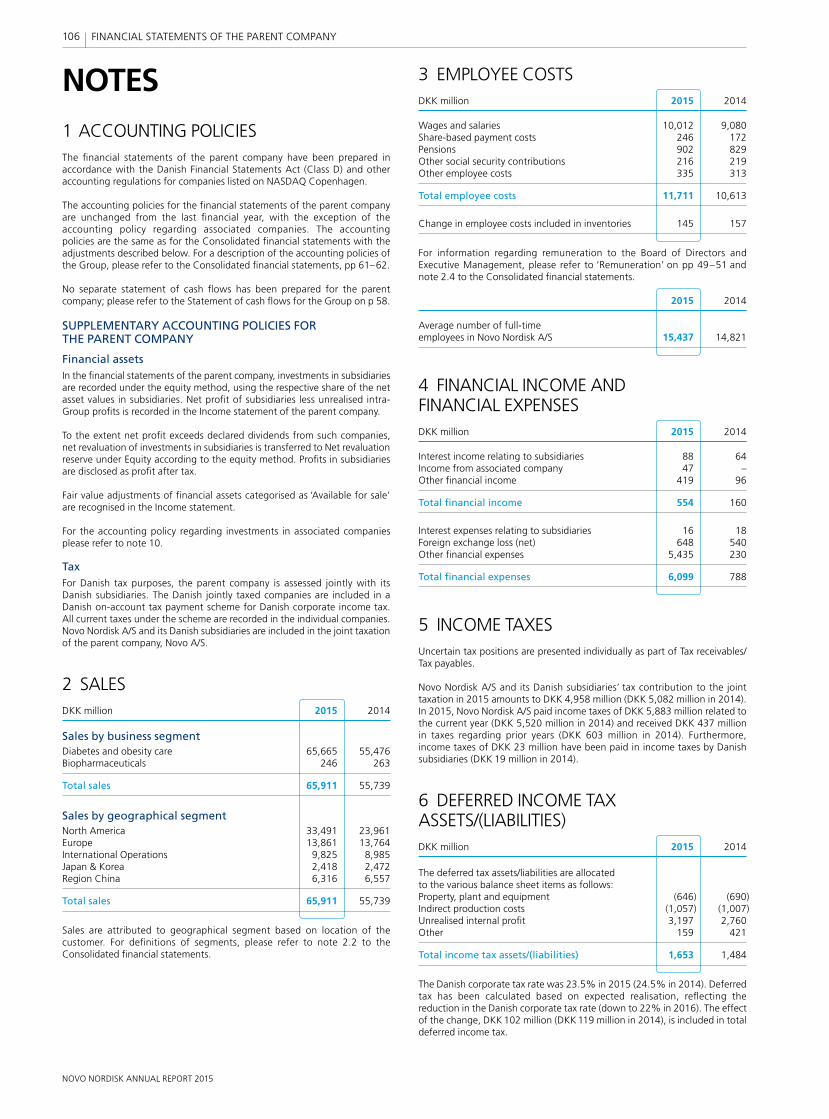
NOVO NORDISK ANNUAL REPORT 2015
NOTES
106 FINANCIAL STATEMENTS OF THE PARENT COMPANY
3 EMPLOYEE COSTSDKK million 2015 2014
Wages and salaries 10,012 9,080Share-based payment costs 246 172Pensions 902 829Other social security contributions 216 219Other employee costs 335 313
Total employee costs 11,711 10,613
Change in employee costs included in inventories 145 157
For information regarding remuneration to the Board of Directors and Executive Management, please refer to ‘Remuneration’ on pp 49–51 and note 2.4 to the Consolidated fi nancial statements.
2015 2014
Average number of full-time employees in Novo Nordisk A/S 15,437 14,821
4 FINANCIAL INCOME AND FINANCIAL EXPENSESDKK million 2015 2014
Interest income relating to subsidiaries 88 64Income from associated company 47 –Other fi nancial income 419 96
Total fi nancial income 554 160
Interest expenses relating to subsidiaries 16 18Foreign exchange loss (net) 648 540Other fi nancial expenses 5,435 230
Total fi nancial expenses 6,099 788
5 INCOME TAXESUncertain tax positions are presented individually as part of Tax receivables/Tax payables.
Novo Nordisk A/S and its Danish subsidiaries’ tax contribution to the joint taxation in 2015 amounts to DKK 4,958 million (DKK 5,082 million in 2014). In 2015, Novo Nordisk A/S paid income taxes of DKK 5,883 million related to the current year (DKK 5,520 million in 2014) and received DKK 437 million in taxes regarding prior years (DKK 603 million in 2014). Furthermore, income taxes of DKK 23 million have been paid in income taxes by Danish subsidiaries (DKK 19 million in 2014).
6 DEFERRED INCOME TAX ASSETS/(LIABILITIES)DKK million 2015 2014
The deferred tax assets/liabilities are allocated to the various balance sheet items as follows:Property, plant and equipment (646) (690)Indirect production costs (1,057) (1,007)Unrealised internal profi t 3,197 2,760Other 159 421
Total income tax assets/(liabilities) 1,653 1,484
The Danish corporate tax rate was 23.5% in 2015 (24.5% in 2014). Deferred tax has been calculated based on expected realisation, refl ecting the reduction in the Danish corporate tax rate (down to 22% in 2016). The effect of the change, DKK 102 million (DKK 119 million in 2014), is included in total deferred income tax.
1 ACCOUNTING POLICIESThe fi nancial statements of the parent company have been prepared in accordance with the Danish Financial Statements Act (Class D) and other accounting regulations for companies listed on NASDAQ Copenhagen.
The accounting policies for the fi nancial statements of the parent company are unchanged from the last fi nancial year, with the exception of the accounting policy regarding associated companies. The accounting policies are the same as for the Consolidated fi nancial statements with the adjustments described below. For a description of the accounting policies of the Group, please refer to the Consolidated fi nancial statements, pp 61–62.
No separate statement of cash fl ows has been prepared for the parent company; please refer to the Statement of cash fl ows for the Group on p 58.
SUPPLEMENTARY ACCOUNTING POLICIES FOR THE PARENT COMPANY
Financial assetsIn the fi nancial statements of the parent company, investments in subsidiaries are recorded under the equity method, using the respective share of the net asset values in subsidiaries. Net profi t of subsidiaries less unrealised intra-Group profi ts is recorded in the Income statement of the parent company.
To the extent net profi t exceeds declared dividends from such companies, net revaluation of investments in subsidiaries is transferred to Net revaluation reserve under Equity according to the equity method. Profi ts in subsidiaries are disclosed as profi t after tax.
Fair value adjustments of fi nancial assets categorised as ‘Available for sale’ are recognised in the Income statement.
For the accounting policy regarding investments in associated companies please refer to note 10.
TaxFor Danish tax purposes, the parent company is assessed jointly with its Danish subsidiaries. The Danish jointly taxed companies are included in a Danish on-account tax payment scheme for Danish corporate income tax. All current taxes under the scheme are recorded in the individual companies. Novo Nordisk A/S and its Danish subsidiaries are included in the joint taxation of the parent company, Novo A/S.
2 SALESDKK million 2015 2014
Sales by business segmentDiabetes and obesity care 65,665 55,476Biopharmaceuticals 246 263
Total sales 65,911 55,739
Sales by geographical segmentNorth America 33,491 23,961Europe 13,861 13,764International Operations 9,825 8,985Japan & Korea 2,418 2,472Region China 6,316 6,557
Total sales 65,911 55,739
Sales are attributed to geographical segment based on location of the customer. For defi nitions of segments, please refer to note 2.2 to the Consolidated fi nancial statements.
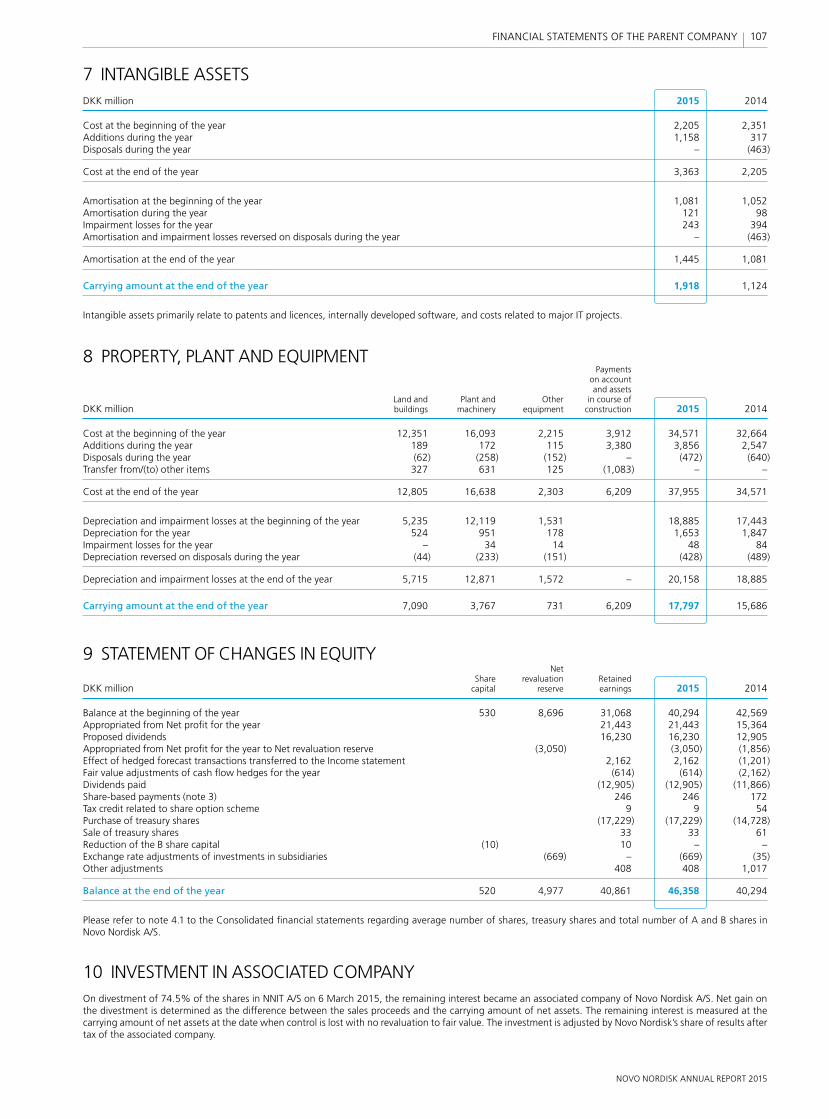
NOVO NORDISK ANNUAL REPORT 2015
107 FINANCIAL STATEMENTS OF THE PARENT COMPANY
7 INTANGIBLE ASSETSDKK million 2015 2014
Cost at the beginning of the year 2,205 2,351Additions during the year 1,158 317Disposals during the year – (463)
Cost at the end of the year 3,363 2,205
Amortisation at the beginning of the year 1,081 1,052Amortisation during the year 121 98Impairment losses for the year 243 394Amortisation and impairment losses reversed on disposals during the year – (463)
Amortisation at the end of the year 1,445 1,081
Carrying amount at the end of the year 1,918 1,124
Intangible assets primarily relate to patents and licences, internally developed software, and costs related to major IT projects.
8 PROPERTY, PLANT AND EQUIPMENT Payments on account and assets Land and Plant and Other in course of DKK million buildings machinery equipment construction 2015 2014
Cost at the beginning of the year 12,351 16,093 2,215 3,912 34,571 32,664Additions during the year 189 172 115 3,380 3,856 2,547Disposals during the year (62) (258) (152) – (472) (640)Transfer from/(to) other items 327 631 125 (1,083) – –
Cost at the end of the year 12,805 16,638 2,303 6,209 37,955 34,571
Depreciation and impairment losses at the beginning of the year 5,235 12,119 1,531 18,885 17,443Depreciation for the year 524 951 178 1,653 1,847Impairment losses for the year – 34 14 48 84Depreciation reversed on disposals during the year (44) (233) (151) (428) (489)
Depreciation and impairment losses at the end of the year 5,715 12,871 1,572 – 20,158 18,885
Carrying amount at the end of the year 7,090 3,767 731 6,209 17,797 15,686
9 STATEMENT OF CHANGES IN EQUITY Net Share revaluation Retained DKK million capital reserve earnings 2015 2014
Balance at the beginning of the year 530 8,696 31,068 40,294 42,569Appropriated from Net profi t for the year 21,443 21,443 15,364Proposed dividends 16,230 16,230 12,905Appropriated from Net profi t for the year to Net revaluation reserve (3,050) (3,050) (1,856)Effect of hedged forecast transactions transferred to the Income statement 2,162 2,162 (1,201)Fair value adjustments of cash fl ow hedges for the year (614) (614) (2,162)Dividends paid (12,905) (12,905) (11,866)Share-based payments (note 3) 246 246 172Tax credit related to share option scheme 9 9 54Purchase of treasury shares (17,229) (17,229) (14,728)Sale of treasury shares 33 33 61Reduction of the B share capital (10) 10 – –Exchange rate adjustments of investments in subsidiaries (669) – (669) (35)Other adjustments 408 408 1,017
Balance at the end of the year 520 4,977 40,861 46,358 40,294
Please refer to note 4.1 to the Consolidated fi nancial statements regarding average number of shares, treasury shares and total number of A and B shares in Novo Nordisk A/S.
10 INVESTMENT IN ASSOCIATED COMPANYOn divestment of 74.5% of the shares in NNIT A/S on 6 March 2015, the remaining interest became an associated company of Novo Nordisk A/S. Net gain on the divestment is determined as the difference between the sales proceeds and the carrying amount of net assets. The remaining interest is measured at the carrying amount of net assets at the date when control is lost with no revaluation to fair value. The investment is adjusted by Novo Nordisk’s share of results after tax of the associated company.
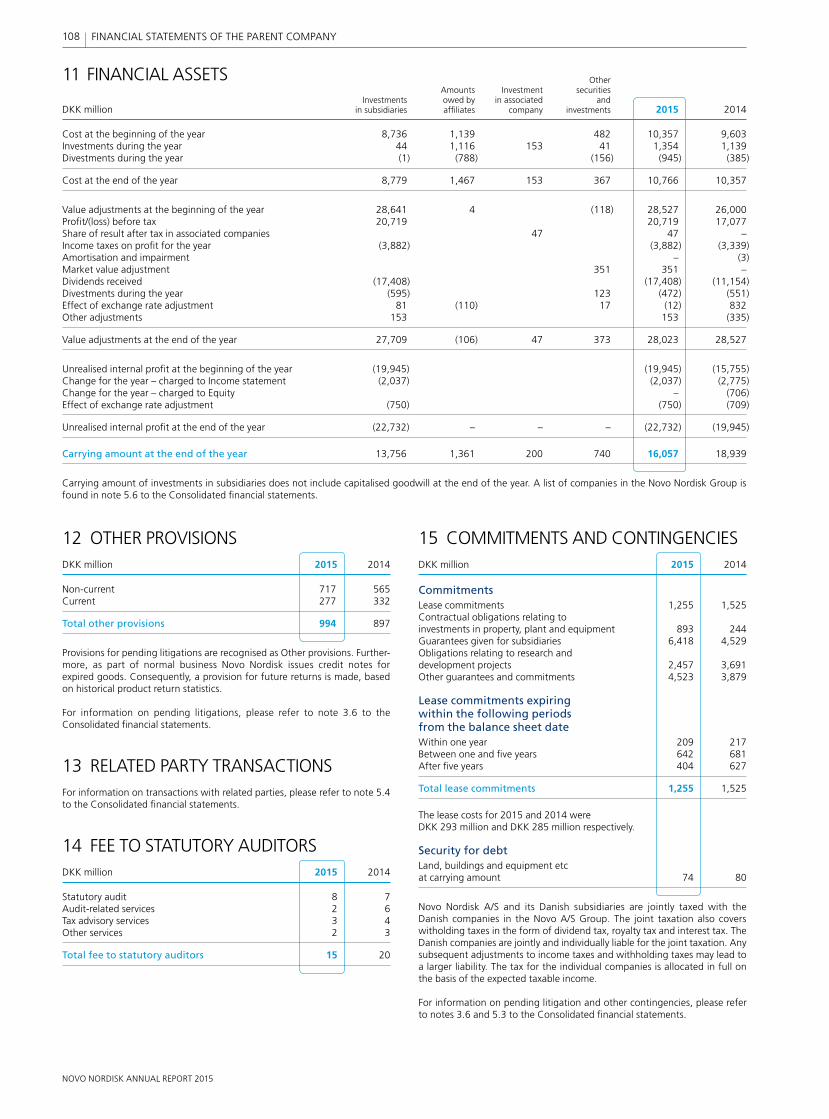
NOVO NORDISK ANNUAL REPORT 2015
108 FINANCIAL STATEMENTS OF THE PARENT COMPANY
15 COMMITMENTS AND CONTINGENCIESDKK million 2015 2014
CommitmentsLease commitments 1,255 1,525Contractual obligations relating to investments in property, plant and equipment 893 244Guarantees given for subsidiaries 6,418 4,529Obligations relating to research and development projects 2,457 3,691Other guarantees and commitments 4,523 3,879
Lease commitments expiring within the following periods from the balance sheet dateWithin one year 209 217Between one and fi ve years 642 681After fi ve years 404 627
Total lease commitments 1,255 1,525
The lease costs for 2015 and 2014 were DKK 293 million and DKK 285 million respectively.
Security for debtLand, buildings and equipment etc at carrying amount 74 80
Novo Nordisk A/S and its Danish subsidiaries are jointly taxed with the Danish companies in the Novo A/S Group. The joint taxation also covers wit holding taxes in the form of dividend tax, royalty tax and interest tax. The Danish companies are jointly and individually liable for the joint taxation. Any subsequent adjustments to income taxes and withholding taxes may lead to a larger liability. The tax for the individual companies is allocated in full on the basis of the expected taxable income.
For information on pending litigation and other contingencies, please refer to notes 3.6 and 5.3 to the Consolidated fi nancial statements.
12 OTHER PROVISIONSDKK million 2015 2014
Non-current 717 565Current 277 332
Total other provisions 994 897
Provisions for pending litigations are recognised as Other provisions. Further-more, as part of normal business Novo Nordisk issues credit notes for expired goods. Consequently, a provision for future returns is made, based on historical product return statistics.
For information on pending litigations, please refer to note 3.6 to the Consolidated fi nancial statements.
13 RELATED PARTY TRANSACTIONSFor information on transactions with related parties, please refer to note 5.4 to the Consolidated fi nancial statements.
14 FEE TO STATUTORY AUDITORSDKK million 2015 2014
Statutory audit 8 7Audit-related services 2 6Tax advisory services 3 4Other services 2 3
Total fee to statutory auditors 15 20
11 FINANCIAL ASSETS Other Amounts Investment securities Investments owed by in associated and DKK million in subsidiaries affi liates company investments 2015 2014
Cost at the beginning of the year 8,736 1,139 482 10,357 9,603Investments during the year 44 1,116 153 41 1,354 1,139Divestments during the year (1) (788) (156) (945) (385)
Cost at the end of the year 8,779 1,467 153 367 10,766 10,357
Value adjustments at the beginning of the year 28,641 4 (118) 28,527 26,000Profi t/(loss) before tax 20,719 20,719 17,077Share of result after tax in associated companies 47 47 –Income taxes on profi t for the year (3,882) (3,882) (3,339)Amortisation and impairment – (3)Market value adjustment 351 351 –Dividends received (17,408) (17,408) (11,154)Divestments during the year (595) 123 (472) (551)Effect of exchange rate adjustment 81 (110) 17 (12) 832Other adjustments 153 153 (335)
Value adjustments at the end of the year 27,709 (106) 47 373 28,023 28,527
Unrealised internal profi t at the beginning of the year (19,945) (19,945) (15,755)Change for the year – charged to Income statement (2,037) (2,037) (2,775)Change for the year – charged to Equity – (706)Effect of exchange rate adjustment (750) (750) (709)
Unrealised internal profi t at the end of the year (22,732) – – – (22,732) (19,945)
Carrying amount at the end of the year 13,756 1,361 200 740 16,057 18,939
Carrying amount of investments in subsidiaries does not include capitalised goodwill at the end of the year. A list of companies in the Novo Nordisk Group is found in note 5.6 to the Consolidated fi nancial statements.
NOVO NORDISK ANNUAL REPORT 2015
Bagsværd, 2 February 2016
Executive Management Lars Rebien Sørensen Jesper Brandgaard Lars Fruergaard Jørgensen President and CEO CFO
Jakob Riis Mads Krogsgaard Thomsen
Board of Directors Göran Ando Jeppe Christiansen Bruno Angelici Chairman Vice chairman
Sylvie Grégoire Liz Hewitt Liselotte Hyveled
Thomas Paul Koestler Eivind Kolding Anne Marie Kverneland
Søren Thuesen Pedersen Stig Strøbæk Mary Szela
STATEMENT BY THE BOARD OF DIRECTORS AND EXECUTIVE MANAGEMENT ON THE ANNUAL REPORTToday, the Board of Directors and Executive Management approved the Annual Report of Novo Nordisk A/S for the year 2015.
The Consolidated fi nancial statements have been prepared in accordance with International Financial Reporting Standards as issued by the International Accounting Standards Board (IASB), and International Financial Reporting Standards as endorsed by the EU. The Financial statements of the parent company, Novo Nordisk A/S, have been prepared in accordance with the Danish Financial Statements Act.
Further, the Consolidated fi nancial statements, the Financial statements of the parent company and Management’s Review have been prepared in accordance with additional Danish disclosure requirements for listed companies.
In our opinion, the Consolidated fi nancial statements and the Financial statements of the parent company give a true and fair view of the
fi nancial position at 31 December 2015, the results of the Group’s and parent company’s operations, and consolidated cash fl ows for the fi nancial year 2015. Furthermore, in our opinion, Management’s Review includes a true and fair account of the development in the operations and fi nancial circumstances, of the results for the year, and of the fi nancial position of the Group and the parent company as well as a description of the most signifi cant risks and elements of uncertainty facing the Group and the parent company.
Novo Nordisk’s Consolidated social and environmental statements have been prepared in accordance with the reporting principles of materiality, inclusivity and responsiveness of AA1000APS(2008). They give a balanced and reasonable presentation of the organisation’s social and environmental performance.
We recommend that the Annual Report be adopted at the Annual General Meeting.
109Management statement CONSOLIDATED FINANCIAL STATEMENTS
NOVO NORDISK ANNUAL REPORT 2015
An audit involves performing procedures to obtain audit evidence about the amounts and disclosures in the Consolidated fi nancial statements and the Financial statements of the Parent Company. The procedures selected depend on the auditor’s judgement, including the assessment of the risks of material misstatement of the Consolidated fi nancial statements and the Financial statements of the Parent Company, whether due to fraud or error. In making those risk assessments, the auditor considers internal control relevant to the Company’s preparation of Consolidated fi nancial statements and Financial statements of the Parent Company that give a true and fair view in order to design audit procedures that are appropriate in the circumstances. An audit also includes evaluating the appropriateness of accounting policies used and the reasonableness of accounting estimates made by the Management, as well as evaluating the overall presentation of the Consolidated fi nancial statements and the Financial statements of the Parent Company.
We believe that the audit evidence we have obtained is suffi cient and appropriate to provide a basis for our audit opinion.
Our audit has not resulted in any qualifi cation.
OpinionIn our opinion, the Consolidated fi nancial statements give a true and fair view of the fi nancial position at 31 December 2015 of the Group and of the results of the Group’s operations and consolidated cash fl ows for the fi nancial year 2015 in accordance with International Financial Reporting Standards as issued by the International Accounting Standards Board, and International Financial Reporting Standards as endorsed by the EU and additional Danish disclosure requirements for listed companies. Moreover, in our opinion the Financial statements of the Parent Company give a true and fair view of the fi nancial position at 31 December 2015 and of the results of the Parent Company’s operations for the fi nancial year 2015 in accordance with the Danish Financial Statements Act and additional Danish disclosure requirements for listed companies.
STATEMENT ON MANAGEMENT’S REVIEW
We have read Management’s Review, pp 1–54 and p 95 in accordance with the Danish Financial Statements Act.
On this basis, it is our opinion that the information provided in the Manage-ment’s Review is consistent with the Consolidated fi nancial statements and the Financial statements of the Parent Company.
Bagsværd, 2 February 2016
PricewaterhouseCoopersStatsautoriseret Revisionspartnerselskab (CVR no 3377 1231)
Torben Jensen State Authorised Public Accountant
To the Shareholders of Novo Nordisk A/S
REPORT ON CONSOLIDATED FINANCIAL STATEMENTS AND FINANCIAL STATEMENTS OF THE PARENT COMPANY
We have audited the Consolidated fi nancial statements and the Financial statements of Novo Nordisk A/S for the fi nancial year 2015, pp 55–94 and pp 105–108, which comprise Income Statement, Balance Sheet, Statement of Changes in Equity and Notes including accounting policies for the Group as well as for the Parent Company and Statement of Comprehensive Income and Cash Flow Statement for the Group.
The Consolidated fi nancial statements are prepared in accordance with International Financial Reporting Standards as issued by the International Accounting Standards Board, and International Financial Reporting Standards as endorsed by the EU. The Financial statements of the Parent Company are prepared in accordance with the Danish Financial Statements Act. Moreover, both the Consolidated fi nancial statements and the Financial statements of the Parent Company are prepared in accordance with additional Danish disclosure requirements for listed companies.
Management’s Responsibility for the Consolidated fi nancial statements and the Financial statements of the Parent Company The Management is responsible for the preparation of the Consolidated fi nancial statements and the Financial statements of the Parent Company that give a true and fair view in accordance with the above legislation and accounting standards, and for such internal control as Management determines is necessary to enable preparation of Consolidated fi nancial statements and Financial statements of the Parent Company that are free from material misstatement, whether due to fraud or error.
Auditor’s ResponsibilityOur responsibility is to express an opinion on the Consolidated fi nancial statements and the Financial statements of the Parent Company based on our audit. We conducted our audit in accordance with International standards on Auditing and additional requirements under Danish Audit regulation. This requires that we comply with ethical requirements and plan and perform the audit to obtain reasonable assurance about whether the Consolidated fi nancial statements and the Financial statements of the Parent Company are free from material misstatement.
INDEPENDENT AUDITOR’S REPORTS
110 INDEPENDENT AUDITOR’S REPORT

NOVO NORDISK ANNUAL REPORT 2015
INDEPENDENT LIMITED ASSURANCE REPORT ON THE SOCIAL AND ENVIRONMENTAL REPORTING FOR 2015
111 INDEPENDENT ASSURANCE REPORT
Bagsværd, 2 February 2016
PricewaterhouseCoopersStatsautoriseret Revisionspartnerselskab (CVR no 3377 1231)
Torben JensenState Authorised Public Accountant
To the Stakeholders of Novo Nordisk A/S
We have undertaken a limited assurance engagement of the consolidated social and environmental information of the Annual Report (the report) of Novo Nordisk A/S for 2015 which comprises Management’s Review and the Consolidated social and environmental statements on pp 1–54 and 96–104. The assurance engagement has also covered the nature and extent of Novo Nordisk’s adherence to the AA1000 AccountAbility Principles Standard (AA1000APS (2008)) principles (inclusivity, materiality and responsiveness) with respect to stakeholder dialogue.
Novo Nordisk’s responsibility for the consolidated social and environmental informationNovo Nordisk’s management is responsible for adherence to the AA1000AS (2008) Standard, preparation of the consolidated social and environmental information (the information) in accordance with the accounting policies described on pages 97–104 and the Novo Nordisk approach towards adherence to AA1000APS (2008). This responsibility includes design, implementation and maintenance of internal controls relevant to ensure that data are free from material misstatement, whether due to fraud or error.
Our independence and quality controlWe have complied with the Code of Ethics for Professional Accountants issued by the International Ethics Standards Board for Accountants, which includes independence and other ethical requirements founded on fundamental principles of integrity, objectivity, professional competence and due care, confi dentiality and professional behavior. We also qualify as independent as defined by the AA1000 Assurance Standard (AA1000AS(2008)). The fi rm applies International Standard on Quality Control 1 and accordingly maintains a comprehensive system of quality control including documented policies and procedures regarding compliance with ethical requirements, professional standards and applicable legal and regulatory requirements. Our work was carried out by an independent multidisciplinary team with experience in sustainability reporting and assurance.
Our responsibilityOur responsibility is to express a limited assurance conclusion on the information in the report based on the procedures we have performed and the evidence we have obtained. Furthermore, our responsibility is, by applying the AA1000AS (2008), to express a moderate assurance conclusion and make recommendations for the nature and extent of Novo Nordisk’s adherence to the AA1000APS (2008) principles.
We conducted our limited assurance engagement in accordance with International Standard on Assurance Engagements 3000, ‘Assurance Engagements other than Audits or Reviews of Historical Financial Information’, issued by the International Auditing and Assurance Standards Board. ISAE 3000 requires that we plan and perform this engagement to obtain limited assurance about whether the information are free from material misstatement.
A limited assurance engagement undertaken in accordance with ISAE 3000 involves assessing the suitability of Novo Nordisk’s use of stated accounting policies as the basis for the preparation of the information. Furthermore, it involves assessing the risks of material misstatement of the information whether due to fraud or error, responding to the assessed risks as necessary in the circumstances, and evaluating the overall presentation of the information. A limited assurance engagement is substantially less in scope than a reasonable assurance engagement in relation to both the risk assessment procedures, including an understanding of internal control, and the procedures performed in response to the assessed risks.
Moreover, we have planned our work based on the AA1000AS (2008) to perform a Type 2 engagement and to obtain moderate assurance regarding the nature and extent of Novo Nordisk’s adherence to the principles of inclusivity, materiality and responsiveness.
The procedures we performed were based on our professional judgment and included inquiries, observation of processes performed, inspection of documents, analytical procedures, evaluating the appropriateness of quantifi cation methods and reporting policies, and agreeing or reconciling with underlying records.
We conducted interviews with members of the Executive Management, Corporate Sustainability, Commercial Planning, Global Development, and Investor Relations. Also interviews with Management of the affi liate in Mexico and an external stakeholder regarding Novo Nordisk’s commitment and adherence to the principles of inclusivity, materiality and responsiveness and the existence of systems and procedures to support Novo Nordisk’s Triple Bottom Line governance and stakeholder relationships. Our work in particular focused on the Changing Diabetes program, Cities Changing Diabetes and the Novo Nordisk’s 40by20 goal.
The procedures performed in a limited assurance engagement vary in nature and timing from, and are less in extent than for, a reasonable assurance engagement. Consequently, the level of assurance obtained in a limited assurance engagement is substantially lower than the assurance that would have been obtained had we performed a reasonable assurance engage-ment. Accordingly, we do not express a reasonable assurance opinion about whether Novo Nordisk’s consolidated social and environmental information have been prepared, in all material respects, in accordance with the social and environmental accounting policies applied and stated on pages 97–104.
Limited assurance conclusionBased on the procedures we have performed and the evidence we have obtained, nothing has come to our attention that causes us to believe that the consolidated social and environmental information presented in Novo Nordisk’s 2015 annual report are not prepared, in all material respects, in accordance with the social and environmental accounting policies as stated on pages 97–104.
Furthermore, nothing has come to our attention causing us to believe that Novo Nordisk does not adhere to the AA1000APS (2008) principles.
Observations and recommendationsAccording to AA1000AS (2008), we are required to include observations and recommendations for improvements in relation to adherence to the AA1000APS (2008) principles. We have no signifi cant recommendations regarding inclusivity, materiality and responsiveness.
Regarding inclusivityNovo Nordisk continues to demonstrate a strong commitment to accountability with systems and processes in place to support stakeholder engagement around sustainability issues at corporate and affi liate levels. Stakeholder inclusivity is integrated across the business and in new initiatives. In 2015, Novo Nordisk has been highly engaged in the rollout of the Cities Changing Diabetes initiative which has included a formalised approach to stakeholder engagement and input.
Regarding materialityNovo Nordisk continues to discuss, evaluate and determine the materiality of sustainability issues on an ongoing basis through a number of relevant governance bodies and core business processes, involving senior manage-ment input from across the business. The Social and Environmental Committee with a direct responsibility for Executive Management further strengthens the Triple Bottom Line management within the business.
Regarding responsivenessNovo Nordisk’s commitment to being responsive to stakeholder needs and concerns is evident from Senior Management’s increasing engagement in dialogue, at both international and country level, on care and prevention of diabetes and other chronic diseases. In 2015, a stronger focus has been introduced in the Changing Diabetes program to better respond to patients needs and to further increase Novo Nordisk’s impact on ‘the rule of halves’.
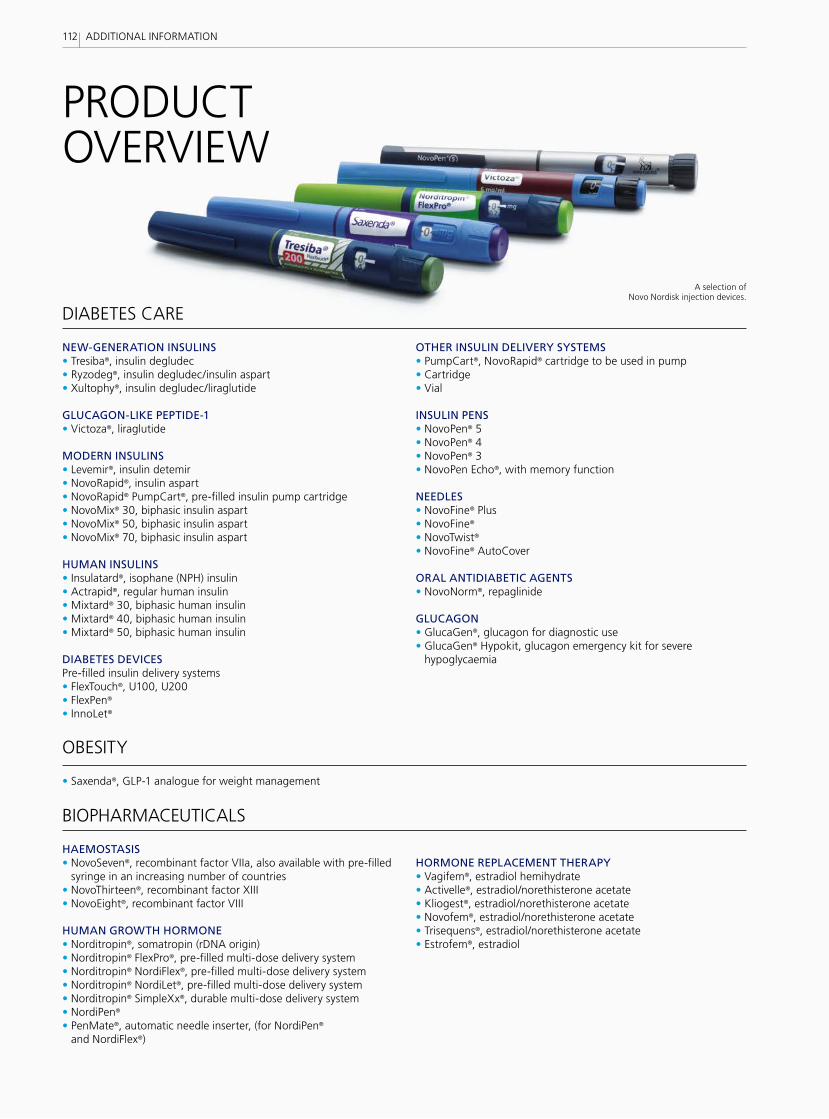
PRODUCTOVERVIEW
NEW-GENERATION INSULINS• Tresiba®, insulin degludec• Ryzodeg®, insulin degludec/insulin aspart• Xultophy®, insulin degludec/liraglutide
GLUCAGON-LIKE PEPTIDE-1• Victoza®, liraglutide
MODERN INSULINS• Levemir®, insulin detemir• NovoRapid®, insulin aspart• NovoRapid® PumpCart®, pre-filled insulin pump cartridge• NovoMix® 30, biphasic insulin aspart• NovoMix® 50, biphasic insulin aspart• NovoMix® 70, biphasic insulin aspart
HUMAN INSULINS• Insulatard®, isophane (NPH) insulin• Actrapid®, regular human insulin• Mixtard® 30, biphasic human insulin• Mixtard® 40, biphasic human insulin• Mixtard® 50, biphasic human insulin
DIABETES DEVICESPre-filled insulin delivery systems• FlexTouch®, U100, U200• FlexPen®
• InnoLet®
OTHER INSULIN DELIVERY SYSTEMS• PumpCart®, NovoRapid® cartridge to be used in pump• Cartridge• Vial
INSULIN PENS• NovoPen® 5• NovoPen® 4• NovoPen® 3 • NovoPen Echo®, with memory function
NEEDLES• NovoFine® Plus• NovoFine® • NovoTwist® • NovoFine® AutoCover ORAL ANTIDIABETIC AGENTS• NovoNorm®, repaglinide
GLUCAGON• GlucaGen®, glucagon for diagnostic use• GlucaGen® Hypokit, glucagon emergency kit for severe
hypoglycaemia
HAEMOSTASIS• NovoSeven®, recombinant factor VIIa, also available with pre-filled
syringe in an increasing number of countries• NovoThirteen®, recombinant factor XIII• NovoEight®, recombinant factor VIII
HUMAN GROWTH HORMONE• Norditropin®, somatropin (rDNA origin)• Norditropin® FlexPro®, pre-filled multi-dose delivery system• Norditropin® NordiFlex®, pre-filled multi-dose delivery system• Norditropin® NordiLet®, pre-filled multi-dose delivery system• Norditropin® SimpleXx®, durable multi-dose delivery system• NordiPen®
• PenMate®, automatic needle inserter, (for NordiPen® and NordiFlex®)
HORMONE REPLACEMENT THERAPY• Vagifem®, estradiol hemihydrate• Activelle®, estradiol/norethisterone acetate• Kliogest®, estradiol/norethisterone acetate• Novofem®, estradiol/norethisterone acetate• Trisequens®, estradiol/norethisterone acetate• Estrofem®, estradiol
• Saxenda®, GLP-1 analogue for weight management
DIABETES CARE
BIOPHARMACEUTICALS
OBESITY
A selection of Novo Nordisk injection devices.
112 ADDITIONAL INFORMATION
MORE INFORMATION AND REFERENCESFINANCIAL CALENDAR 2016
FOR MORE NEWS FROM NOVO NORDISK, VISITnovonordisk.com/investorsnovonordisk.com/pressnovonordisk.com/sustainability
FOLLOW NOVO NORDISK ON SOCIAL MEDIA
facebook.com/novonordisk
twitter.com/novonordisk
linkedin.com/company/novo-nordisk
pinterest.com/novonordisk
youtube.com/novonordisk
NEWS AND UPDATES
In addition to the Annual Report, Novo Nordisk provides disclosure in separate reports to satisfy specific legal requirements and stakeholder interests. Additional reports can be downloaded from novonordisk.com/annualreport.
FORM 20-FAnnual reporting requirement by the US Securities and Exchange Commission (SEC) for foreign private issuers with equity shares listed on exchanges in the United States. Form 20-F is filed using a stan-dardised reporting form so that investors can evaluate the company alongside US domestic equities.
CORPORATE GOVERNANCE REPORTRequirement according to the Danish Financial Statements Act. Reporting of compliance with Danish Corporate Governance Recom-mendations.
UNITED NATIONS GLOBAL COMPACTVoluntary Communication on Progress reporting in the form of the United Nations and its 10 principles in the areas of human rights, labour rights, environment and anti-corruption. As a LEAD member, Novo Nordisk provides additional progress reporting on corporate sustainability leadership and UN goals. This reporting also fulfils the requirements of the Danish Financial Statements Act, sections 99a and 99b, on policies and actions for corporate responsibility and progress against targets for diversity in management.
ADDITIONAL REPORTING
Market data on pp 16, 17, 36 and 37 are from IMS Health 2015. Market data on p 35 are from IMS Health – Market Prognosis Global, January 20 2016 (data on file for list of countries included in regions).
References: 1. International Diabetes Federation. IDF Diabetes Atlas, 7th edn. Brussels, Belgium: International Diabetes Federation 2015. 2. World Health Organization: Obesity and overweight. Fact sheet N° 311. World Health Organization, January 2015. 3. World Federation of Hemophilia. About Bleeding Disorders, Hemophilia. World Federation of Haemophilia, May 2012. 4. Efpia, European Federation of Pharmaceutical Industries and Associations. http://www.efpia.eu/diseases/68/59/Growth-Problems. 5. EvaluatePharma, January 2016. Data on file. 6. UK Prospective Diabetes Study (UKPDS) Group. UK prospective diabetes study VIII. Study design, progress and performance. Diabetologia 1991; 34:877–890. 7. Hart JT. Rule of Halves: implications of increasing diagnosis and reducing dropout for future workload and prescribing costs in primary care. Br J Gen Pract 1992; 42(356):116–119 and Smith WCS, Lee AJ, Crombie IK & Tunstall-Pedoe H. Control of blood pressure in Scotland: the rule of halves. BMJ 1990; 300:981–983. 8. International Diabetes Federation, idf.org/about-diabetes/risk-factors 9. Gray A, et al: Cost effectiveness of an intensive blood glucose control policy in patients with type 2 diabetes: economic analysis alongside randomised controlled trial (UKPDS 41). BMJ 2000; 320:1373–8. 10. Li R, et al: Cost-effectiveness of interventions to prevent and control diabetes mellitus: a systematic review. Diabetes Care 2010; 33:1872–94. 11. Gray A, Raikou M, McGuire A, et al. Cost-effectiveness of an intensive blood glucose control policy in patients with type 2 diabetes: economic analysis alongside randomised controlled trial (UKPDS 41). BMJ 2000; 320:1373–8. 12. Novo Nordisk A/S. Economic simulations based on the CORE diabetes model 2011. 13. American Diabetes Association. Approaches to Glycemic Treatment. Diabetes Care 2015; 38(Supplement 1):S41–S48. 14. McCullough AJ. Epidemiology of the metabolic syndrome in the USA. Journal of Digestive Diseases 2011; 12:333–340. 15. Ogden CL, Carroll MD, Kit BK & Flegal KM. Prevalence of Childhood and Adult Obesity in the United States 2011–2012. The Journal of the American Medical Association 2014; 311(8):806–814. 16. United Nations Department of Economic and Social Affairs. World Urbanization Prospects, The 2014 Revision, Highlights 2014. 17. Stonebraker JS, Bolton-Maggs PHB, Soucie JM, Walker I & Brooker M. A study of variations in the reported haemophilia A prevalence around the world. Haemophilia 2010; 16:20–32. 18. Stonebraker JS, Bolton-Maggs PHB, Michael Soucie JM, Walker I & Brooker M. A study of variations in the reported haemophilia B prevalence around the world. Haemophilia 2012; 18(3):e91–4.
Design and production: ADtomic Communications. Accounts and notes: Team2Graphics. Printing: Bording PRO as, February 2016. Photography: Rasmus Daniel Taun, Jesper Westley Jørgensen, Ulrik Jantzen, Ludmilla Aud Timsdottir, Martin Juul, Anders Bøggild, Jesper Edvardsen, Søren Svendsen, Jens Lindhe.
Annual general meeting
First three
months
Half year
First nine months
Full year
ANNOUNCEMENT OF FINANCIAL RESULTS
Ex-dividendRecord date
Payment, B shares
Payment, ADRs
DIVIDEND
18MARCH
2016
21MARCH
2016
29APRIL 2016
22MARCH
2016
05AUGUST
2016
23MARCH
2016
28OCTOBER
2016
30MARCH
2016
02FEBRUARY
2017
113
NOVO NORDISK ANNUAL REPORT 2015
ADDITIONAL INFORMATION

HeadquartersNovo Nordisk A/SNovo Allé2880 BagsværdDenmarkTel +45 4444 8888CVR number 24 25 67 90novonordisk.com
Investor ServiceEnquiries and feedback on the Annual Report should be addressed to:[email protected]
Shareholders’ enquiries concerning dividend payments and shareholder accounts should be addressed to:[email protected]
Aerial view of Shanghai, China. More than 23 million people live in Shanghai, which is one of the partner cities in the Cities
Changing Diabetes programme. It is estimated that 8.3% of the city’s population has type 2 diabetes. If action is not taken, this number is projected to grow to 15.5% by 2040. Read more
about Cities Changing Diabetes on page 30.
ADR holders’ enquiries concerning dividend payments, transfer of ADR certificates, consolidation of accounts and tracking of ADRs should be addressed to:
JP Morgan Chase Bank, N.A.PO Box 645044 New York Plaza, Floor 12New York, NY 1004Attention: Depositary Receipts GroupTel +1 800 990 1135Tel +1 651 453 2128 (From outside the United States)[email protected]