why crony capitalism is bad for economic growth crony capitalism is bad for economic growth u ......
TRANSCRIPT

1Anne O. Krueger
Why Crony Capitalism Is
Bad for Economic Growth
Until the Asian financial crisis of 1997, economists and policy-makers alike devoted much attention to analyzing the causes of therapid growth of the East Asian economies. Some viewed theirgrowth as a miracle; others (such as the World Bank) attributed itto high rates of capital accumulation.1 But regardless of the analyst’sconclusions, all wanted to learn the lessons of the East Asian suc-cesses in order that other countries might emulate them.
Since the crisis, those same economies are said to have had alarge number of failures of economic policy; it is even said that therewas no success story. Among the failures, a faulty banking systemand cronyism are widely regarded as most fundamental. In thischapter, I examine these conclusions. To do so, I do three things.First, I provide an analysis of cronyism and investigate how andwhy it might have such negative effects as are now alleged. Second,I consider the role of domestic credit expansion in enabling crony-ism and in contributing to the crisis. I then turn to the experience ofone East Asian country—South Korea—and provide a possible ex-planation as to how cronyism and the banking system might haveperformed so well for so long and then have led to the crisis of late
1. See World Bank, The East Asian Miracle (New York: Oxford University Press,1993).
Hoover Press : Haber DP5 HPCRON0100 01-06-:2 15:04:30 rev2 page 1
1997. The explanation may apply to other Asian success stories aswell—the reason for focusing on Korea is my own comparativeadvantage in being somewhat more familiar with that economy andeconomic policies than with the other Asian-crisis countries. Evenfor Korea, what is suggested is a plausible explanation, rather thana tested and proven hypothesis.
At the outset, however, it is necessary to define cronyism, thesubject under discussion. What is normally meant is that some ofthose close to the political authorities receive favors that have largeeconomic value. Usually, these favors are not outright transfers ofwealth (such as forgiving taxes or providing subsidies) but rathertake place through provision of economic entitlements. These enti-tlements can take a variety of forms, but the ones that are mostvisible in the Asian crisis and the ones under discussion here nor-mally entail ownership of a business or its operation. Ownershipmay come about when cronies are favored as state-owned enter-prises (SOEs) are privatized. More frequently, however, economicentitlements have arisen by enabling the cronies—or, more accu-rately, the establishments they operate, which I shall call crony-operated establishments (COEs)—to receive privileged access togovernmental favors that have economic value. It is a reasonableguess, although it would be hard to devise an empirical test, thatthe quantitatively most valuable favors received by COEs have beenprovision of monopoly or quasi-monopoly positions (often throughthe granting of import licenses only to COEs or the prohibition ofimports of import-competing goods) and the extension of domesticcredit at highly implicitly subsidized terms. A third form of crony-ism—favoritism in awarding government contracts—is no doubtalso important and may in some instances have been quantitativelyas significant as the first two forms mentioned above.
Hoover Press : Haber DP5 HPCRON0100 01-06-:2 15:04:30 rev2 page 2
2 ANNE O. KRUEGER

Cronyism and Its Effects
Until the Asian crisis, it was widely recognized that SOEs wereharmful and negatively affected economic growth prospects in mostdeveloping countries. In what follows, I shall argue that SOEs arealmost exactly the same in their effects as cronyism and for muchthe same reasons: in both instances, the enterprises owe their exis-tence not to their performance in a competitive market but to thenonmarket criteria by which they were established and are run.There are, of course, differences: the costs of SOEs are probablymore transparent as they are normally financed out of the budget,whereas the costs of cronyism are more hidden in that profits arenot necessarily publicly recorded and the value of privileged posi-tions (monopolies, protective tariffs against imports of competinggoods, favored access to subsidized credit, etc.) can be difficult togauge; there may be a slight presumption that cronies are on aver-age somewhat more competent as managers and somewhat moremotivated to achieve profits and reduce costs. But, as I shall arguebelow, these are only mild presumptions, and there is undoubtedlya large random component in the performance of SOEs and ofCOEs.
Since there is much more analysis of SOE records than of COEs,in significant part because of the greater transparency noted above,it is useful to start by reviewing the ways in which SOEs are under-stood to be harmful to growth. It is then relatively straightforwardto consider how COEs are similar to SOEs.
In some countries, governments have established state-ownedenterprises in many lines of activity usually reserved to the privatesector in developed countries. SOEs have operated tourist hotels,produced textiles, apparel, and footwear, run steel mills, and beenin virtually every line of manufacturing, and most business service,activities. It is widely recognized that SOEs have been loss-makingin many countries and have become major fiscal drains. In Turkey,
Hoover Press : Haber DP5 HPCRON0100 01-06-:2 15:04:30 rev2 page 3
3Why Crony Capitalism Is Bad for Economic Growth

for example, SOE deficits had reached 5.8 percent of GDP by 1980,the year in which economic reform began.2 Governments that in-vested heavily in SOEs also attempted to control the private sectorby means such as requiring investment licenses, capacity licenses,3
and/or permits for transporting goods, requiring private sector firmsto train, provide housing and other goods and services for theirworkers, and by imposing price controls. These controls naturallyresulted in low rates of return on investment for the private sectorunless firms held monopoly positions, often sheltered by importrestrictions or prohibitions. Then, private rates of return on capitalreflected monopoly positions, not economic rates of return. Sincemuch control over firms was exercised by the authorities, it is rea-sonable to regard these highly regulated and controlled firms asstate-owned enterprises.
In the East Asian countries, however, private firms were gener-ally free to seek profits, and the real rate of return to private capitalseems to have (at least until the 1990s—see below) reflected aneconomic return on capital. Cronyism operated through othermechanisms. In some instances, cronyism resulted from the gov-ernment’s favoring large firms precisely because they were per-ceived to deliver economic growth. Over time, however, these firms,or more accurately their owners, grew sufficiently powerful thatthey held considerable influence with top government officials. Inmany instances, the mechanism for favoring those who were, orbecame, cronies was the issuance of bank credit.
When rapid economic growth began after policy reforms in theEast Asian countries, most had highly underdeveloped banking sys-tems and rapid rates of inflation. Ceilings were imposed on the
2. Organization for Economic Cooperation and Development, OECD EconomicSurveys: Turkey (Washington, D.C.: OECD Publications and Information Center,1991), p. 60.
3. Ridiculously enough, capacity licenses generally stipulate the maximumamount it is permissible to produce.
Hoover Press : Haber DP5 HPCRON0100 01-06-:2 15:04:30 rev2 page 4
4 ANNE O. KRUEGER

interest rates that banks might charge for lending (or pay to depos-itors), usually below inflation rates. Those who received loans fromthe banks at these controlled rates thus received implicit subsidiesfrom the government. In these countries, various mechanisms wereused by governments for directing credit. But regardless of how itwas done, the favored borrowers profited significantly.
I postpone until the final section an interpretation of how cro-nyism evolved over time and contributed to the East Asian crisis. Ifirst want to consider the mechanisms through which cronyismmight work in terms of a simple analytical framework.
Assume that the only factor of production is capital and thatgrowth occurs via the real rate of return on capital and the extent ofcapital formation (new investment).4 In this model, given the poolof investible funds, the real rate of return on capital determines thetotal increment in output:
DY � R DK � R I � RS
I start by taking S, or savings, as the increase in the capital stockand hence investment, I, as given.5 Except when explicitly stated
4. To make the model more realistic, one could add labor as a factor of pro-duction. If the population were growing, the real rate of return on capital would bedriven by the change in the capital-labor ratio as well as by the degree of imperfec-tion in the allocation of new investment. The complication would add little to thebasic analysis presented below, although a declining real rate of return on capitalcould reflect a rising capital output ratio as well as the sorts of phenomena discussedhere. This qualification is important for interpreting the East Asian experience andis addressed somewhat later in the section on cronyism in East Asia.
Also for simplicity, I assume that capital does not depreciate. Amendments tothe model to account for depreciation would not change the results substantively,and the existence of depreciation can readily be taken into account in applications,as can be seen in the section on cronyism in East Asia.
5. In reality, there were sizable capital inflows in most of the East Asian econ-omies that augmented domestic savings. When these flows were in forms that wentthrough the banking system and were monetized, they accentuated the problemsdiscussed below. When, instead, they were direct investments (offset by imports ofmachinery and equipment), their effect would have been just the same as an increase
Hoover Press : Haber DP5 HPCRON0100 01-06-:2 15:04:30 rev2 page 5
5Why Crony Capitalism Is Bad for Economic Growth

otherwise, it will be assumed that the total level of investmentequals domestic savings and is exogenous. I focus on R, the real rateof return on capital. The aggregate real rate of return is itself aweighted average of the rates of return on individual investmentstimes the share of those investments in total investments:
R � sum ( RI � FI ),
where RI is the real rate of return to capital in economic activity Iand FI is the fraction of investment directed toward activity I.
In a perfectly competitive textbook economy, of course, the rateof return on each investment is equal and an efficient allocation ofresources—in this case investment—results. Over time, the real rateof return on investment might fall if the capital-labor ratio rose andthere were diminishing returns to capital. But diminishing returnsto capital are less likely to occur at any significant speed in smallopen economies, where world demand for their tradable goods ishighly elastic,6 than they would be in a closed economy, where theprice of the outputs of labor-intensive goods would start decliningas output expanded.
Now consider a two-sector economy in which investments aremade. One sector is public: it includes SOEs and highly regulated,privately owned firms (presumably in import-substitution activi-ties).7 The other is an economically efficient private sector (produc-ing exportables, unprotected import-competing goods, and homegoods in competitive activities that respond to appropriate relative
in total savings and an equal increase in private-sector investment. For that reason,little is gained by explicitly considering capital flows in the model.
6. For a model demonstrating this high elasticity, see Jaume Ventura, “Growthand Interdependence,” Quarterly Journal of Economics 107, no. 1 (February 1997):57–84.
7. In the real world, these activities often include banking services, insurance,and other finance, as foreign firms are often ineligible to participate. In someinstances, these activities are run by SOEs.
Hoover Press : Haber DP5 HPCRON0100 01-06-:2 15:04:30 rev2 page 6
6 ANNE O. KRUEGER

prices of inputs and outputs (i.e., world prices for outputs and mar-ket-determined factor prices that reasonably reflect opportunitycost). Then assume an allocation mechanism for investment be-tween the efficient private sector, with a rate of return of RP acrossinvestments, and state-owned enterprises, with a rate of return RS.By construction, RS is less than RP and may be negative. Then therate of return on total investment will be
R � FP � RP � (1 � FP) � RS,
where R is the economywide rate of return on investment and FP isthe fraction of investment going to the public sector.
The growth rate for the economy will be
GY � R � I/K � R � S/K,
where S is the economy’s aggregate savings and equals the econo-my’s aggregate investment, I.
Clearly, the rate of growth will be lower than attainable, and itwill be lower by more, the greater the fraction of investment allo-cated to the state-owned enterprises and the larger the differentialbetween the private and the public sector’s rate of return. In manydeveloping countries, state-owned enterprises—not even countinghighly regulated private firms—accounted for as much as 50 percentof all savings and rates of return were zero or lower, while rates ofreturn on private economic activity were arguably on the order of10 percent or higher. The economywide rate of return in those caseswould have been about 5 percent, whereas the attainable rate wouldhave been 10 percent (had there been little or no diminishing re-turns to private investment).8 If the savings rate was 20 percent, lost
8. Reality is more complicated in several ways. Important among them is theconsideration that some public investment is directed toward infrastructure. Thatpart is almost certainly complementary to private sector investment. For purposesof the model used here, such infrastructure investment can be regarded as part ofprivate investment.
Hoover Press : Haber DP5 HPCRON0100 01-06-:2 15:04:30 rev2 page 7
7Why Crony Capitalism Is Bad for Economic Growth

real growth of GDP would be 1 percent per annum on these num-bers. In more extreme cases of SOE losses at a rate of 5 percent ofcapital, a 25 percent savings rate, and a 15 percent rate of return onprivate investment with half of all investment allocated to SOEs, thegrowth forgone equals the difference between the 3.75 percent in-crement of GDP that would occur if all savings were allocated toprivate investment and the 1.25 percent growth that would actuallytake place—a 2.5 percentage point reduction in the rate of growthof GDP.9
This model can be complicated in a number of ways: The do-mestic savings rate could be an increasing function of the overallreturn on investment, in which case the savings rate would increaseas the fraction of investment going to the private sector increased.10
In the extreme case given above, if the domestic savings rate fellfrom 30 percent when the real rate of return was 15 percent to 20percent when the real rate of return averaged 5 percent, the result-ing drop in the growth rate from capital accumulation would befrom an attainable 4.5 percent to 1.0 percent, with half of invest-ment allocated to the SOEs.
One could also make savings a function of disposable incomeand model the government budgetary process as one in which taxes
9. These illustrative estimates are based on recorded orders of magnitude; ifone followed the model, one would first estimate the fraction of private enterprisethat was heavily regulated and controlled and combine that investment with thatof SOEs and return on capital to attain a more accurate number. It will be seenbelow that the estimated rates of return in Korea are considerably higher than eventhese numbers suggest for the private sector during the years of rapid growth.
10. In Korea, the savings rate rose steadily after 1960 as the rate of growth ofincome and the real return to savers rose. It is possible, of course, that the substi-tution effect toward more savings could be outweighed by the income effect andthat savings might fall. For present purposes, however, that does not seem relevantin light of the East Asian experience and the dramatic increases in savings rates thattook place (whether because of high marginal propensities to save out of higherincomes or because of a strong response to high real returns).
Hoover Press : Haber DP5 HPCRON0100 01-06-:2 15:04:30 rev2 page 8
8 ANNE O. KRUEGER

were increased to cover SOE losses or the take of cronies, to antici-pate an argument below.
One could also model a country in which politicians took as agoal that a specified target percentage of output should originate inpublic sector enterprises, in which case alpha s would be rising overtime as the return on private investment threatened to increase therelative size of the private sector; with the declining share of invest-ment in the private sector, the growth rate could drop even further.The state enterprises might experience a declining rate of return oninvestment over time, as politicians saddled enterprises with excessstaff, poor location, and other costs. As the rate of return turnednegative, growth would decelerate. If one combined the decliningrate of return on investment with the share of output target, theoverall rate of growth could decline over time and, if the real rate ofreturn on public sector enterprise investments turned negative,could indeed become negative.11
Since population growth rates are positive in developing coun-tries and high in many, labor force growth is also a source of realGDP growth. For countries with rapidly growing populations, how-ever, the difference of 2 or 3 percentage points of real GDP growthper annum can be the difference between rising real per capita in-comes and standards of living and falling ones.
An interesting issue—connected with cronyism—arises with re-gard to the granting of monopoly positions; in many countries,SOEs were established to produce import-competing goods; oncethe SOE was in production, imports were no longer permitted, andthe SOE had a monopoly of that particular good. The economic rateof return to such an activity was negative to the extent that resources
11. Losses in SOEs and their continued importance in investment are certainlypart of the story of poor economic performance in many countries of sub-SaharanAfrica. It is estimated that, in India, the SOEs accounted for about 80 percent of allmanufacturing investment and about 25 percent of output. See Pranab Bardhan,The Political Economy of Development in India (Oxford: Basil Blackwell, 1984), p. 102.
Hoover Press : Haber DP5 HPCRON0100 01-06-:2 15:04:30 rev2 page 9
9Why Crony Capitalism Is Bad for Economic Growth

that could have earned a higher return in other activities were di-verted to the SOE; with monopoly rents, however, some SOEs werefinancially profitable. For purposes of analyzing cronyism, thegranting of monopoly positions can be regarded as a form of taxa-tion (of consumers or private producers, depending on whether theSOE produces final consumer goods or intermediate goods) with acommensurate rise in the savings rate to cover the economic lossesassociated with the enterprise. In the national income accounts, ofcourse, monopoly profits accruing to state-owned enterprises aretreated no differently than other profits, and the opportunity costsof resources allocated to high-cost, import-competing industries arenot reflected.
Before considering cronyism directly, it is useful to consider onepossible variant of the SOE model. That is, suppose that, instead ofinvesting in SOEs at negative real rates of return, the governmentwere to use resources to provide for palaces, airplanes, luxury au-tomobiles, and other luxuries for the ruling group, or elite. Supposethat a fraction of savings, equal to that allocated to SOE investmentsin the situation outlined above, was diverted to these purposesthrough taxation or through deficit financing (including possiblyeven borrowing from abroad).
To analyze the effects on growth, there must be two additionalspecifications. The first question is whether the palaces, airplanes,and luxury automobiles are maintained at public expense. The sec-ond is how these expenditures are recorded in the national ac-counts. Consider first the case where the airplanes, palaces, andother consumption items are maintained at private expense oncediverted to the ownership of the elite and where these expendituresare recorded in the national income accounts as investments. In thatcircumstance, the rate of return on these expenditures is zero, andthe case is precisely the same as that modeled above, with the spec-ification that the return on investment is zero. If, instead, theseexpenditures are recorded as consumption, the domestic savings
Hoover Press : Haber DP5 HPCRON0100 01-06-:2 15:04:30 rev2 page 10
10 ANNE O. KRUEGER
rate falls commensurately, but the impact on growth is identical. Ofcourse, if the resources to finance the consumption expenditures (orthe SOE investments) are raised in ways that reduce the domesticsavings rate, the negative impact on growth is even greater.
If the palaces, airplanes, and other luxury items are maintainedat public expense, however, the ensuing maintenance costs areequivalent to losses incurred by SOEs.12 If maintenance costs are aconstant fraction of the stock of these consumption goods, and thestock of such items increases more rapidly than output over time,the overall rate of economic growth will decline unless the capitalstock rises at an increasing rate.
With this simple framework we can now address the basic is-sues that arise with cronyism. Perhaps the basic question is whatcronyism is. It might be the exemption from taxes or the directallocation of consumption goods to a favored individual or group.In that case, the effects of cronyism on resource allocation andgrowth are no different from the effects of any other tax to financegovernment consumption or subsidy to some private economic ac-tivities. The effects of cronyism would be little different from theeffects of such activities as a subsidy to the consumption of fertilizeror food grains.
However, suppose instead that the cronyism consists of extend-ing to some individuals or groups favored status with respect toentry into economic activity. It is this form of cronyism that hasbeen the focus of concern in East Asia. In countries pursuing im-port-substitution policies, this favoritism was exercised through thegranting of import licenses for capital or intermediate-goods im-ports to these favored groups. Since foreign exchange was over-priced, it was rationed; since imports of most import-competing
12. For simplicity, I ignore the accounting and other questions surroundingdepreciation and assume that investment and consumption items are infinitelylived.
Hoover Press : Haber DP5 HPCRON0100 01-06-:2 15:04:30 rev2 page 11
11Why Crony Capitalism Is Bad for Economic Growth

goods were highly restricted, there was a monopoly profit conferredwith the granting of these licenses. Cronyism could therefore takeplace through the trade regime and the import licensing that ac-companied it. Activities that were privately profitable (because ofmonopoly positions) were socially unprofitable.
For countries pursuing outer-oriented trade strategies, how-ever, favors could not be conveyed through privileges associatedwith the import regime. An alternative mechanism was to create aclimate in which real rates of return on investment were high, andin which financing was available to favored parties at below-marketrates of interest (i.e., through extension of domestic credit to favoredactivities or individuals and groups).
The Role of Domestic Credit in Cronyism
Since in most developing countries inflation rates were rela-tively high, ceilings on interest rates had the effect of provision of asizable subsidy element, especially in the context of high real ratesof return on investments. In the absence of well-functioning capitalmarkets, a significant portion of new investment was financed bydomestic credit creation. With excess demand, governments coulddirect domestic credit, and therefore resources, toward favored bor-rowers.
To provide an indication of the relative size and importance ofthese uses of domestic credit, table 1.1 gives some data for Koreaduring its period of high growth in the late 1960s. As can be seen,domestic credit was similar in magnitude to gross domestic capitalformation, although domestic credit grew more slowly as profits ofprivate sector companies increased. Lending rates of deposit-money banks were around 14 percent in the late 1960s and fell intothe single digits by the early 1970s. By contrast, the curb lendingrate (the informal market in which most Korean firms borrowed
Hoover Press : Haber DP5 HPCRON0100 01-06-:2 15:04:30 rev2 page 12
12 ANNE O. KRUEGER
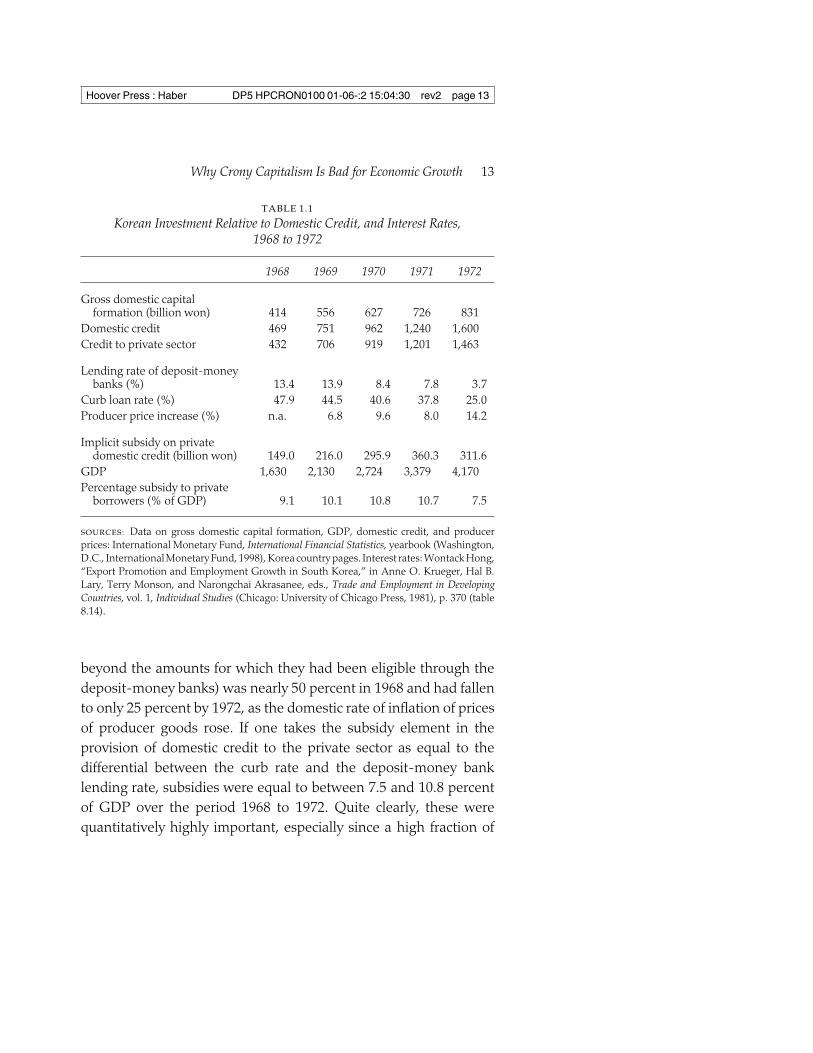
TABLE 1.1
Korean Investment Relative to Domestic Credit, and Interest Rates,1968 to 1972
1968 1969 1970 1971 1972
Gross domestic capitalformation (billion won) 414 556 627 726 831
Domestic credit 469 751 962 1,240 1,600Credit to private sector 432 706 919 1,201 1,463
Lending rate of deposit-moneybanks (%) 13.4 13.9 8.4 7.8 3.7
Curb loan rate (%) 47.9 44.5 40.6 37.8 25.0Producer price increase (%) n.a. 6.8 9.6 8.0 14.2
Implicit subsidy on privatedomestic credit (billion won) 149.0 216.0 295.9 360.3 311.6
GDP 1,630 2,130 2,724 3,379 4,170Percentage subsidy to private
borrowers (% of GDP) 9.1 10.1 10.8 10.7 7.5
SOURCES: Data on gross domestic capital formation, GDP, domestic credit, and producerprices: International Monetary Fund, International Financial Statistics, yearbook (Washington,D.C., InternationalMonetary Fund, 1998), Korea country pages. Interest rates: Wontack Hong,“Export Promotion and Employment Growth in South Korea,” in Anne O. Krueger, Hal B.Lary, Terry Monson, and Narongchai Akrasanee, eds., Trade and Employment in DevelopingCountries, vol. 1, Individual Studies (Chicago: University of Chicago Press, 1981), p. 370 (table8.14).
beyond the amounts for which they had been eligible through thedeposit-money banks) was nearly 50 percent in 1968 and had fallento only 25 percent by 1972, as the domestic rate of inflation of pricesof producer goods rose. If one takes the subsidy element in theprovision of domestic credit to the private sector as equal to thedifferential between the curb rate and the deposit-money banklending rate, subsidies were equal to between 7.5 and 10.8 percentof GDP over the period 1968 to 1972. Quite clearly, these werequantitatively highly important, especially since a high fraction of
Hoover Press : Haber DP5 HPCRON0100 01-06-:2 15:04:30 rev2 page 13
13Why Crony Capitalism Is Bad for Economic Growth

domestic credit was allocated to the export-oriented domestic man-ufacturing industry, which itself constituted at that time a relativelysmall percentage of GDP.
But, for present purposes, the important fact is that domesticcredit was allocated in accordance with government instructions,and the subsidy element was huge. Insofar as recipients could earnhigh real rates of return on investments, they profited enormously.Wontack Hong has estimated that, in the late 1960s, the real rate ofreturn on investment in manufacturing was about 37 percent.13 Ifsuch rates of return were available only to those with access todomestic credit, the opportunity for profitable cronyism was enor-mous. The next section of this chapter attempts to explain howcronyism and its potential for misallocation could coexist with sucha high realized real rate of return.
For present purposes, the point is that cronies can be favoredthrough the granting of domestic credit when that credit is allocatedat rates significantly below market. If cronies then use the proceedsto undertake investments that have the highest possible rates ofreturn, the net effect of credit allocation is simply to transfer incometo them; growth is unaffected. If, however, some (all?) cronies investin projects that have lower-than-attainable rates of return (eitherbecause government officials attempt to pick the winners or be-cause cronies are less competent entrepreneurs than those whowould emerge through market processes), the analysis can be un-dertaken in precisely the same manner as that for the growth effectsof low rate-of-return SOEs: Taking the average rate of return acrosscrony investments times the fraction of investment undertaken bycronies and adding that to the rate of return realized among effi-
13. Wontack Hong, “Export Promotion and Employment Growth in South Ko-rea,” in Anne O. Krueger, Hal B. Lary, Terry Monson, and Narongchai Akrasanee,eds., Trade and Employment in Developing Countries, vol. 1, Individual Studies (Chi-cago: University of Chicago Press, 1981).
Hoover Press : Haber DP5 HPCRON0100 01-06-:2 15:04:30 rev2 page 14
14 ANNE O. KRUEGER

ciently allocated investments times the fraction so allocated will givea growth rate less than that if all investment were channeledthrough the latter source.
If, however, cronies take some fraction of loan proceeds for theirpersonal consumption expenditures or their Swiss bank accounts,the analysis can again be amended. In particular, to the extent thatcronies divert their lines of credit from investment to consumption,the net effect on growth can be treated as equivalent to investmentswith a zero rate of return or, alternatively, a fraction of investablefunds that are diverted to consumption. If investments in SOEsyield a positive real rate of return while cronies simply divert thedomestic credit extended to them to their private uses, SOE invest-ments may prove superior to extension of domestic credit to cronies.
A final case needs to be considered. Assume that cronies haveinvested in loss-making enterprises but that, for whatever reasons,the authorities direct the banks to maintain evergreen accounts forthe cronies. Under this arrangement, interest on the outstandingvolume of bank credit is treated as paid and new loans to the croniesare extended in the amount of the interest; nonperforming loans donot show up on the books at all. If the banks do not extend anyadditional credit, cronies cannot invest, as there are no profits andtheir incremental domestic credit simply serves to maintain theirliquidity.
In those circumstances, funds that otherwise might be directedtoward new investment are instead allocated to offset the losses ofcronies’ firms. In the real world, how such evergreen accounts affecteconomic activity depends on the accounting undertaken. If firmsrecord their losses and treat interest as paid with an offsetting lossto the company and accumulated debt, the negative returns to cro-nies will constitute a net subtraction from GDP. If, however, firmsfail to record their losses and treat the proceeds of loans as financingnew investments, saving and investment will be seen to rise as a
Hoover Press : Haber DP5 HPCRON0100 01-06-:2 15:04:30 rev2 page 15
15Why Crony Capitalism Is Bad for Economic Growth

percentage of GDP, which in turn will overstate true output by theamount of the losses not appropriately recorded.
Cronyism in East Asia
For the sake of concreteness, I focus the discussion on Korea,although many of the attributes of the Korean economy during itsrapid development phase were shared by Taiwan, Hong Kong,and Singapore at similar early stages of development. More-over, rapid growth began only after major policy reforms had beenundertaken.
It is often forgotten that, as of 1960, South Korea had the high-est density of population in agriculture of any country in the world,with 70 percent of its population in agriculture; its savings rate wasclose to zero (with about 10 percent of GDP as investment financedby foreign aid); its per capita income was the third lowest in Asia;its rate of inflation in the mid 1950s had been the highest in theworld; it had a multiple exchange-rate regime and a highly restric-tive import licensing system with an acute foreign exchange short-age. There were SOEs established in many lines of economic activ-ity, with the usual governmental efforts to control private economicactivity.
The list of the woes of the South Korean economy at that timewould fill several pages, even at this level of generality. But forpresent purposes, one other statistic is key to my interpretation ofwhat happened: exports in 1960 constituted about 3 percent of GDP(88 percent of them originating in primary activities), while importswere about 13 percent. This must have meant that the economicreturn to allocating additional resources to exportables was high,while that to additional resources in import substitution was low ornegative. This was borne out by a low real rate of growth of GDP: ithad averaged less than 5 percent (with a rate of growth of popula-tion of almost 3 percent) from the end of the Korean War to 1960,
Hoover Press : Haber DP5 HPCRON0100 01-06-:2 15:04:30 rev2 page 16
16 ANNE O. KRUEGER

when the real return should have been high with opportunities forpostwar reconstruction.
Between 1960 and 1963, economic policy changed radically. Thecountry’s leaders recognized that Korea would not be able to growwithout earning more foreign exchange and that foreign aid wouldnot provide a growing source of foreign exchange. Economic incen-tives were almost reversed. The exchange rate was moved to morerealistic levels.14 Quantitative restrictions on imports were greatlyreduced in general and were eliminated for exporters’ imports ofraw materials, intermediate goods, and capital equipment. Tax pol-icy was reformed and government expenditures rationalized so thatthe government budget deficit was virtually eliminated. Restrictivelabor legislation was removed, with a subsequent increase in realwages at an average annual rate of 8 percent per year between 1964and 1992 (and an immediate drop in the recorded unemploymentrate from around 25 percent in 1960 to around 4 pecent by 1964).
Emphasis switched to achieving economic growth through ex-porting. Although government officials did not discriminate (at leastin the 1960s) between activities (in the sense of favoring exports ofone good or service over another—all foreign exchange–earningactivities were accorded equal treatment), it can almost be said thatthey held an export theory of value. Exporters were given priorityaccess to credit (which was, as already indicated, highly subsidized);ports, telecommunications, transport, and other infrastructure sup-portive of producers were expanded and improved. When an ex-porter had difficulties with any aspect of filling an order, he hadalmost immediate access to the president.
There are a large number of interesting aspects to the story. But
14. The real won return to exporters per dollar of foreign exchange was aboutthe same between 1960 and 1970. This was achieved both by occasional exchangerate adjustments until 1964 and then a floating exchange rate and by announcinguniform across-the-board export subsidies and other incentives to exporters thataccrued to them automatically.
Hoover Press : Haber DP5 HPCRON0100 01-06-:2 15:04:30 rev2 page 17
17Why Crony Capitalism Is Bad for Economic Growth

for my purposes, the important points are these. First, as of 1960,there were enormous opportunities for highly profitable invest-ments in exporting activities, given the distortions in the economythat had earlier discouraged them and the incentives that were thenprovided. Since it was doubtless economical for almost all new in-vestment to be induced into these newly profitable activities, acredit-rationing regime that directed all credit to finance expansionof capacity for these activities was unlikely to result in serious mis-allocation of new credit. Moreover, in the early years, there were somany profitable opportunities for export activity that it probablymade little difference which ones were in fact chosen. And the skillof the entrepreneurs undertaking them was probably also of sec-ond-order importance.
Hence, in the early years of the Korean period of rapid growthunder an export-led growth strategy, it seems likely that credit couldbe and was rationed in ways that were not very different than wouldhave occurred under an efficient market outcome. The resulting rateof growth of exports—a 40 percent per year average annual increasein export earnings from the decade starting in 1963—and the in-crease in the share of tradables, both exports and imports, in GDPfrom 3 and 13 percent to 30 percent and more by the 1980s atteststo that.
A note about the real rate of return to capital in South Korea,both economy-wide and for manufacturing, is in order here. Theeconomy-wide real rate of return on capital was roughly 60 percentin 1970, falling to about 20 percent by 1980, and remaining at thatlevel until around 1990. The rate of return in manufacturing waslower in the 1970s15 than the economy-wide rate of return, but by
15. This may reflect estimation error, or it may reflect the huge rural-to-urbanmigration in the 1970s as farmworkers (with low real wages) migrated to cities andwere absorbed in activities with much higher real products. High overall growth,especially in the 1970s, may have been attributable both to the reallocation of labor(with significant increases in the real product of labor) as well as to capital formation.
Hoover Press : Haber DP5 HPCRON0100 01-06-:2 15:04:30 rev2 page 18
18 ANNE O. KRUEGER

the late 1970s, the two real rates were similar.16 Moreover, theserates were falling in the 1990s. By that time, there had been someliberalization of the banking system (with higher nominal and realinterest rates) but domestic credit still financed a great deal of capi-tal formation.
Now consider the role of domestic credit. Whereas implicit sub-sidies to producers were large relative to GDP and investment inthe 1960s, they were financing investments with high rates of re-turn. Naturally, in a poor country, the extent of equity of the newlyexporting firms was quite low and domestic credit financed a highfraction of expansion. But real rates of return were high, and theallocation of domestic credit caused few problems.
Over time, however, the subsidy element in granting domesticcredit decreased as the liberalization of the financial system began.Estimates of this are given in table 1.2, on the assumption that anequilibrium real rate of interest in the financial market would havebeen 10 percent. As can be seen by comparing those figures to theones in table 1.1, the subsidy element of domestic credit fell drasti-cally on these assumptions. Moreover, domestic credit expansion asa percentage of GDP—while still too large to be sustainable at avirtually fixed nominal exchange rate—also declined.17
At the same time, the firms that had been so favored in the1960s had become large relative to the Korean economy, and own-
16. In the mid 1970s, a heavy and chemical industry (HCI) drive was begun thattargeted specific heavy industries for development. This was the only period duringKorea’s rapid growth where the government actually attempted to pick the winnersand identify individual economic activities. The drop in the rate of return to capitalin manufacturing in the late 1970s and early 1980s is probably a reflection of thepoor results of the HCI drive; by early 1979, it was already being revamped and wasrecognized as having put great strains on the economy and jeopardized growth.
17. As long as Asian governments maintained fixed nominal exchange rates,expansion of domestic credit was virtually equivalent to increases in the contingentliabilities of governments. As such, one could regard the unsustainable componentof domestic credit expansion as equivalent to financing additional investmentthrough a fiscal deficit.
Hoover Press : Haber DP5 HPCRON0100 01-06-:2 15:04:30 rev2 page 19
19Why Crony Capitalism Is Bad for Economic Growth

TABLE 1.2
Korean Investment Relative to Domestic Credit, and Interest Rates,1990 to 1996
1990 1991 1992 1993 1994 1995 1996
Gross domestic capitalformation (trillion won) 179 215 241 267 305 351 390
Domestic credit 102 125 139 157 186 214 254Credit to private sector 102 122 136 154 185 213 256
Lending rate of deposit-moneybanks (%) 10.0 10.0 10.0 8.6 8.5 9.0 8.8
Curb loan rate (%) n.a. n.a. n.a. n.a. n.a. n.a. n.a.Producer price increase (%) 4.1 4.7 2.1 1.4 2.7 4.7 2.6
Implicit subsidy on privatedomestic credit (trillion won) 6 6 3 10 36 10 10
GDP 179 216 240 267 305 351 389Percentage subsidy to private
borrowers (% of GDP) 3.3 2.8 1.2 3.7 11.8 2.8 2.6Increase in domestic credit as a
% of GDP — 10.6 5.8 5.7 10.1 8.0 11.0
SOURCES: Data on gross domestic capital formation, GDP, domestic credit, lending rate, andproducer prices: InternationalMonetary Fund, InternationalFinancial Statistics, Yearbook,1998,Korea country pages. Implicit subsidy: calculated as per text.
ers of those firms were important sources of financing for politicalleaders. In addition, their enterprises accounted for a sizable shareof GDP and employment; their favored access to credit had enabledthem to expand, and credit rationing skewed toward these firmshad apparently constituted a significant barrier to entry or to expan-sion of small firms.
Because of these factors, and probably also for other reasons,cronyism persisted in the form of favoritism toward the large firms.And, whereas it had been apparently justified by the high real re-turns earned in the 1960s and early 1970s, there was less justifica-tion as the Korean economy matured. Whether the real rate of re-turn fell because of an increased capital-labor ratio and diminishing
Hoover Press : Haber DP5 HPCRON0100 01-06-:2 15:04:30 rev2 page 20
20 ANNE O. KRUEGER

returns to capital, because of the inability of chaebol owners to man-age firms in ways appropriate to achieving high returns in the1990s, or because the chaebol owners diverted domestic credit fromtheir enterprises to maintain or increase consumption expendituresand investment figures are overstated (as the increase in nonperfor-ming loans might suggest) are questions that it is not possible toanswer.
Moreover, insofar as there were other economic activities de-serving of credit and able to earn higher real rates of return than didthe favored firms, the economic effects of the directed credit werethe same regardless of which explanation is correct; favoring thechaebol in Korea (and cronies with inappropriate investmentschemes or high consumption levels in other East Asian countries)resulted in a slowing growth rate. As the apparent18 real rate ofreturn to capital fell while the real rate of interest paid on bankinglending rose, the degree of subsidy clearly dropped as a percentageof GDP (see table 1.2), and, since the chaebol were larger as afraction of the Korean economy, the percentage of implicit subsidyfell even further.
Conclusions
There are interesting parallels between SOEs and crony capital-ism. With SOEs, low real rates of return and losses are generatedfor a variety of political reasons: the desire of those in power to
18. I use the word apparent because, in some instances, domestic credit wasgranted to individuals who used the proceeds in two ways that were not investment.In some instances, there are newspaper reports of lending to finance consumptionexpenditures of cronies; to the extent that these expenditures were recorded asinvestment, it is not that the real rate of return fell, it is that the rate of investmentwas overstated. In other instances, domestic credit was extended to firms that wereprobably making economic losses but concealing the fact by overstating new in-vestments. What appears to be a declining real return may in fact be in part anoverstatement of investment.
Hoover Press : Haber DP5 HPCRON0100 01-06-:2 15:04:30 rev2 page 21
21Why Crony Capitalism Is Bad for Economic Growth

expand employment despite the absence of productive opportuni-ties; the mislocation of enterprises in favored regions regardless ofincreased costs; the appointment of managers whose competencieslie in the political rather than the economic arena; the inability toclose down uneconomic enterprises; and the soft budget constraint.
In the case of crony capitalism, owners of companies receivecredit and may expand because their size is a political asset (too bigto fail). They may mislocate in the country’s capital to be close tothose they wish to influence regardless of cost; since the ownersreceive subsidized credit regardless of the prospective real returns,cronies can persist in business even when their activities are nolonger economic; and since they receive subsidized credit, they ineffect have soft budget constraints.
There is another similarity as well: in the case of SOEs, theirlosses are normally covered by transfers out of central governmentbudgets and increase fiscal deficits. In the cases of cronyism, do-mestic credit expansion is financed by a capital inflow; the capitalinflow is attractive to foreigners because of the government’s com-mitment to maintain an exchange rate. As such, the increase incontingent liabilities of the banking system is parallel in crony cap-italism to the fiscal deficit in the case of SOEs.
There is no question that the flaws in the financial system (andthe overhang of nonperforming loans) must be addressed beforerapid sustainable growth can be resumed. Moreover, especially asinternational capital markets have learned about emerging markets,there seems less and less choice of exchange rate regimes; onlyfloating exchange rates and possibly currency board systems appearviable. In the future, it will be much more difficult for economies toattract capital inflows through fixing the nominal exchange rate andexpanding domestic credit.
But nothing about these lessons implies that the economicgrowth of the 1960s and early 1970s was not spectacular; it was.Opportunities for high real rates of social and private return were
Hoover Press : Haber DP5 HPCRON0100 01-06-:2 15:04:30 rev2 page 22
22 ANNE O. KRUEGER

unleashed and were seized with consequent rapid growth. That thefinancial system was underdeveloped and the criteria for lendingwere flawed undoubtedly led to some misallocation of loanablefunds, although bankers can make mistakes, too. But as the hugeopportunities for profit that had arisen because of the alignment ofincentives with real payoffs were seized, the economy developedand the scope for misallocation of investible funds increased.
As the real rate of return on capital fell for whatever reason, andthe implicit subsidy in domestic credit also dropped, the flaws in thefinancial system and the commitment to cronies or chaebol becameincreasingly costly, just as SOE losses mount over time. Whetherthe problem is crony capitalism or SOEs, it seems evident that long-run satisfactory economic performance can be resumed only whenmeans are found to allocate resources to best uses with arm’s-length transactions.
Hoover Press : Haber DP5 HPCRON0100 01-06-:2 15:04:30 rev2 page 23
23Why Crony Capitalism Is Bad for Economic Growth