why are south african manufacturing companies not exploiting the local advantages dawid janse van...
TRANSCRIPT
Why is South African Manufacturing Companies not Exploiting the Local Advantages (better)…?
Dawid Janse van RensburgCargoSolutions

Discussion
• State of Manufacturing in SA
• Footwear Industry Overview & Feedback
• Steel Industry Overview & Feedback
• SA Government Initiatives
• A Cost Model – Local vs Imports
• Can we Compete, How?
• Conclusion

State of Manufacturing in South Africa

SA Economy 2014

SA Manufacturing Production
Source: www.tradingecomics.com SA Revenue Service

SA Balance of Trade

SA Balance of Trade vs GDP Growth Rate
Source: www.tradingecomics.com SA Revenue Service

SA Trade Balance vs Singapore
Source: www.tradingecomics.com SA Revenue Service

Manufacturing in SA
• 21% in 1983
• 14,6% in 2011
• 16% in 2013
• 13,9% in 2014
• Korea from 23.6% in 1977 to 30.6% in 2010
• Malaysia from 19% to 26.1%
• Exchange rate working against imports
• Certain industries badly affected– Clothing & Footwear– Steel
• SA Government Initiatives

Footwear Sector

Footwear Industry
• 21 bn pairs produced pa worldwide (2011)
• China alone 63%!
• SA
– 23/92 countries
– 51 mill pairs (2011)

Footwear – Local vs Imported
Source: SAFLIA Digest, Footstats 2009

Footwear Imports to SA
Source: http://tradestats.thedti.gov.za

Field Research
• Large importers of shoes (1 supplier and 1 retailer)– Lead times
• Local: 6-12 weeks (4 on repeat)
• Imports: 16 weeks (12 on repeat)
– Price• Currently no advantage
– Range (ladies!)• Range and styling are driving imports

Steel Sector

Steel Industry
• 2014 – Imported 45% of local demand– Exported 35% of local production
• Jobs:– 413 515 (2007) to 374 959 (2014)
• AMSA running at approx 60% of capacity (2014)
• Avrez Highveld – applied for Business Rescue

Steel and Iron Imports
Source: http://tradestats.thedti.gov.za

Steel & Iron Imports into SA
Source: http://tradestats.thedti.gov.za

Field Research
Buy local
- Less hassles
- Less costs
- Support local manuf
- Shorter lead times
- Uncertainty of imports
- Quality preferred
Import
- Less expensive (esp.
bulk)
- Delivery certainty
(local LT’s variable)
Question Local only Import Only Local & Import
Where do you buy
your steel?
3 0 4

Government Incentives

DTI Funding Programmes
• Various cycles of production incentives
• Currently in 2012 cycle
– R5,75 bn over six years

Cost Analysis – Import vs Local

Forecast Error
www.DemandPlanning.Net; Mark Chockalingam Blog. Forecast Error Benchmarking
across various industries – survey results » Average of forecast error

MAPE’s for Monthly Sales Forecast
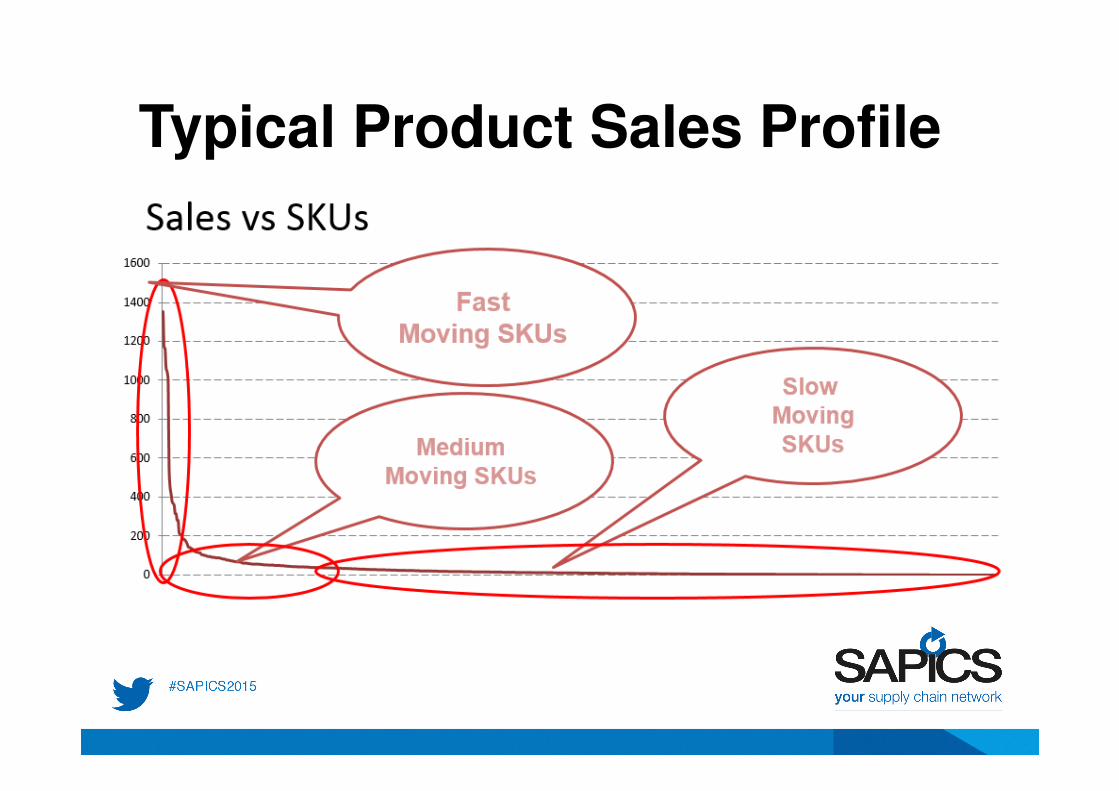
Typical Product Sales Profile

Cost Comparison between Local and Overseas Suppliers
Now % Change
in Qty
% Change
in Price
Future
ZAR % of Sales ZAR % of Sales
Sales 100 10% 5% 115.5
Cost of Sales 44 44% 58 50% 50 (20%
GP 56 56% 57.5 50%
OE 50 50% 50 43%
NP 6 6% 25% 7.5 6%
Inventories 11 4 -47% 5.8 10
ROI 55% turns pa 137% 129% turns pa
Add cost of capital 4.356 2.871

Financial Leverage in Increasing Throughput
Now Potential
BREAK-EVEN
POINT
RE
VE
NU
E &
CO
ST
FIXED COSTS
TOTAL COSTS
VARIABLE COSTS
PROFIT
POTENTIAL
PROFIT
How is it possible to increase Profits
so much just by increasing
Throughput & reducing LT?
Source: Goldratt Consulting

Companies Bucking the Trend

Breakthrough Results!
• Lead times: 70% reduction
• Due-Date-performance: 44% up
• Inventory levels: 49% reduction
• Revenue: 63% increase
Figures represent the mean improvements of over eighty international companies documented in an independent study,
The World of Theory of Constraints, Mabin & Balderstone, St. Lucie Press, 2000

Case Studies
• Footwear
– Bagshaw Shoes
– Watson Shoes
– Aerosud
– etc

Improvement Methodologies

Theory of Constraints
• Brainchild of the late Dr Eli Goldratt
• Maintains that all systems are inherently simplistic
• Most often one constraint that limits flow
• Focus on the constraint will improve flow
• Consists of thinking processes, supply chain solutions, etc
• Fully enabled by TOC enabling software

TOC Solution for Operations
2. What to Change?2. What to Change?Conflict: Use Efficiencies vs Don’t use Efficiencies
Assumption: “An idle resource is a major waste”
Old Policy: Plan & Execute in ways to ensure all resources are utilized to maximum efficiency
3. What to Change to?3. What to Change to?Insight: All non-bottleneck resources must be idle
from time-to-time to utilize Bottleneck 100%
New Policy: Drum Buffer Rope + Buffer Management
5. How to create POOGI?5. How to create POOGI?
Use buffer management statistics on causes of “Red Zone” penetration to
focus Process Improvements
4. How to cause the change?4. How to cause the change?a) Identify the Bottleneck
b) Define the DRUM
c) Size the (Time) BUFFERS
d) Tie the ROPE (to choke Raw Material Release)
e) Implement “Road-runner Ethic” & Quality 1st time
f) Implement Buffer Management to determine day-to-day
priorities & capture red zone reasons
1. Why Change?1. Why Change?GAPS: Throughput lower than Available Capacity, Due Date is
poor, Lead Times Long, High Variation in Throughput, Lead Time and Quality etc.
UDES: Sometimes Material & Resources not available, Long Set-ups, Priorities change, Forecast not accurate, High expediting & overtime costs etc.
Source: Goldratt Group

TOC Solution for Distribution
2. What to Change?2. What to Change?Conflict: Hold less inventory vs Hold more inventory
Assumptions: Long Replenishment time, Inaccurate Forecasts and Unreliable suppliers are all out of our control
Old Policy: Make-to-Order and PUSH based on Forecast
3. What to Change to?3. What to Change to?Insight: Increasing order frequency will reduce Repl Time,
improve Forecast and improve Supplier Reliability
New Policy: Distribution the TOC way - PULL Replenishment based on actual consumption + Buffer Management
5. How to create POOGI?5. How to create POOGI?Use buffer management statistics on causes of
“Red Zone” penetration to focus Process Improvements
4. How to cause the change?
For each product establish the inventory target according to the
4. How to cause the change?a) Establish the plant (Central) warehouse
b) For each product establish the inventory target according to the
formula
c) Move to ‘Order daily – Replenish periodically’
d) Monitor the inventory targets according to the zones
e) Re-examine policies of make to stock – make to order
f) Educate sub-systems to monitor execution using Dollar days
1. Why Change?1. Why Change?GAPS: Poor DDP, High Surpluses & Shortages, Long LT,
Low Inventory Turns & High Costs
UDE’s: Priorities change, Forecast inaccurate, Unreliable Supply, Too many SKU’s, Too many emergencies etc.
Source: Goldratt Group

Strategy & Tactics
Source: Goldratt Consulting & www.harmonytoc.com

Summary

Summary
• Do not have to wait for more Government Incentives!
• Do not bargain on macro economic adjustments
• As manufacturers, embrace the challenge to become world class…!
• As buyers, analyse the full cost perspective carefully…! (of local vs imports)
• Embrace proven supply chain optimisationmethodologies (recipes) such as TOC to achieve dramatic improvements, rapidly, and with limited risk