why are some generic drugs skyrocketing in price?
TRANSCRIPT

1
Statement on
Why Are Some Generic Drugs Skyrocketing in Price?
Statement before
Senate Committee on Health, Education, Labor and Pensions (HELP) Congress of the United States
November 20, 2014
Statement of
Stephen W. Schondelmeyer, BS Pharm, MA Pub Adm, Pharm.D., Ph.D., FAPhA
Professor and Head Department of Pharmaceutical Care & Health Systems
Century Mortar Club Endowed Chair in Pharmaceutical Management & Economics
Director, PRIME Institute College of Pharmacy
University of Minnesota Minneapolis, Minnesota 55455
(612) 624-9931
2
Statement on Why Are Some Generic Drugs Skyrocketing in Price?
Stephen W. Schondelmeyer,
BS Pharm, MA Pub Adm, Pharm.D., Ph.D., FAPhA Thank you Senator Sanders and members of the Senate Committee on Health, Education, Labor and Pensions (HELP) for this opportunity to provide information and insights on drug price trends related to generics and other pharmaceutical products. I am Stephen W. Schondelmeyer, Professor of Pharmaceutical Management & Economics at the University of Minnesota where I serve as Director of the PRIME Institute. The PRIME Institute focuses its research on policy issues related to pharmaceutical economics and the management of drug expenditures at all levels in society. These remarks are my own views based upon my research and experience in studying the pharmaceutical marketplace for over forty years. Previously, I have had the opportunity to serve Congress as a member of the Prescription Drug Payment Review Commission (established under the Catastrophic Coverage Act of 1988), as an author or co-author of several legislatively mandated Reports to Congress, and through testimony before Congressional committees on numerous occasions. This hearing is being held to examine “Why are some generic drugs skyrocketing in price?” Various aspects of this issue are addressed in my written remarks which include comments on: (1) improved coverage and access to pharmaceuticals; (2) the role of generics in the U.S. pharmaceutical market; (3) recent price trends for brand and generic prescription drug products; (4) signals of market failure in the pharmaceutical market; and (5) policy options to address skyrocketing drug prices. I will briefly address each of these topics and describe their relationship to the skyrocketing generic drug prices being observed in the market. Improved Coverage and Access to Pharmaceuticals Actions taken by Congress over the past decade have expanded health insurance coverage, in general, and more specifically prescription drug coverage. Two major pieces of legislation have been enacted and implemented in the past decade: (1) The Medicare Prescription Drug, Improvement and Modernization Act of 2003 (MMA); and (2) The Patient Protection and Affordable Care Act (PPACA)--commonly called the Affordable Care Act (ACA) (2010). First, the MMA established the Medicare Prescription Drug Program, also known as Medicare Part D. The MMA's most prominent feature was the introduction of an entitlement benefit for Medicare beneficiaries covering prescription drugs through tax breaks, subsidies, premiums, and other forms of cost-sharing. The Medicare Part D program was implemented on January 1, 2006. The ACA was the second major piece of legislation passed by Congress in less than ten years. The ACA was enacted with the goals of increasing the quality and affordability of health insurance, lowering the uninsured rate by expanding public and private insurance coverage, and

3
reducing the costs of healthcare for individuals and the government. While some of the provisions of the ACA were implemented as early as 2010, the major provisions went into effect on January 1, 2014. Both the MMA and the ACA have expanded the number of persons with health insurance including prescription drug coverage. Gallup has estimated that the uninsured rate for adults (persons 18 years of age and over) was 13.4% as of the second quarter of 2014, down from 18.0% in the third quarter of 2013 when the health insurance exchanges created under the Patient Protection and Affordable Care Act (PPACA or "Obamacare") first opened.1 As a result of the MMA and the ACA, more Americans have public or private health insurance which includes coverage of prescription drugs. This expansion of health insurance and drug benefit coverage has been accomplished using a combination of premiums, subsidies, taxes and penalties for lack of coverage. The percent of Americans with prescription drug coverage is at an all-time high (about 86% of the U.S. population). Drug therapy is perhaps the most widely used form of therapy in health care. Each year in the U.S. there are more than 4 billion outpatient prescriptions provided to 310 million Americans.2 This means that each American gets 12 or more prescriptions per person per year on average. In addition to outpatient prescriptions in retail settings, patients use drug therapy in virtually all other areas of health care such as hospitals, nursing homes, physicians’ offices and clinics, dentists’ offices, government facilities, public health clinics, and other settings. Each year there are 20 to 40 new molecular entities that are approved by the Food & Drug Administration for marketing in U.S.3 These new drug (or biological) approvals are usually for innovative drug therapies that almost always have one or more patents and/or other forms of exclusivity. Often these new drug therapies hold the promise of treating a previously untreated disease or providing safer or more effective therapy to replace older drugs on the market. Also, keep in mind that today’s new and innovative drug therapies and biologicals are the drug products that will become available as generics or biosimilars in the future. Role of Generics in the U.S. Pharmaceutical Market In 1984, Congress enacted the Hatch-Waxman Act also known as the “Patent Term Restoration and Drug Price Competition Act.” The Hatch-Waxman Act (“the Act” or “Hatch-Waxman”) simplified the regulatory hurdles for prospective generic drug manufacturers by eliminating the need for generic companies to file lengthy and costly New Drug Applications (NDAs) in order to obtain FDA approval.4 The Act also eliminated the duplicative clinical trials in patients that had been required for a generic drug to obtain approval from the FDA. Instead, drug companies are permitted to file Abbreviated New Drug Applications (ANDAs) and to rely on the safety and
1 Levy,Jenna, Well-Being, Gallup Release Date: October 8, 2014, found on website at: http://www.gallup.com/poll/178100/uninsured-rate-holds.aspx. 2 IMS Institute for Healthcare Informatics. Medicine use and shifting costs of healthcare. April 2014., p. 49. 3 U.S. Food & Drug Administration. Novel New Drugs, 2013 Summary. January 2014, p. 3. 4 How Increased Competition from Generic Drugs Has Affected Prices and Returns in the Pharmaceutical Market, Congressional Budget Office, July 1998, (“CBO Report”), at xii.

4
efficacy data already supplied to the FDA by the original NDA holder for a given drug. Hatch-Waxman also added a number of provisions to the statutory scheme, which extended the time during which brand name (and patented) drugs may enjoy patent and other forms of market exclusivity. The main purpose of the Hatch-Waxman Act was to balance two competing aims: (1) the protection of intellectual property rights of those who discover and market new and novel drug therapies, by “Patent Term Restoration,” in order to account for and to restore part of the time a drug product was under review by the FDA; and (2) the benefit to the American public that can be provided by “Drug Price Competition” resulting from prompt market entry of less expensive generic drug products that are therapeutically equivalent to the brand name drug product. Generic drugs are essentially exact substitutes for brand name drugs which have met the same exact standards for bioequivalence and pharmaceutical equivalence set by the FDA. Generic drug products are approved by the FDA through an ANDA and contain the same active ingredient(s), in the same dosage form, in the same strength, and are bioequivalent to the reference listed drug (RLD) (i.e., the original brand name version of the drug approved by FDA through a New Drug Application (NDA)).5 The FDA through its review process assures the same clinical effect and safety profile for brand and generic drug products rated as therapeutically equivalent.6 According to the FDA, “Products classified as therapeutically equivalent can be substituted with the full expectation that the substituted product will produce the same clinical effect and safety profile as the prescribed product.”7 Evaluations of therapeutic equivalence for prescription drugs are based on scientific and medical evaluations by the FDA. Products evaluated as therapeutically equivalent can be expected, in the judgment of the FDA, to have equivalent clinical effect and no difference in their potential for adverse effects when used under the conditions of their labeling.8 If the brand and generic products are shown to be therapeutically equivalent, and therefore interchangeable, they are rated as “A” by the FDA. Because there is no difference in efficacy and safety between the FDA-approved brand and generic versions of a drug product, they are freely substitutable and interchangeable from a clinical standpoint. Brand-name drugs that are approved for sale by the FDA are sometimes protected by one or more patents or other forms of exclusivity9, which provide the patent owner (or exclusivity holder) with the ability to ask a court to enforce an exclusive right to sell that drug in the United
5 While a generic drug must have the same active ingredient in the same amount as the brand drug, the generic can use different inactive ingredients. 6 Orange Book, 27th ed. (12/31/2006) Preface, p. vi. 7 Orange Book, 27th ed. (12/31/2006) Preface, p. x. 8 Orange Book, 27th ed. (12/31/2006) Preface, p. x. 9 Drug companies may receive FDA-granted exclusivity periods for several reasons including: (1) orphan designation; (2) completing FDA-requested pediatric studies; (3) conducting new clinical trials that result in substantial label changes; and (4) other reasons.

5
States for the duration of the patent, or patents, plus any other extension times afforded by law. The Hatch Waxman Act requires the brand company to file with the FDA the patent number and expiration date of any patent covering the drug in question. Patent information received by the FDA with respect to approved drugs is published in the FDA’s “Orange Book,” where such information can be found and consulted by future FDA applicants. In accepting and publishing patent information in the Orange Book, the FDA’s role is purely ministerial. The FDA does not verify the facts supplied to it by the patent holder, but instead relies on the good faith and presumed truthfulness of the original NDA holder. An invalid patent that is issued will be listed in the FDA Orange Book and may delay generic competition. The first generic competitor to enter a market typically does so at a price substantially lower than the price of the equivalent brand name drug, and quickly takes a substantial amount of the share of the market for the particular drug “molecule” away from the brand name drug manufacturer. As additional generic competitors come to market, the prices of the generic drug competitors continue to fall compared to the brand price, and their combined share of the market for the molecule, relative to the brand name equivalent, usually continues to grow. The price competition engendered by generic drug manufacturers affects all purchasers of the drug, who are able to buy the generically equivalent chemical substance (the molecule) at much lower prices. Pharmacies and pharmacists – the people and organizations who dispense drugs to patients – can and do substitute A-rated generic drugs for brand name drugs wherever possible in order to lower their own costs and those of their customers. The incentive for pharmacists and patients to engage in routine and easy substitution of A-rated generics has been enhanced over the years by managed care organizations, who, to encourage the use of cost-saving generic drugs, typically place A-rated generic drugs on the “first tier” of their formularies, which corresponds to a lower co-pay level. Pharmacy-driven substitution is extremely rapid and robust in causing the share of the market for the particular drug molecule to shift away from the more expensive brand name drug product and toward the less-expensive A-rated generic equivalents. When easy and routine pharmacy substitution is possible, i.e., when there is an A-rating, all purchasers of the brand name drug – pharmacies of all types (including independent, chain, food and drug stores, and mail order pharmacies), wholesalers and distributors, managed care organizations, hospitals, group purchasing organizations (GPOs) and other “classes of trade” – rapidly begin to purchase the generic version in lieu of the brand version. In addition to my own research, there are a large number (indeed hundreds) of sources -— both published and unpublished — describing the effects of generic competition in pharmaceutical markets. These sources include published articles and research papers, unpublished analyses and research papers, policy papers, government studies and documents, dissertations, databases, and other sources describing the
6
effects of generic competition.10 In the course of my work, I have reviewed most of this research, as it is available in the public domain. I have also conducted studies on the generic pricing and generic penetration rates of nearly all new molecular entities (drug molecules) that have faced generic competition since 1983. Testimony by the FDA’s Director of the Office of Generic Drugs before the Senate Special Committee on Aging in July 2006 reported that “[t]he Hatch-Waxman Amendments have been very successful and have provided for the approval of over 8,000 generic drug products. These products are lower cost, high quality products that have saved the American public and the 10 Among the principal studies in the scientific and economic literature which analyze the effects of generic competition are the following:
a. How Increased Competition from Generic Drugs Has Affected Prices and Returns in the Pharmaceutical Market, Congressional Budget Office, July 1998 (Ex. 96);
b. Jae P. Bae, Drug Patent Expirations and the Speed of Generic Entry, Health Services Research, Vol. 32, No. 1, pp. 87-101, April 1997 (Ex. 98);;
c. Richard G. Frank and David S. Salkever, Generic Entry and the Pricing of Pharmaceuticals, Journal of Economics and Management Strategy, Vol. 6, Spring 1997, pp. 75-90 (Ex .99);
d. Henry Grabowski and John Vernon, Longer Patents for Increased Generic Competition in the U.S.: The Hatch-Waxman Act After One Decade, PharmacoEconomics, 1996 (Ex. 100);
e. How the Medicaid Rebate on Prescription Drugs Affects Pricing in the Pharmaceutical Industry, Congressional Budget Office, 1996 (Ex. 101);
f. Pharmaceutical R&D: Costs, Risks, and Rewards, Office of Technology Assessment, February 1993 (Ex. 102);
g. Henry Grabowski and John Vernon, Brand Loyalty, Entry, and Price Competition in Pharmaceuticals After the 1984 Drug Act, Journal of Law and Economics, October 1992, p. 339 (Ex. 103);
h. Richard E. Caves, Michael D. Whinston, and Mark A. Hurwitz, Patent Expiration, Entry, and Competition in the U.S. Pharmaceutical Industry, Brookings Papers on Economic Activity: Microeconomics, 1991, pp. 1-66 (Ex. 104);
i. Alison Masson and Robert L. Steiner, Generic Substitution and Prescription Drug Prices: Economic Effects of State Drug Product Selection Laws, Federal Trade Commission, 1985 (Ex. 105);
j. Jerry I. Treppel, Andrew S. Forman, Daniel A. Seto, Geoffrey G. O-Brien, Specialty Pharmaceuticals Industry: The Thrifty Fifty (New York: Warburg Dillon Read, May 5, 1999) (Ex. 106);
k. Kirking D.M., Ascione F.J., Gaither C.A., Welage L.S., Economics and Structure of the Generic Pharmaceutical Industry, Journal of the American Pharmaceutical Association, 41: 578-584, 2001(Ex. 107);
l. Ascione F.J., Kirking, D.M., Gaither C.A., Welage L.S., Historical Overview of Generic Medication Policy, Journal of the American Pharmaceutical Association, 41: 567-577, 2001(Ex. 108);
m. Suh, D.C., Manning W.G., Schondelmeyer, S., Hadsall, R., Effect of Multiple-Source Entry on Price Competition after Patent Expiration in the Pharmaceutical Industry, Health Services Research, 35: 529-547, 1993 (Ex. 109);
n. Reiffen, D. and Ward, M.R. (2002), Generic Drug Industry Dynamics FTC Working Paper 248 http://www.ftc.gov/be/workpapers /industrydynamicsreiffenwp.pdf (Ex. 110);
o. Rozek, P.R., Berkowitz, R, The Cost to the U.S. Health Care System of Extending Marketing Exclusivity for Taxol, Journal of Research in Pharmaceutical Economics, 9(4): 21-41, 1999 (Ex. 111);
p. Hong, S.H., Shepherd, M.D. and Wan, T.T., The Impact of Product Line Extensions on Rising Prescription Drug Prices. Manuscript in progress (2003) abstract presented at the 130th Annual Meeting of the American Public Health Association; Philadelphia, PA (November 9-13, 2002) (Ex. 112);
q. Andrew S. Forman and David S. Moskowitz, Specialty Pharmaceuticals: Rising to Another Level (New York: Warburg Dillon Read, May 5, 2000) (Ex. 113).
7
government billions of dollars.”11 The Congressional Budget Office has credited the Hatch-Waxman Act and, importantly, the process for easy and routine A-rated generic substitution by pharmacists with providing meaningful economic competition from generic drugs, and with achieving billions of dollars of savings for drug purchasers such as consumers and employers.12 The rate of generic dispensing has reached an all-time high with generic drug products being dispensed for 77% to 85% of all outpatient prescriptions in 2012 and 2013.13, 14 In other words, generic drug products play a critical role in the U.S. market because they are the only form of direct economic and price competition from identical, therapeutically equivalent drug products which can be legally substituted for brand name prescription drugs. Generics can perform this critical function effectively, however, only through the A-rated substitution mechanism. Generic drugs are essentially exact substitutes for brand name drugs which have met standards for bioequivalence and pharmaceutical equivalence set by the FDA. Without the presence of, or ability of, purchasers to choose an A-rated therapeutically equivalent generic alternative, brand name products will face relatively little effective price or economic competition. The availability and use of FDA-approved A-rated generics provides the key mechanism for assuring that a competitive market for drug products exists, allowing patient-users to achieve equivalent efficacy and safety with increased access and decreased cost. This process of making generic drug products readily available and routinely substitutable at the pharmacy level is what brings effective economic competition to the generic segment of the prescription drug marketplace. Generic drug companies serve a vital role in the pharmaceutical marketplace, and as Hatch-Waxman intended, are meant to stimulate “Drug Price Competition.” Recent Price Trends for Prescription Drug Products What are the recent price trends for prescription drug products in the past few years? Research performed by the PRIME Institute at the University of Minnesota, in conjunction with the AARP Public Policy Institute, has examined the price trends for various segments of the pharmaceutical market including brand name, generic, and specialty products. Actual transaction prices15 at the 11 Statement of Gary Buehler, R.Ph., Director of the Office of Generic Drugs, Center for Drug Evaluation and Research, FDA, before Special Committee on Aging, United States Senate (July 20, 2006), available at http://www.fda.gov/ola/2006/genericdrugs0720.html. 12 Congressional Budget Office, How Increased Competition from Generic Drugs Has Affected Prices and Returns in the Pharmaceutical Market, July 1998, p. ix (“CBO Report”). 13 Pharmacy Times, November 12, 2013, “2012 Generic Drug Dispensing Surpasses 2011 for New Record,” found on web site at: http://www.pharmacytimes.com/publications/issue/2013/November2013/2012-Generic-Drug-Dispensing-Surpasses-2011-for-New-Record. 14 The Express Scripts Lab, The 2013 Drug Trend Report, April 2014, p.67. 15 The retail prices used in this report are drawn from Truven Health’s MarketScan® Commercial Database and MarketScan® Medicare Supplemental Database (Truven Health MarketScan® Research Databases). The prices reflect the actual total price for a specific prescription that a pharmacy benefit manager (PBM) bills to a specific health plan for consumers enrolled in employer-sponsored or government-sponsored (i.e., Medicare or Medicaid) health plans and not simply the out-of-pocket cost (such as the copay) which a consumer would pay at the pharmacy. These amounts may or may not reflect what the PBM paid the pharmacy or the usual and customary price that a pharmacy would charge a cash pay consumer for the same prescription.
8
retail level for prescription drugs widely used by older Americans have been examined over the time period December 31, 2005 to December 31, 2013.16 (See the AARP Public Policy Institute Report for details on the study methods.) We have completed the brand name drug price trend analysis and we are continuing to examine the generic and specialty drug price trend analysis. I will report here a summary of the brand name drug price trends for 2013 and preliminary findings from the generic drug price trends for 2013. Brand Name Drug Price Trends for 2013. The trends reported here are annual price changes based on the 12-month rolling average for the period from December 31, 2012 to December 31, 2013. So let’s examine price changes in the market for brand name drug products in 2013.
Retail prices for the 227 brand name drug products17 most widely used by older Americans rose 12.9 percent in 2013 (Figure 1).18
The average annual retail price increase in 2013 for these brand name prescription drug products was more than eight times higher than the rate of general inflation (12.9 percent vs. 1.5 percent). 19
The average annual retail price increase for brand name prescription drug products in 2013 (12.9 percent) was more than two times higher than the average annual brand name drug price increase in 2006 (5.7 percent).
The average annual cost for one brand name medication used on a chronic basis was nearly $3,000 in 2013.
o For a consumer who takes three brand name prescription drugs on a chronic basis, the annual cost of therapy would have been more than $8,800 during 2013—more than double the cost seen 8 years earlier.
Between January 2006 and December 2013, retail prices for 140 chronic use brand name drugs that have been on the market since the beginning of the study increased cumulatively over 8 years by an average of 113.0 percent.
o The cumulative general inflation rate in the U.S. economy was 18.4 percent during the same 8-year period.
16 Schondelmeyer, Stephen W. and Purvis, Leigh, Trends in Retail Prices of Brand Name Prescription Drugs Widely Used by Older Americans: 2006 to 2013, AARP Public Policy Institute, Rx Price Watch Report #2014-03, November 2014. 38 pp. 17 The market basket for this analysis had 227 brand name prescription drug products. Some critics of the Rx Price Watch reports have suggested that brand name drug products in our market basket that subsequently face generic competition should be excluded from this analysis because they may be skewing the results upward. However, when only the 169 brand name drug products with no generic competition are considered, the average annual price change was 13.2 percent in 2013—higher than the 12.9 percent price trend shown in this report (for additional information and analysis, see Appendix B). 18 When measured as a 12-month rolling average and weighted by actual 2011 retail prescription sales to older Americans ages 50 and above, including Medicare beneficiaries. 19 The general inflation rate used in this report is based on the average annual rate of change in the Consumer Price Index-All Urban Consumers for All Items (seasonally adjusted) (CPI-U), Bureau of Labor Statistics series CUSR0000SA0.

9
Retail prices increased in 2013 for 97 percent (219 of 227) of the widely used brand name prescription drug products in the study’s market basket. All but two of these retail price increases (217 of 227) exceeded the rate of general economic inflation in 2013.
Retail prices for all 32 of the drug manufacturers with at least two brand name drug products in the study’s market basket increased faster than the rate of general inflation (1.5 percent) in 2013.
o Twenty-two drug manufacturers, including the “All Other” category, had average annual price increases for their brand name drugs of 10 percent or more during 2013.
All but two of the 46 therapeutic categories of brand name drug products had average annual retail price increases that exceeded the rate of general inflation in 2013, with price increases by therapeutic category ranging from 4.2 percent to 41.1 percent.
Figure 1. Average Annual Brand Name Drug Prices Continue to Grow Substantially More than General Inflation in 2013
5.7% 5.9%
7.9%8.4%
9.1%
11.5%12.3%
12.9%
3.2% 2.9%
3.8%
-0.3%
1.6%
3.1%
2.1%1.5%
2006 2007 2008 2009 2010 2011 2012 2013
Ave
rage
Ann
ual
% C
hang
e
Brand Name Drug Prices (227 top drug products) General Inflation (CPI-U)
Note: Calculations of the average annual brand name drug price change include the 227 drug products most widely used by older Americans (see Appendix A). Prepared by the AARP Public Policy Institute and the PRIME Institute, University of Minnesota, based on data from Truven Health MarketScan® Research Databases.

10
Figure 2 shows the percent change in brand name drug prices for each month compared with the same month in the previous year. This trend is shown alongside the 12-month rolling average to allow more detailed examination of the rate and timing of retail brand name drug price changes over the entire study period. This analysis reveals three broad trends since implementation of the Medicare Part D program:
The retail price of brand name drug products has steadily increased over time since 2006; Brand name drug price increases at the retail level have been substantially higher than the
rate of general inflation; and
The gap between the rate of brand name drug price change and the rate of change in general inflation has substantially widened over the period from 2006 to 2013. This gap has ranged from less than a two-fold difference in 2006 to nearly a nine-fold difference in 2013.
Figure 2. Rolling Average and Point-to-Point Changes in Retail Prices for Most Widely Used Brand Name Prescription Drugs Were Well Above Inflation from 2006 to 2013
Note: Calculations of the average annual brand name drug price change include the 227 drug products most widely used by older Americans (see Appendix A). Prepared by the AARP Public Policy Institute and the PRIME Institute, University of Minnesota, based on data from Truven Health MarketScan® Research Databases.
Retail prices for 97 percent (219 of 227) of the most widely used brand name prescription drug products had price increases in 2013 (Figure 6). Prices for 96 percent (217 of 227) of the most widely used brand name prescription drug products increased faster than the rate of general inflation (1.5 percent) in 2013.
-2.0%
0.0%
2.0%
4.0%
6.0%
8.0%
10.0%
12.0%
14.0%
16.0%
Dec
-05
Apr
-06
Aug
-06
Dec
-06
Apr
-07
Aug
-07
Dec
-07
Apr
-08
Aug
-08
Dec
-08
Apr
-09
Aug
-09
Dec
-09
Apr
-10
Aug
-10
Dec
-10
Apr
-11
Aug
-11
Dec
-11
Apr
-12
Aug
-12
Dec
-12
Apr
-13
Aug
-13
Dec
-13
Ann
ual %
Cha
nge
Annual Percent Price Change (wt. avg. for point-to-point from same month in previous year)Annual Percent Price Change (wt. avg. for 12-month rolling average)General Inflation (CPI-U)
Affordable Care ActpassedMedicare Part D becomes available
Brand name drugmanufacturers begin
providing coverage gap discounts

11
Among the 87 percent (197 of 227) of brand name drug products with annual retail price increases of more than 5.0 percent—or more than three times the rate of inflation—in 2013:
Nearly one-half (49.4 percent or 112 drug products) increased between 5.0 percent and 14.9 percent—that is, five to ten times the rate of general inflation in the economy; and
More than one-third (37.6 percent or 85 drug products) had an annual increase of 15.0 percent or more which is ten or more times the rate of general inflation in the economy.
Figure 3. Retail Prices Increased by More than 10 Percent in 2013 for Almost Two-Thirds of the Most Widely Used Brand Name Drugs
Note: Calculations were made using brand name drug price change from December 31, 2012 to December 31, 2013, and the analysis included the 227 brand name drug products most widely used by older Americans (see Appendix A). Prepared by the AARP Public Policy Institute and the PRIME Institute, University of Minnesota, based on data from Truven Health MarketScan® Research Databases.
-0.1% to -5.8% decrease8 Drugs
0.1% to 4.9% increase22 Drugs
54 Drugs
58 Drugs
55 Drugs
20.0% - 24.9% increase19 Drugs 25.0% - 197.5%
increase11 Drugs
10.0% to 14.9% increase
15.0% - 19.9% increase
5.0% to 9.9% increase
Percent Change in Retail Price(TOTAL = 227 Drugs)
12-Month Rate of General Inflation = 1.5%

12
Eight of the widely used brand name drug products in this study had unusually high 8-year cumulative price increases (i.e., the end of 2005 to the end of 2013). The brand name drug products with unusual price increases were:
Uroxatal 10 mg tablets are a drug product used to treat prostatic hypertrophy. This brand name drug product had a price increase of 512.7 percent—more than a six-fold increase—over the 8-year study period ending in 2013.
Solaraze Gel 3% is a transdermal topical drug product used to treat a severe skin condition. This brand name drug product had a price increase of 445.9 percent—more than a five-fold increase—over the 8-year study period ending in 2013.
Humulin R U-500—used to treat diabetes—had an 8-year price increase of 361.0 percent over the entire 8-year study period ending in 2013. This retail price increase shows more than a four-fold jump in price over 8 years.
o It is notable that the vast majority of this increase took place over the past 3 years (i.e., 2011 to 2013). Since insulins are biological products they currently do not have generic competition but they are likely to face entry from biosimilar products within the next few years.20
Prandin 2 mg tablets—another drug for diabetes—had an 8-year price increase of 295.3 percent over the entire 8-year study period. This retail price increase is nearly a four-fold jump in price from 2006 to 2013.
Atrovent HFA 17 mcg/actuation—a respiratory inhaler and bronchodilator—increased in retail price by 252.4 percent over the 8-year study period. This retail price increase is more than a three-fold jump in price over 8 years from 2006 to 2013.
Benicar 40 mg tablets—used to treat hypertension—had a price increase of 207.1 percent over the 8-year study period ending in 2013. This retail price increase is more than a three-fold growth in price over 8 years.
Lunesta 3 mg tablets (and Lunesta 2 mg tablets)—drug products used for sedation—had an 8-year retail price increase of 203.7 percent. This retail price increase represents a three-fold price jump in 8 years.
Generic Drug Price Trends for 2013. The trends reported here are annual price changes based on the 12-month rolling average for the period from December 31, 2012 to December 31, 2013. So let’s examine preliminary findings from the generic drug price trend analysis for 2013. In the past several years (i.e., 2006 to 2012), the average generic price for widely used drugs decreased with the amount ranging from -7.2% to -14.5%. While the final data for 2013 has not yet been completed, the generic price effect for 2013 is also expected to be a decrease, but not as much of a decrease as seen in the previous years of the study (i.e., 2006 to 2012). The generic market basket included 280 drug products widely used by older Americans. Nearly one-third (32.5%) of these generic drug products (91 of 280 drug products) had an annual price increase rather than a price decrease in 2013 (i.e., December 31, 2013 versus December 31,
20 L.S. Rotenstein, N. Ran, J.P. Shivers, M. Yarchoan, and K..L. Close, “Opportunities and Challenges for Biosimilars: What’s on the Horizon in the Global Insulin Market?” Clinical Diabetes, Vol. 30(4) (2012): 138-150.

13
2012). Fifty-four (about 20%) generic drug products had an increase of 15% or more in 2013 and twenty-seven (about 10%) generic drug products had an increase of 50% or more in 2013. This market basket was based on outpatient prescription drugs widely used by older Americans. A list of the generic drug products with price increases in 2013 is attached as Appendix A. More than one-half of the widely used generic drug products had an average cost per day of therapy of less than $0.50. (See Figure 4). The good news is that the number of lower cost generics has increased. And, the bad news is, as noted above, that one-third of the widely used generic drugs products had price increases. Figure 4. Percent of Generic Drug Products by Retail Price per Day of Therapy: (December 31, 2012 vs. December 31, 2013)
0%
10%
20%
30%
40%
50%
60%
70%
80%
90%
100%
Jan 1, 2005
May 1, 2005
Sep 1, 2005
Jan 1, 2006
May 1, 2006
Sep 1, 2006
Jan 1, 2007
May 1, 2007
Sep 1, 2007
Jan 1, 2008
May 1, 2008
Sep 1, 2008
Jan 1, 2009
May 1, 2009
Sep 1, 2009
Jan 1, 2010
May 1, 2010
Sep 1, 2010
Jan 1, 2011
May 1, 2011
Sep 1, 2011
Jan 1, 2012
May 1, 2012
Sep 1, 2012
Jan 1, 2013
May 1, 2013
Sep 1, 2013
% of Most Widely UsedGeneric Drug Products
Medicare Part D Affordable Care ActEarly Provisions Began
Affordable Care ActCoverage Mandate Began
$0.01 to $0.24 per Day
$0.25 to $0.49 per Day
$0.50 to $1.99 per Day
$2.00 to $4.99 per Day
$5.00 or More per Day

14
Expected Generic Drug Price Trends. The importance of A-rated generic competition can hardly be overstated. Since the FDA has determined that A-rated generics are identical in all material respects (“pharmaceutically equivalent” and “bioequivalent,” and thus “therapeutically equivalent”) to a particular brand name drug and these generics can therefore be substituted for the brand name drug by the pharmacist (unless explicitly prohibited) without the intervention of the physician. When a consumer presents a brand name prescription to a pharmacist, mandatory and permissive state drug substitution laws (present in all U.S. states and territories) allow, encourage, and often require the pharmacist to substitute an FDA-approved, A-rated generic version for the brand name drug prescribed. Effective price competition for drug products within a drug molecule market, does not typically begin until substitutable, A-rated generic versions of that same molecule enter the market. FDA-approved, A-rated generics typically are priced substantially below their brand name counterparts. Once an A-rated generic enters the market unimpeded, a large share of purchases of the brand to which the generic is A-rated switches to the generic almost instantaneously, because the generic is identical to the brand, substantially less-expensive, and easily and routinely substitutable by the pharmacist without the intervention of the physician. Both the price differential between the brand and its A-rated generic equivalents, and the proportion of the market for the “molecule” (typically the brand and its A-rated generic equivalents) captured by the A-rated generics, generally increase rapidly over time, and follow a predictable pattern. This pattern has been extensively studied and is generally accepted as an inherent feature of the pharmaceutical industry.21 The prices of A-rated generic drugs drop even further as additional generic competitors for a given drug molecule enter the market. The first A-rated generic competitor generally prices at a level of approximately 15% to 25% below the brand name price. As more A-rated generic products enter into the market, the prices of generics typically continue to decline both in absolute terms and in relation to the brand name price, a trend that typically persists for five years, or more. Generic prices eventually reach as low as 10% to 20%, if not lower, of the pre-generic entry brand name price when an equilibrium, or market-clearing, price point is finally reached. When A-rated generic competition is unimpeded, the brand name drug rapidly loses sales because the lower-priced, A-rated generic(s) are being routinely substituted by pharmacists, often with the encouragement of private and public managed care organizations (through which more than 85% of prescriptions in the U.S. now flow). There are two primary mechanisms by which managed care organizations encourage A-rated generic substitution: (1) by establishing a lower member copay for A-rated generic drug products; and, (2) by setting a maximum allowable cost (MAC) for the drug product reimbursement that pharmacies will be paid for A-rated generic drug products.
21 See footnote 10.

15
Observed Generic Drug Price Trends in 2013. The pattern of generic drug prices over time for the widely used drug products in the 2013 market basket was examined at the individual drug product level. First, we found that there were a number of generic drug products whose prices performed as expected in the market. That is, the generic drug product enters the market at a price 10% to 25% below the brand name price and then the generic price rapidly declines over time until a market leveling price is reached. For example, Figure 5 show Tamsulosin 0.4 mg capsules which entered the market with an actual retail transaction price22 of about $3.55 per day of therapy (16% below the AWP) and the price rapidly declined to under $0.50 per day or about 10% of the AWP (average wholesale price—a list price) and very close to the WAC (wholesale acquisition price—another benchmark price). A number of the widely used generic drug products had this expected pricing pattern. A variant on the expected generic pricing pattern was also observed for generic drug products that had some form of formal or functional exclusivity in the market from one or more of the following: (1) an FDA granted exclusivity period; (2) entry of an authorized generic licensed from the NDA holder; (3) an FDA granted 180-day generic exclusivity period; (4) an at-risk generic launch while a patent challenge is on-going in the courts; (5) a pay-for-delay generic situation; or (6) other reasons for delay of more than one true generics entering the market. For example, see Figure 6 (Sertraline HCl 50 mg tablets, Greenstone). This generic entered the market and was able to hold near its entry level price for about 6 months. In this case, the generic sertraline is marketed by Greenstone, which is a generic firm affiliated with Pfizer—the original marketer of the brand version of sertraline known as Zoloft. A second example of delayed generic competition can be seen in Figure 7 (Pantoprazole Sodium 40 mg tablet DR, Teva Pharmaceuticals). The delay in generic price competition for this drug product was secondary to the at-risk launch of several generic versions before the patent had expired and during the time in which the patent challenge was on-going in the courts. Note that the delay in effective price competition was about three years (Dec. 2007 to Jan. 2011). Once, the challenged patent did expire; then, the typical rapid price decline expected from generic drug products was observed. There were several generic drug products whose price rose over time after generic entry. See Figures 8, 9 and 10. The generic drug products presented in these figures include an oral suspension, an ophthalmic solution, and a delayed release tablet formulation. In many ways the price pattern of these generic drug products exhibits the traits commonly seen for a brand name drug product. Often generic drug products that are unique dosage forms (e.g., oral liquids; topical ointments, creams, and patches; ophthalmic products; injectable products; or other unique dosage forms) will have pricing behavior like a brand name drug product. Even though a generic drug product market for oral solid dosage forms (i.e., tablets or capsules) may be able to support entry of several generic firms, the market demand for these more unusual dosage forms is often quite limited and may only be able to support one firm in the market. Consequently, the one firm in the
22 See footnote 15.

16
market may be able to function as if it had market exclusivity, even though it does not formally have any exclusivity. This functional market exclusivity may allow a generic drug product to raise its price at one point in time or over time. As noted earlier, nearly 20% (27 of 280) of the widely used generic drug prices saw an annual price increase of 50% or more in 2013. At the top of the list of generic drug products with extraordinary price increases were doxycycline hyclate 100 mg capsules (West-Ward) (see Figure 11) and doxycycline 100 mg tablets (West-Ward) with annual increases of 2,048% and 1,897%, respectively in 2013. One strategy to thwart generic substitution is to change the dosage form (i.e., tablet to capsule, or tablet to tablet extended release), since different dosage forms of the same drug molecule cannot be substituted without the doctors express written permission. Other generic drug products with extremely high annual price hikes in 2013 were: digioxin 0.125 mg tablets (Lannett) (Figure 12) with an increase of 103% and digioxin 0.25 mg tablets (Lannett) with an increase of 82%; divalproex sodium 500 mg tablets (Mylan) (Figure 13) with an increase of 432%; prednisolone acetate suspension 1% suspension (Sandoz) (Figure 14) with an increase of 349%; levothyroxine sodium at 9 different strengths (Mylan) (Figure 15) with annual increases ranging from 44% to 63%; and glipizide 5 mg tablets (Mylan) (Figure 16) with an increase of 94%. Not all of the large price increases among the widely used generic drug products occurred in 2013. For example, hydralazine HCl 50 mg tablets (Par) (Figure 17) and meclizine HCl 25 mg tablets (Par) (Figure 18) each had increases of more than 100% in 2005 and 2008, respectively. While there are a number of generic drug products with very large price increases, this is not a new phenomenon. In July of 2008, I prepared a report for the joint Economic Committee of Congress that was presented by my colleague (Madeline M. Carpinelli). This report titled “Extraordinary Price Increases in the Pharmaceutical Market.”23 In this report, we identified drug products that had experienced one or more “extraordinary” price increases.24 Our study of 35,143 drug products (at the NDC level) found that 13.5% of them had experienced one or more extraordinary price increases in the period 1988 to 2008. While a few of these extraordinary price increases occurred in the 1990s, the vast majority were found in the 2000s. Clearly, the generic drug product price increases shown in these figures as a red line (the actual retail drug price per day of therapy) were dramatic. These price increases were passed on to the ultimate payer (commercial or government programs) and did increase the amount of their expenditure for these generic prescripitions.
23 Madeline M. Carpinelli and Stephen W. Schondelmeyer, Statement on Extraordinary Price Increases in the Pharmaceutical Market, presented to the Joint Economic Committee of the United States Congress, by Madeline M. Carpinelli, PRIME Institute, University of Minnesota, July 24, 2008, 11 pp. 24 The term “extraordinary” price increase was defined as “any price increase that is equal to, or greater than, 100% at a single point in time.
17
Signals of Market Failure in the Pharmaceutical Market The market for drugs does not operate in the same way as most other markets in the United States, where the consumer freely chooses a product. Various aspects of the market for prescription drugs make it unique, including the fact that certain drugs, i.e.., prescription drug products must be prescribed by one set of market players (physicians), dispensed by another market player (pharmacists), paid for by a third-party or market player (employers or the government via insurers or benefit managers, and sometimes partially by the consumer), and then ultimately consumed by the end user (the patient). One must understand and take into account the differing roles of each of these players, in order to understand how competition functions in the market for drugs. The pharmaceutical market possesses institutional structural features and related behaviors that result in an inefficient economic market as evidenced by the unusually large price increases for generic drug products and the extremely high initial prices of brand name drug products. The marketing of patented, single source drug products in the United States is a very unique market and has a number of atypical structural features. The patent for a drug molecule alone (and other related patents and exclusivities) creates a monopoly for a drug molecule (and related drug products) and will generate sales specifically for that molecule and related drug products, even if there are other similar molecules (and their related drug products) in the same therapeutic class. This unique market structure for pharmaceuticals is due largely to the fact that a prescription must be written by the doctor for a specific drug product and the consumer (patient) is not free to choose the drug product to be purchased, even if there are other drugs in the class that would work as well, or even better. The patient (consumer) must have the doctor’s permission slip (i.e., prescription) and the pharmacist must dispense the exact drug product prescribed by the doctor, unless an FDA-approved therapeutically equivalent generic version of the drug product is available on the market—typically as a lower cost substitute. The choice of the prescription drug product is driven by various types of “directed demand” including physicians who must prescribe the drug product; pharmacy benefit managers (PBMs) who establish formularies and manage networks of pharmacies to dispense prescriptions; pharmacies and pharmacists who must dispense single source drugs when prescribed and who chose the manufacturer source from among available FDA-approved, therapeutically equivalent generic versions of an off-patent drug; insurers and managed care organizations who have risk for providing health care for a prepaid premium; and employers who bear most of the cost for the prescriptions provided to their employees or government programs (e.g., Medicare and Medicaid) who bear most of the cost for the prescriptions provided to the recipients of these programs.

18
In recent years, the high prices for the new drug therapies has come under criticism for being excessive, unaffordable and unsustainable.25 The issue of high drug prices has been raised by patients, doctors, health plans, insurers, and by government programs such as Medicare and Medicaid.26 The various payers for drug therapy are not only complaining about the high price of individual drugs, but they are also beginning to raise concerns about the long term sustainability of the pricing patterns seen for innovative drug therapies. There has been an explosion of concern (and articles about) very high drug prices for new and, sometimes, innovative drugs introduced in the United States. One recent story in the Wall Street Journal detailed the reaction of physicians at Memorial Sloan Kettering in New York when faced with a new drug whose price was almost double the standard therapy, yet was not appreciably safer or more effective.27 Not only were the physicians upset by the exorbitant pricing of this new cancer drug, but also private insurers and the federal Medicare program have expressed concerns.28 In October 2014, “Medicaid chiefs from red and blue states are urging Congress to stem the cost of revolutionary new drugs for hepatitis C, cancer, and other diseases.”29 A recent New York Times editorial argued that “Medicare should consider withdrawing coverage for high-priced cancer drugs that have “modest” benefits.30 Some have argued that the high prices are needed to fuel the fire of innovation, but others have suggested that “the market is telling us the opposite: that prices have become the prize.”31 One of the more recent drugs to enter the market at an astronomical price is Sovaldi—used to treat patients with hepatitis C. Solvadi costs about $84,000 per course of therapy in the U.S., while in other countries the price is as low as $900 to $2,000 per course of therapy.32 Gilead Sciences, the company that markets Sovaldi, had a triple digit rise in profits in early 2014 after introduction of its new drug.33 Another drug therapy for hepatitis C has just been approved by FDA (October 2014). This new hepatitis C drug, Harvoni, is also marketed by Gilead Sciences and has an even higher price tag--$94,500 for a 12-week course of treatment.34
25 Lee, Jaimy. Sovaldi fuels triple-digit rises in Gilead revenue and profits. Modern Healthcare. October 28, 2014.; see also, Silverman, Ed. ‘Financial Toxicity:’ Who’s Really to Blame for High Cancer Drug Prices? The Wall Street Journal, October 7, 2014. 26 Comments on pricing by patients, doctors, health plans, insurers, and by government programs such as Medicare and Medicaid. 27 Silverman, Ed. ‘Financial Toxicity:’ Who’s Really to Blame for High Cancer Drug Prices? The Wall Street Journal, October 7, 2014. 28 Herper, Matthew. Could High Drug Prices Be Bad for Innovation? Forbes, Oct. 23, 2014. 29 Associated Press. States Ask Congress to Intervene on Drug Prices. ABC News. Oct. 26, 2014. Found at this website: http://abcnews.go.com/Health/print?id=26524476 11/. 30 Howard, Paul. High-Priced Cancer Drugs: Are They Worth It? The New York Times. July 8, 2011. 31 Herper, Matthew. Could High Drug Prices Be Bad for Innovation? Forbes, Oct. 23, 2014. 32 Whitman, Debra B., Executive Vice President for Policy, Strategy and International Affairs, AARP. Expensive New Hepatitis C Drug Raises Alarms. Huffington Post, 05/27/2014. 33 Lee, Jaimy. Sovaldi fuels triple-digit rises in Gilead revenue and profits. Modern Healthcare. October 28, 2014. 34 Lee, Jaimy. Sovaldi fuels triple-digit rises in Gilead revenue and profits. Modern Healthcare. October 28, 2014.

19
The high price of Sovaldi has had such a dramatic impact that “many payers and pharmacy benefit managers have begun to push back against Sovaldi's price, with some threatening to stop using the drug once a rival medicine is approved in the United States. State Medicaid directors have also raised concerns, saying that taxpayers will have to shoulder much of Sovaldi's costs since many hepatitis C patients get their health care from the government.”35
The debate surrounding the price of Sovaldi is part of a much larger issue related to escalating specialty drug prices that are widely viewed as unsustainable. “Specialty drugs now account for 28 percent of total drug spending in the U.S. even though they make up less than 1 percent of all prescriptions.”36 In fact, high price is the most frequently cited characteristic defining the new class of drugs that we call “specialty drugs.”37 In addition, to being high cost, the specialty drugs also have a high rate of patient cost-sharing. Specialty drugs are placed by commercial and by Medicare Part D plans in a separate “Tier 4” or specialty tier. The specialty tier usually uses a percentage co-insurance rather than a fixed rate coapy.38 The percentage of coinsurance as a cost share of the total prescription price may range from 20% to 50% and it is not unusual for a specialty prescription to cost $1,000 to more than $50,000 per prescription. Another new drug in the past few years, Alexion Pharmaceutical’s only drug, Soliris, has proved effective at treating the rare disease, atypical Hemolytic Uremic Syndrome (aHUS). This drug therapy has a price tag of one-half a million dollars per patient per year.39 As the Forbes reporter said, “That’s not a typo. By my reckoning Soliris is the priciest drug in the world.” (See: Herper, Matthew. The World’s Most Expensive Drugs, Forbes, 02-22-10). There are at least nine other drugs on the Forbes list that cost more than $200,000 a year for the average patient who takes them. Most of these very high cost drugs treat rare genetic diseases that afflict fewer than 10,000 patients. Since there are no other therapies for these diseases, the “biotech companies can charge pretty much whatever they want.”40 The battle over high drug prices is pitting large insurers against the drug companies. “The insurance lobby, America’s Health Insurance Plans, has criticized drugmakers for spiraling medicine prices.”41 “Whenever the high price of pharmaceuticals is in the news, drugmakers try desperately to change the subject and distract from the issue,” said a spokesman for the insurer lobby. The cost of medication in
35 Whitman, Debra B., Executive Vice President for Policy, Strategy and International Affairs, AARP. Expensive New Hepatitis C Drug Raises Alarms. Huffington Post, 05/27/2014. 36 Whitman, Debra B., Executive Vice President for Policy, Strategy and International Affairs, AARP. Expensive New Hepatitis C Drug Raises Alarms. Huffington Post, 05/27/2014. 37 EMD Serono Specialty Digest™, 10th Edition, Managed Care Strategies for Specialty Pharmaceuticals, 2014, p. 10. 38 EMD Serono Specialty Digest™, 10th Edition, Managed Care Strategies for Specialty Pharmaceuticals, 2014, p. 10. 39 Herper, Matthew. $500,000-A-Year Drug Is Bright Light for Phrma. Forbes. Oct. 21, 2010. 40 Herper, Matthew. $500,000-A-Year Drug Is Bright Light for Phrma. Forbes. Oct. 21, 2010. 41 Wayne, Alex. Cancer Patients Assail Insurer Policies on Costly Drugs. Bloomberg. Jun 11, 2014.

20
the United States might be higher than in other countries where there’s negotiated prices and trade agreements,”42 New brand name drugs have much higher prices in the United States than in other countries and their prices have been increasing at supra-competitive prices. Brand name drug prices in 2013 increased last year by 21.2%, while brand-name drug use dropped by 15.5%.43 Given the growing frustration of payers and concern about overall sustainability of drug price levels, at least two major consulting groups have released reports suggesting a new payment model for pharmaceuticals is needed. One of the consulting groups described that “Makers of brand-name pharmaceuticals are competing over a shrinking piece of the prescription drug pie… Several forces are changing the way pharmaceutical companies and other health organizations engage with one another and how they attach value to medications.”44 The second consulting group explained that “It is well established that large pharmaceutical companies tend not to compete on price, particularly in the largest market, the United States (U.S.).45 The consulting report went on to say, “By competing on price publicly, this would lower the cost of treatment for consumers, while arguably generating greater revenue for the company than received currently for these marginalized agents.”46 The market for pharmaceuticals appears to be failing when it comes to efficient resource use. The U.S. is the world’s largest drug market, yet the U.S. pays the world’s highest prices for prescription drugs. The PBMs who manage drug benefit programs for employers often make more revenue from drug manufacturer rebates and other payments than they make from administrative fees fees to their clients (i.e., employers or health plans). This raises serious issues of fiduciary responsibility and conflict of interest. The drug prescribers (i.e., physicians) are not necessarily price-conscious or price-sensitive when it comes to prescribing drugs. Consumers are told to engage in consumer-driven choice of health care, yet the price of prescription drugs is not readily available when the consumer is ready to make a decision about purchasing a prescription. Even if the physician and the consumer want to make price-conscious decisions, the real net cost of prescription drugs is hidden and is not transparent and available. In summary, the high price of drugs, whether brand name or generic, is a critical issue. Most payers are signaling that they cannot afford the level of resources needed, individually and collectively, to pay for new and innovative therapies at the prices that are being charged. Payers are accustomed to saving money by encouraging patients to appropriately use generic prescriptions. Now these payers are nervous because they see that generic drug prices are increasing by 100’s and 1,000’s of percents a year. Old generic drugs are being re-purposed
42 Wayne, Alex. Cancer Patients Assail Insurer Policies on Costly Drugs. Bloomberg. Jun 11, 2014. 43 Evans, Melanie. Healthcare prices are up, and patients are buying less. Modern Healthcare, October 28, 2014. 44 Health Research Institute, PWCHealth. Unleashing value. The changing payment landscape for the US pharmaceutical industry. May 2012 45 Gorkin, Larry. Time for pharmaceutical companies to compete on price regarding Non-Differentiated (“Me-Too”) Drugs. Eye for pharma. 2012. 46Gorkin, Larry. Time for pharmaceutical companies to compete on price regarding Non-Differentiated (“Me-Too”) Drugs. Eye for pharma. 2012.

21
therapeutically and their prices are increasing dramatically. These troubling trends in pharmaceutical spending indicate failures in the market for pharmaceuticals. A growing number of observers in the pharmaceutical market are calling for a new approach to pharmaceutical decision-making and to the pricing model for drug therapy. In other words, the market for pharmaceuticals is out of balance. Prices are not transparent. Without actual price data, it is not possible to make true value-based decisions. Certainly price is not the only issue in a value-based decision, but price is always an issue in value-based decisions. In many ways the pharmaceutical market is very asymmetric—the seller knows a lot more about the product than does the buyer. For example, drug manufacturers know much more about the safety, effectiveness, and cost of their drugs than does the physician, the PBM, the employer, or the consumer. Three Americans received the Nobel prize in economics in 2001 for their work defining the market for lemons.47 No; their work was not about little yellow fruits, but rather about the market for used cars and the effect of the imbalance in information between the buyer and the seller.48 Their work found that markets don’t work when there is asymmetry of information—that is, when the seller knows a lot more than the buyer, the seller can take advantage of that buyer. Since then, Joseph Stiglitz and some of his colleagues have developed much further the concepts of asymmetric markets, market signals, and their economic impact. “If there was ever a market that was asymmetric, it is health care and especially pharmaceuticals. The lessons we can learn from these Nobel Prize winners are that: (1) the imperfect markets are not “all-knowing and self-correcting,” (2) “imperfect information corrupts markets,” (3) “markets, when confronted with imperfections, may not be the best way to allocate resources,” and (4) “government must play a strong role in a market system, to prevent damage from imperfect information.”49 Policymakers and legislators continue to call health care a market—and in one sense health care is a market; however, health care is replete with imperfect information. While health care has some structural features that appear to be a market, the information in this market is very asymmetric. With so much ‘imperfect information’ throughout health care, efficient and effective policy decisions will not necessarily follow. We must recognize and address the issues of imperfect information in health care and assure that accurate, transparent, and useful information is available in the market in order for more effective market-based decisions to be made. The advice of the Nobel Prize winners is that “government must play a strong role in an imperfect market.” Government doesn’t have to run or dominate health care, but government has to set the rules for the game to correct for the many types of imperfect information. Government has to put some boundaries on the health care market so that it begins to function like an
47 Uchitelle, Louis, “3 Americans Awarded Nobel for Economics,” The New York Times, October 11, 2011. 48 Akerlof, George, “The Market for "Lemons": Quality Uncertainty and the Market Mechanism,” The Quarterly Journal of Economics, Vol. 84, No. 3 (Aug., 1970), pp. 488-500, Oxford University Press, URL: http://www.jstor.org/stable/1879431. 49 Louis Uchitelle, “3 Americans Awarded Nobel for Economics,” The New York Times, October 11, 2001.

22
economically efficient market again. Finally, the health care market is very asymmetric for a whole lot of reasons, such as the isolating effect of directed demand, and the insulating effect of insurance coverage. Insurance is a great thing, but in some ways it takes away the market function. Health insurance programs give the appearance of having a fairly low cost when one only focuses on the amount of copays made at the time of service. The consumer only sees the impact of the full cost of their health care a year later when the premiums increase, or when the employer does not provide a wage increase because health care cost went up. There are many forms of imperfect information about prescription drugs including, but not limited to, hidden prices, rebates, and discounts; undisclosed relationships and transactions; and complex technical products. This imperfect information may inhibit, or even prevent, value-based decisions at every level of the pharmaceutical market. Conclusions The prices and change in prices of both brand name and generic drug products have a direct impact on the costs borne by individual consumers and by all other payers. Brand name and generic drug price increases often result in higher out-of-pocket costs for beneficiaries at the pharmacy, especially for those who pay a percentage of drug costs rather than a fixed copayment. Higher brand name and generic drug prices are also passed along to consumers, or the end payer, in the form of increased premiums, higher deductibles, and other forms of cost sharing.50 Prescription drug price increases also affect taxpayer-funded programs like Medicare and Medicaid. For example, the Medicare Payment Advisory Commission recently attributed the majority of “excess” growth in Medicare Part D spending to growth in the average price of drugs provided to beneficiaries. Higher government spending driven by large drug price increases will eventually affect all Americans in the form of higher taxes, cuts to public programs, or both. If recent trends for brand name and generic drug prices and related price increases continue unabated, the cost of drugs will prompt increasing numbers of older Americans to stop taking necessary medications.51 This will lead to poorer health outcomes and higher health care costs in the future.52
50 D.I. Auerbach and A.L. Kellermann, “A Decade of Health Care Cost Growth Has Wiped Out Real Income Gains for an Average U.S. Family,” Health Affairs, Vol. 30(9) (2011): 1630-1636. 51 H. Naci, S.B. Soumerai, D. Ross-Degnan, F. Zhang, B.A. Briesacher, J.H. Gurwitz, and J.M. Madden , “Medication Affordability Gains Following Medicare Part D Are Eroding among Elderly with Multiple Chronic Conditions,” Health Affairs, Vol. 33(8) (2014): 1435-1443. 52 Z.A. Marcum, M.A. Sevick, and S.M. Handler, “Medication Nonadherence A Diagnosable and Treatable Medical Condition,” Journal of the American Medical Association, Vol. 309(20) (2013): 2105-2106.
23
The expansion of health care and prescription drug coverage has provided more Americans with access to important and valuable drug therapies. Given the expansion of the number of people with coverage for prescription drugs,53 without effective measures to evaluate and manage the appropriateness, utilization, and price of drug therapies—Congress has essentially written a blank check to the pharmaceutical firms. It is unclear what factors are driving the price levels and the continued price increases of brand name and generic prescription drugs. Policy makers interested in reducing the impact of brand name and generic prescription drug prices should focus on options that balance the need for pharmaceutical innovation with the need for improved health and the financial security of consumers and taxpayer-funded programs like Medicare and Medicaid.
53 A.M. Sisko, S.P. Keehan, G.A. Cuckler, A.J. Madison, S.D. Smith, C.J. Wolfe, D.A. Stone, J.M. Lizonitz, and J.A. Poisal , “National Health Expenditure Projections, 2013-23: Faster Growth Expected with Expanded Coverage and Improving Economy,” Health Affairs, Vol. 33(10) (2014): 1-10.

Appendix AActual Transaction Price Changes at the Retail Level for Widely Used Generic Drugs in 2013
(December 31, 2012 vs. December 31, 2013)
D F G H I J O T T T
National Drug
Code Generic Name Dose Form Strength ManufacturerUsual
Dose/ Day
Retail $/Day
(Median)
Retail $/Day
(Median)
% Change from
Same Mo. In
Previous Yr.
2012 (Dec. 31) 2013 (Dec. 31) 2013 v 2012
00143‐3142‐05 doxycycline hyclate Capsule 100 MG West‐Ward 2.00 0.34746$ 7.46247$ 2047.7%
00143‐2112‐05 doxycycline hyclate Tablet 100 MG West‐Ward 2.00 0.36154$ 7.21887$ 1896.7%
00378‐0473‐01 divalproex sodium Tablet ER 24 Hr 500 MG Mylan 2.00 1.01462$ 5.39401$ 431.6%
61314‐0637‐10 prednisolone acetate Suspension 1 % Sandoz 0.33 0.56934$ 2.55771$ 349.2%
00378‐0014‐01 methotrexate sodium Tablet 2.5 MG Mylan 1.00 0.74336$ 2.67062$ 259.3%
00603‐4975‐28 oxybutynin chloride Tablet 5 MG Qualitest 2.00 0.23875$ 0.55005$ 130.4%
68382‐0137‐01 losartan potassium Tablet 100 MG Zydus Pharmaceuticals (USA) 1.00 0.39322$ 0.87400$ 122.3%
00093‐8121‐01 doxazosin mesylate Tablet 2 MG Teva Pharmaceuticals USA 1.00 0.22447$ 0.47015$ 109.4%
00172‐5412‐11 fluconazole Tablet 150 MG Ivax Pharmaceuticals 1.00 1.76095$ 3.58117$ 103.4%
00527‐1324‐10 digoxin Tablet 0.125 MG Lannett 1.00 0.19652$ 0.39965$ 103.4%
00093‐7202‐98 pravastatin sodium Tablet 40 MG Teva Pharmaceuticals USA 1.00 0.26452$ 0.53696$ 103.0%
00378‐1105‐05 glipizide Tablet 5 MG Mylan 1.00 0.13780$ 0.26743$ 94.1%
00527‐1325‐10 digoxin Tablet 0.25 MG Lannett 1.00 0.21161$ 0.38406$ 81.5%
55111‐0180‐15 tizanidine HCl Tablet 4 MG Dr. Reddy's Laboratories 2.52 0.50050$ 0.88140$ 76.1%
00143‐1473‐10 prednisone Tablet 10 MG West‐Ward 3.00 0.31398$ 0.54257$ 72.8%
00093‐7201‐98 pravastatin sodium Tablet 20 MG Teva Pharmaceuticals USA 1.00 0.26420$ 0.44680$ 69.1%
00093‐7270‐98 pravastatin sodium Tablet 80 MG Teva Pharmaceuticals USA 1.00 0.46336$ 0.77111$ 66.4%
00378‐1817‐01 levothyroxine sodium Tablet 175 MCG Mylan 1.00 0.27772$ 0.45403$ 63.5%
00093‐8122‐01 doxazosin mesylate Tablet 4 MG Teva Pharmaceuticals USA 1.00 0.22254$ 0.36244$ 62.9%
64679‐0926‐02 enalapril maleate Tablet 20 MG Wockhardt USA 1.00 0.13414$ 0.21386$ 59.4%
00378‐1805‐01 levothyroxine sodium Tablet 75 MCG Mylan 1.00 0.22007$ 0.34504$ 56.8%
00591‐0932‐01 oxycodone w/acetaminophen Tablet 10‐325 MG Watson Labs 5.00 2.51581$ 3.92472$ 56.0%
00378‐1110‐05 glipizide Tablet 10 MG Mylan 2.00 0.20166$ 0.31260$ 55.0%
00378‐1809‐01 levothyroxine sodium Tablet 100 MCG Mylan 1.00 0.22422$ 0.34703$ 54.8%
00378‐1807‐01 levothyroxine sodium Tablet 88 MCG Mylan 1.00 0.22853$ 0.34932$ 52.9%
00378‐1819‐01 levothyroxine sodium Tablet 200 MCG Mylan 1.00 0.29933$ 0.45710$ 52.7%
00378‐1811‐01 levothyroxine sodium Tablet 112 MCG Mylan 1.00 0.25125$ 0.38077$ 51.6%
00378‐1815‐01 levothyroxine sodium Tablet 150 MCG Mylan 1.00 0.26280$ 0.39359$ 49.8%
00378‐1813‐01 levothyroxine sodium Tablet 125 MCG Mylan 1.00 0.25031$ 0.36775$ 46.9%
00406‐0512‐01 oxycodone w/acetaminophen Tablet 5‐325 MG Mallinckrodt Pharm 6.00 1.01691$ 1.48719$ 46.2%
00378‐5222‐93 omeprazole Capsule DR 40 MG Mylan 1.00 0.54705$ 0.78619$ 43.7%
00378‐1800‐01 levothyroxine sodium Tablet 25 MCG Mylan 1.00 0.18659$ 0.26770$ 43.5%
00591‐5443‐01 prednisone Tablet 20 MG Watson Labs 2.00 0.37382$ 0.51585$ 38.0%
00093‐0771‐98 pravastatin sodium Tablet 10 MG Teva Pharmaceuticals USA 1.00 0.29679$ 0.40647$ 37.0%
00172‐4280‐60 verapamil HCl Tablet ER 240 MG Ivax Pharmaceuticals 1.00 0.39671$ 0.54330$ 37.0%
00378‐1803‐01 levothyroxine sodium Tablet 50 MCG Mylan 1.00 0.23054$ 0.31536$ 36.8%
00228‐2057‐50 lorazepam Tablet 0.5 MG Actavis Elizabeth 2.00 0.22872$ 0.30826$ 34.8%
00378‐2146‐05 spironolactone Tablet 25 MG Mylan 1.00 0.26174$ 0.34602$ 32.2%
59762‐0246‐01 donepezil hydrochloride Tablet 10 MG Greenstone 1.00 0.41614$ 0.54200$ 30.2%
00378‐1355‐05 triamterene & HCTZ Tablet 75‐50 MG Mylan 1.00 0.25753$ 0.33449$ 29.9%
64679‐0925‐02 enalapril maleate Tablet 10 MG Wockhardt USA 1.00 0.13353$ 0.16349$ 22.4%
68180‐0211‐09 losartan potassium Tablet 50 MG Lupin Pharmaceuticals 1.00 0.43096$ 0.52244$ 21.2%
00093‐0012‐98 pantoprazole sodium Tablet DR 40 MG Teva Pharmaceuticals USA 1.00 0.44873$ 0.54185$ 20.8%
45802‐0064‐05 triamcinolone acetonide Cream 0.1 % Perrigo Pharmaceuticals 15.00 0.98104$ 1.17596$ 19.9%
68180‐0589‐01 ramipril Capsule 2.5 MG Lupin Pharmaceuticals 1.00 0.35514$ 0.42522$ 19.7%
64679‐0924‐02 enalapril maleate Tablet 5 MG Wockhardt USA 1.00 0.13608$ 0.16240$ 19.3%
61314‐0144‐10 brimonidine tartrate Solution, Ophth 0.15 % Sandoz 0.33 4.48284$ 5.32053$ 18.7%
55111‐0158‐10 omeprazole Capsule DR 20 MG Dr. Reddy's Laboratories 1.00 0.33622$ 0.39661$ 18.0%
68180‐0468‐03 lovastatin Tablet 20 MG Lupin Pharmaceuticals 1.00 0.18572$ 0.21816$ 17.5%
00591‐5782‐01 atenolol & chlorthalidone Tablet 50‐25 MG Watson Labs 1.00 0.18238$ 0.21382$ 17.2%
68180‐0590‐01 ramipril Capsule 5 MG Lupin Pharmaceuticals 1.00 0.32890$ 0.38084$ 15.8%
00591‐0933‐01 oxycodone w/acetaminophen Tablet 7.5‐325 MG Watson Labs 6.00 3.23484$ 3.74394$ 15.7%
00378‐0032‐10 metoprolol tartrate Tablet 50 MG Mylan 2.00 0.16079$ 0.18564$ 15.5%
68462‐0248‐05 ranitidine HCl Tablet 150 MG Glenmark Pharmaceuticals 2.00 0.25081$ 0.28839$ 15.0%
00093‐7364‐98 losartan potassium Tablet 25 MG Teva Pharmaceuticals USA 1.00 0.33840$ 0.38390$ 13.4%
00093‐0787‐01 atenolol Tablet 25 MG Teva Pharmaceuticals USA 1.00 0.14570$ 0.16453$ 12.9%
00093‐0753‐01 atenolol Tablet 100 MG Teva Pharmaceuticals USA 1.00 0.14344$ 0.16184$ 12.8%
00093‐1049‐01 metformin HCl Tablet 850 MG Teva Pharmaceuticals USA 2.00 0.21528$ 0.24100$ 11.9%
00378‐0047‐10 metoprolol tartrate Tablet 100 MG Mylan 2.00 0.20293$ 0.22570$ 11.2%

Appendix AActual Transaction Price Changes at the Retail Level for Widely Used Generic Drugs in 2013
(December 31, 2012 vs. December 31, 2013)
D F G H I J O T T T
National Drug
Code Generic Name Dose Form Strength ManufacturerUsual
Dose/ Day
Retail $/Day
(Median)
Retail $/Day
(Median)
% Change from
Same Mo. In
Previous Yr.
2012 (Dec. 31) 2013 (Dec. 31) 2013 v 2012
59762‐4960‐01 sertraline HCl Tablet 25 MG Greenstone 1.00 0.21612$ 0.24020$ 11.1%
00093‐5711‐01 glyburide‐metformin Tablet 2.5‐500 MG Teva Pharmaceuticals USA 3.00 0.39331$ 0.43471$ 10.5%
00378‐0222‐01 chlorthalidone Tablet 25 MG Mylan 1.00 0.42865$ 0.47364$ 10.5%
00093‐5126‐01 benazepril HCl Tablet 20 MG Teva Pharmaceuticals USA 1.00 0.20180$ 0.22293$ 10.5%
00093‐5127‐01 benazepril HCl Tablet 40 MG Teva Pharmaceuticals USA 6.00 0.16005$ 0.17656$ 10.3%
00093‐6816‐73 budesonide Suspension 0.5 MG/2ML Teva Pharmaceuticals USA 2.00 7.42644$ 8.10935$ 9.2%
13668‐0010‐01 citalopram hydrobromide Tablet 20 MG Torrent Pharmaceuticals 1.00 0.13346$ 0.14555$ 9.1%
00591‐0503‐05 hydrocodone‐acetaminophen Tablet 10‐650 MG Watson Labs 4.10 1.03315$ 1.12119$ 8.5%
68180‐0591‐01 ramipril Capsule 10 MG Lupin Pharmaceuticals 1.00 0.42357$ 0.45841$ 8.2%
00172‐2083‐80 hydrochlorothiazide Tablet 25 MG Ivax Pharmaceuticals 1.00 0.09072$ 0.09807$ 8.1%
00115‐5522‐10 fenofibrate Tablet 160 MG Global Pharmaceutical Corp 1.00 1.68611$ 1.81553$ 7.7%
59762‐5033‐01 glipizide Tablet ER 24 Hr 10 MG Greenstone 1.00 0.48351$ 0.52045$ 7.6%
68180‐0501‐01 meloxicam Tablet 7.5 MG Lupin Pharmaceuticals 1.00 0.16250$ 0.17479$ 7.6%
00591‐0540‐05 hydrocodone‐acetaminophen Tablet 10‐500 MG Watson Labs 6.00 2.08695$ 2.24364$ 7.5%
00093‐5117‐98 diltiazem HCl Capsule CR 24 Hr 180 MG Teva Pharmaceuticals USA 1.00 0.66418$ 0.71179$ 7.2%
00591‐0241‐05 lorazepam Tablet 1 MG Watson Labs 2.00 0.23162$ 0.24723$ 6.7%
68180‐0517‐03 lisinopril Tablet 40 MG Lupin Pharmaceuticals 1.00 0.24411$ 0.25909$ 6.1%
00093‐5712‐01 glyburide‐metformin Tablet 5‐500 MG Teva Pharmaceuticals USA 3.00 0.54643$ 0.57981$ 6.1%
00591‐0844‐01 glipizide Tablet ER 24 Hr 5 MG Watson Labs 1.00 0.30863$ 0.32535$ 5.4%
00378‐0018‐01 metoprolol tartrate Tablet 25 MG Mylan 2.00 0.17307$ 0.18151$ 4.9%
00143‐1475‐10 prednisone Tablet 5 MG West‐Ward 1.00 0.08148$ 0.08508$ 4.4%
00574‐2008‐02 nystatin (Nystop) Powder 100000 UNIT/GM Paddock 3.99 4.21999$ 4.40523$ 4.4%
00172‐4096‐60 baclofen Tablet 10 MG Ivax Pharmaceuticals 3.00 0.25505$ 0.26388$ 3.5%
00781‐1123‐05 triamterene & HCTZ Tablet 37.5‐25 MG Sandoz 1.00 0.30536$ 0.31583$ 3.4%
64720‐0321‐10 metaxalone Tablet 800 MG Corepharma 3.00 10.74831$ 11.11366$ 3.4%
00555‐0612‐14 pramipexole dihydrochloride Tablet 0.25 MG Teva Pharmaceuticals USA 1.09 0.32922$ 0.33768$ 2.6%
00093‐0073‐01 zolpidem tartrate Tablet 5 MG Teva Pharmaceuticals USA 1.00 0.16205$ 0.16561$ 2.2%
00591‐0385‐05 hydrocodone‐acetaminophen Tablet 7.5‐500 MG Watson Labs 4.00 0.67209$ 0.68422$ 1.8%
59762‐4910‐05 sertraline HCl Tablet 100 MG Greenstone 1.00 0.23781$ 0.24187$ 1.7%
00603‐2115‐21 allopurinol Tablet 100 MG Qualitest 1.00 0.13313$ 0.13505$ 1.4%
00555‐0899‐02 estradiol Tablet 0.5 MG Teva Pharmaceuticals USA 1.00 0.13977$ 0.14165$ 1.3%
00093‐5171‐44 alendronate sodium Tablet 70 MG Teva Pharmaceuticals USA 0.14 0.30395$ 0.30660$ 0.9%

Appendix B
Actual Transaction Prices at the Retail Level for Widely Used Generic Drugs(January 1, 2005 to December 31, 2013)
Case Studies of Selected Drug Products

Figure 5. (January
Tamsulosin y 1, 2005 to D
HCl 0.4 mg December 31,
Capsule (Zy, 2013)
1
ydus Pharmaaceuticals) Prrice per Day of Therapy:
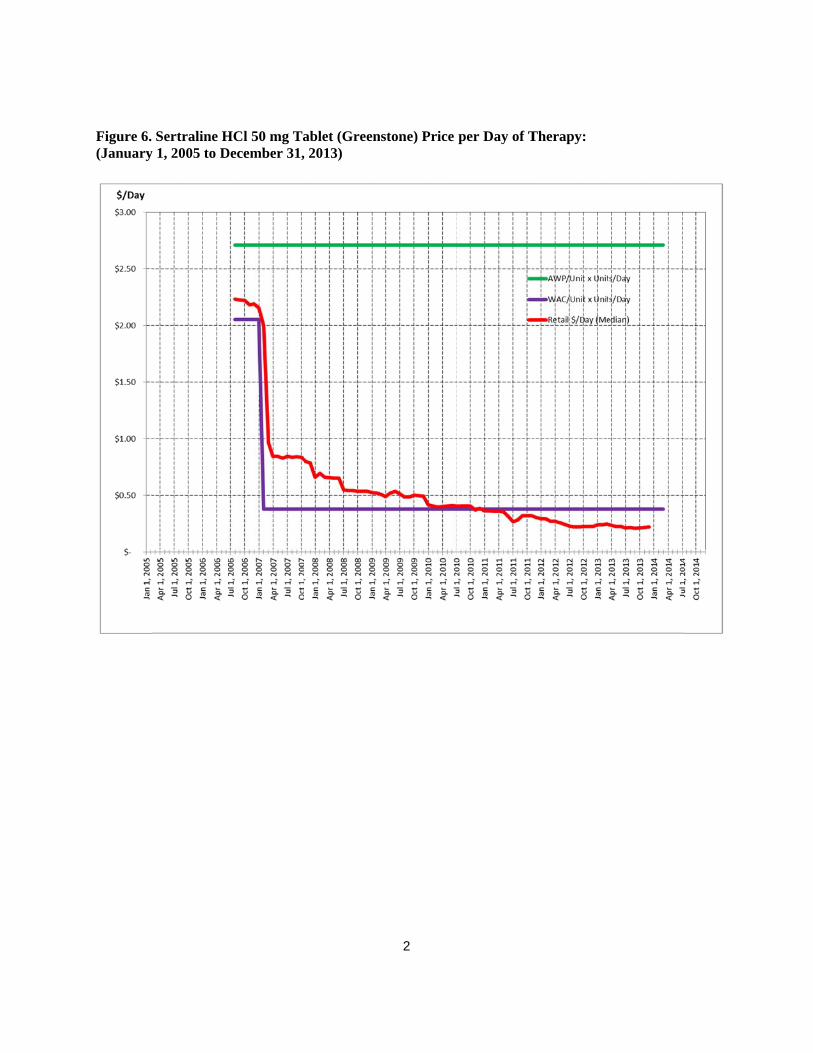
Figure 6. (January
Sertraline Hy 1, 2005 to D
HCl 50 mg TaDecember 31,
ablet (Green, 2013)
2
stone) Price per Day of TTherapy:
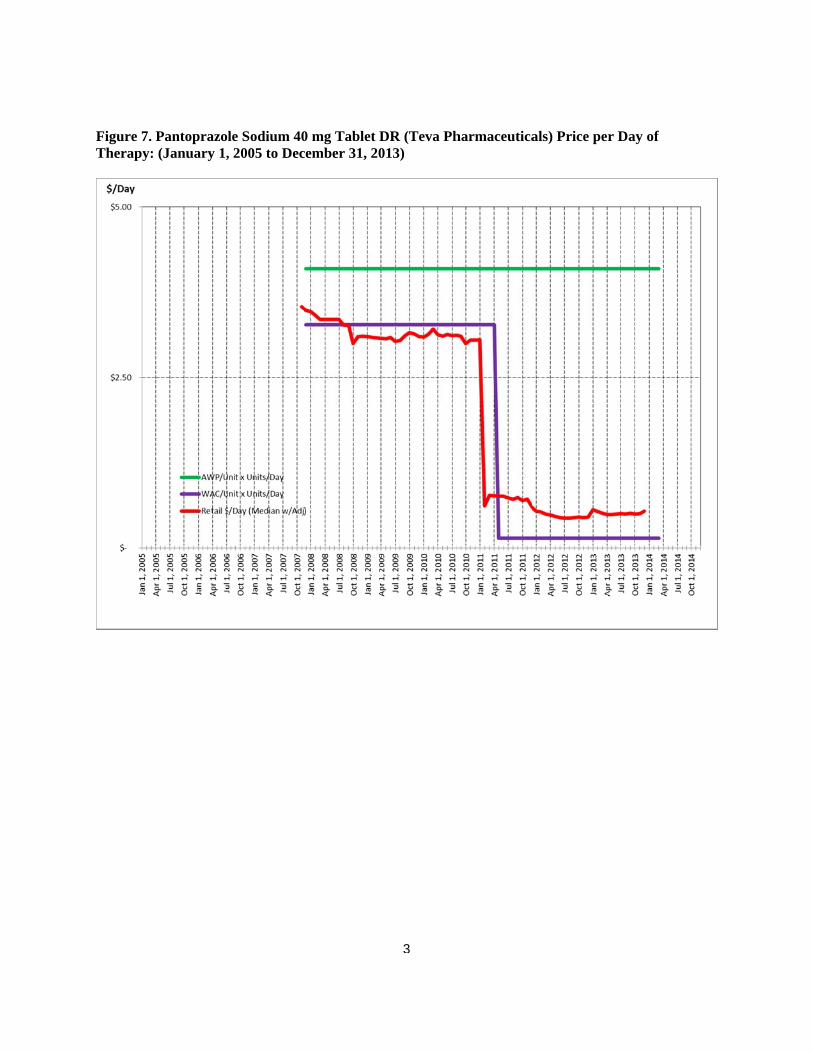
Figure 7. Therapy:
Pantoprazol: (January 1,
le Sodium 40, 2005 to Dec
0 mg Tablet Dcember 31, 20
3
DR (Teva Ph013)
harmaceuticaals) Price perr Day of

Figure 8. (January
Budesonide y 1, 2005 to D
0.5 mg/2ml December 31,
Suspension (, 2013)
4
(Teva Pharmmaceuticals) PPrice per Daay of Therapyy:

Figure 9. (January
Brimonidiny 1, 2005 to D
e Tartrate 0.December 31,
.15% Ophtha, 2013)
5
almic Solutioon (Sandoz) Price per Daay of Therapy:

Figure 10(January
0. Potassium y 1, 2005 to D
Chloride 10 December 31,
MEQ Capsu, 2013)
6
ule ER (Watson Labs) Prrice per Day of Therapy:

Figure 11(January
1. Doxycycliny 1, 2005 to D
ne Hyclate 10December 31,
00 mg Capsu, 2013)
7
ule (West-Waard) Price peer Day of Theerapy:

Figure 12(January
2. Digoxin 0.2y 1, 2005 to D
25 mg TabletDecember 31,
t (Lannett) P, 2013)
8
Price per Dayy of Therapyy:
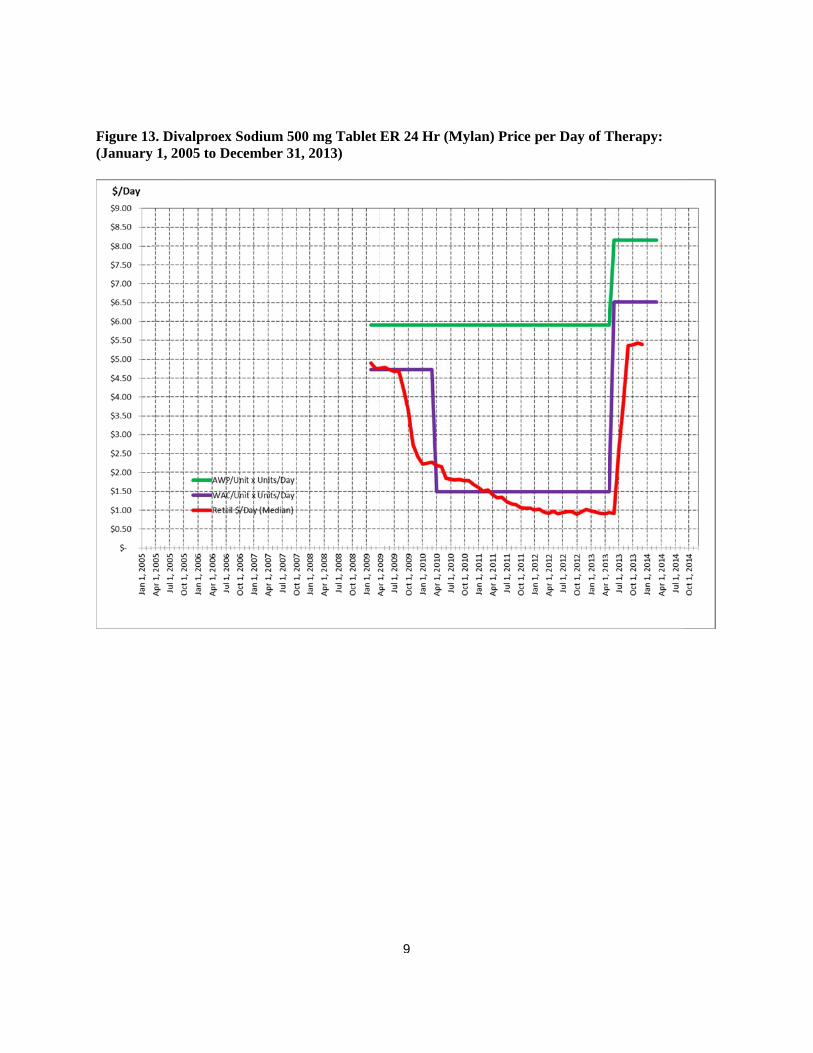
Figure 13(January
3. Divalproexy 1, 2005 to D
x Sodium 500December 31,
0 mg Tablet , 2013)
9
ER 24 Hr (MMylan) Price per Day of TTherapy:

Figure 1(January 1
4. Prednisolo1, 2005 to De
one Acetate 1ecember 31, 2
1% Suspensi2013)
10
ion (Sandoz) Price per Day of Therappy:
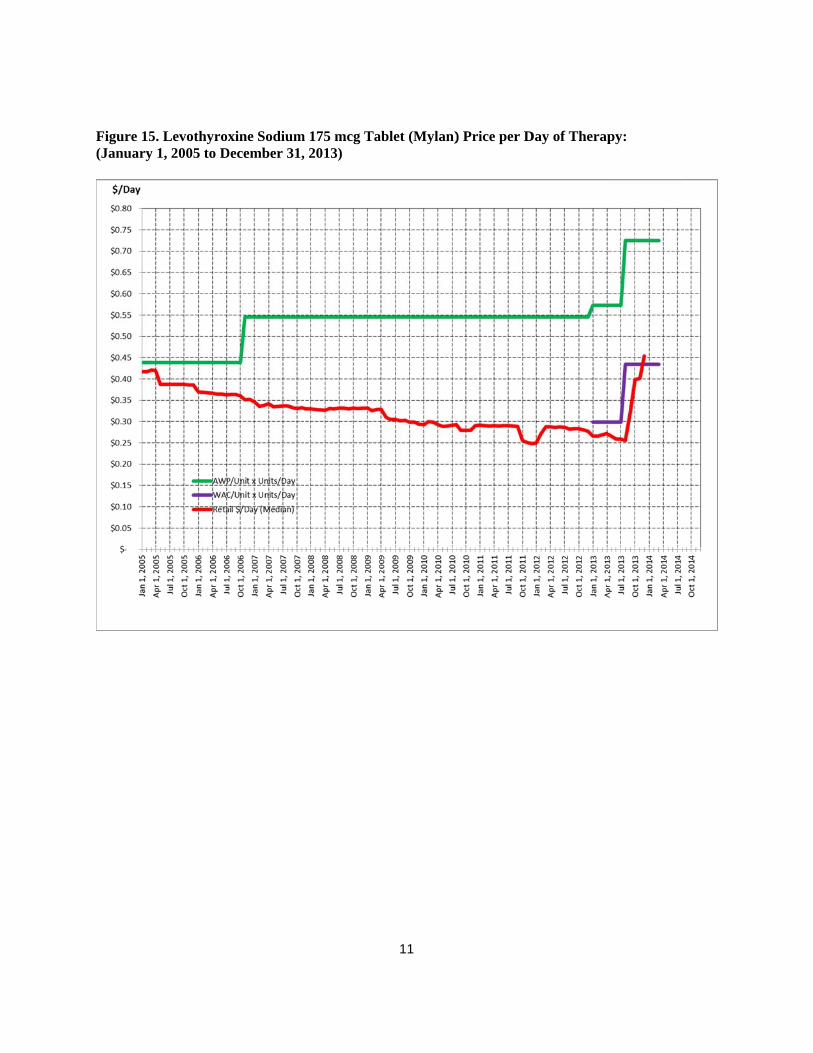
Figure 15(January
5. Levothyroy 1, 2005 to D
xine SodiumDecember 31,
m 175 mcg Ta, 2013)
11
ablet (Mylan)) Price per DDay of Therappy:
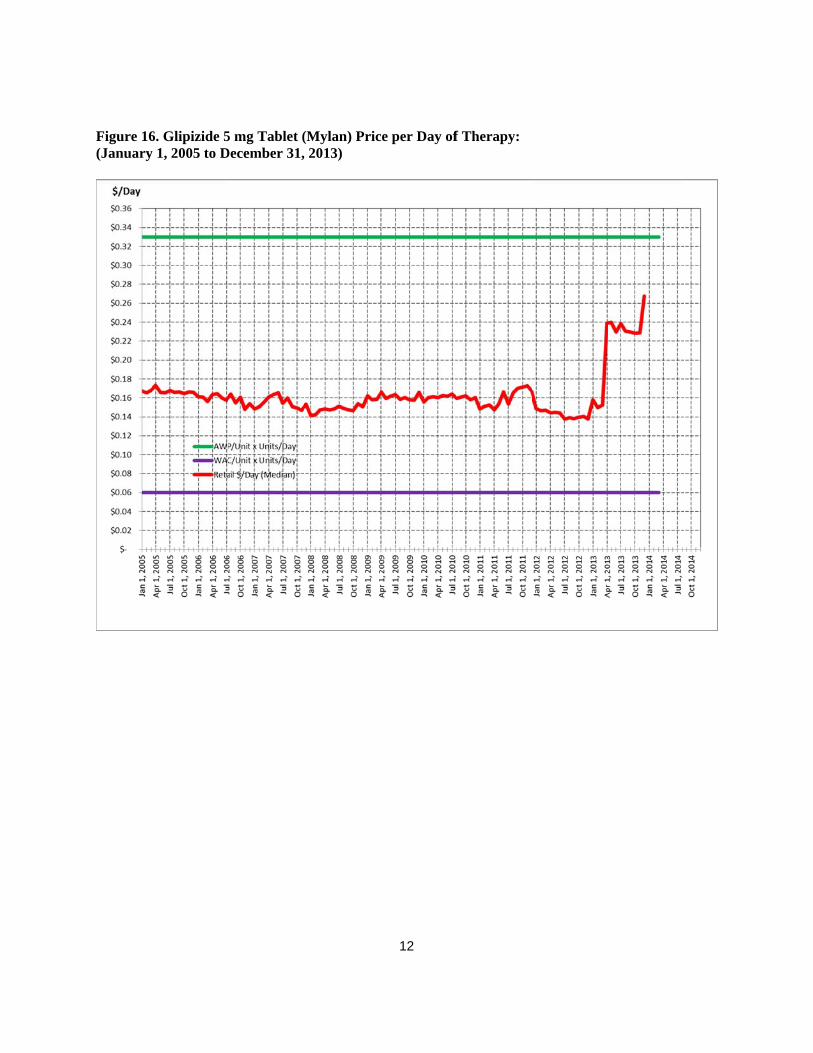
Figure 16(January
6. Glipizide 5y 1, 2005 to D
5 mg Tablet (December 31,
(Mylan) Pric, 2013)
12
ce per Day off Therapy:
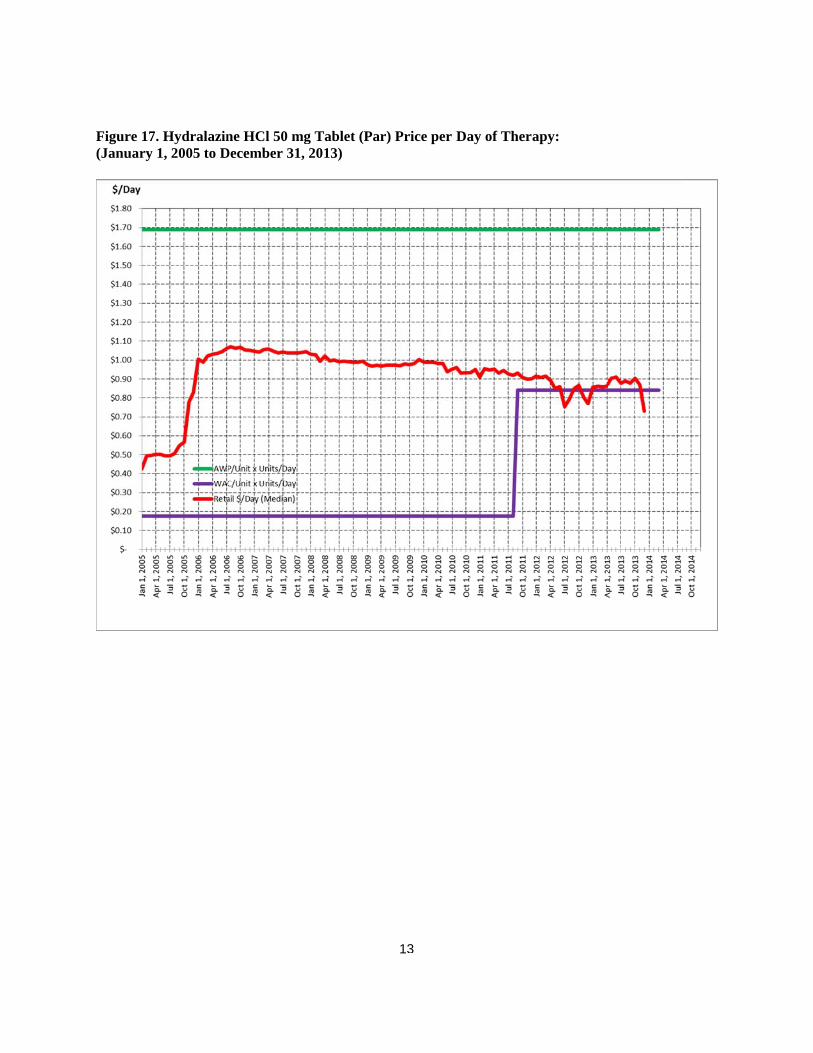
Figure 17(January
7. Hydralaziny 1, 2005 to D
ne HCl 50 mgDecember 31,
g Tablet (Pa, 2013)
13
r) Price per DDay of Therapy:
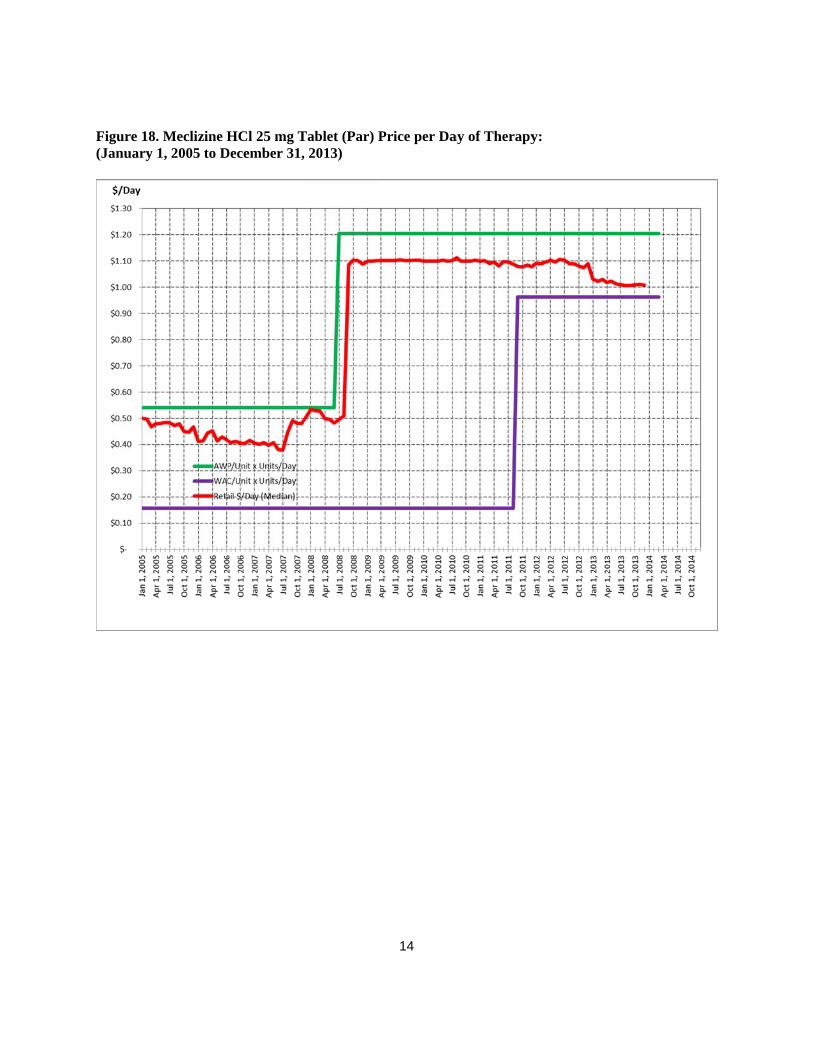
Figure 18(January
8. Meclizine Hy 1, 2005 to D
HCl 25 mg TDecember 31,
Tablet (Par) P, 2013)
14
Price per Daay of Therapyy: