why a pms implemented in 1989 is still a success and continously used
TRANSCRIPT

8/6/2019 Why a PMS implemented in 1989 is still a success and continously used
http://slidepdf.com/reader/full/why-a-pms-implemented-in-1989-is-still-a-success-and-continously-used 1/15
Why a PMS Implemented in 1989 is Still a Success and Continuously Used
Jørn R. KristiansenCarl Bro Pavement Consultants
Fuglesangsallé 166600 Vejen
DENMARK
Tel.: +45 76 34 73 73
Fax.: +45 76 34 73 74
E-mail: [email protected]
Privalte e-mail : [email protected]
ABSTRACT
A commonly known fact is that after a road authority’s first enthusiasm many PM systems are
not applied optimally. The reasons are many and varying and cover the fact that some of thesystems could not live up to the road authority’s expectations, that the service and follow-up
offered by the supplier was not as expected or that the road authority could not manage to
dispose the required resources for continuing the system. However, the purpose of this paper is
neither to describe reasons why nor backgrounds for not always succesfull PMS
implementations, as it is assumed that all experienced PMS people are already familiar with
these. The purpose of the paper is to describe how an agreement entered into by a Danish road
authority and an experienced PMS consultant taking the just mentioned facts into consideration
led to an on-going PMS success for the road authority as well as for the PMS consultant.
1. INTRODUCTION
In Denmark and in many other European countries PMS is applied at national, regional and local
levels. Today PMS optimises the road maintenance of approx. 75% of the road network in
Denmark. The tendency is the same in many other European countries (1). This is not least due
to the wide experience gained over the last 20 years of flexible PMS development in Denmark.
Initially the PMS development was not without problems and definitely not in connection with
the application of PMS at the regional and local levels. One of the primary reasons for this was
the fact that at these levels and especially at the local level no information about the existing road
network was available for the implementation of the PMS. Another reason was that at that time
as well as today only very few PM systems can handle and evaluate both national, regional andlocal roads at the same time. This is not only due to technical obstacles but very often also to the
political dimension, which inevitably forms part of a well-functioning PMS.
In Denmark the national road network amounts to 2% of the total road network. The regional
network amounts to 13% while the local road network (including all towns and cities) amounts
to 85% or approx. 65,000 km road administered by 275 municipalities.
This paper describes how a PMS was implemented with a road authority in 1989. A road
authority so certain about the value of the computed PMS calculations that they increased the

8/6/2019 Why a PMS implemented in 1989 is still a success and continously used
http://slidepdf.com/reader/full/why-a-pms-implemented-in-1989-is-still-a-success-and-continously-used 2/15
maintenance budget by a factor 12 in the first year. Eighty percent of this amount was financed
by external funds.
The paper also gives an account of how the PMS calculated yield and consequences turned out to
be more positive in the following years than predicted in the initial calculations. This fact was
given a very positive attention.
A description will be given of how the road authority in question has for 10 years been able to
keep its roads at a considerably higher service level for a considerably lower investment amount
than the rest of the road authorities in Denmark. A fact favoured and still followed very closely
by the politicians.
The paper will also describe how a contract was made between the road authority and the PMS
supplier in connection with the initial installation of the PM system. The purpose of this was to
select a number of test and reference road sections for a parallel test project made in cooperation
with the PMS supplier.
Eleven reference road sections were selected as representative of the 10 different conditions into
which the road network can be divided. The current deterioration of the pavements of these
sections and the influences coming from outside have been followed, recorded and supervised.
The basis on which the mentioned test sections were selected will be mentioned as well as how
they were divided into sections of 10x10 metre and how current and comprehensive analyses
were made on materials and soil conditions. Photos will be shown of the individual 10-meter
sections in connection with the annual condition surveys of the pavement surfaces and bearing
capacity measurements. Furthermore, it will be shown how daily measurements and registrations
were made of meteorological data, sounding of the groundwater level (which is high for some
sections) and how an artificial lowering of the groundwater level had both negative and positive
influence on the road deterioration.
Finally, an account will be given of, how the road authority has with great enthusiasm taken part
at both the technical and political level resulting in great success for both parties.
2. BACKGROUND
In 1988 a very large part of the road network in Ulfborg-Vemb Municipality had reached a point,
which meant that the service level of the 180 km road network was considered one of the worstin Denmark at that time. The consequence for Ulfborg-Vemb Municipality was that any
improvement and/or any attempt as a minimum just to stop the rapidly accelerating deterioration
of the roads would mean a considerable increase in the local taxes - an impossible requirement
due to other just as important tasks in the municipality. Another reason was that at that time the
Danish government had introduced penalty upon municipalities using too much money
compared to the budget levels already agreed upon. The municipality thus lacked documentation
for its claims that it would bee too expensive not to maintain the road network immediately. The
funds had in all cases to be found through alternative ways of financing and not by means of
further tax collection.
8/6/2019 Why a PMS implemented in 1989 is still a success and continously used
http://slidepdf.com/reader/full/why-a-pms-implemented-in-1989-is-still-a-success-and-continously-used 3/15
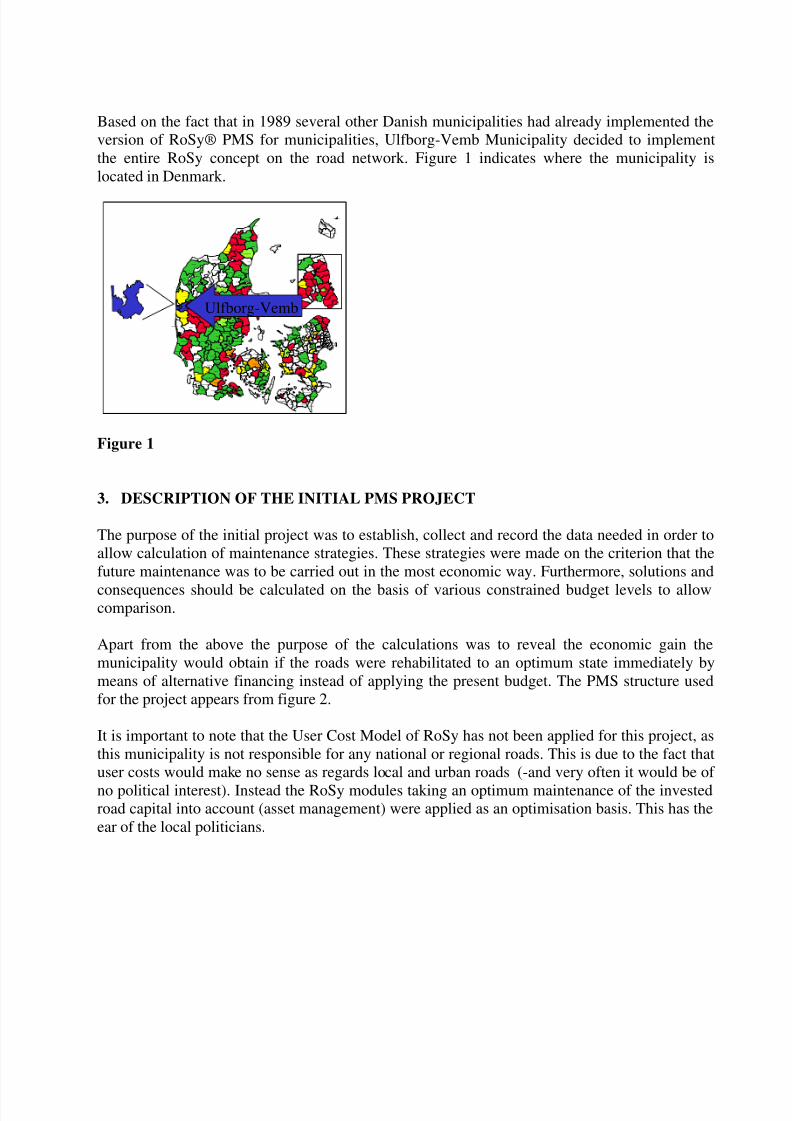
Based on the fact that in 1989 several other Danish municipalities had already implemented the
version of RoSy® PMS for municipalities, Ulfborg-Vemb Municipality decided to implement
the entire RoSy concept on the road network. Figure 1 indicates where the municipality is
located in Denmark.
Figure 1
3. DESCRIPTION OF THE INITIAL PMS PROJECT
The purpose of the initial project was to establish, collect and record the data needed in order to
allow calculation of maintenance strategies. These strategies were made on the criterion that the
future maintenance was to be carried out in the most economic way. Furthermore, solutions and
consequences should be calculated on the basis of various constrained budget levels to allowcomparison.
Apart from the above the purpose of the calculations was to reveal the economic gain the
municipality would obtain if the roads were rehabilitated to an optimum state immediately by
means of alternative financing instead of applying the present budget. The PMS structure used
for the project appears from figure 2.
It is important to note that the User Cost Model of RoSy has not been applied for this project, as
this municipality is not responsible for any national or regional roads. This is due to the fact that
user costs would make no sense as regards local and urban roads (-and very often it would be of
no political interest). Instead the RoSy modules taking an optimum maintenance of the investedroad capital into account (asset management) were applied as an optimisation basis. This has the
ear of the local politicians.
Ålborg
Åbybro
Sæby
Støvring
Skørping
Skagen
Sindal
Sejlflod
Pandrup
Nørager
Nibe
Løkken-Vrå
Løgstør
Læsø
Hobro
Hjørring
Hirtshals
Hals
Hadsund
Frederikshavn
Fjerritslev
Farsø
Dronninglund
Brønderslev
Brovst
Arden
Ålestrup
Viborg
Tjele
Thisted
Sydthy
Sundsøre
Spøttrup
Skive
Sallingsund
Møldrup
Morsø
Kjellerupkarup
Hvorslev
Hanstholm
Fjends
Bjerringbro
Århus
Them
Sønderhald
Skanderborg
Silkeborg
Samsø
Rønde
Ry
Rougsø
Rosenholm
Randers
Purhus
Odder
NørreDjurs
Nørhald
Midtdjurs
Mariager
Langå
Hørning
HinnerupHammel
Hadsten
Grenå
Gjern
Galten
Ebeltoft
Åskov
Vinderup
Videbæk
Ulfborg-Vemb
Trehøje
ThyholmThyborøn-Harboør
Struer
Skjern
Ringkøbing
Lemvig
Ikast
Holstebro
Holmsland
Herning
Egvad
Brande
Avlum-Haderup
Vejle
Vamdrup
Tørring-Uldum
NørreSnede
LunderskovKolding
JuelsmindeJelling
Horsens
Hedensted
Give
Gedved
Fredericia
EgtvedBørkop
Brædstrup
Ølgod
Vejen
Varde
Ribe
Holsted
Helle
Grindsted
Fanø
EsbjergBrørup
Bramming
Blåvandshuk
Blåbjerg
Billund
Åbenrå
Vojens
Tønder Tinglev
Sønderborg Sydals
Sundeved
Skærbæk
Rødekro
Rødding
Nørre Rangstrup
NordborgLøgumkloster
Lundtoft
Højer
Haderslev
Gråsten
Gram
Christiansfeld
Broager
Bredebro
Bov
Augustenborg
Årup
Årslev
Ørbæk
Ærøskøbing
VissenbjergUllerslev
Tranekær
Tommerup
Søndersø
Sydlangeland
Svendborg
Ryslinge
Rudkøbing
Ringe
Otterup
Odense
NørreÅby
Nyborg
Munkebo
Middelfart
Marstal
Langeskov
Kerteminde
Hårby
Gudme
Glamsbjerg
Fåborg
Ejby
Egebjerg
Broby
Bogense
Assens
Christiansø
Åkirkeby
Rønne
Neksø
HasleAllinge-Gudhjem
Vordingborg
Sydfalster
Suså
Stubbekøbing
Stevns
Sakskøbing
Rønnede
Rødby
Rudbjerg
Ravnsborg
Præstø
NørreAlslev
Næstved
Nysted
Nykøbing F
Nakskov
Møn
Maribo
Langebæk
Højreby
Holmegård
Holeby
Fladså
Fakse
Tølløse
Trundholm
Tornved
Svinninge
Stenlille
SorøSlagelse
Skælskør
Ringsted
Nykøbing-Rørvig
Korsør
Kalundborg
Jernløse
Høng
Hvidebæk
Holbæk
HaslevHashøj
Gørlev
Fuglebjerg
Dragsholm
Dianalund
Bjergsted
Vallø
Solrød
Skovbo
Roskilde
Ramsø
Lejre
Køge
Hvalsø
Gundsø
Greve
Bramsnæs
ØlstykkeStenløse
Slangerup
Skævinge
Skibby
Karlebo
Jægerspris
Hørsholm
Hundested
Hillerød
HelsingørHelsinge
Græsted-Gilleleje
Frederiksværk
Frederikssund
Fredensborg-Humlebæk
Farum
Birkerød
Allerød
Værløse
VallensbækTårnby
Ishøj
Søllerød
Rødovre
Ledøje-Smørum
HøjeTåstrup
Hvidovre
AlbertslundGlostrup
Gentofte
Dragør
Brøndby
Ballerup
Frederiksberg
København
Års
HerlevGladsaxe
Lyngby-Tårbæk
Ulfborg-Vemb

8/6/2019 Why a PMS implemented in 1989 is still a success and continously used
http://slidepdf.com/reader/full/why-a-pms-implemented-in-1989-is-still-a-success-and-continously-used 4/15
Figure 2. Structure of PMS modules for this project
3.1 Monitoring and condition survey
The following registrations and registration methods were selected:
- Inventory: Geometric data (length, width, shoulders, ditches, kerbs, etc.)
- Condition survey: Visual, max. 10 condition objects were selected.
- Thickness measurements on all sections using ground penetrating radar (GPR)
- Bearing capacity measurements (with FWD)
- Traffic census (AADT, ESAL)
3.1.1 Inventory
The geometric data was originally measured by means of DMI combined with width measuringdone with a runner and manually entered to RoSy BASE. Today the plans are to apply the fully
electronic CamSurvey method. Figure 3 gives an example of geometric data as this may be
presented in the database.
Figure 3. Example of presentation of geometric data in RoSy BASE
Start
Calculations
Constrainedbudget ?
CalculateMin. Cost
Plan
Input ofinventory &condition
data
Setup ofglobal
parameters
Setup ofglobalmodels
Min. CostPlan
Budget/YearMin.
conditonparameters
CalculateBudget Plans
BudgetPlans
Acceptable?
End
No
Yes
Yes
No
R o S y B A S E
R o S y P L A N
Setup of localparam./models
RoSy PMS - Flow ChartRoad ID
Geometry (lenght, width,road side elements etc.)
Condition (damages, bearing capacity, IRI etc)
Construction
Traffic
Maintenance methods (rutine, repair, general maintenance).
Costs, life, restictions etc. for maintenance methods
Parameters of calculation of VOC.
Parameters for calculation of value of road capital
Deterioration (damages, bearing capacity, IRI)
VOC models
Traffic forecastsValue of road capital
{
{
{
®

8/6/2019 Why a PMS implemented in 1989 is still a success and continously used
http://slidepdf.com/reader/full/why-a-pms-implemented-in-1989-is-still-a-success-and-continously-used 5/15
3.1.2 Condition survey
For this project a maximum of 10 condition objects were selected as being representative of the
functional condition of the road network. From this 9 objects were to form part of the
deterioration parameters to be applied for the maintenance calculations. Only some of the objects
were to be applied as an expression of the actual and wished service level for the 6 road classesthat Ulfborg-Vemb Municipality has chosen to work with. Figure 4 gives an example of a
condition window in RoSy BASE.
Figure 4. Example of recorded condition data
3.1.3 Thickness measurements (GPR) and bearing capacity measurements (FWD)
All roads were measured by means of GPR and recorded in RoSy BASE and at the same time
divided into homogeneous sections with similar pavement structures. Furthermore, the bearing
capacity of all road sections was measured by means of FWD twice a year. Applying the data on
pavement layer thickness, the expected future traffic load and the measured deflection data,
RoSy DESIGN (non-linear elasticity design program for FWD) calculated the present remaining
service life and necessary reinforcement. Figure 5 gives an example of the results of the GPR
and FWD measurements.
Figure 5. Result of GPR and FWD measurements
3.1.4 Traffic and axle load registration
Traffic census and recording of axle loads were conducted on selected sites. The measurements
were conducted as AADT and also the length of the vehicles was measured. On this basis ESAL
7815 Construction Thickness
0%
50%
100%
Section
T h i c h n e s s
Asphalt
Base
Subbase
Asphalt 140 140 60 60
Base 300 300 100 100
Subbase 0 0 280 280
1 2 3 4
7815 Reinforcement
05
101520253035
s e p - 9 1
m a r
- 9 2
s e p - 9 2
m a r
- 9 3
s e p - 9 3
m a r
- 9 4
s e p - 9 4
m a r
- 9 5
s e p - 9 5
m a r
- 9 6
s e p - 9 6
m a r
- 9 7
s e p - 9 7
m a r
- 9 8
s e p - 9 8
m a r
- 9 9
s e p - 9 9
Date
m m

8/6/2019 Why a PMS implemented in 1989 is still a success and continously used
http://slidepdf.com/reader/full/why-a-pms-implemented-in-1989-is-still-a-success-and-continously-used 6/15
was calculated in relation to the European Vehicle Classification. Figure 6 gives an example of
traffic data recorded in RoSy BASE.
Figure 6. Example of traffic data in RoSy BASE
3.1.5 Models, methods and products
A correct setup of the system is essential to allow RoSy® PMS to process the required technical
and economic optimisation. In the DOS version of RoSy applied at that time (1989), both
models, methods and to some extent the maintenance products and their properties were,contrary to what is the case today, hard-coded in the software and could not be changed by the
user as easily as today. However, the system applied at that time had been developed to allow an
optimum function under Danish conditions, which should in theory mean that the limitations
would not have any negative effect for the municipality. This also turned out to be the fact in the
following years.
As mentioned earlier, the application of vehicle operation costs (2) is not an interesting
parameter in connection with local and urban roads – particularly not in industrialised countries.
This is, however, the case with the value, depreciation and preservation of the invested road
capital. Figure 7 gives an example of the model for optimisation by Total Agency Costs.
Figure 7. Model for optimisation of Total Agency Costs

8/6/2019 Why a PMS implemented in 1989 is still a success and continously used
http://slidepdf.com/reader/full/why-a-pms-implemented-in-1989-is-still-a-success-and-continously-used 7/15

8/6/2019 Why a PMS implemented in 1989 is still a success and continously used
http://slidepdf.com/reader/full/why-a-pms-implemented-in-1989-is-still-a-success-and-continously-used 8/15
3.1.8 Calculation and optimisation
Detail description of the calculation and optimisation methodology in RoSy® PMS is not within
the scope of this paper. Only it should be mentioned that basically the system uses standard PMS
methodology for B/C, NPV, IRR calculation (3). However the methodology is adapted for
calculations of local and urban roads etc. in industrialised countries.
Figure 10 gives examples of the “3-D calculation task” being selection of the optimum
maintenance solution for each section (4) and illustrates the methodology (incremental
benefit/cost) for selecting optimum solutions for a road network based on constrained budgets.
dCOSTdCOST d
T T C
, d T A C
d T T C , d T A C
6,05,0Agency Costs (AC)
0
0,2
0,4
0,6
0,8
1
TTC or TAC
Incremental TTC/AC or TAC/AC
Figure 10. Example illustrating choice of optimum solution and use of incremental B/C forselection of solutions based on a constrained budget
3.2 How the results were applied
The calculations processed in 1989 showed that if the municipality chose to find alternative
funds for implementation of the most economic optimal solution instead of applying the
originally and totally insufficient road maintenance budget, then the municipality could over a
period of 10 years save a total of 15-16 mill. Danish kroner and at the same time obtain an
internal cash flow return (IRR) of 18% on the applied funds. Figure 11 illustrates the economic
relation between the two maintenance strategies.
Figure 11. The relation between the two maintenance strategies
-15
-10
-5
0
5
10
15
20
25
30
1 9 8 9
1 9 9 0
1 9 9 1
1 9 9 2
1 9 9 3
1 9 9 4
1 9 9 5
1 9 9 6
1 9 9 7
1 9 9 8
Year
D K K x
1 0 0 , 0
0 0
Minimum Investment
Optimum Investment
Accum. Cashflow(pay off) difference
Cashflow & Assetdifference

8/6/2019 Why a PMS implemented in 1989 is still a success and continously used
http://slidepdf.com/reader/full/why-a-pms-implemented-in-1989-is-still-a-success-and-continously-used 9/15
The economic facts were obviously very attractive, especially to the political administration of
the municipality but at the same time this collided with the cash flow constraints, but also the
constraints, which the Danish government had introduced (penalty). However, this did not stop
the politicians of the municipality in their efforts to secure that the future maintenance would be
conducted as optimally as possible. Having the certified calculations at their disposal, the
politicians negotiated with the Danish Ministry of the Interior in two rounds in 1989. The resultwas that the municipality succeeded in obtaining – without influence of the new law –
permission to provide the required funds to exceed already in the first year the original budget
for road maintenance not less than 10-12 times.
In 1990 the events became a press sensation in Denmark and both politicians and technicians of
the municipality were pleased. The funds were now available and now the next task was to have
the work carried out. This turned out to cause some problems. There were no contractors within
the area, who were geared to repair and maintain an entire road network from A to Z. Thus, the
project took two years to carry through.
The final result was that in 1990/91 Ulfborg-Vemb Municipality had obtained if not the best thenone of the best local road networks in Denmark as regards road condition.
The optimum standard on the road network meant that over the next many years only the annual
instalments on the non-recurring loan had to be paid and almost no expenses to the annual
maintenance. The question was now, whether the prognosis would proof correct in the years to
come. Would the deterioration of the roads happen faster or slower than predicted by RoSy
PMS? Were there any basic conditions that had not been taken into account?
Among other things, these questions led to the cooperation agreement mentioned under section 4
of this paper. This motivated both the municipality and the PMS supplier to follow the actual
development on the road network and currently check up on the quality of the initially processed
calculations with the purpose of improving the system currently if this was necessary.
3.3 The actual developmentIn the years that followed the actual development has till date turned to be more positive than
initially calculated both as regards economy and service level. One of the reasons for this was
that during the first years after the actual deterioration of the roads turned out to be slower than
the initial calculations predicted. However, a general lowering of the ground-water level in an
area of the municipality gave rise to some concern as contrary to all expectations it turned out
that the bearing capacity of some of the roads had been reduced. However, later the bearing
capacity stabilised at an even better level. Another factor was that in the mid-nineties Denmark had a number of mild winters with less frost/thaw than normally.
The parallel test sections (see section 4) confirm both the lowering of the ground-water level and
the mild winters. They also demonstrate that the deterioration of a road network seems to be
slow over a number of years. Then some pavement structure types can suddenly from one year to
another deteriorate heavily. Figure 12 gives an example of such a sudden development in defects
on one of the test sections.

8/6/2019 Why a PMS implemented in 1989 is still a success and continously used
http://slidepdf.com/reader/full/why-a-pms-implemented-in-1989-is-still-a-success-and-continously-used 10/15
Figure 12. Example of a sudden increase in the amount of defects on one of the parallel testsections
4. THE PARALLEL TEST PROJECT
The purpose of the parallel project to the PMS project in the municipality was to follow the
actual deterioration and maintenance needs of the roads in order to compare this data to the
needs calculated by the PM system. At the end of 1989 the municipality and the PMS supplier
thus entered into a five-year cooperation agreement. This agreement was later extended to 10
years and has recently been extended to 15 years. One of the parameters of the agreement is that
the municipality and the PMS supplier are obliged to contribute with 50% each. This has been a
very motivating strategy for both parties and has secured the very long life of this project.
The agreement contained the following written goal:
“To form the basis of further development and documentation of RoSy PMS and relatedproducts in a cooperation for the benefit of both users and suppliers”
4.1 Project scope
The following project scope was defined:
a. Selection and current monitoring of eleven 100-meter test sections being representative of
the entire network.
b. Definition and creation of a calculation model for the functional service life.
c. Selection of repair and maintenance methods and productsd. Test and suggestions as to future software development and definition of needs.
Below criteria were applied for the selection of the eleven test sections:
a. The sections were to be located near local wastewater cleaning plants out of consideration for
the daily registration of local climatic conditions.
b. The sections were to be with and without influence from ground-water level.
c. The sections were to be grouped in accordance with four types of traffic loading.
0971, 610-710
0,0%
10,0%
20,0%30,0%
40,0%
50,0%
60,0%
s e p - 9 0
s e p - 9 1
s e p - 9 2
s e p - 9 3
s e p - 9 4
s e p - 9 5
s e p - 9 6
s e p - 9 7
s e p - 9 8
s e p - 9 9
ChipLossBleedingRutting
SettlementsSpallsPotholesRavelingAlligatorcracksLargeCracksSmallCracks

8/6/2019 Why a PMS implemented in 1989 is still a success and continously used
http://slidepdf.com/reader/full/why-a-pms-implemented-in-1989-is-still-a-success-and-continously-used 11/15
d. A grouping in accordance with various road structure types.
e. A grouping in accordance with the actual condition (structural and functional).
f. A grouping in accordance with the functioning of drainage conditions (ditches/shoulders).
g. The sections could under no circumstances (regardless of future condition) be repaired. This
turned out to be a very important contractual condition, as some of the road sections over
time grew so poor that complaints were sent to the politicians of the municipality. Thesewere rejected with reference to the agreement.
The individual 100-meter sections were then divided into ten 10-meter sections. On each 100-
meter section the below items were investigated and still are:
a. Core taking/excavations and detailed material analyses (once). However, due to the fact that
the agreement was extended, further asphalt analysis was conducted.
b. Bearing capacity measurements by means of FWD in the same measuring points twice a
year.
c. Daily recording of temperature and precipitation.
d. Recording of traffic density (as required)e. Visual condition surveys of 10 condition objects once a year
f. Photo (bird’s eye view) at 10-meter intervals once a year (In September out of consideration
of the light intensity etc.) as a supplement to point e.
g. Insertion of measuring rods and weekly reading of the actual ground water level.
Figure 13 gives an example of 3 selected photos of the same ten meters on one of the test
sections. The initial condition in 1989 after 5 years and after ten years.
Figure 13. Example of visual condition of 10 meters of a test section in 1989, 1994 and 1999
4.2 Results
A characteristic factor for all test sections was that the deterioration cycle on the individual
sections over the first 5-6 years happened somewhat slower than the PMS calculations predicted.
This also appears from the PhD study made at The Danish Technical University carried out over
5 years of the project (5). On the contrary it seems like at the end of the 10-year period
something drastic began to happen on more of the sections. Figure 12 gives an example of this
development. Other sections have a more regular and logical defect development as illustrated in
figure 14.

8/6/2019 Why a PMS implemented in 1989 is still a success and continously used
http://slidepdf.com/reader/full/why-a-pms-implemented-in-1989-is-still-a-success-and-continously-used 12/15
Figure 14. Defect development on selected test sections
As it appears, the functional condition development varies from test section to test section. Also
the structural condition development has in some cases differed from the initial expectations.
As mentioned earlier the permanent lowering of the ground-water level in a larger area at first
resulted in roads with a poorer bearing capacity in this area (see figure 15). However, the period
with mild winters in the nineties also seems to have had an influence on the actual development
of the structural bearing capacity. No doubt that in this case it had a positive influence, as in the
same period more of the sections suddenly developed a better bearing capacity than earlier.
When the normal climate returned to Denmark the tendency seemed to be an immediatedeterioration of the bearing capacity. This tendency seems to have stabilised again. See figure 5.
Figure 15. Bearing capacity development on a section with ground-water lowering
An analysis of why both the functional and the structural deterioration developed like they did on
the individual test sections is not within the scope of this paper. A new PhD study will analyse
these conditions. The very comprehensive and systematically collected data material comprising
material tests, climatic data, ground-water level data, traffic conditions etc. and data on the actual
functional and structural development on the individual test sections allow us to understand how
the various parameters relate to each other.
0780, 2300-2400
0,0%10,0%
20,0%30,0%40,0%50,0%60,0%70,0%80,0%
s e p - 9 0
s e p - 9 1
s e p - 9 2
s e p - 9 3
s e p - 9 4
s e p - 9 5
s e p - 9 6
s e p - 9 7
s e p - 9 8
s e p - 9 9
ChipLossBleedingRuttingSettlementsSpallsPotholesRaveling
AlligatorcracksLargeCracksSmallCracks
1460, 60-160
0,0%
20,0%
40,0%
60,0%
80,0%
100,0%
120,0%
s e p - 9 0
s e p - 9 1
s e p - 9 2
s e p - 9 3
s e p - 9 4
s e p - 9 5
s e p - 9 6
s e p - 9 7
s e p - 9 8
s e p - 9 9
ChipLossBleedingRuttingSettlementsSpallsPotholesRavelingAlligatorcracksLargeCracksSmallCracks
2135, 405-505
0,0%10,0%
20,0%30,0%40,0%50,0%60,0%70,0%80,0%
s e p - 9 0
s e p - 9 1
s e p - 9 2
s e p - 9 3
s e p - 9 4
s e p - 9 5
s e p - 9 6
s e p - 9 7
s e p - 9 8
s e p - 9 9
ChipLossBleedingRuttingSettlementsSpallsPotholesRavelingAlligatorcracksLargeCracksSmallCracks
1790, 40-140
0,0%50,0%
100,0%
150,0%
200,0%
250,0%
300,0%
s e p - 9 0
s e p - 9 1
s e p - 9 2
s e p - 9 3
s e p - 9 4
s e p - 9 5
s e p - 9 6
s e p - 9 7
s e p - 9 8
s e p - 9 9
RuttingSettlementsSpallsPotholesAlligatorcracksLargeCracksSmallCracks
0708 Construction Thickness
0%
50%
100%
Section
T h i c h n e s s
Asphalt
Base
Asphalt 150 150 130 130
Base 150 150 250 250
2300 2360 2360 2400
0708 Reinforcement
05
101520253035
s e p - 9 1
m a r
- 9 2
s e p - 9 2
m a r
- 9 3
s e p - 9 3
m a r
- 9 4
s e p - 9 4
m a r
- 9 5
s e p - 9 5
m a r
- 9 6
s e p - 9 6
m a r
- 9 7
s e p - 9 7
m a r
- 9 8
s e p - 9 8
m a r
- 9 9
s e p - 9 9
Date
m m

8/6/2019 Why a PMS implemented in 1989 is still a success and continously used
http://slidepdf.com/reader/full/why-a-pms-implemented-in-1989-is-still-a-success-and-continously-used 13/15
We can thus already now, as others may have done before us, state that it is very complicated to
put nature into equations. It is therefore quite clear to us that if the actual (historic) development
on the maintenance sections is not taken into consideration in the PMS deterioration models,
which is applied for road networks with a variety of conditions, then the risk that the
optimisation calculations will be processed on a totally wrong basis is rather large. Out of
consideration of this fact RoSy PMS applies the historic data as a basis for dynamic adjustmentof the basic models to actual conditions at section level. In this way the most realistic forecast for
the future development will be obtained, not only at construction level but also at maintenance
section level.
5. PRESENT AND FUTURE USE OF THE RESULTS
As it appears under section 4, the cooperation agreement was extended with another 5 years to
15 years and will expire at the end of year 2004. Taking the deterioration into consideration that
is at the moment on-going on more sections into consideration, the prognoses also shows that it
would be right to stop the project at that time. Many sections will then have deteriorated totally.However, for the municipality the result is that it will no longer have to work with theoretical
models in RoSy PMS, but will have actual values from 15 years for a number of sections, which
are representative of the entire municipal road network. This is very unique.
Regarding the general condition on the rest of the road network, then the initial calculations
processed in 1989 showed that after 10 years the municipality would again have to rise the
amount required to keep the roads optimally maintained. Now after the 10-12 years this
statement seems to be right. At some time during the project it seemed like this could be
postponed but the sudden deterioration, which occurred over the latest years, now seems to be
reflected on the other road sections in the municipality. The engineers and the politicians of the
municipality have therefore started the discussion about the coming financial task. A task, which
can in no way be compared to the task the municipality was facing in 1989. This time it is only a
question of setting into force a more general strategy so early in the process that the municipality
will avoid passing the time, where it will again basically be uneconomical not to have the funds
available for the road maintenance. The political interest in the project has been important. This
interest has been present during the entire project period, which also appears from the press
coverage over the years. An example is an interview, which Mayor Kaj Brink gave to the
magazine Asfalt (6) 7 years after project startup. From Figure 16 one of his statements appears:
Figure 16. Mayor Kaj Brink’s statement after 7 years

8/6/2019 Why a PMS implemented in 1989 is still a success and continously used
http://slidepdf.com/reader/full/why-a-pms-implemented-in-1989-is-still-a-success-and-continously-used 14/15
For RoSy as a pavement management system, the project was one of the advantageous tools used
parallel with the Ulfborg-Vemb project to develop the system so that today it can be used and
adapted to a road network anywhere in the world (7), (8), (9). It has also meant that even if a user
is not an expert in road deterioration but just takes care that the required data is collected
frequently and systematically, then based on the historic data the models in RoSy will
automatically and without expert assistance be capable of forecasting a future developmenttendency for the individual defect types found on the individual maintenance sections.
6. RECOMMENDATIONS
With a sufficient and proper documentation not only local politicians but also government
officials can be convinced that it is worth while to maintain the condition of the road network at
an economic optimal level.
Working out global/general deterioration models for local and urban roads seems to be
impossible if they should be capable of securing a correctly processed optimisation calculationfor each individual maintenance section. However in order to secure that the calculation will be
correct, a method could be to use progression of historic condition data.
The capacity of a contractor may be a limiting factor if a road authority decides to repair an
entire road network all at once.
Implementation of a PMS is a process and cannot be done in one month. It is an obvious
advantage for the future success of the project and the implementation of the system as a natural
planning tool that the road authority and the PMS supplier/consultant already from the beginning
enters into an agreement on sharing the future tasks. One of these is quality control on the output
from the system calculations.
For this project it turned out to be a motivating factor for both parties so that each party covered
50% of the cost for the parallel test project.
A general lowering of the ground-water level in an area resulted in a poorer bearing capacity on
the roads in the area. The reason may be a rebedding of the materials of the road structure. The
condition did not grow permanent.
Mild winters may postpone the structural deterioration of a road structure but may have a
negative effect on the functional condition.
7. ACKNOWLEDGEMENT
We would like to thank the politicians, Technical Director S. Faurby and Road Engineer A.
Vognbjerg in Ulfborg-Vemb Municipality for their invaluable assistance in connection with this
project.

8/6/2019 Why a PMS implemented in 1989 is still a success and continously used
http://slidepdf.com/reader/full/why-a-pms-implemented-in-1989-is-still-a-success-and-continously-used 15/15
8. REFERENCES
1. Kristiansen Jørn, 1999, Graphic presentation of road data (RoSy®) 2. 14. European ESRI User Conference. Munich
3. Archondo-Callao Rodrigo, 1994. HDM Manager Version 3.0 Transport Division, Transport,
Water & Urban Development Department, the World Bank.
4. OECD, 1994, Road Maintenance and Rehabilitation: Funding and Allocation of Strategies
OECD, Paris
5. Kristiansen Jørn, 1998, Application of Pavement Management Systems for Optimisation of Road Maintenance also Using Thin Pavements and Surface Treatments. 1
stWCHS,
Budapest.
6. Karini Kimo, Ullidtz Per, 1995, Brug af PM Data til vurdering af vejbefæstelsersnedbrydning Institut for Vej, Trafik og Byplanlægning, Danmarks Tekniske Universitet
7. Fryland Knud, 1997, Opskrift på en succes. The Danish Magazin “Asfalt”
8. Kristiansen Jørn, 2000, Practical experience from implementation of 150 PMS in the 4Scandinavian countries. 1
stEuropean Pavement Management Systems Conference, Budapest
9. Mališ Luděk, 2000, Experience with using of PMS for 2nd and 3rd class of roads in CzechRepublic. 1
stEuropean Pavement Management Systems Conference, Budapest
10. Mitz Jürgen, Fippinger Franz, 2000, Practical Experiences of Applying GSA PMS in the Cityof Bremen. 1
stEuropean Pavement Management Systems Conference, Budapest
Key words:
B/C Benefit/Cost
NPV Net Product Value
IRR Interest Rate Return
GPR Ground Penetrating Radar
FWD Falling Weight Deflectometer
PMS Pavement Management System
DMI Distance Meter Indicator
VOC Vehicle Operation Costs
RoSy® Road Systems
Asset ManagementRoad Capital
Condition Survey
Deterioration
Inventory
Roughness
Traffic