who’s smiling?
DESCRIPTION
Who’s Smiling?. Research Methods. 8-10% of the Exam. You will hear 10 statements. Choose whether you think each is true or false. Monday, September 8. Learning objective: Students will identify the need for a scientific method in psychology Please have your vocabulary cards on your desk. - PowerPoint PPT PresentationTRANSCRIPT
WHO’S SMILING?
RESEARCH METHODS8-10% of the Exam
YOU WILL HEAR 10 STATEMENTS. CHOOSE WHETHER YOU THINK EACH IS TRUE OR FALSE.
MONDAY, SEPTEMBER 8
Learning objective: Students will identify the need for a scientific method in psychology
Please have your vocabulary cards on your desk.
Warm Up: write a reading summary for chapter 2. When you are done place your warm up paper in the hand in basket.
MONDAY, SEPTEMBER 8
Agenda1. Student presentations- The outrageous celebrity2. Continue with Friday’s questions/Answers, and the
purpose of it all3. “Who’s Smiling?” (Time Permitting)
TUESDAY, SEPTEMBER 9Learning objective:
Students will identify the need for a scientific method in psychology
Warm Up: Hailey, Sam, Katlynn, and Shannon: get set up
Everyone: Answer the following.1. What is your goal for a grade in this class?2. What is your goal for a score on the AP
Psychology Exam?3. Do you plan to go to college?
NOW FOR THOSE PESKY TRUE FALSE QUESTIONS…
STATEMENT 1
The opinions of 1500 randomly selected people can provide a fairly accurate picture of the opinions of an
entire nation.
TRUE
STATEMENT 2
If you want to teach a habit that persists, reward the desired behavior every time, not just intermittently.
FALSE
STATEMENT 3
Patients whose brains are surgically split down the middle survive and function much as they did before surgery.
TRUE
STATEMENT 4
Traumatic experiences, such as sexual abuse or surviving the Holocaust, are typically “repressed” from memory.
FALSE
STATEMENT 5
Most abused children do not become abusive adults.
TRUE
STATEMENT 6
Most infants recognize their own reflection in a mirror by the end of the first year.
FALSE
STATEMENT 7
Adopted siblings usually do not develop similar personalities, even though they are reared by the same
parents.
TRUE
STATEMENT 8
Fears of harmless objects, such as flowers, are just as easy to acquire as fears of potentially dangerous objects such
as snakes.
FALSE
STATEMENT 9
Lie detection tests often lie.
TRUE
STATEMENT 10
The brain remains active during sleep.
TRUE
WHY WE MUST FOLLOW A SCIENTIFIC METHOD!
THE SCIENTIFIC METHOD
Who smiles more: Females or Males?
How would you test this? What is your hypothesis? Discuss in groups for 1-2 minutes.
Count the number of smiles. Write your groups data on the board.
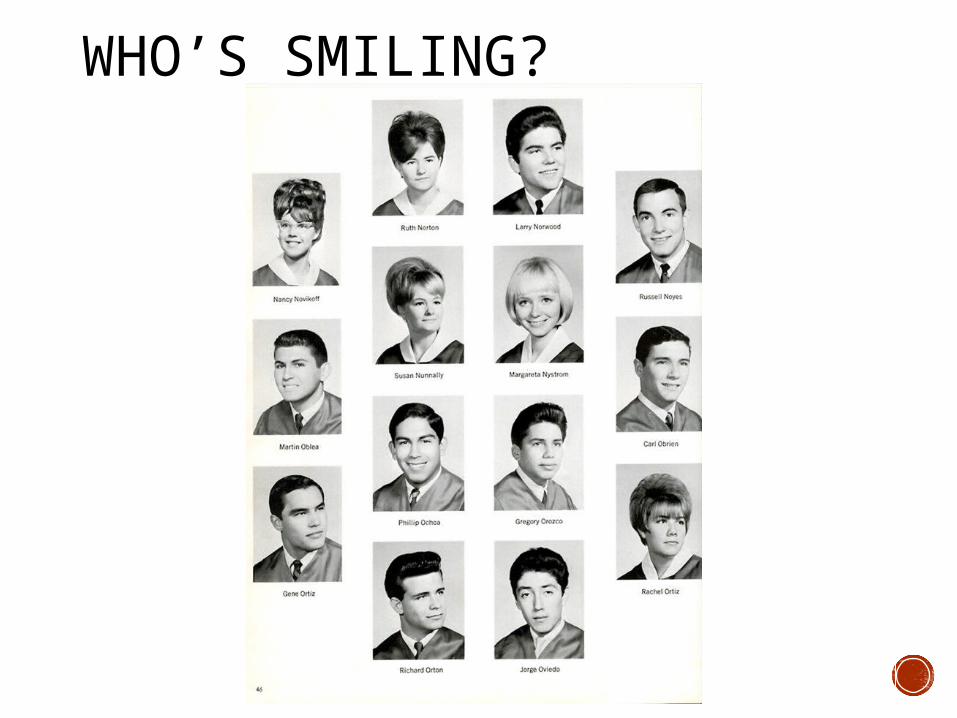
WHO’S SMILING?
WHY DID I MAKE YOU DO THIS?
WEDNESDAY, SEPTEMBER 10 Learning Objective: I will write operational definitions.
Warm Up: Describe how hindsight bias and overconfidence could affect the outcome of a study.
QUIZ REVIEW
Read the short answer response provided silently. Highlight the words or phrases that guaranteed full credit for each perspective.
Multiple choice review
HINDSIGHT BIAS
How many of you said “I knew that, I just second guessed myself?”
The tendency to believe, after learning an outcome, that one would have foreseen it
OVERCONFIDENCE
Predictions made with 80% confidence level were right less than 40% of the time
27,000 expert predictions of world events; Philip Tetlock (1998,2005)
THE SCIENTIFIC METHOD

THE BIG PICTURE
THEORY a broad idea or set of closely related ideas
attempts to explain observations
used to make predictions about future observations
can be modified or supported over time with additional research
A GOOD THEORY…
Effectively organizes a range of observations
Leads to a clear hypothesis
Is supported by multiple replications of a study
Produces a testable hypothesis- we use theories to create our testable questions
HYPOTHESIS
A testable prediction that derives logically from a theory
TESTING A HYPOTHESIS
Observing variables (anything that can change)
Measuring variables requires operational definitions:
a carefully worded statement of the exact way a variable of interest will be measured
allows for replication of a study in a new environment with new participants and more reliable findings
DRAWING CONCLUSIONS
Gathering data
Analyzing data with statistics
Using the analysis to draw meaningful conclusions
EVALUATING A THEORY
only done when a specific hypothesis is supported numerous times
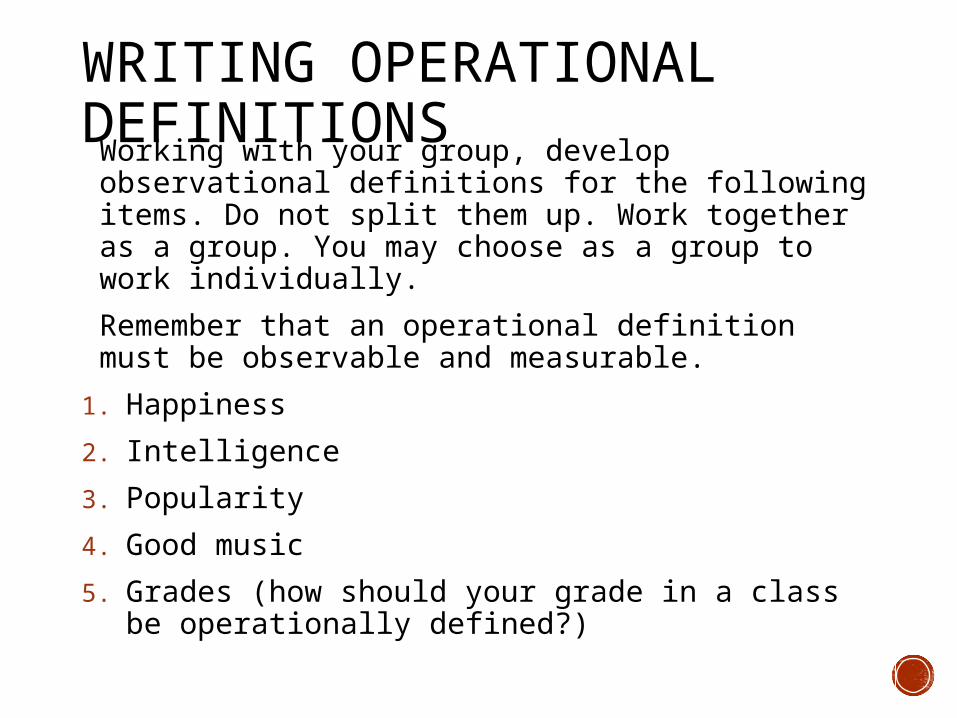
WRITING OPERATIONAL DEFINITIONSWorking with your group, develop observational definitions for the following items. Do not split them up. Work together as a group. You may choose as a group to work individually.
Remember that an operational definition must be observable and measurable.
1. Happiness
2. Intelligence
3. Popularity
4. Good music
5. Grades (how should your grade in a class be operationally defined?)

THURSDAY, SEPTEMBER 11 Learning Objective: I will identify the three types of
psychological testing and the strengths and limitations of each.
Turn in your operational definitions if not submitted in class yesterday.
We will be taking notes again today, rearrange yourselves if necessary
Warm Up: Read the two abstracts provided. Identify the operational definition in each study. (5 minutes)
TYPES OF PSYCHOLOGICAL TESTING
THREE MAJOR TYPES OF TESTING USED IN PSYCHOLOGICAL RESEARCH Descriptive methods (describe behaviors)
Correlation methods (associate different variables)
Experimental methods (display cause-effect relationships)
DESCRIPTIVE RESEARCH How it works:
describes phenomenon what the behavior is, how often it occurs, what setting
it occurs in
Strength: can reveal important information and provided a starting point
Limitation: Cannot prove cause
3 kinds: Naturalistic Observation, Surveys/Interviews, Case Studies
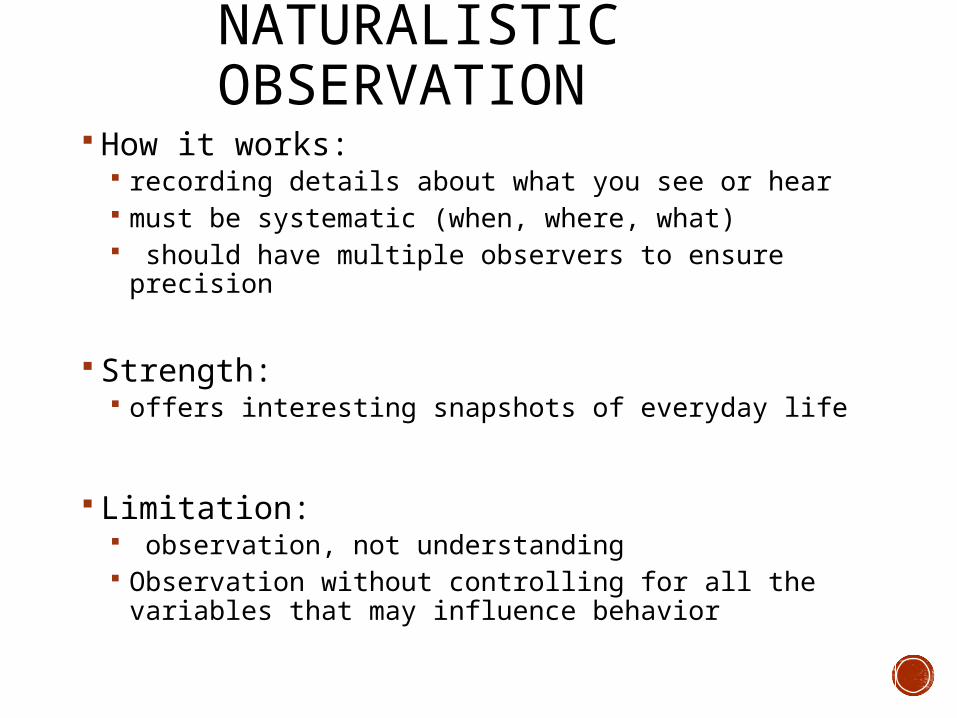
NATURALISTIC OBSERVATION
How it works: recording details about what you see or hear must be systematic (when, where, what) should have multiple observers to ensure precision
Strength: offers interesting snapshots of everyday life
Limitation: observation, not understanding Observation without controlling for all the variables
that may influence behavior
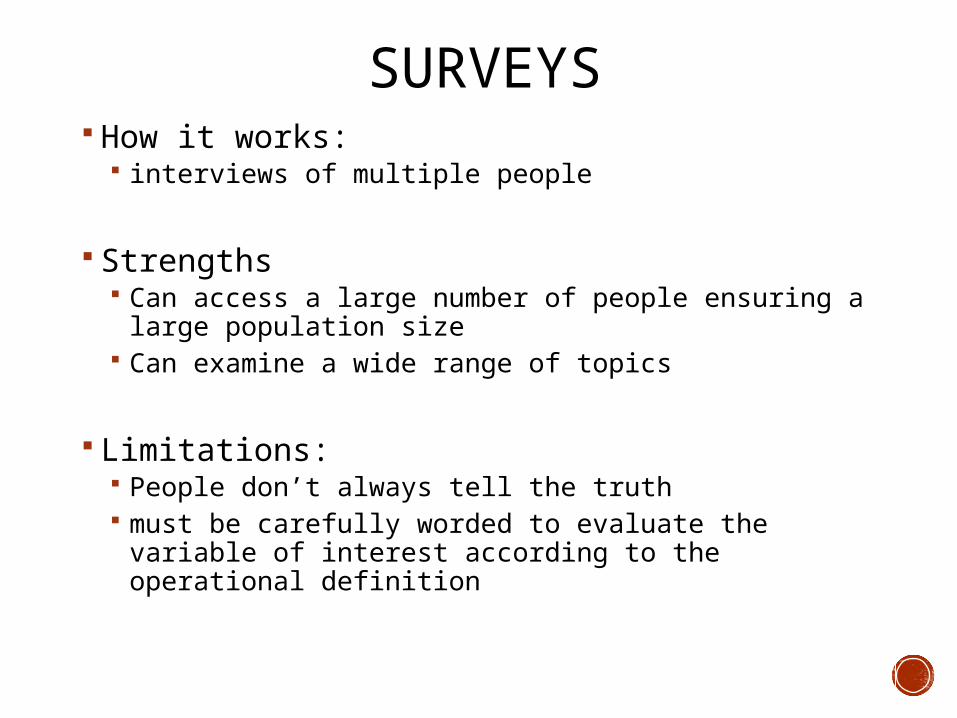
SURVEYS How it works:
interviews of multiple people
Strengths Can access a large number of people ensuring a large
population size Can examine a wide range of topics
Limitations: People don’t always tell the truth must be carefully worded to evaluate the variable of
interest according to the operational definition
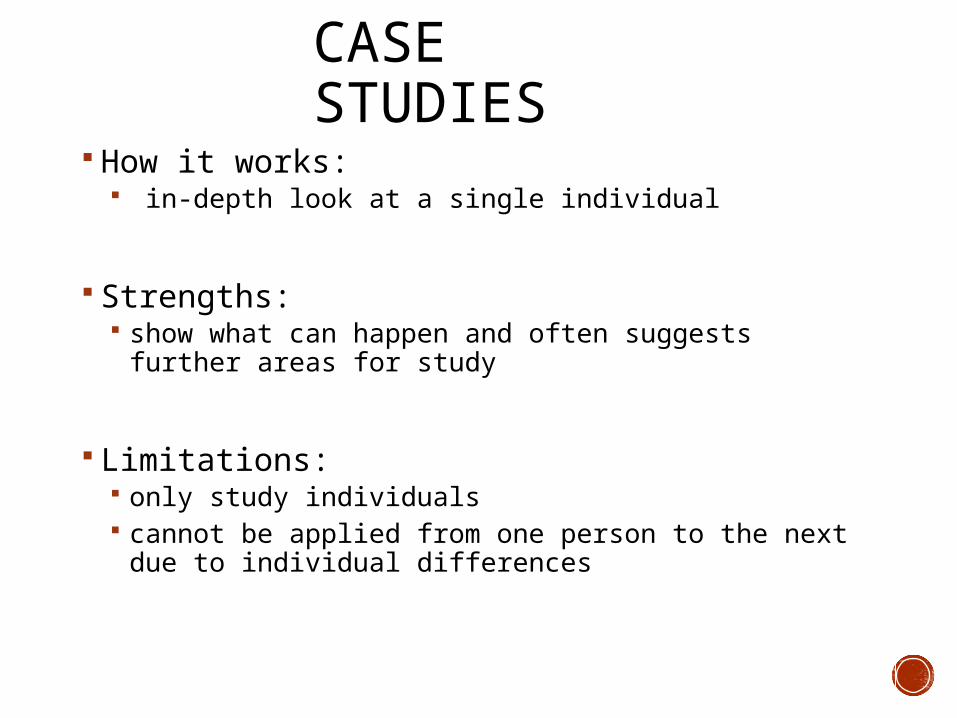
CASE STUDIES
How it works: in-depth look at a single individual
Strengths: show what can happen and often suggests further
areas for study
Limitations: only study individuals cannot be applied from one person to the next due to
individual differences
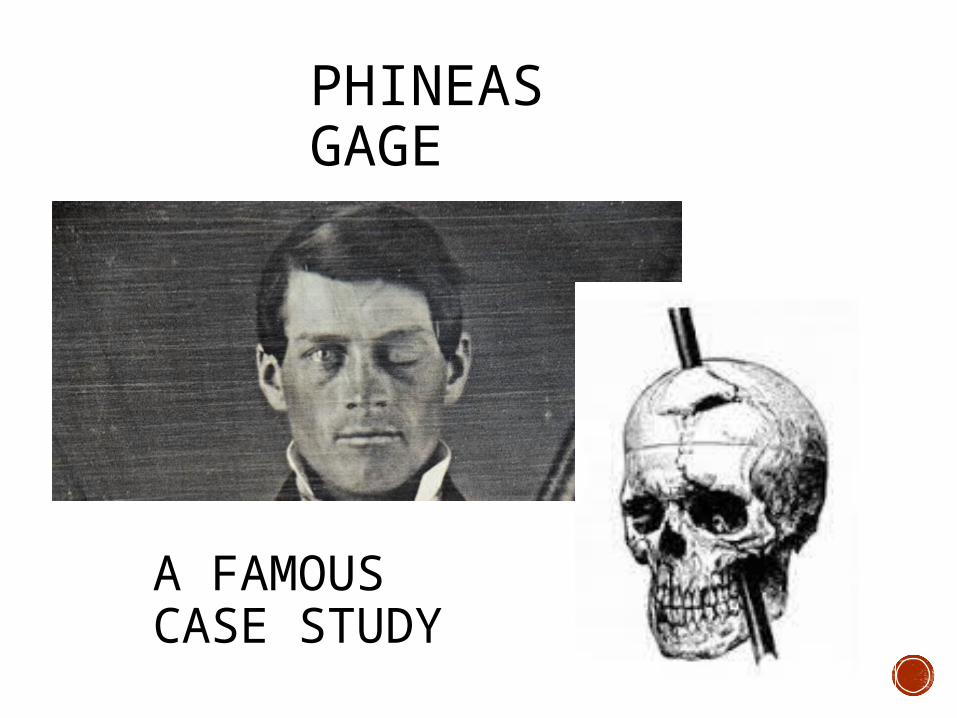
PHINEAS GAGE
A FAMOUS CASE STUDY
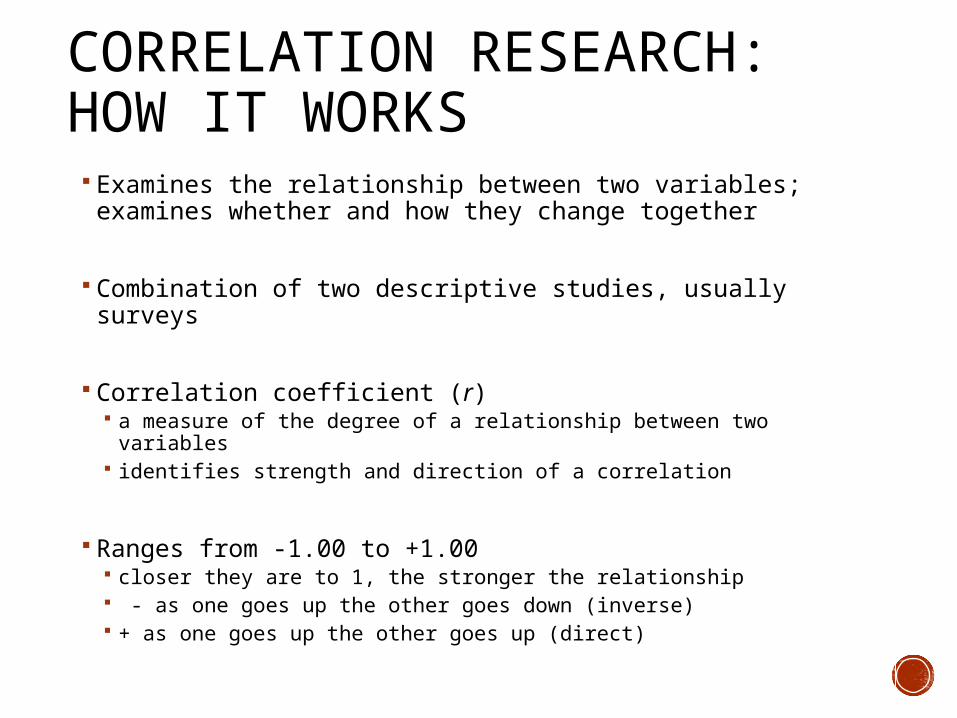
CORRELATION RESEARCH:HOW IT WORKS Examines the relationship between two variables;
examines whether and how they change together
Combination of two descriptive studies, usually surveys
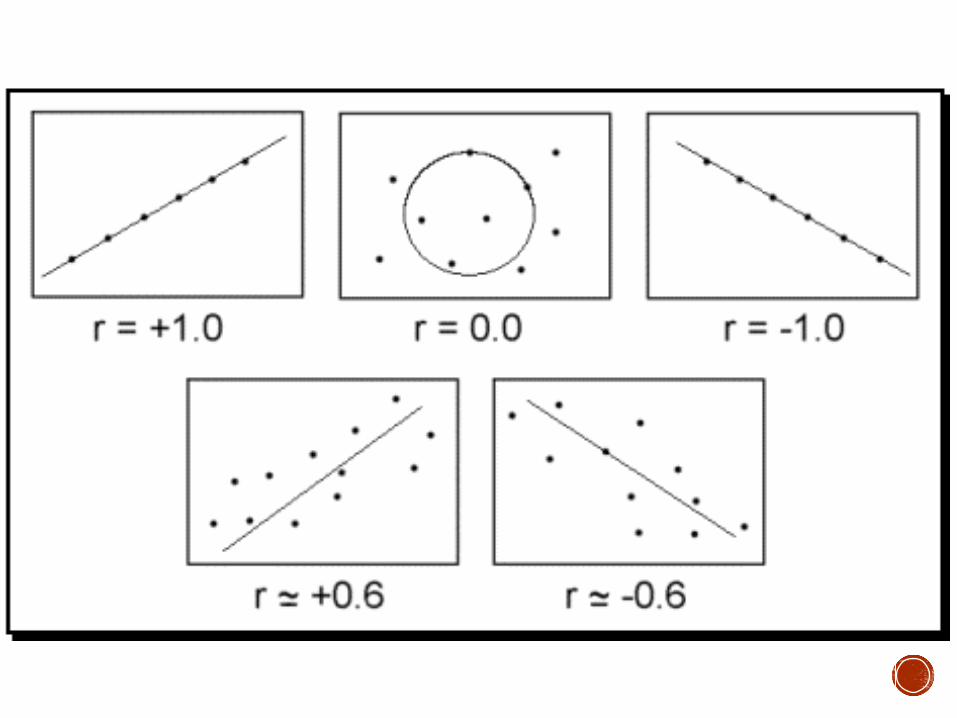
Correlation coefficient (r) a measure of the degree of a relationship between two variables identifies strength and direction of a correlation
Ranges from -1.00 to +1.00 closer they are to 1, the stronger the relationship - as one goes up the other goes down (inverse) + as one goes up the other goes up (direct)
CORRELATION RESEARCH:STRENGTHS
They allow one variable to predict another (usually quite accurately if it has been shown to do so over time)
May involve variables that cannot be changed such as biological sex, personality traits, ethnic background
May deal with major events that cannot be repeated
Valuable when it may not be ethical to perform the research in any other way
CORRELATION RESEARCH:LIMITATIONS Correlation does not equal causation
Confounding variables (3rd variable problem)-a variable not considered that may have an effect
FRIDAY, SEPTEMBER 12
Learning Objective: I will describe the difference between correlation and causation and the components of an experiment.
Warm Up: Sketch a graph of two variables with a correlation coefficient of r = -1
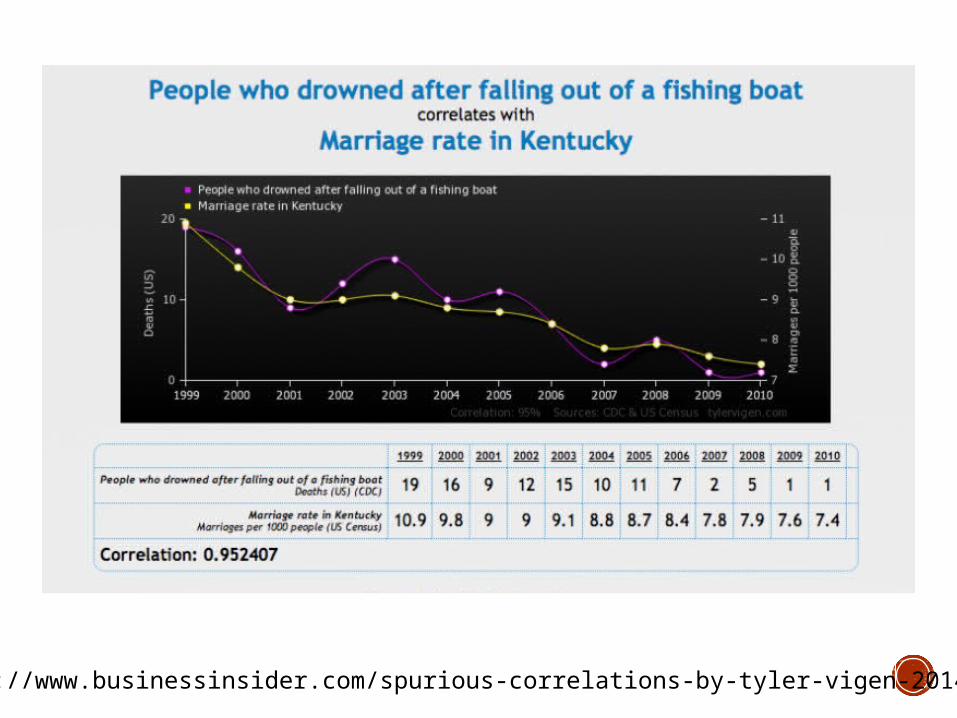
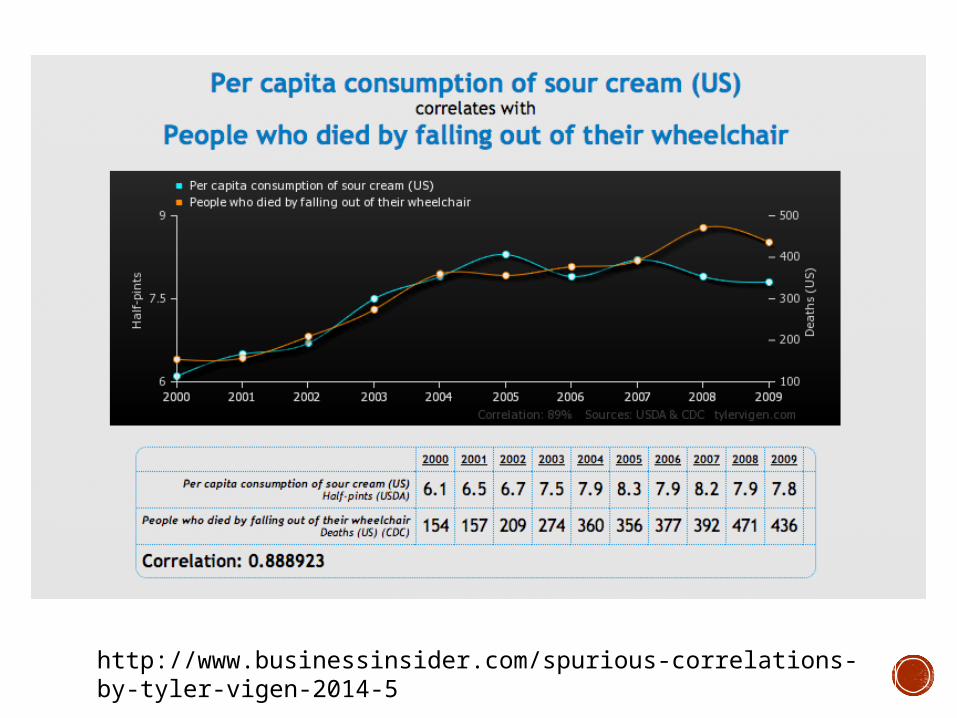
http://www.businessinsider.com/spurious-correlations-by-tyler-vigen-2014-5
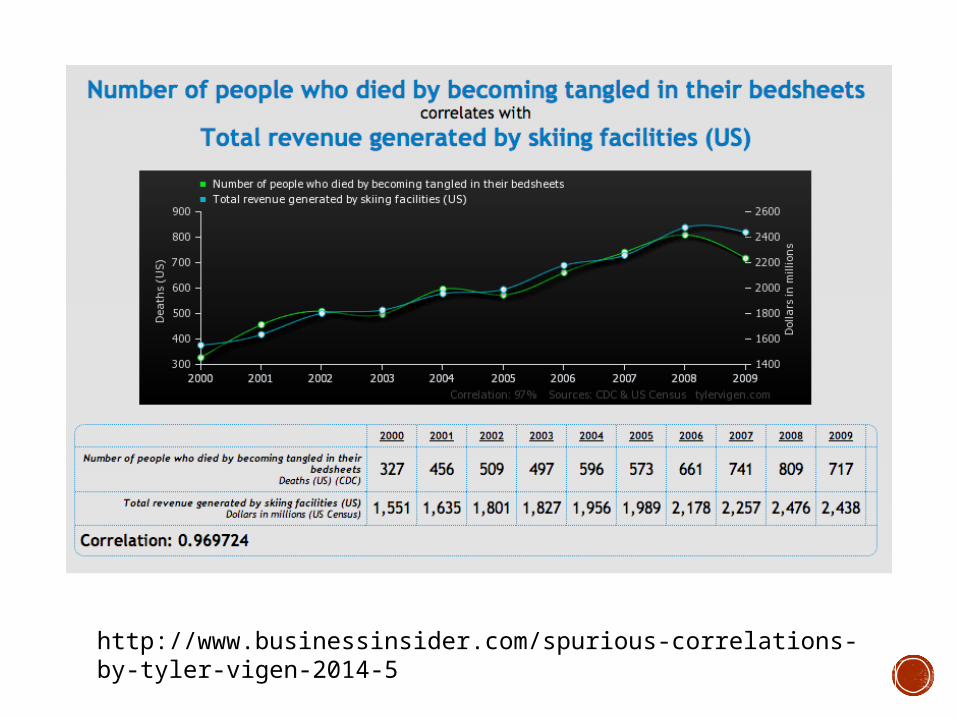
http://www.businessinsider.com/spurious-correlations-by-tyler-vigen-2014-5
http://www.businessinsider.com/spurious-correlations-by-tyler-vigen-2014-5
LONGITUDINAL STUDIES
Comparing multiple correlation research studies over time
Strength: can get closer to suggesting a causal relationship
Limitation: cannot prove a causal relationship between two variables because there are so many confounds included
EXPERIMENTS: HOW IT WORKS A carefully regulated procedure in which the researcher manipulates one or more variables that are believed to influence some other variable
Independent Variable- the one that the experimenter manipulates
Dependent Variable- the measured outcome
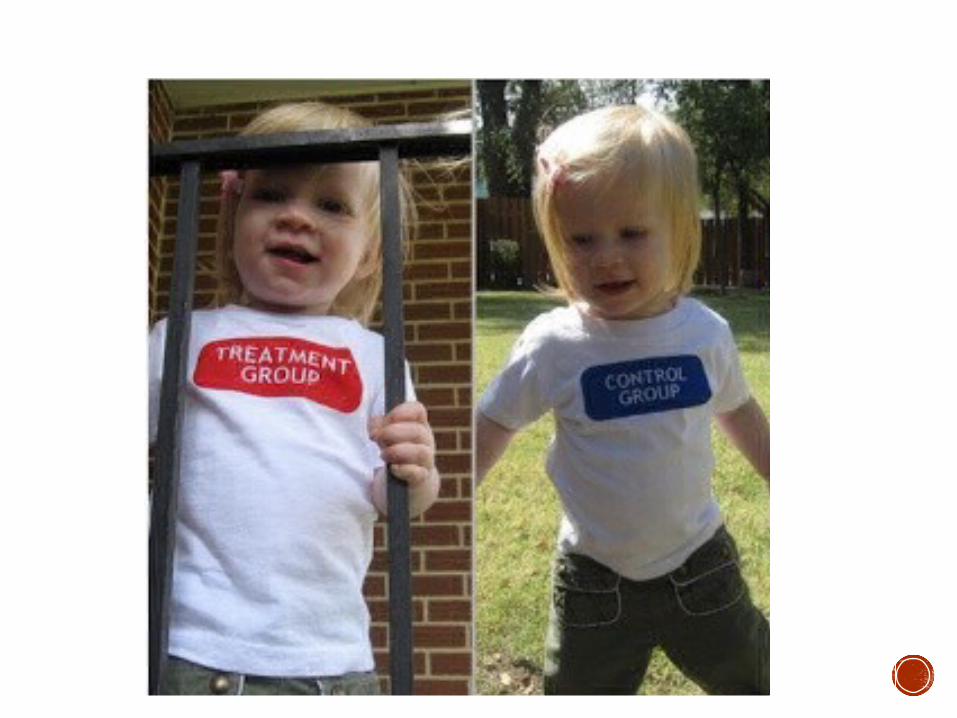
EXPERIMENTAL VS. CONTROL GROUP The experimental group receives treatment (change of independent variable)
The control group gets all the same conditions, but no treatment (no change of independent variable)
Participants must be randomly (completely by chance) assigned into a group
EXPERIMENTS: STRENGTHS AND LIMITATIONS Strengths:
Carefully controlled setting Can strongly suggest a cause and effect relationship
Limitations It is unethical to manipulate some variables (best left
to case studies) Bias plays a large part in the validity
VALIDITY Refers to the soundness of a conclusion that a researcher draws from an experiment
External Validity does this study actually reflect the real-world issue is was designed to address?
Internal Validity is the independent variable really responsible for the change in the dependent variable?

BIAS Participant bias- occurs when the behavior of the participants during the experiment is influenced by how they think they are supposed to behave or by their own expectations
Experimenter bias- occurs any time an experimenter’s expectation influence the outcome of research
Double Blind Procedure: a way to prevent bias; neither the participant nor the researcher know who is in what group
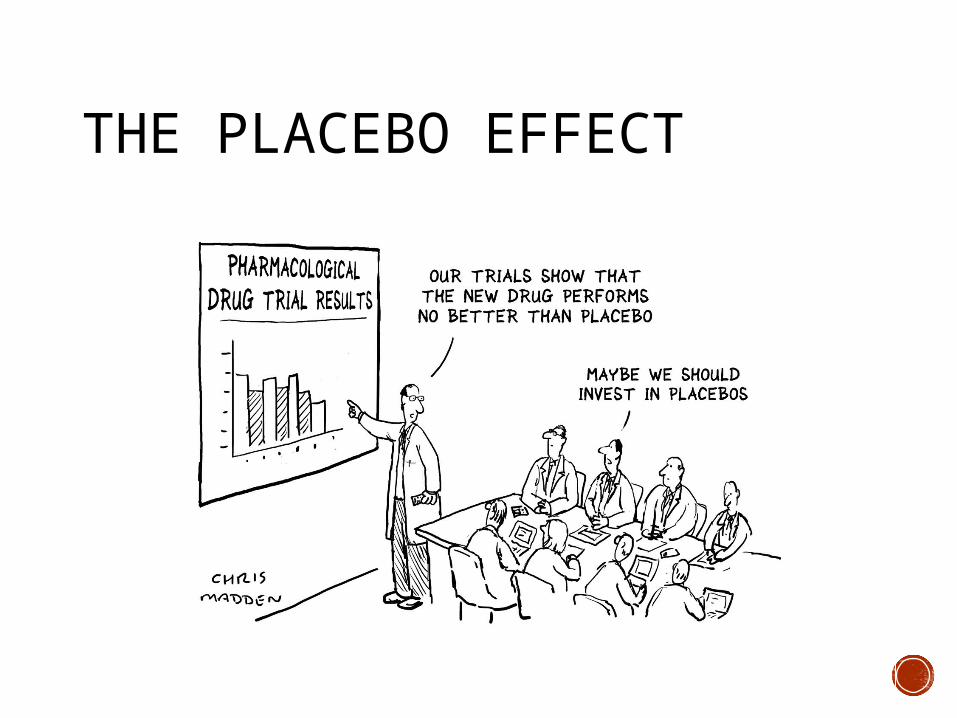
THE PLACEBO EFFECT
THE PLACEBO EFFECT
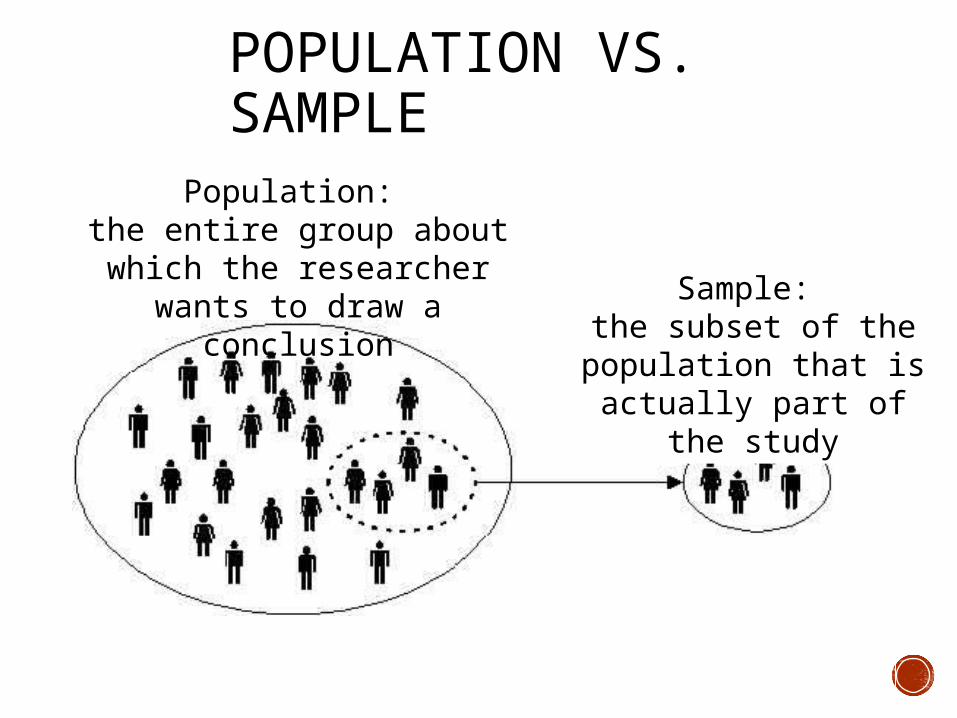
POPULATION VS. SAMPLE
Population: the entire group about which
the researcher wants to draw a conclusion Sample:
the subset of the population that is
actually part of the study
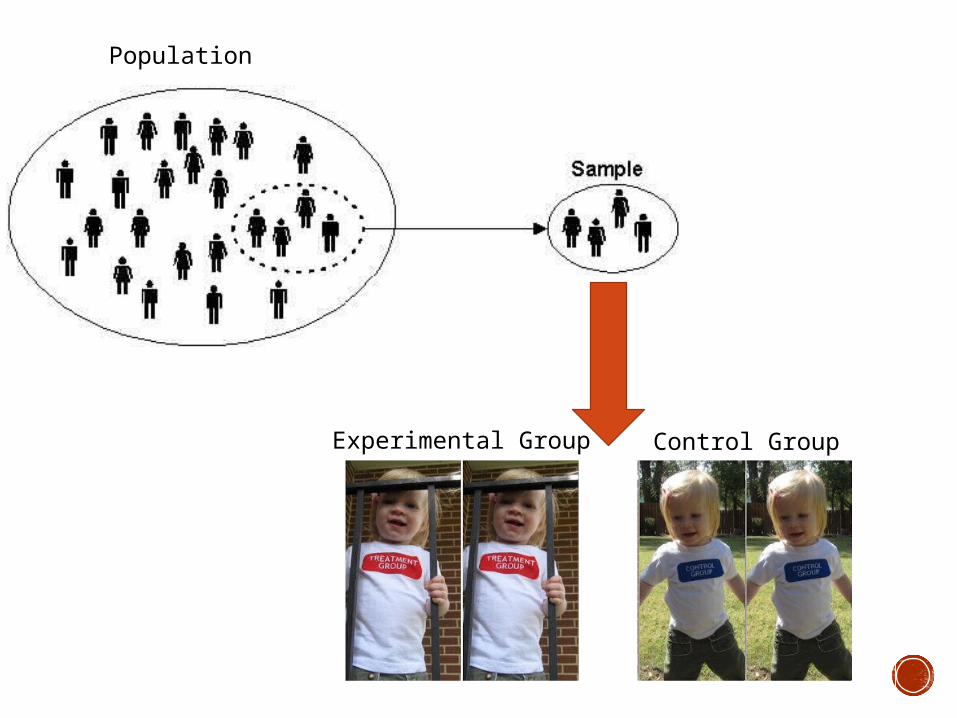
Population
Experimental Group Control Group
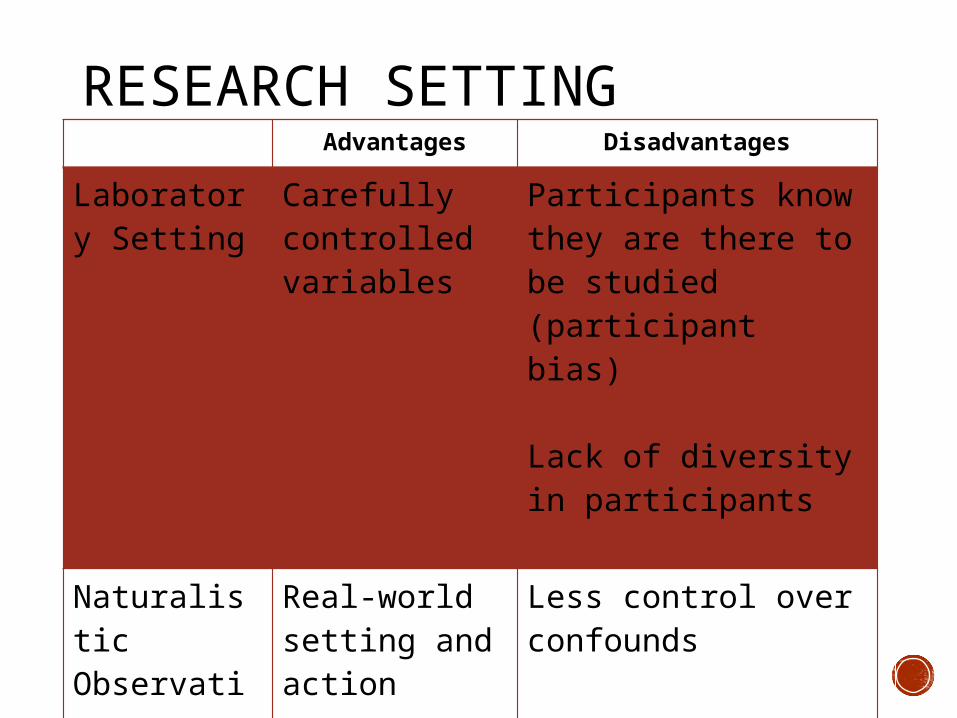
RESEARCH SETTINGAdvantages Disadvantages
Laboratory Setting
Carefully controlled variables
Participants know they are there to be studied (participant bias)
Lack of diversity in participants
Naturalistic Observation
Real-world setting and action
Can be done anywhere
Less control over confounds

FACILITATED COMMUNICATION
FACILITATED COMMUNICATION Claim: facilitated communication techniques can help people with developmental and communication disabilities express themselves.
How would you design a psychological test to investigate this question? Identify the population and sample. What type of test would you use? What would be your operational definition? How would you design your test? What data would you collect?