who’s patenting in the university? evidence from the …ecosgg/research/pdf/sgsb_eint.pdf1...
TRANSCRIPT

Who’s Patenting in the University? Evidence from the Survey of Doctorate Recipients
Paula E. Stephan*, Shiferaw Gurmu*, A.J. Sumell** and Grant Black***
*Department of Economics Andrew Young School of Policy Studies
Georgia State University
Department of Economics Youngstown State University
***School of Business and Economics
Indiana University South Bend
Revised July 2005
Forthcoming in the Economics of Innovation and New Technology Corresponding author, Paula Stephan: E-mail: [email protected]; Phone: (404) 651-3988; Fax: (404) 651-4985. Acknowledgements: We have benefited from the comments of Irwin Feller, Jerry Green, Marie Thursby, Aldo Geuna and two anonymous referees on an earlier version of this paper and participants at the workshop on Empirical Economic Analysis of the Academic Sphere, Université Louis Pasteur, Strasbourg, and at seminars at the Max Planck Institute, Jena, Germany, Université Pierre Mendès France, Grenoble, and the Department of Economics, Georgia State. We have also benefited from the comments of participants at the NBER Higher Education Meetings, the Southern Economic Association Meetings, and the American Economic Association Meetings. We thank John Mullahy for providing the Gauss code for the GMM estimation of count data models with endogenous regressors and Jerry Thursby for providing data.

1
Abstract We use the Survey of Doctorate Recipients to examine the question of who in U.S. universities is patenting. Because standard methods of estimation are not directly applicable, we use a zero-inflated negative binomial model to estimate the patent equation, using instruments for the number of articles to avoid problems of endogeneity. We also estimate the patent model using the generalized method of moments estimation of count data models with endogenous regressors. We find work context and field to be important predictors of the number of patent applications. We also find patents to be positively and significantly related to the number of publications. This finding is robust to the choice of instruments and method of estimation. The cross-sectional nature of the data preclude an examination of whether a tradeoff exists between publishing and patenting, holding individual characteristics constant over time. But the strong cross-sectional correlation that we find does not suggest that commercialization has come at the expense of placing knowledge in the public domain. JEL Code: C14, O31, O32, O34, O38. Key Words: Academic Research Productivity; Patenting; Publishing; Economics of Science; Technology Transfer; Count Data Models; Bayh-Dole Act; Knowledge Transfer.
2
Section One: Introduction
In recent years we have learned a considerable amount about university patenting. For example, we know which universities produce the most patents, which receive the most in licensing revenue, and in what fields patents are being issued. We also know something about the incentive structure related to royalty payments. What we know less about is who in the university is patenting and how patent activity relates to personal characteristics. This paper addresses this deficiency. Drawing on data from the 1995 Survey of Doctorate Recipients, we analyze the patent activity of a sample of 10,962 doctoral scientists and engineers working in institutions of higher education.
Technology transfer is the subject of numerous studies (Agrawal and Henderson 2002; Colyvas et al. 2002; Geuna and Nesta 2003; Henderson, Jaffe and Trajtenberg 1998; Jensen and Thursby 2001, 2003; Lach and Schankerman 2004; Murray 2002; Murray and Stern 2004; Mowery et al. 2001; Owen-Smith and Powell 2001, 2003; Siegel, Waldman and Link 2003; Thursby and Kemp 2002, Thursby and Thursby 2002a, 2002b).1 These studies provide important insight into institutional factors that relate to patent activity and the importance (or unimportance) of the Bayh-Dole Act2 to the dramatic increase in university patenting. Thursby and Kemp, for example, show that technology transfer offices play an important role in determining the number of disclosures that are made on a campus. Owen-Smith and Powell (2001) discuss how the culture of the university affects technology transfer, as do Siegel, Waldman and Link. The work of Owen-Smith and Powell (2003) suggests that academic medical centers can play a facilitating role in technology transfer. Lach and Schankerman investigate how differences in the structure of royalty payments affect the quantity and quality of inventions coming out of universities. Mowery and coauthors suggest that Bayh-Dole did not cause the dramatic increase in university patent activity but rather that the “principal effect of Bayh-Dole was to accelerate and magnify trends that already were occurring” in academe (Mowery et al., 2001, p. 2). Jensen and Thursby provide theoretical insight into whether changes in patent policy have been detrimental to academic research and education.
The institutional focus of technology transfer studies precludes insights
concerning personal characteristics that affect patent activity and the interplay between these personal and institutional factors. We know remarkably little about who in the university is patenting and personal characteristics related to patenting, including life- cycle effects. We also know little about how individual-level patent and publishing
1 The number of patents issued to academic institutions has grown dramatically in recent years. For example, in 1965, fewer than 100 U.S. patents were granted to 28 U.S. universities or related institutions. By 1992 almost 1500 patents were granted to over 150 universities or related institutions. This dramatic increase in patenting activity occurred during a time in which total U.S. patenting increased by less than 50% and patents granted to U.S. inventors remained almost constant (Henderson, Jaffe and Trajtenberg, 1998). This trend has continued throughout the 1990s, with more than 3000 patents being issued to academic institutions in 1998. 2 The Bayh-Dole Act of 1980 gave universities the right to retain title to and license inventions resulting from research supported on federal grants.

3
activities are related and the role played by unmeasured or unobservable characteristics.3 By contrast, we know considerably more concerning the publishing activity of university scientists and engineers. We know, for example, that the activity itself is highly skewed; that publishing and co-authorship patterns vary considerably by field; and that life-cycle effects are generally present in a fully specified model that controls for individual fixed effects such as motivation and ability (Levin and Stephan 1991, Stephan 1996, Stephan and Levin 1992).
Standard methods of estimation are not directly applicable in the analysis of
patent-publication data because of the presence of non-linearity due to the non-negative discrete values of the data. There is also the question of the role played by unobserved or unmeasured characteristics, noted above. Just as the question of who in the university is patenting deserves further investigation, these features of the patent/publication data and the implied modeling strategies also deserve further investigation.
This paper examines university patenting at the individual, as opposed to
institutional, level. Our goal is four-fold: (1) to examine the distribution of patents and compare it to the distribution of publications; (2) to examine how patent activity relates to individual and institutional characteristics; (3) to investigate the relationship between publishing and patenting; (4) to examine patent activity using data that contains an excess of zeros and endogenous regressors.
Expanding on point (4), the modeling approach used here relies on nonlinear
instrumental-variable estimation of models of individual patent and publication behavior using two methods. First, using a likelihood-based method, we estimate a zero-inflated negative binomial (ZINB) model of patents allowing for potential endogeneity in publications. Second, using the count data method developed by Mullahy (1997), we estimate the relationship between patenting and publication activities by the generalized method of moments (GMM). These methods are suitable for the analysis of patent data with the special features noted above. In particular, our rationale for using zero-inflated count data models stems from the observation that some individuals who would patent if the interval of analysis were longer are not observed patenting in the five-year period available in the data. Ignoring this potential error in recording leads to misspecification. But the ZINB imposes restrictions that the GMM addresses, albeit at the cost of not inflating the zero counts.
In section two we discuss factors leading university scientists and engineers to
patent and discuss why we expect complementarity between patenting and publishing. In section three of the paper we discuss personal as well as institutional characteristics hypothesized to be related to patenting activity of academics. We also comment on why we expect these relationships to differ by field. Section four summarizes the data used for this study and the methodology employed. Patent and publishing distributions are
3 Scientific productivity is characterized by extreme inequality, suggesting that patent productivity might also be related to “unobserved heterogeneity,” as a measure of motivation. If unobserved heterogeneity is correlated with observed characteristics such as the number of publications, then the estimates of the parameters of interest in the patent model are inconsistent.

4
compared. Alternative modeling strategies are presented from the individual-level patent data application point of view. Section five presents our results and research findings.
Our work suggests that strong differences in patenting exist among fields. We
also find strong complementarity between patenting and publishing. The cross sectional nature of our data preclude our examining whether a tradeoff exists between publishing and patenting holding individual characteristics constant over time. But the strong cross-sectional correlation that we find does not suggest that commercialization has come at the expense of placing knowledge in the public domain. Section Two: Incentives to Patent in Academe Two key factors lead scientists to engage in research: an interest in solving the puzzle and an interest in winning the game (Stephan and Levin 1992). The distinction between the two is that puzzle solving involves a fascination with the research process itself, while winning the game offers recognition among fellow scientists as well as financial rewards. The puzzle-solving nature of research is addressed by the historian of science Robert Hull (1988, p. 306) who speaks of the innate curiosity of scientists, noting that science is “play behavior carried to adulthood.” 4 But extrinsic rewards also play a strong motivating role in science. Robert Merton (1957) and the sociologists and philosophers of science who followed him have demonstrated that recognition is one of the main factors leading scientists to do research. Clues concerning the importance of reputation as a motivating force in science are readily apparent. The order of authors on articles is often carefully negotiated; speaker order at conferences can be hotly debated. Nowhere is the importance of reputation more apparent than in issues concerning priority of discovery. Scientific reputation is based on being first (Merton 1957, Stephan 1996). A necessary condition of establishing priority is the sharing of the research findings with the scientific community through publication.
Economic gain also plays a motivating role in science. Productive scientists are financially rewarded by their own institution (Stephan and Levin 1992).5 Scientific productivity is also rewarded by institutions other than the employing one. Moreover, within academe, the awarding of tenure is largely based, at least at research institutions, on the research productivity, and related grant-getting ability, of the scientist and engineer (Stephan and Levin 1999).
Scientists and engineers in academe are thus not only intrinsically motivated to do research that is published; they are expected to publish their research. Recognition among their peers requires that they share their research findings in a timely fashion with
4 Hull continues (1988, p. 46): “The wow-feeling of discovery, whether it turns out to be veridical or not, is exhilarating. Like orgasm, it is something anyone who has experienced it wants to experience again—as often as possible.” 5 Productive faculty not only receive higher salaries. In recent years it has become increasingly common to reward faculty receiving external funding with bonuses (Mallon and Korn 2004).

5
the scientific community through publication. Promotion and the reward structure in academe reinforce the importance of publication.
Research output is produced by combining inputs such as time (both the
researcher’s and others’), knowledge, and equipment. An unmeasurable but equally important input is what might be called “the right stuff” (see discussion below) which includes such things as motivation and ability. The research output that results from this production process can be published, patented or both published and patented.
The presence of the researcher’s time as an input in the research production
function suggests substitution between patents and publishing as a possible outcome. For example, Azoulay, Ding and Stuart (2004, p. 5) note that “patenting and the other activities associated with commercializing science can consume significant amounts of time, thus diverting scientists’ attention away from their research.”6 In their survey of TTOs at 62 universities, Jensen, Thursby and Thursby (2003, p. 2) find that TTO directors reported that “educating and convincing faculty to disclose inventions is one of their major problems.” The authors go on to say that many directors believe that “substantially less than half of the inventions with commercial potential are disclosed to their office.” The authors attribute this unwillingness to disclose to several factors: not realizing the invention has commercial potential; unwillingness to take time away from research; unwillingness to get involved in licensing because, as they find in the survey, “faculty involvement in further development (even after a license is executed) is necessary for commercial success for 71% of inventions licensed.” Some of these obstacles to patenting involve learning costs of a fixed nature that can be diminished if and when the individual faculty member makes a disclosure; others are costs of a variable nature and continue regardless of the number of disclosures the faculty member has under her belt and relate to the issue of substitutability.
Another reason patenting and publishing may be substitutes is that scientists
contemplating intellectual property protection may behave in a more secretive manner, delaying publication or, in certain instances, withholding publication. Campbell et al. (2002) report that more than 20 percent of those surveyed admitted withholding information about their research from colleagues to protect potential commercial interests. Thursby and Thursby (2002) report that industry sponsored research often requires “delay-of-publication” clauses.
While substitution between patenting and publishing is a distinct possibility, there
are good reasons to argue that complementarity is more likely and that patents can be a logical outcome of research activity that is designed first and foremost with an eye to publication. The reasons for complementarity are three fold.
6 The authors point out that the task of disclosing can require a “modest” investment of effort. Assisting companies in the process of assimilating the inventions they license, however, can be quite time- consuming.

6
First, the results of research, especially research in what Donald Stokes (1997) identifies as Pasteur’s Quadrant, can often be both patented and published, having a dual nature. Second, the increased opportunities that academic researchers have to work with industry may enhance productivity and encourage patenting. Third, the reward structure in academe encourages patenting as one outcome of research.
Duality. Fiona Murray (2002), in her study of tissue engineering and in her more recent study with Scott Stern of researchers working in biotechnology (2004) finds that many research results are both patented and published. An engineering faculty member interviewed by Agrawal and Henderson (2002, p. 58) states that “most patentable research is also publishable.” One reason for this duality is the high prevalence of research that is both use-oriented and also oriented towards fundamental understanding -- what Donald Stokes calls Pasteur’s Quadrant. Duality can also be caused by the low marginal cost of disclosure when draft manuscripts are used as the means of communicating to the technology transfer office (TTO). Owen-Smith and Powell (2003, p. 1705) report that “invention disclosures made by academic inventors to university technology transfer offices often take the form of article manuscripts.”
Duality is facilitated by the fact that scientists and engineers can selectively publish research findings while at the same time monopolizing other elements of research. Rebecca Eisenberg (1987) argues that such behavior is more common among academics than might initially be assumed. This ability of faculty to have one’s cake and eat it too is not only manifested in patenting and publishing from the same line of research. It is also manifested when professors refuse to share data or cell lines. It is facilitated by the fact that publication is not synonymous with providing the ability to replicate and that techniques can often be transferred only at considerable cost, in part because their tacit nature makes it difficult, if not impossible, to communicate in a written, codified form.
Interaction with industry. Faculty interaction with industry can often lead to new research ideas and hence enhanced productivity. Mansfield (1995), for example, demonstrates that scientists and engineers often gain inspiration for their research through interaction with industry. Siegel, Waldman and Link (2003, p. 19) report that 65 percent of the scientists they interviewed noted that “interacting with industry has had a positive influence on their experimental work.” Funding from industry, as well as the university share of royalty income, can also enhance productivity by providing increased resources to purchase new equipment and expand the size of the lab. Interaction with industry can also lead to increased interest in patenting, not only because industry often has a patent focus and patent “know-how” but also because industry directs its research to questions that are well suited to patenting. Agrawal and Henderson (2002) suggest that interaction with industry may steer scientists and engineers towards patenting.7
7 An engineer told Agrawal and Henderson (2002, p. 58): “. . . It is useful to talk to industry people with real problems because they often reveal interesting research questions—but sometimes they try to steer you towards patenting. Sometimes that research results in something patentable, sometimes not.’’

7
The rewards to patenting. Patenting can enhance the prestige and increase the productivity of scientists who publish. Owen-Smith and Powell (2001) find that “many inventors reveal that they patent, in part, because they feel it increases their academic visibility status by reaffirming the novelty and usefulness of their work.”8 Patents can also be used to leverage existing research by creating a chit to trade with industry. This may be particularly the case in the physical sciences where inventions tend to be incremental improvements on established processes or products. By exchanging patents on incremental innovations with industry, scientists can receive proprietary technology, such as access to equipment or other opportunities (Owen-Smith and Powell 2001).9
The above discussion suggests that patents can be a logical outcome of research activity that is designed first and foremost with an eye to publication. It does not, however, suggest a one to one relationship between patenting and publishing. Research that focuses on fundamental understanding (Bohr’s Quadrant), instead of fundamental understanding and use (Pasteur’s Quadrant), is less likely to be patentable. Moreover, a line of research in Pasteur’s quadrant can produce numerous articles upon which at most one patent is based. Moreover, as changing patterns in authorship demonstrate so well, increasingly scientists work in teams (Adams et al. 2002). But the article team is generally larger than the patent team. Recent research by Ducor (2000) matches 50 article-patent pairs and reports that the average number of authors was 10 while the average number of inventors was three. Murray (2002) reports similar results in her study of patent-paper pairs in tissue engineering.
Section Three: Characteristics Related to Patent Activity
We expect the patent activity of faculty to be related to institutional as well as individual characteristics. The institutional characteristics most likely to affect patent activity are the culture of the university, the effectiveness of the TTO office, and the field of specialization. The work by Thursby and Kemp (2001) concerning the role that technology transfer offices play in determining the number of disclosures at a university is consistent with the observation that although academic scientists don’t need to be taught how to publish they do need to be educated concerning the patent process.10 Siegel, Waldman and Link (2003) find through their qualitative work that faculty “buy- 8 In this respect views have changed considerably during the past 90 years. In 1917 T. Brailsford Robertson patented a substance thought to promote growth, and donated the patent rights to the University of California, where he was head of the biochemistry department. Weiner recounts how this action was perceived as tarnishing Robertson’s reputation (1996). 9 The prospect of a stream of royalty payments can also create the incentive for faculty to shift their research agenda to be more applied over time. 10 Owen-Smith and Powell (2001) report that Jim Helfenstein, a faculty member who has never disclosed an invention, though his research has many potential commercial applications, stated to them that “For people like me it [awareness of patenting] is essentially zero. I probably know less about that than I do about Medieval European social history. Really, that happens to be something I’m interested in. It just—there’s no information provided here, no advice urged upon us. If we wanted to do anything about this we’d have to be very high motivated to go out and seek the information, get the advice. We’d have to, I think, be more sophisticated than most of us are—than I certainly am—to know when to do that or what sort of thing should trigger it.”

8
in” to technology transfer is an important determinant of disclosure; they characterize faculty disclosure as an input to the technology transfer process. Owen-Smith and Powell (2001, p. 99) argue that “faculty decisions to disclose are shaped by their perceptions of the benefits of patent protection” and that the “incentives to disclose are magnified or minimized by the perceived costs of interacting with technology transfer offices and licensing professionals.” Once disclosure occurs, the TTO “simultaneously evaluates the commercial potential of the technology and decides whether to patent the innovation” (Siegel, Waldman and Link 2003, p. 29). The decision to seek a patent “poses a dilemma for TTOs because they have limited resources for filing patents” (p. 29). Industry demand is clearly a driver in this decision process. Owen-Smith and Powell (2003, p. 1705) quote a TTO licensing officer as saying: “Genuinely speaking, unless we have companies interested in a technology, we simply can’t afford to go forward. If that company doesn’t agree to reimburse us for patenting costs, then that’s the decision right there.” The influence of TTO decision making and industry demand are unobservable in the patent application data employed here. Here we use the number of patents that the institution has received in the past as a proxy for culture and effectiveness of the TTO. An additional control for the effect of the TTO is a dummy variable for whether the university had a dedicated TTO function in 1990.11
We also expect patent activity to be related to field of specialization. For example, in certain fields patenting is not the preferred means of intellectual property protection. In computer sciences, by way of example, it is much more common to copyright than to patent research in the area of software. In other fields with a strong emphasis on applied research, such as engineering, it is fairly common to apply for patents for intellectual property protection. Murray (2002) makes the case that in the field of biomedical research the marginal cost of patenting can be quite low and may flow directly out of a line of research. This is one reason why the majority of both issued patents and revenues resulting from innovation at most universities come from innovations in the biomedical field (Powell and Owen-Smith 1998, Henderson, Jaffe and Trajtenberg 1998.)12 A related reason is that much of the research in the life sciences can be characterized as falling in Pasteur’s quadrant (Stokes 1997), where research has both an applied and basic nature. This is not the case in basic fields such as theoretical particle physics. Consequently, we would expect individuals working in such basic fields to engage in little patent activity.13
Personal characteristics expected to relate to patent activity include age (or some variant of age such as the number of years since receipt of the Ph.D.) in a non-linear form, citizenship status, gender and receipt of federal funding. To the extent that the incentive to do patentable research is no different than that to do publishable research, we 11 We use AUTM survey data to determine the date that the university reported at least .5 full-time-equivalent working in technology transfer. 12 This is not to downplay the tremendous importance of demand factors in leading scientists to seek patent protection in areas of biomedical research. 13 This is not to say that basic researchers never patent. In the course of basic research, equipment may be developed to address a research problem that eventually is patented. Colyvas et al (2002) report a case study of a patent granted for a “proof of concept” for a process generating light of a particular wavelength. The discovery occurred in the course of a funded basic research project in the field of astrophysics.

9
would expect the rate of patenting to decline (or eventually decline) following a pattern similar to that observed in age-publishing profiles (Levin and Stephan 1993).14 But, these effects may be mitigated by career-stages events. Early in the career, while the individual is working to obtain tenure, activities that take time away from publication may be eschewed; while late in the career the faculty member may “cash in,” allocating time towards activities that produce a stream of revenues subsequent to retirement (Audretsch and Stephan 1999; Dasgupta and David 1994; Thursby and Thursby 2001). These effects may also be mitigated by cohort effects since, in cross sectional analysis, age is also a proxy for cohort. To the extent that the culture of the university has changed most dramatically with regard to patenting in recent years, one might expect younger faculty to be more likely to patent than older faculty, having been educated after this culture change occurred. Moreover, faculty from newer cohorts may be considerably more familiar with the disclosure process than are faculty from older cohorts.
Citizenship status may be a factor because certain research opportunities,
especially related to defense, require citizenship. We include it here for this reason and because of the widespread interest in issues related to citizenship in science and engineering (Levin and Stephan 1999). The large number of studies examining publishing differentials between men and women (see Levin and Stephan 1998 for a summary) leads us to include gender as well. Federal support is included to see if, holding other variables constant, individuals who receive federal support for research are more likely to patent than those who do not. We also expect patent productivity to be related to what we call “the right stuff.” It is well-established that science has extreme inequality with regard to scientific productivity and the awarding of priority. One indication of this is the highly skewed nature of publications, first observed by Alfred Lotka (1926) in a study of nineteenth century physics journals. The distribution that Lotka found showed that approximately six percent of publishing scientists produced half of all papers. Lotka’s “law” has since been found to fit data from several different disciplines and varying periods of time (Price 1986).15 Recent case studies of patenting behavior of scientists and engineers show that patenting activity is highly skewed as well. Narin and Breitzman (1995) examine the number of patents per inventor for four companies in the semiconductor business. They find a Lotka-like distribution in all four cases, with a large number of inventors with their 14 Levin and Stephan (1993) analyze six areas of science. They find that, with the exception of particle physicists employed in Ph.D.-granting departments, life-cycle effects are present in the fully specified model that controls for fixed effects such as motivation and ability. They do not, however, interpret this to mean that the human capital model provides a completely satisfactory explanation of life-cycle research activity. Stephan (1996, p. 1219) attributes the human capital model’s lack of explanatory power to the “fact that the production of scientific knowledge is far more complex than the human capital model assumes and that these complexities have a great deal to say about patterns that evolve over the life cycle.” She argues that a further reason human capital models come up short is that they place undue emphasis on the declining value of economic returns over the life cycle. It is not that scientists are not interested in economic rewards. They are. But, as Stephan and Levin (1992) argue, scientists also value priority of discovery and the intrinsic returns that come from engaging in puzzle-solving behavior. 15 Lotka’s law states that if k is the number of scientists who publish one paper, then the number publishing n papers is k/n2. In many disciplines this works out to some five or six percent of the scientists who publish at all producing about half of all papers in their discipline.

10
names on only one patent and a relatively small number of highly productive inventors with their names on ten or more patents. Ernst, Leptien and Vitt (2000) examine the patent activity of inventors working in 43 German companies in the chemical, electrical, and mechanical engineering industry. They, too, find that a small group of key inventors is responsible for the major part of the company’s technological performance. Agrawal and Henderson (2002) find a highly skewed distribution of patents for the MIT engineers in their study: 44% were never an inventor on a patent during the 15-year period; less than 15% had been granted more than 5 patents; and less than 6% had been granted more than 10. Azoulay, Ding and Stuart (2004) find that 19 percent of their sample of publishing university researchers working in areas related to biotechnology had one or more patent between the date of their degree and 1999.16 Thursby and Thursby (2003) report highly skewed distributions for disclosure. Of the 3,342 faculty in their study, 64.2% never disclosed an invention; 14.8% disclosed in only one year, and 7.6% disclosed in only two years. Only 2.0% disclosed in eight or more years. Scientific productivity is not only characterized by extreme inequality at a point in time; it is also characterized by increasing inequality over the careers of a cohort of scientists, suggesting that at least some of the processes at work are state dependent. Weiss and Lillard (1982), for example, find that not only the mean but also the variance of publication counts increased during the first ten to 12 years of the career of a group of Israeli scientists. Merton christened this inequality in science the Matthew Effect, defining it to be “The accruing of greater increments of recognition for particular scientific contributions to scientists of considerable repute and the withholding of such recognition from scientists who have not yet made their mark.” (1968, p. 58). Merton argues that the effect results from the vast volume of scientific material published each year, which encourages scientists to screen their reading material on the basis of the author’s reputation. Other sociologists (Allison and Stewart 1974; and Cole and Cole 1973, for example) have argued that additional processes are at work that result in scientists accumulating advantage, as they leverage past success into future success. While we have yet to understand these processes completely, a strong case can be made that a variety of factors are at work in helping able and motivated scientists leverage their early successes and that some form of feedback mechanism is at work. The “right stuff,” properly leveraged, leads certain scientists and engineers to be highly productive. The “right stuff” suggests that unobservable characteristics related to patenting may also be related to publishing. This raises the possibility that the publication measure may be endogenous. Because of this we use instruments for the number of publications.
Several studies have examined the relationship between publishing and patenting. Agrawal and Henderson (2002), for example, examine patenting activity at the individual
16 The sample is restricted to individuals who had at least one publication in a post-graduate year, did not publish exclusively under corporate affiliations, and did not exit academe early in their careers.

11
level for U.S. university faculty.17 In their study of engineers at MIT in the departments of Mechanical Engineering and Electrical Engineering and Computer Science they relate patent activity, in a fixed-effects model, to publishing activity. They restrict their sample to faculty members who have either patented or published or done both during the period 1983-1997. They find no evidence that the two activities are substitutes; neither do they find evidence that they are complements. They do, however, find that increased patent activity is correlated with increased rates of citation to the faculty member’s publications when citations to publications is the dependent variable. This may be related to the fact that industry seeks out well-known scientists to work on projects and in the process the scientists are steered towards patenting. Two recent studies examine the patent activity of researchers in Europe. Carayol (2004) studies the patenting activity of faculty at University Louis Pasteur, France, and finds patents to be positively related to publications. Calderini, Franzoni and Vezzulli (2004) focus on the patent activity of a sample of Italian researchers working at publicly funded institutions. They find that both the quantity and quality of publications increases the hazard of the researcher patenting with a private company.
Thursby and Thursby (2003) examine disclosure activity among a longitudinal sample of faculty working at six research universities during the period 1983-1999, with variation of period by institution. Faculty included in the study were listed on the university’s roster for the 1993 NRC survey of doctorate granting departments. Their research, which is of a preliminary nature, finds disclosures to be negatively related to age and positively related to tenure status. They also find that cohort matters but not in the way predicted by the “new culture” hypothesis. Instead, they find that newer cohorts are less likely to disclose. They also find disclosure to be positively related to publications and a measure of department quality.
Several papers examine the relationship between patenting and publication in the
United States and are noted here. Azoulay, Ding and Stuart (2004), for example, examine the impact of patenting on the publication activity of university researchers working in areas related to biotechnology. They find that “patenting has a positive effect on the rates of publication of journal articles” (p.1 ). Markiewicz and DeMinin (2004) also find patents to have a positive and significant effect on publication production of university researchers in their sample. Section Four: Data and Methods Data Description
17 Colyvas et al. report case studies of inventions created at Columbia University and Stanford University. Five of the eleven cases involved publication. IP protection, usually in the form of a patent, was involved in all of the eleven. Carayol (2004) examines the patenting activity of faculty at a large French university; Breschi, Lissoni and Montobbio (2004) examine the patenting activity of a sample of university faculty in Italy.

12
Data for this study come from the 1995 Survey of Doctorate Recipients (SDR).18 The SDR is a biennial longitudinal survey of doctorate recipients in the U.S. It is administered by the Science Resources Statistics (SRS) division of the NSF. The sampling frame for the SDR is the Survey of Earned Doctorates (SED), which is the census of all Ph.D.s awarded in the United States and is administered at the time of graduation. The SDR in 1995 included a question on patent activity and publishing activity during the past five years.19 For the purposes of this paper, we use the number of patent applications made in the past five years as an indicator of patent activity20 and the number of articles published in the past five years as a measure of publishing activity. We restrict the sample to those working fulltime in academic institutions which grant a four year degree or higher and exclude individuals trained in areas other than science and engineering, such as the humanities, the social sciences (including psychology) and business. We further subdivide the sample into four fields: computer sciences, life sciences, physical sciences and engineering.
Both the patent and paper measures are highly skewed, as is shown in Table 1. The distribution of patents is considerably more skewed, however, than that of publications. For example, while only about 9% of the sample made a patent application (and only .5% made more than five applications) more than 85 percent published at least one article and almost 45% published more than five articles in the past five years. Among the sample, engineers are most likely to patent, computer scientists the least likely to patent. Computer scientists are also the least likely to publish one or more articles and have the lowest percent reporting 10 or more articles during the previous five years.21 The somewhat surprising finding, in light of the earlier discussion, that patenting among life scientists is lower than patenting among engineers likely reflects the broad criteria used to define the life sciences, which encompasses those working in all areas of the life sciences, such as agricultural and food sciences, not only narrowly defined areas such as microbiology and biochemistry.22
Table 2 explores the degree to which patents and publications are related, by examining the joint distribution of patents and article counts. Approximately 14% neither publish nor patent; slightly more than 9% do both. The table also demonstrates that the two measures of productivity are related to each other. Virtually none of the non-
18 Morgan, Kruytbosch and Kannankutty (2002) use the Survey of Doctorate Recipients to explore characteristics of academics who patent 19 The specific patent question was “Since April 1990, have you been named as an inventor on any application for a U.S. patent?” If the answer to this question was “Yes,” survey participants were asked “How many applications for U.S. patents have named you as an inventor?” Although the question does not ask specifically about institutional assignment, we assume that in the vast majority of cases the patent, if awarded, is assigned to the university. 20 Our measure of patent activity over counts inventions that result in issued patents and undercounts faculty inventions that are licensed but not patented. 21 Agrawal and Henderson (2002) find patents to be more highly skewed than publications for the MIT engineers that they study. 22 For purposes of analysis we used the five broad fields of S&E defined by the SDR. Within this classification, the life sciences encompasses agricultural and food sciences, biological sciences, and environmental life sciences.
13
publishers, for example, patent, while a sixth of the “stars” make one or more patent applications.23
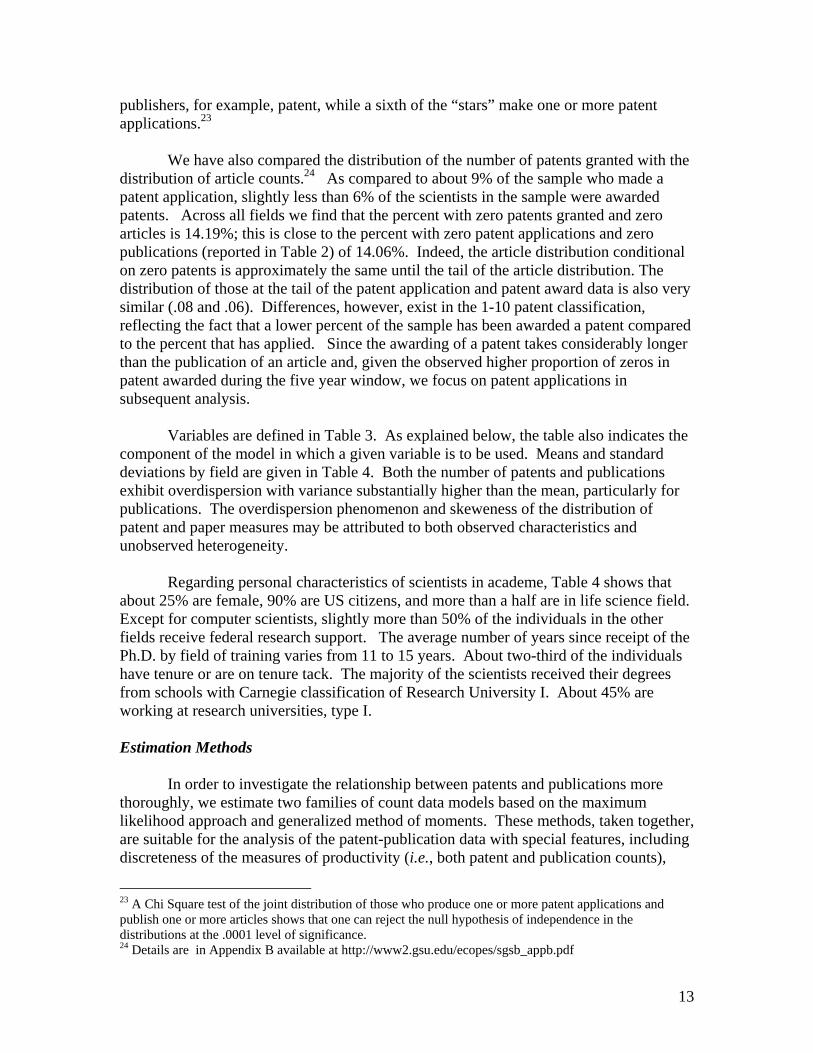
We have also compared the distribution of the number of patents granted with the
distribution of article counts.24 As compared to about 9% of the sample who made a patent application, slightly less than 6% of the scientists in the sample were awarded patents. Across all fields we find that the percent with zero patents granted and zero articles is 14.19%; this is close to the percent with zero patent applications and zero publications (reported in Table 2) of 14.06%. Indeed, the article distribution conditional on zero patents is approximately the same until the tail of the article distribution. The distribution of those at the tail of the patent application and patent award data is also very similar (.08 and .06). Differences, however, exist in the 1-10 patent classification, reflecting the fact that a lower percent of the sample has been awarded a patent compared to the percent that has applied. Since the awarding of a patent takes considerably longer than the publication of an article and, given the observed higher proportion of zeros in patent awarded during the five year window, we focus on patent applications in subsequent analysis.
Variables are defined in Table 3. As explained below, the table also indicates the component of the model in which a given variable is to be used. Means and standard deviations by field are given in Table 4. Both the number of patents and publications exhibit overdispersion with variance substantially higher than the mean, particularly for publications. The overdispersion phenomenon and skeweness of the distribution of patent and paper measures may be attributed to both observed characteristics and unobserved heterogeneity.
Regarding personal characteristics of scientists in academe, Table 4 shows that
about 25% are female, 90% are US citizens, and more than a half are in life science field. Except for computer scientists, slightly more than 50% of the individuals in the other fields receive federal research support. The average number of years since receipt of the Ph.D. by field of training varies from 11 to 15 years. About two-third of the individuals have tenure or are on tenure tack. The majority of the scientists received their degrees from schools with Carnegie classification of Research University I. About 45% are working at research universities, type I. Estimation Methods
In order to investigate the relationship between patents and publications more thoroughly, we estimate two families of count data models based on the maximum likelihood approach and generalized method of moments. These methods, taken together, are suitable for the analysis of the patent-publication data with special features, including discreteness of the measures of productivity (i.e., both patent and publication counts),
23 A Chi Square test of the joint distribution of those who produce one or more patent applications and publish one or more articles shows that one can reject the null hypothesis of independence in the distributions at the .0001 level of significance. 24 Details are in Appendix B available at http://www2.gsu.edu/ecopes/sgsb_appb.pdf

14
skewed distribution, extremely high proportion of individuals who don’t patent, and, more importantly, potential correlation between publications and unobserved heterogeneity.
The number of patent applications, denoted as y1 = Uspapp95, depends on the
number of articles published (y2 = Article95) and other observed and unobserved factors. In our generic model, the expected number of patents for individual i (i = 1, …, N), conditional on observed and unobserved heterogeneity, is specified as
E(y1i⏐ y2i , X2i, νi) = exp(y2iα1 + X2iβ2) νi, (1)
where X2 is a vector of other explanatory variables and ν is the unobserved heterogeneity component. As argued in section three above, the two measures of productivity of scientists – patenting and publishing – are likely to be strongly correlated. Since the latent variable on scientific productivity is unobserved, the variable y2i = Article95 used as a regressor in patent equation (1) is likely to be endogenous. As such, Article95 is likely to be correlated with unobservable determinants of the patent equation. Further, given the features of publication data noted earlier, a linear model for Article95 is unrealistic. Consequently, in order to provide consistent estimates of parameters of interest, the basic modeling approach relies on nonlinear instrumental variable estimation of models of individual patent and publication behavior.
In implementing both the likelihood and moment-based methods, we have two choices for instruments. The first choice draws on variables collected in the 1995 SDR, and includes the Carnegie classification of the university; see table 3 and 4 for definitions and summary statistics. The instruments also include exogenous factors, X2 . These instruments are available for the entire sample. For a smaller sample, working at doctoral-granting institutions, we include the variable Articlfld92, which measures the productivity of the peer group of scientists working in doctoral rated programs and collected by the NRC for doctoral program rankings produced in 1993. Hence, we expect Articlefld92 to be correlated with Article95, but to have no direct influence on Uspapp95. In addition, Giniarticle92, the Gini Coefficient of program faculty publications, is used as an instrument to provide a measure of inequality of productivity, as measured by papers, of the peer group of scientists in academia. Thus, the instruments available for the smaller data include Articlfld92, Giniarticle92, variables on the Carnegie classification of the university, and explanatory variables in (1), except Article95.
We first present the likelihood-based method. We estimate a zero-inflated negative binomial (ZINB) model of patents, in which the number of publications is also specified as an exponential mean regression model. We choose this model given the discrete nature of the data and the high occurrence of zeros. The ZINB model adds an additional mass at the zero value of patent applications resulting in higher proportion of zeros than is consistent with the underlying negative binomial regression. The main justification for using zero-inflated counts is to allow for the potential of misrecording of zero patents. The zeros reported by individuals who did not make patent applications may arise from two sources. Zero patents may be recorded for those who either never made
15
patent applications or for those who do but did not do so during the past five years. Ignoring this potential error in recording would lead to misspecification.
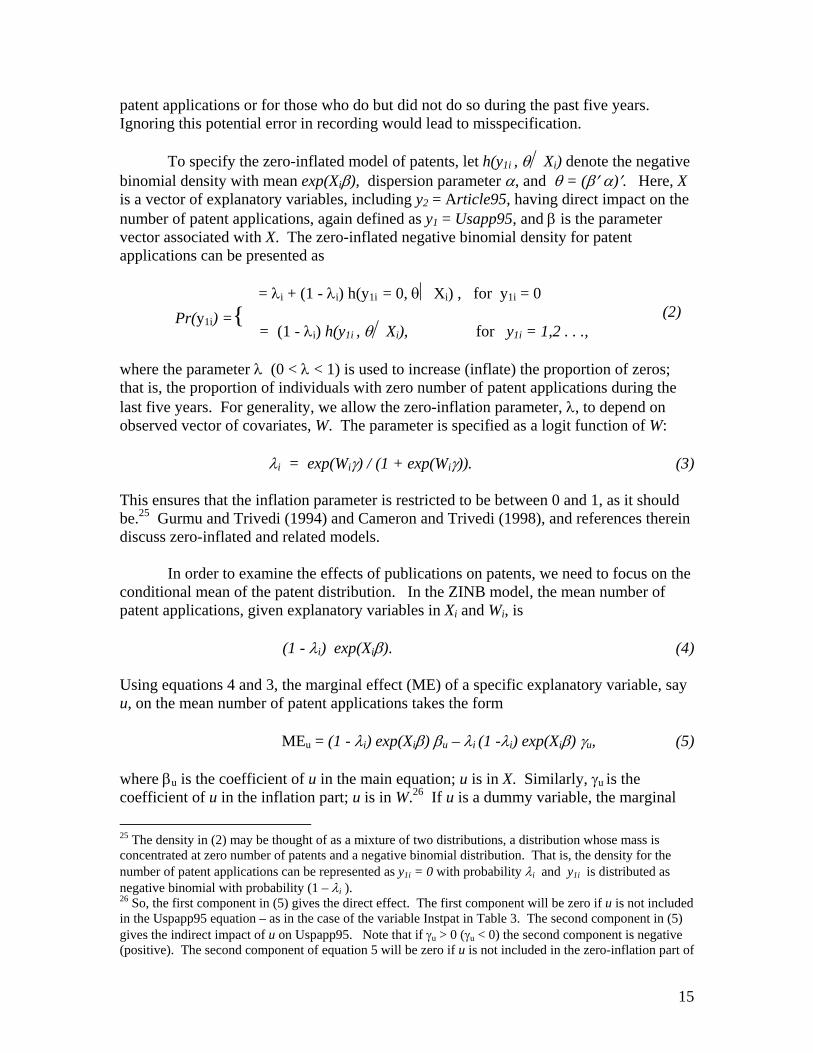
To specify the zero-inflated model of patents, let h(y1i , θ⏐ Xi) denote the negative
binomial density with mean exp(Xiβ), dispersion parameter α, and θ = (β′ α)′. Here, X is a vector of explanatory variables, including y2 = Article95, having direct impact on the number of patent applications, again defined as y1 = Usapp95, and β is the parameter vector associated with X. The zero-inflated negative binomial density for patent applications can be presented as
= λi + (1 - λi) h(y1i = 0, θ⏐ Xi) , for y1i = 0
(2)Pr(y1i) ={= (1 - λi) h(y1i , θ⏐ Xi), for y1i = 1,2 . . .,
where the parameter λ (0 < λ < 1) is used to increase (inflate) the proportion of zeros; that is, the proportion of individuals with zero number of patent applications during the last five years. For generality, we allow the zero-inflation parameter, λ, to depend on observed vector of covariates, W. The parameter is specified as a logit function of W:
λi = exp(Wiγ) / (1 + exp(Wiγ)). (3)
This ensures that the inflation parameter is restricted to be between 0 and 1, as it should be.25 Gurmu and Trivedi (1994) and Cameron and Trivedi (1998), and references therein discuss zero-inflated and related models.
In order to examine the effects of publications on patents, we need to focus on the
conditional mean of the patent distribution. In the ZINB model, the mean number of patent applications, given explanatory variables in Xi and Wi, is
(1 - λi) exp(Xiβ). (4)
Using equations 4 and 3, the marginal effect (ME) of a specific explanatory variable, say u, on the mean number of patent applications takes the form
MEu = (1 - λi) exp(Xiβ) βu – λi (1 -λi) exp(Xiβ) γu, (5)
where βu is the coefficient of u in the main equation; u is in X. Similarly, γu is the coefficient of u in the inflation part; u is in W.26 If u is a dummy variable, the marginal 25 The density in (2) may be thought of as a mixture of two distributions, a distribution whose mass is concentrated at zero number of patents and a negative binomial distribution. That is, the density for the number of patent applications can be represented as y1i = 0 with probability λi and y1i is distributed as negative binomial with probability (1 – λi ). 26 So, the first component in (5) gives the direct effect. The first component will be zero if u is not included in the Uspapp95 equation – as in the case of the variable Instpat in Table 3. The second component in (5) gives the indirect impact of u on Uspapp95. Note that if γu > 0 (γu < 0) the second component is negative (positive). The second component of equation 5 will be zero if u is not included in the zero-inflation part of
16
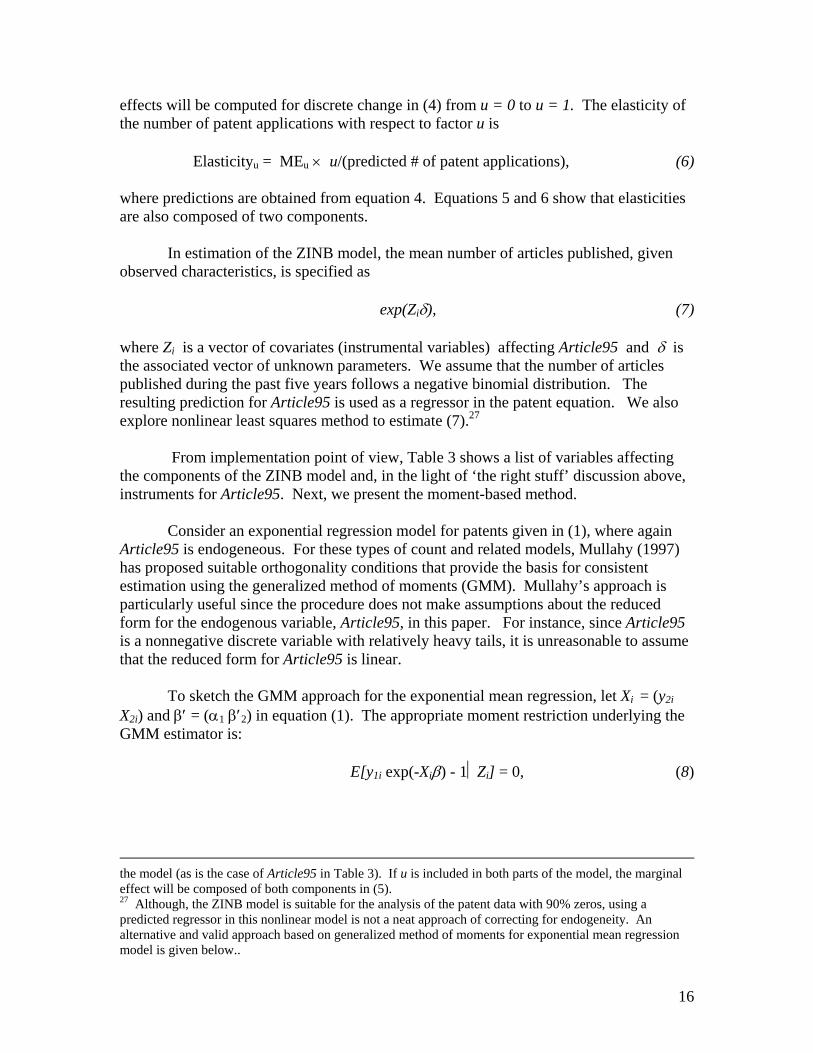
effects will be computed for discrete change in (4) from u = 0 to u = 1. The elasticity of the number of patent applications with respect to factor u is
Elasticityu = MEu × u/(predicted # of patent applications), (6)
where predictions are obtained from equation 4. Equations 5 and 6 show that elasticities are also composed of two components.
In estimation of the ZINB model, the mean number of articles published, given observed characteristics, is specified as
exp(Ziδ), (7)
where Zi is a vector of covariates (instrumental variables) affecting Article95 and δ is the associated vector of unknown parameters. We assume that the number of articles published during the past five years follows a negative binomial distribution. The resulting prediction for Article95 is used as a regressor in the patent equation. We also explore nonlinear least squares method to estimate (7).27
From implementation point of view, Table 3 shows a list of variables affecting the components of the ZINB model and, in the light of ‘the right stuff’ discussion above, instruments for Article95. Next, we present the moment-based method.
Consider an exponential regression model for patents given in (1), where again Article95 is endogeneous. For these types of count and related models, Mullahy (1997) has proposed suitable orthogonality conditions that provide the basis for consistent estimation using the generalized method of moments (GMM). Mullahy’s approach is particularly useful since the procedure does not make assumptions about the reduced form for the endogenous variable, Article95, in this paper. For instance, since Article95 is a nonnegative discrete variable with relatively heavy tails, it is unreasonable to assume that the reduced form for Article95 is linear.
To sketch the GMM approach for the exponential mean regression, let Xi = (y2i
X2i) and β′ = (α1 β′2) in equation (1). The appropriate moment restriction underlying the GMM estimator is:
E[y1i exp(-Xiβ) - 1⏐Zi] = 0, (8)
the model (as is the case of Article95 in Table 3). If u is included in both parts of the model, the marginal effect will be composed of both components in (5). 27 Although, the ZINB model is suitable for the analysis of the patent data with 90% zeros, using a predicted regressor in this nonlinear model is not a neat approach of correcting for endogeneity. An alternative and valid approach based on generalized method of moments for exponential mean regression model is given below..

17
where Zi is a vector of instrumental variables and the residual function (y1i exp(-Xiβ) -1) ≡ ε ( y1i, Xi ; β) is uncorrelated with any function of Zi. The GMM estimator of β minimizes the objective function g(y1i, Xi , Zi ; β)′ V g(y1i, Xi , Zi ; β), (9) where g(y1i, Xi , Zi ; β) = N-1Σi
[Z′i ε( y1i, Xi; β)] and V is a positive definite weighting matrix. The optimal GMM uses V = {var[g(y1i, Xi , Zi ; β) / N1/2]}-1. For the patent model, the list of regressors and instruments used in the GMM approach are shown in the last two columns of Table 3.28 The optimal GMM is obtained
as follows. First, a preliminary consistent estimator of β, say~β , is obtained by
minimizing the objective function (9) using the weighting matrix V* = [ΣiZ′iZi / N]-1. In the second step, the weighting matrix is estimated by
^
V = [Σi ε2(y1i, Xi; ~β ) Z′iZi / N]-1.
Then, the optimal GMM estimator of β is obtained from (9) using the estimated
weighting matrix ^
V . Section Five: Estimation Results and Research Findings Patenting and Publishing
We find patents and publications to be positively and significantly related, regardless of choice of instruments, using both the ZINB model and the GMM model (see Table 5). The patent elasticity with regard to publishing is .341 for the large data sample, using the ZINB model. This indicates that, starting from sample average values of characteristics, a 1 percent increase in articles published raises the number of patent applications by approximately .341 percent. The GMM estimate is almost a magnitude higher, suggesting that a one percent increase in article production raises patent applications by 2 percent. The large difference between the two estimates speaks undoubtedly to the quality (or lack thereof) of the instruments. When we use the preferred instruments, for the smaller data set, the ZINB and GMM models provide elasticities and marginal effects that are remarkably close to each other. The estimated patent elasticity with respect to publishing is about 1.2. The ZINB effect is significant at the one percent level; the GMM at the 10 percent level.29
28 Note that any function (e.g., polynomials and interaction terms) of the variables given in the last column of Table 3 can serve as an instrument. 29 For the ZINB model using small data, we have also explored specifications where publications also enter the inflation part of the model. The coefficient on Article95 in the inflation part is insignificant, but is positive and highly significant in the main equation. The patent elasticity with regard to publishing is 1.02.

18
Patenting-publishing elasticities are reported by field in Table A-1. For the life sciences, we find a significant and positive relationship for both the large and small data set, using both the ZINB and GMM models. Again, the GMM elasticity is considerably larger than the ZINB elasticity. When the preferred instruments are used with the smaller data set, we again find elasticities that are comparable, although only the ZINB elasticity is significantly different from zero at traditional levels of significance. We see no indication of a significant relationship between publishing and patenting in the physical sciences or in engineering in the larger data set. But, when we combine engineering and the physical sciences in the smaller data set, we find a significant relationship, with an elasticity of .78. We are unable to obtain convergence with the GMM model for this smaller group.
Because these are the first elasticities of patenting with respect to publishing that
we know to have been computed, we cannot compare them with others. But the estimated magnitudes suggest that technology transfer offices would benefit not only from encouraging disclosure of existing research but also by encouraging the research (and publication activity) of faculty, especially in the life sciences.
Individual and Institutional characteristics
The coefficients for other variables are summarized for the ZINB model in Table 6 and the GMM model in Table 7. In the case of the ZINB model a positive coefficient in the inflation part of the model implies a negative impact on the number of patent applications; a negative coefficient implies a positive impact. Results are given for “all” scientists and engineers working in academe regardless of field. Table 6 demonstrates the gain from estimating the model in two components. Variables included in both the inflation part and the negative binomial often lack significance in one equation but have significance in the other. Vuong test statistics in all regressions for academe as well as for each broad field favor the zero inflated models. The zero-inflation is significant in all cases. In the case of GMM model, Hansen’s J-test statistic for overidentifying restrictions shows that, in each case, there is no indication of misspecification at conventional levels of significance30.
Given that independent variables affect both parts of the zero-inflated negative
binomial models, for ease of interpretation, marginal effects and elasticities are presented (see Table 8). All marginal effects and elasticities are evaluated at the sample average values of explanatory variables. The t-ratios for these marginal effects are noisy and thus not reported. Instead, inferences concerning the significance of a variable are drawn by looking at the t-ratios for the ZINB coefficients. The general rule of thumb is that if the coefficient on a variable in either one or both parts of the model is significant, the marginal effect is significant. If neither coefficient is significant, but both are “close,” the marginal effect is also significant. Coefficients for the GMM model are presented in Table 7; marginal effects are provided in Table 8.
30 Estimation of the publication equation using negative binomial model or nonlinear least squares shows that, when all instruments are included in the exponential conditional mean, the main instruments Articlfld92 and most of the variables on Carnegie classification of the school are significant.

19
Tables 6, 7, and 8 demonstrate that a number of demographic characteristics have
a significant impact on the expected number of patents, although in some instances the effect depends on the estimating strategy. For example, when the inflation issue is addressed, we find that women patent less than men, although the effect is smaller when the better instruments are used. Likewise, in both the ZINB and GMM models individuals who say their primary or secondary work activity is in applied or basic research, development or design are found to patent more than those who do not report this to be their primary or secondary activity.
Life-cycle effects are found in the ZINB model and in the GMM model when the
larger data set is used. To wit, we find patent activity to increase with years since the PhD; there is the suggestion that this is mitigated by the presence of tenure. Caution must be taken interpreting these results, of course, since it is well known that cross-sectional data produce biased estimates on variables related to time, such as years since receipt of Ph.D. (Levin and Stephan 1991).
Where one works has a considerable impact on patent activity. For example, the
number of patent applications is higher for those working in a medical institution compared to the benchmark, regardless of whether the GMM or ZINB model is used and regardless of the instrument used, although the size of the medical school effect is smaller when the better instrument is used. We also find evidence that scientists and engineers who work in research institutes patent more.
The patenting culture and effectiveness of the university TTO office, as proxied
by the number of university patents, also clearly affect the degree to which individuals patent. Regardless of model or instruments, we find individual patents to be positively related to the number of patents received during the past five years by the institution (Instpat). The size of the estimated elasticities of individual patent with respect to institutional patent range from .4 to 1.2 percent, for every 10 percent increase in the number of patents received by the institution.
As noted earlier, an additional control for the effect of the TTO is a dummy
variable for whether the university had a dedicated TTO function by 1990. Equations for total academe are re-estimated adding the TTO dummy. These results are available in Appendix B.31 The use of the TTO variable, on top of Instpat variable, does not alter the relationship between publishing and patenting in both the ZINB and GMM results. Except in the ZINB for the big data, where the coefficient is positive and significant at 10 percent, in all other specifications the TTO dummy variable is positive but not significant.
Field of specialization also plays a key role in determining the number of patents.
Consistently we find that engineers make more patent applications than the benchmark of 31 Appendix B is at http://www2.gsu.edu/ecopes/sgsb_appb.pdf. As an exploratory analysis, this appendix also gives summary results from the ZINB model without instruments.

20
those working in the life sciences. The difference is statistically significant but the magnitude is not large; the marginal effects vary between .17 and .32 patents. Physical scientists are also found to be more likely to patent when the larger data set is used; there is some indication that computer scientists are less likely to patent. Results by field are given in Tables A2-A4. The size of certain fields precludes analysis or leads us to combine fields. For example, the number of cases in computer science was too small to allow for model estimation. It was also necessary to combine the physical sciences and engineering in the small data set in order to estimate the ZINB model. Several field findings deserve comment. First, the medical school effects are present regardless of field or specification. Thereafter, results appear to be quite field and model dependent. For example, men are more likely to patent in the physical sciences; but the result is found only in the large data set for the GMM model. Likewise, those who received a degree from a Research I institution are more likely to patent in the physical sciences, but the result again holds only in the large data set using the GMM estimates. Institution of training has a positive impact on patent activity in the life sciences, but the result is sensitive to the model that is used. The institutional patent variable is most relevant to the patenting activity of life scientists and the life cycle/tenure effects are found predominately in the life sciences as well. Section Six: Summary and Conclusion
This research uses the 1995 Survey of Doctorate Recipients to examine the question of who in the university is patenting. Because standard methods of estimation are not directly applicable, we use a zero-inflated negative binomial model to estimate the patent equation, using instruments for the number of articles to avoid problems of endogeneity. Because the ZINB model imposes certain restrictions, we also estimate the patent model using the generalized method of moments estimation of count data models with endogenous regressors. We estimate the ZINB and GMM models for both the large data set and the small data set, for which preferred instruments are available. To the extent that there are differences in the results from the two models using the large and the small data sets, results from the small data using the GMM approach are expected to be more reliable. On the other hand, the large data set provides sufficient observations to enable us to estimate the model by field of training.
We find work context and field to be important in predicting the number of patent
applications that a faculty member makes. In particular, we find individuals working at medical schools to have a higher proclivity to patent as do individuals working at research institutes. Moreover, those working in institutions that have a rich patent history are also more likely to patent. Field differences also exist, most notably and consistently among engineers, who, compared to those in the life sciences, have a higher propensity to patent. There is a suggestion that those in the physical sciences also patent more, relative to the benchmark, while those in computer science patent less. We find little evidence of

21
life-cycle effects but the cross-sectional nature of our data detracts from the robustness of this result. We do find that tenured faculty in several fields are less likely to patent than non-tenured faculty.
We find patents to be positively and significantly related to the number of
publications. This finding is robust to the choice of instruments and method of estimation. When we break the analysis down by specific field, we find the patent-publishing results to persist in the life sciences; we find some indication that the relationship exists for the physical/engineering sciences.
Considerable concern has been expressed in recent years that the move towards
commercialization in the university community comes at the expense of the production of knowledge (Stephan and Levin 1996). There are at least two variants of the crowding-out hypothesis. One variant argues that in the changing university culture scientists and engineers increasingly choose to allocate their time to research of a more applied as opposed to basic nature.32 Another variant of the crowding-out hypothesis is that the lure of economic rewards encourages scientists and engineers (and the universities where they work) to seek IP protection for their research results, eschewing (or postponing) publication and thus public disclosure.33 Much of the work of Blumenthal and his collaborators (1996) focuses on the latter issue in the life sciences, examining the degree to which university researchers receive support from industry and how this relates to publication.34
The strong correlation that we find between patenting and publishing does not
suggest that commercialization has come at the expense of placing knowledge in the public domain. The data clearly preclude our providing a definitive answer to the question of crowding out, however. For example, we have no information on citations, either to articles or patents, and thus have no prospect of relating the quality of publications to the quality of patents. Moreover, our cross sectional data precludes investigating how changes in the incentive structure affect research outcomes. Considerably more research is needed to address the issue of whether the Bayh-Dole Act had unintended consequences of crowding out basic research. It is our hope that this research whets the appetite of others doing research in the area of technology transfer—and of data gathering agencies—to continue this line of research.
32 The model examined by Jensen and Thursby (2003) suggests that a changing reward structure may not alter the research agenda of faculty specializing in basic research. 33 Clearly, these two variants are not mutually exclusive. 34 There is the related concern that the granting of intellectual property can hinder the ability of researchers to build on a given piece of knowledge. This anticommons hypothesis, articulated by Heller and Eisenberg (1998) and David (2001), postulates that the assignment of IPR provides researchers with the ability to exclude others from using the knowledge for cumulative knowledge production.
22
References Adams, James D., Grant C. Black, Roger Clemmons, and Paula Stephan, (2002), “Patterns of Research Collaboration in U.S. Universities, 1981-1999,” draft. Agrawal, Ajay and Rebecca Henderson (2002), “Putting Patents in Context: Exploring Knowledge Transfer from MIT,” Management Science, 48(1):44-60. Allison, Paul D. and John A. Stewart (1974), “Productivity Differences Among Scientists: Evidence for Accumulative Advantage,” American Sociological Review, 39(4):596-606. Audretsch, David and Paula Stephan (1999), “Knowledge Spillovers in Biotechnology: Sources and Incentives,” Evolutionary Economics, 9:97-107. Azoulay, Pierre, Waverly Ding and Toby Stuart (2004), “The Impact of Academic Patenting on (Public) Research Output,” draft paper. Blumenthal, David, Nancyanne Causino, Eric Campbell and Karen Seashore Louis (1996), “Relationships Between Academic Institutions and Industry in the Life Sciences: An Industry Survey,” New England Journal of Medicine, 334:368-373. Breschi, S., F. Lissoni and F. Montobbio (2004), “Open Science and University Patenting: A Bibliometric Analysis of the Italian Case,” draft presented at BETA workshop on The Empirical Economic Analysis of the Academic Sphere, March 17, 2003, Univ. Louis Pasteur, Strasbourg. Calderini, Mario, Chiara Franzoni and Andrea Vezzulli (2004), “Scientific Eminence, Quality of Research and the Decision to Patent in Academic Career. An Event History Analysis,” presented at the conference on “Innovation Entrepreneurship and Growth,” Royal Institute of Technology Studies, Stockholm, 18-20 November, 2004. Campbell, E.G., B.R. Clarridge, M. Gokhale, L. Birenbaum, S. Hilgartner, N.A. Holtzman, and D. Bluenthal (2002), “Data Withholding in Academic Genetics.” JAMA, 287(4):473-80. Cameron, Colin and Pravin K. Trivedi (1998), Regression Analysis of Count Data. Cambridge: Cambridge University Press. Carayol, Nicholas (2004), “Academic Incentives and Research Organization for Patenting at a large French University,” unpublished paper Univ. Louis Pasteur, Strasbourg. Colyvas, Jeannette, Michale Crow, Annetine Gelijins, Roberto Mazzoleni, Richard Nelson, Nathan Rosenberg and Bhaven N. Sampat (2002), “How Do University Inventions Get Into Practice?” Management Science 48(1):61-72..

23
Cole, Jonathan R. and Stephen Cole (1973), Social Stratification in Science. Chicago: U. of Chicago Press. Dasgupta, Partha and Paul A. David (1987), “Information Disclosure and the Economics of Science and Technology,” in Arrow and the Ascent of Modern Economic Theory, ed, George R. Feiwel, New York: New York University Press, pp. 519-42. David, Paul (2001), “From Keeping ‘Nature’s Secrets’ to the Institutionalization of ‘Open Science,” Stanford Working Paper #01-005. Dasgupta, Partha and Paul A. David (1994). “Towards a New Economics of Science,” Research Policy 23(5): 487-521. Ducor, Philippe (2000), “Coauthorship and Coinventorship,” Science, 289:873-875. Eisenberg, Rebecca (1987), “Proprietary Rights and the Norms of Science in Biotechnology Research,” Yale Law Journal 97(2):177-231. Ernst, Holger, Christopher Leptien and Jan Vitt (2000), “Inventors Are Not Alike: The Distribution of Patenting Output Among Industrial R&D Personnel, IEEE Transactions on Engineering Management, 47(2):184-199. Geuna, Aldo and Lionel Nesta, (2003). “University Patenting and Its Effects on Academic Research.” SPRU Electronic Working Paper Series no. 99. Gittelman, Michelle and Bruce Kogut (2001), “Does Good Science Lead to Valuable Knowledge? Biotechnology Firms and the Evolutionary Logic of Citation Patterns,” Jones Center Working Paper #2001-04. Gurmu, Shiferaw and Pravin K. Trivedi (1994), “Recent Developments in Methods of Event Counts: A Survey,” Thomas Jefferson Center Discussion Paper #261, Department of Economics, University of Virginia. Heller, M and Rebecca Eisenberg (1998), “The Tragedy of the Anticommons: Property in the Transition from Marx to Markets,” 111 Harvard Law Review 621. Henderson, Rebecca, Adam B. Jaffe, and Manuel Trajtenberg (1998), “Universities as a Source of Commercial Technology: A Detailed Analysis of University Patenting, 1965-1988,” Review of Economics and Statistics 80:119-27. Hicks, Diana Tony Breitzman, Dominic Olivastro & Kimberly Hamilton (2000) “The Changing Composition of Innovative Activity in the U.S.—a Portrait Based on Patent Analysis,” CHI, unpublished.

24
Hicks, Diana (1995), “Published Papers, Tacit Competencies and Corporate Management of the Public/Private Character of Knowledge,” Industrial and Corporate Change, 4(2):401-24. Hull, David L. (1988). Science as a Process. Chicago: University of Chicago Press. Jensen, Richard and Marie Thursby (2001), “Proofs and Prototypes for Sale: The Licensing of University Inventions,” American Economic Review, 91(1): 240-259. Jensen, Richard and Marie Thursby (2003). “The Academic Effects of Patentable Research.” mimeo. Jensen, Richard, Jerry Thursby and Marie Thursby.” The Discolsure of University Inventions,” NBER Working Paper, no. 9734. Lach, Saul and Mark Schankerman (2004). “Royalty Sharing and Technology Licensing in Universities,” Journal of the European Economic Association, 2(2-3):252-264. Levin, Sharon and Paula Stephan (1991), “Research Productivity Over the Life Cycle: Evidence for Academic Scientists,” American Economic Review, 81(1):114-32. Levin, Sharon and Paula Stephan (1999), “Are the Foreign Born a Source of Strength for U.S. Science?” Science 285:1213-1214. Levin, Sharon and Paula Stephan (1998), “Gender Differences in the Rewards to Publishing in Academe: Science in the 1970s, Sex Roles: A Journal of Research (38)11/12:1049-1064. Lotka, Alfred J. (1926); “the Frequency Distribution of Scientific Productivity,” Journal of Washington Academy of Science, 16(12):317-23. Mallon, William T. and David Korn (2004), “Bonus Pay for Research Faculty,” Science, 303 (5657):476-477. Mansfield, Edwin (1995), “Academic Research Underlying Industrial Innovations: Sources, Characteristics, and Financing,” Review of Economics and Statistics, 77(1):55-65. Markiewicz, Kira R and Alberto DiMinin (2004), “Commercializing the Laboratory: The Relationship Between Faculty Patenting and Publishing,” unpublished paper, University of California, Berkeley. Merton, Robert K. (1957). “Priorities in Scientific Discovery: A Chapter in the Sociology of Science.” American Sociological Review 22:635-59. Merton, Robert K. (1968), “The Matthew Effect in Science,” Science: 159(3810):56-63.

25
Morgan, Robert P., Carlos Kruytbosch and Nirmala Kannankutty, “Patenting and Invention Activity of U.S. Scientists and Engineers in the Academic Sector: Comparisons with Industry.” Presented at the University-Industry Technology Transfer Conference, Purdue University, June 10, 2000. Mowery, David, Richard Nelson, Bhaven Sampat and A. Ziedonis (2001), “The Growth of Patenting and Licensing by U.S. Universities: An Assessment of the Effects of the Bayh-Dole Act of 1980,” Research Policy. 30:99-119. Mullahy, John (1997), “Instrumental Variable Estimation of Count Data Models: Applications to Models of Cigarette Smoking Behavior,” Review of Economics and Statistics, 79: 586-593. Murray, Fiona (2002), “Innovation As Co-evolution of Scientific and Technological Networks: Exploring Tissue Engineering,” Research Policy, 31(8-9): 1389-1403. Murray, Fiona and Scott Stern (2004), “Do Formal Intellectual Property Rights Hinder the Free Flow of Scientific Knowledge? An Empirical Test of the Anti-Commons Hypothesis,” presented at REER Conference, Georgia Institute of Technology, 3-5 December, 2004. Narin, Francis and Anthony Breitzman (1995) “Inventive Productivity,” Research Policy, 24: 507-519. Owen-Smith, Jason and Walter W. Powell (2001) “To Patent or Not: Faculty Decisions and Institutional Success at Technology Transfer,” Journal of Technology Transfer 26(1/2):99-114. Owen-Smith, Jason and Walter Powell (2003) “The Expanding Role of University Patenting in the Life Sciences: Assessing the Importance of Experience and Connectivity,” Research Policy 32:1695-1711. Powell, Walter, Kenneth Koput and Laurel Smith-Doeer and Jason Owen-Smith (1998) “Network Position and Firm Performance: Organizational Returns to Collaboration in the Biotechnology Industry,” unpublished paper. Powell, Walter W. and Jason Owen-Smith (1998) “Universities and the Market for Intellectual Property in the Life Sciences,” Journal of Policy Analysis and Management 17(:2)253-277. Price, Derek J. De Solla (1986), Little Science, Big Science . . . and Beyond. New York: Columbia University Press.
26
Siegel, Donald S., David Waldman and Albert Link (2003), “Assessing the Impact of Organizational Practices on the Relative Productivity of University Technology Transfer Offices: An Exploratory Study,” Research Policy 32:27-48. Stephan, Paula (1996), “The Economics of Science,” Journal of Economic Literature, 34:1199-1235. Stephan, Paula and Sharon Levin (1992), Striking the Mother Lode in Science: The Importance of Age, Place and Time, New York: Oxford University Press. Stephan, Paula and Sharon Levin (1996), “Property Rights and Entrepreneurship in Science,” Small Business Economics, 8(3): Stephan, Paula and Sharon Levin (2001), “Career Stage, Benchmarking and Collective Research.” International Journal of Technology Management, 22:676-687. Stephan, Paula and Stephen Everhart (1998), “The Changing Rewards to Science: The Case in Biotechnology,” Small Business Economics. Stokes, Donald. (1997), Pasteur’s Quadrant, Washington, D.C.: Brookings Institution Press. Thursby, Jerry and Sukanya Kemp (2002), “Growth and Productive Efficiency of University Intellectual Property Licensing,” Research Policy, 31: 109-124. Thursby, Jerry and Marie Thursby (2001), “Has Patent Licensing Changed Academic Research?” NBER Working Paper No. 9991.. Thursby, Jerry and Marie Thursby (2002a), “Who is Selling the Ivory Tower? Sources of Growth in University Licensing,” Management Science, 48:90-104. Thursby, Jerry and Marie Thursby (2002b), “Are Faculty Critical? Their Role in University-Industry Licensing.” Thursby, Jerry and Marie Thursby (2003), “Patterns of Research and Licensing Activity of Science and Engineering Faculty.” mimeo Weiner, Charles (1986), “Universities, Professors, and Patents: A Continuing Controversy, Technology Review, February/March: 32-43. Weiss, Yhoram and Lee Lillard, (1978), “Experience, Vintage, and Time Effects in the Growth of Earnings: American Scientists, 1960-1970,” Journal of Political Economics, 86(3)427-47.

27
Table 1
Percentage Distribution of Number of Patents and Articles
Field 0 1-5 6-10 >10
All Academe (N=10,962)
90.914.4
8.740.8
0.4 20.9
0.123.9
Computer (N=1,159) 97.823.5
2.247.3
0.0 16.7
0.012.5
Life (N=5,936) 91.612.7
7.940.6
0.3 21.5
0.125.2
Physical (N=2,156) 90.715.5
8.737.3
*** 20.4
***27.1
Engineer (N=1,711) 83.512.6
15.541.8
*** 22.7
***23.0
*** Cells with 6 or fewer people have been suppressed at the request of Science Resources Statistics, National Science Foundation.
Table 2 Patent Applications by Publication Distribution
(All Academe, N=10,962)
Number of Patents
0 Articles
1-5 Articles
6-10 Articles
11-96 Articles
Total
0 14.06 38.38 18.72 19.70 90.85 1-5 0.32 2.42 2.09 3.82 8.65 6-10 *** *** *** 0.30 0.40 11-42 0.00 *** *** 0.08 0.10
*** Cells with 6 or fewer people have been suppressed at the request of Science Resources Statistics, National Science Foundation.

28
Table 3 Definitions of Explanatory Variables Affecting Various Model Components
ZINB Variable Description
Uspapp95 Equation
Zero-Inflation
Part
GMM Uspapp9
5 Equation
Instruments used for Article in ZINB and GMM
Uspapp95 Number of patent applications during the past 5 years.
Patent Zero-one dummy if one or more patents applied for during past 5 years
Article95 Number of articles published during past 5 years
× ×
Yrsofphd Years since individual has earned highest degree
× × × ×
Yrsofphdsq Yrsofphd-squared × × × × Femdum Zero-one dummy if female × × × × Ctzusdum Zero-one dummy if U.S.
citizen × × × ×
Fedsupdum Zero-one dummy if receive federal research support.
× × × ×
Lifefield* Zero-one dummy if in field of life sciences
Compfield Zero-one dummy if in field of computer sciences
× × × ×
Phyfield Zero-one dummy if in field of physical sciences
× × × ×
Engfield Zero-one dummy if in field of engineering
× × × ×
Univemp* Zero-one dummy for individuals employed in four-year college or university, excluding Mediemp and Reseremp
Reseremp Zero-one dummy if employed in a university research institute
× × × ×
Medicemp Zero-one dummy if employed in a medical school or center
× × × ×
Tenure Zero-one dummy if individual works in academe and has tenure
× × × ×
Tentrack Zero-one dummy if individual works in academe and is on tenure track
× × × ×

29
Nonfaculty* Zero-one dummy if individual works in nonfaculty position
Instpat Number of patents awarded to academic institution individual worked for between 1990-1994
× × ×
Rddum Zero-one dummy if primary or secondary work activity is in applied or basic research or development or design
× × × ×
Ru1dege a Zero-one dummy if Carnegie classification of school awarding degree is Research University I.
× × × ×
Ru2dege* Zero-one dummy if Carnegie classification of school awarding degree is Research University II
Doc1dege Zero-one dummy if Carnegie classificationa of school awarding degree is Doctoral Granting I.
× × × ×
Doc2dege Zero-one dummy if Carnegie classification of school awarding degree is Doctoral Granting II.
× × × ×
Medicodege Zero-one dummy if Carnegie classification of school awarding degree is Medical school or anything besides Ru1, Ru2, Doc1 and Doc2 dummies.
× × × ×
Partphys Zero-one dummy if physical scientist with field in particle/ elementary physics
× × × ×
Ru1empc Zero-one dummy if working for school with Carnegie classification of Research University I.
×
Ru2empc Zero-one dummy if working for school with Carnegie classification of Research University II
×
Doc1empc Zero-one dummy if working for school with Carnegie classification of Doctoral Granting I.
×
Doc2empc Zero-one dummy if working for school with Carnegie
×

30
classification of Doctoral Granting II.
Medicempc Zero-one dummy if working for school with Carnegie classification of a Medical school.
×
Otherempc* Zero-one dummy if Carnegie classification of school employed at is anything besides Ru1, Ru2, Doc1, Doc2, Medic dummies
Articlfld92 Ratio of the total number of program publications to the number of program faculty between 1988-92
×
Giniarticl92 Gini coefficient of program faculty publications between 1988-1992
×
* Indicates the benchmark or control group. For some regressions by field, dummy variable categories with insufficient observations have been combined. Thus, slightly different dummy variable groups, particularly dummy variables with various Carnegie classifications, have been used in some regressions. × Means the variable is an explanatory variable included in the equation a) We use the Carnegie classification as coded in the Survey of Earned Doctorates.

31
Table 4 Means and (Standard Deviations) of Variables by Field
Variable Academe
Total Life
SciencesComputer Sciences
Physical Sciences
Engineering
Big Data: Uspapp95 0.196
(0.96) 0.167 (0.80)
0.033 (0.25)
0.218 (1.09)
0.376 (1.45)
Patent 0.091 (0.29)
0.084 (0.28)
0.022 (0.15)
0.093 (0.29)
0.165 (0.37)
Article95 8.090 (10.43)
8.358 (10.36)
4.969 (7.44)
9.093 (11.91)
8.013 (10.06)
Yrsofphd 13.898 (10.13)
13.946 (9.98)
14.890 (9.98)
15.422 (10.83)
11.136 (9.20)
Femdum 0.242 (0.43)
0.324 (0.47)
0.201 (0.40)
0.151 (0.36)
0.099 (0.30)
Ctzusdum 0.896 (0.31)
0.933 (0.25)
0.852 (0.35)
0.891 (0.31)
0.802 (0.40)
Fedsupdum 0.524 (0.50)
0.541 (0.50)
0.279 (0.45)
0.575 (0.49)
0.565 (0.50)
Lifefield 0.542 (0.50)
1.000 (0.00)
0.000 (0.00)
0.000 (0.00)
0.000 (0.00)
Compfield 0.106 (0.31)
0.000 (0.00)
1.000 (0.00)
0.000 (0.00)
0.000 (0.00)
Phyfield 0.197 (0.40)
0.000 (0.00)
0.000 (0.00)
1.000 (0.00)
0.000 (0.00)
Engfield 0.156 (0.36)
0.000 (0.00)
0.000 (0.00)
0.000 (0.00)
1.000 (0.00)
Univemp 0.628 (0.48)
0.499 (0.50)
0.895 (0.31)
0.728 (0.44)
0.767 (0.42)
Reseremp 0.121 (0.33)
0.077 (0.27)
0.081 (0.27)
0.215 (0.41)
0.178 (0.38)
Medicemp 0.252 (0.43)
0.423 (0.49)
0.024 (0.15)
0.057 (0.23)
0.055 (0.23)
Tenure 0.467 (0.50)
0.434 (0.50)
0.646 (0.48)
0.467 (0.50)
0.458 (0.50)
Tentrack 0.192 (0.39)
0.191 (0.39)
0.217 (0.41)
0.130 (0.34)
0.255 (0.44)
Nonfaculty 0.341 (0.47)
0.375 (0.48)
0.136 (0.34)
0.403 (0.49)
0.287 (0.45)
Instpat 56.142 (109.16)
59.717 (111.00)
39.006 (94.45)
56.923 (116.42)
54.365 (101.23)
Rddum 0.769 (0.42)
0.767 (0.42)
0.686 (0.46)
0.779 (0.42)
0.819 (0.38)
Ru1dege 0.790 0.777 0.747 0.810 0.838

32
(0.41) (0.42) (0.43) (0.39) (0.37) Ru2dege 0.101
(0.30) 0.095 (0.29)
0.126 (0.33)
0.110 (0.31)
0.091 (0.29)
Doc1dege 0.044 (0.20)
0.037 (0.19)
0.091 (0.29)
0.040 (0.20)
0.040 (0.20)
Doc2dege 0.028 (0.16)
0.026 (0.16)
***
0.032 (0.18)
0.026 (0.16)
Medicodege 0.038 (0.19)
0.065 (0.25)
***
0.008 (0.09)
0.005 (0.07)
Partphys 0.011 (0.11)
0.00 (0.00)
0.00 (0.00)
0.058 (0.23)
0.00 (0.00)
Ru1empc 0.454 (0.50)
0.488 (0.50)
0.325 (0.47)
0.415 (0.49)
0.475 (0.50)
Ru2empc 0.080 (0.27)
0.077 (0.27)
0.084 (0.28)
0.070 (0.25)
0.098 (0.30)
Doc1empc 0.042 (0.20)
0.033 (0.18)
0.070 (0.26)
0.045 (0.21)
0.052 (0.22)
Doc2empc 0.057 (0.23)
0.043 (0.20)
0.063 (0.24)
0.059 (0.24)
0.098 (0.30)
Medicempc 0.081 (0.27)
0.137 (0.34)
0.008 (0.09)
0.017 (0.13)
0.016 (0.12)
Otherempc 0.286 (0.45)
0.222 (0.42)
0.450 (0.50)
0.394 (0.49)
0.261 (0.44)
Sample Size 10962 5936 1159 2156 1711 Selected Variables for Small Dataa: Uspapp95 0.234
(1.07) 0.214 (0.88)
0.051 (0.34)
0.211 (1.05)
0.401 (1.65)
Patent 0.110 (0.31)
0.109 (0.31)
0.030 (0.17)
0.089 (0.29)
0.169 (0.37)
Article95 9.966 (11.42)
9.748 (11.24)
7.105 (7.91)
12.358 (13.20)
9.569 (10.86)
Articlfld92 8.226 (4.41)
9.273 (4.00)
3.873 (1.60)
9.376 (4.61)
5.847 (4.10)
Giniarticl92 101.762 (83.09)
92.245 (80.56)
102.921(85.56)
91.116 (56.94)
141.043 (99.48)
Sample Size 5976 3258 493 1141 1084
*** Cells with 6 or fewer people have been suppressed at the request of Science Resources Statistics, National Science Foundation. a) Observations on two instrumental variables - Articlfld92 and Giniarticl92 - are available only
for 5976 scientists. Consequently, we will call this sample with 5976 observations ‘small data’. Summary statistics for the other variables in the small data are given in an appendix available upon request. Summary statistics for key variables from the small data set are largely consistent with those from the large data with 10962 individuals.

33
Table 5 The Impact of Publishing (Article95) on Patenting (Uspapp95)
Estimates from ZINB and GMM Models – Academe Totala
Model Coefficient (t-ratio)
Marginal Effectc
Elasticityc
Big Data with Set B Instrumentsb, N = 10962 ZINB 0.0421** (2.15) 0.0066 0.3411 GMM 0.2680** (1.96) 0.0512 2.1685
Small Data with Set A Instrumentsb, N = 5976
ZINB 0.1073*** (4.44) 0.0248 1.0700 GMM 0.1383* (1.65) 0.0258 1.3823
* (**) [***] Statistically significantly different from zero at the 10% (5%) [1%] level of significance. a) See Table 3 for a complete list of other explanatory variables included in each model. b) Set A instruments include Articlfld92, Giniarticl92, Ru1empc,Ru2empc, Doc1empc, Doc2empc and exogenous variables in the model; set B instruments are Ru1empc,Ru2empc, Doc1empc, Doc2empc and exogenous variables in the model. Observations on two instrumental variables - Articlfld92 and Giniarticl92 - are available only for 5976 scientists. c) The reported marginal effects and elasticities are evaluated at the sample mean values of the explanatory variables. We have also computed elasticities at various values of the explanatory variables and predicted number of articles. For the small data, where we have reasonably strong instruments, these elasticities vary from as low as 0.1% to over 5%, and results are consistent across estimation methods.
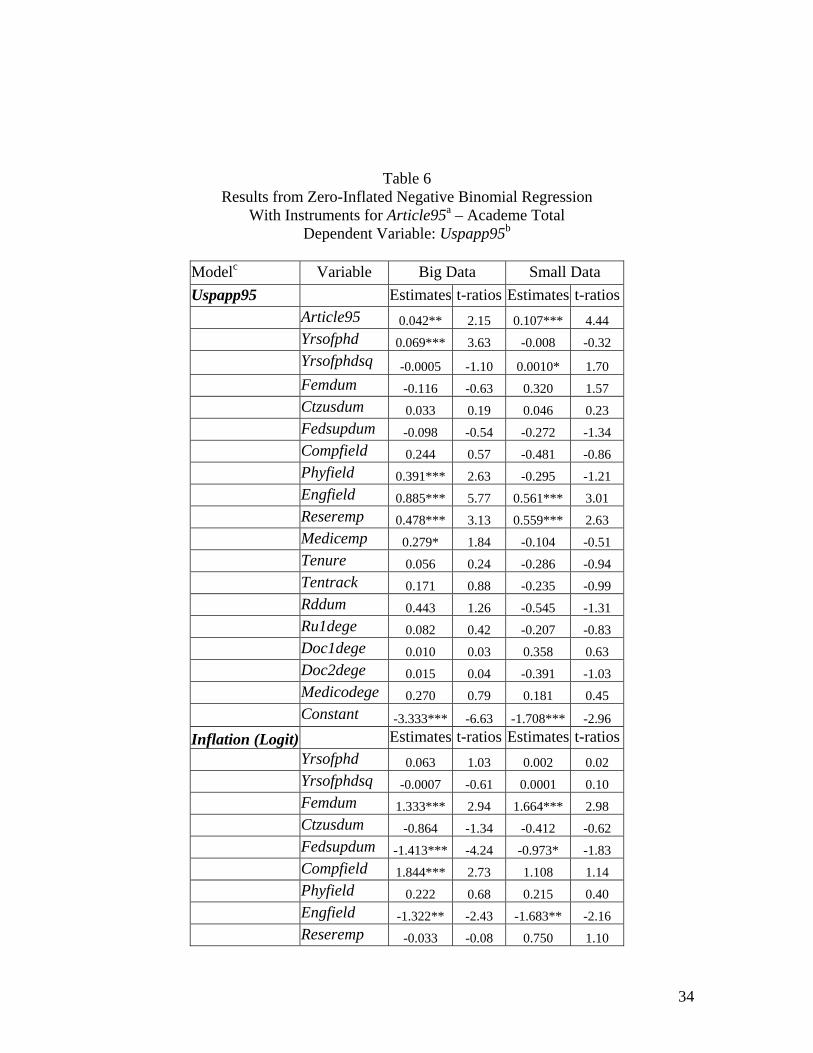
34
Table 6 Results from Zero-Inflated Negative Binomial Regression
With Instruments for Article95a – Academe Total Dependent Variable: Uspapp95b
Modelc Variable Big Data Small Data Uspapp95 Estimates t-ratios Estimates t-ratios
Article95 0.042** 2.15 0.107*** 4.44
Yrsofphd 0.069*** 3.63 -0.008 -0.32
Yrsofphdsq -0.0005 -1.10 0.0010* 1.70
Femdum -0.116 -0.63 0.320 1.57
Ctzusdum 0.033 0.19 0.046 0.23
Fedsupdum -0.098 -0.54 -0.272 -1.34
Compfield 0.244 0.57 -0.481 -0.86
Phyfield 0.391*** 2.63 -0.295 -1.21
Engfield 0.885*** 5.77 0.561*** 3.01
Reseremp 0.478*** 3.13 0.559*** 2.63
Medicemp 0.279* 1.84 -0.104 -0.51
Tenure 0.056 0.24 -0.286 -0.94
Tentrack 0.171 0.88 -0.235 -0.99
Rddum 0.443 1.26 -0.545 -1.31
Ru1dege 0.082 0.42 -0.207 -0.83
Doc1dege 0.010 0.03 0.358 0.63
Doc2dege 0.015 0.04 -0.391 -1.03
Medicodege 0.270 0.79 0.181 0.45
Constant -3.333*** -6.63 -1.708*** -2.96 Inflation (Logit) Estimates t-ratios Estimates t-ratios
Yrsofphd 0.063 1.03 0.002 0.02
Yrsofphdsq -0.0007 -0.61 0.0001 0.10
Femdum 1.333*** 2.94 1.664*** 2.98
Ctzusdum -0.864 -1.34 -0.412 -0.62
Fedsupdum -1.413*** -4.24 -0.973* -1.83
Compfield 1.844*** 2.73 1.108 1.14
Phyfield 0.222 0.68 0.215 0.40
Engfield -1.322** -2.43 -1.683** -2.16
Reseremp -0.033 -0.08 0.750 1.10

35
Medicemp -1.153*** -3.08 -1.403** -2.48
Tenure 1.100* 1.83 0.415 0.77
Tentrack -0.155 -0.22 -4.453 -1.21
Instpat -0.004** -1.98 -0.003** -1.84
Rddum -1.331*** -3.07 -2.389*** -2.92
Ru1dege -0.223 -0.57 -0.472 -0.73
Doc1dege -0.768 -0.54 0.989 0.68
Doc2dege 0.232 0.28 -0.934 -0.80
Medicodege 0.500 0.71 1.428 1.42
Constant 1.261 1.21 2.641** 2.12
Ln-alpha 1.693*** 10.22 1.708*** 11.55
Log-likelihood -4424.20
-2834.20
N 10962 5976 * (**) [***] Statistically significantly different from zero at the 10% (5%) [1%] level of significance. (a) t-ratios are based on robust standard errors. (b) For the small data, the instruments used for article include Articlfld92, Giniarticl92, Ru1empc,
Ru2empc, Doc1empc, Doc2cempc and exogenous variables in the model. For the big data, the instruments used are Ru1empc, Ru2empc, Doc1empc, Doc2empc and exogenous variables in the model. Except for using robust t-ratios, all regression results from the ZINB model are not corrected for the inclusion of a predicted explanatory variable.
(c) The Uspapp95 part of the ZINB model gives estimates of the parameters in β; the inflation part provides estimates of the γ‘s.

36
Table 7 Optimal GMM Results from Exponential Mean Regression– Academe Total
Dependent Variable: Uspapp95
Variable Big Data with Set B Instrumentsb
Small Data with Set A Instrumentsa
Estimates t-ratios Estimates t-ratios Article95 0.268** 1.96 0.138* 1.65 Yrsofphd 0.046* 1.81 0.018 0.89 Yrsofphdsq -0.0008 -1.19 0.0002 -0.39 Femdum -0.340 -1.60 -0.178 -0.88 Ctzusdum 0.128 0.44 -0.069 -0.31 Fedsupdum 0.122 0.65 0.165 0.75 Compfield -0.294 -0.84 -0.759* -1.88 Phyfield 0.541** 2.06 0.032 0.13 Engfield 1.522*** 7.15 0.936*** 5.17 Reseremp 0.474** 2.15 0.197 1.02 Medicemp 0.601*** 3.04 0.315* 1.82 Tenure -0.737*** -3.44 -0.194 -0.70 Tentrack 0.086 0.42 0.390** 2.09 Instpat 0.001** 1.90 0.001*** 2.79 Rddum 0.358 1.07 0.483 1.64 Ru1dege 0.221 0.95 -0.115 -0.47 Doc1dege 0.722 1.34 0.207 0.46 Doc2dege -0.587 -1.01 -0.990* -1.83 Medicodege -0.013 -0.03 -0.539 -1.26 Constant -5.052*** -10.53 -4.560*** -8.33 GMM J-test statistic
2.98 (d.f. = 3, p-value=0.395)
6.87 (d.f.=5, p-value = 0.231)
N 10962 5976
* (**) [***] Statistically significantly different from zero at the 10% (5%) [1%] level of significance. a) Set A instruments include Articlfld92, Giniarticl92, Ru1empc, Ru2empc, Doc1empc, Doc2empc and exogenous variables in the model. b) Set B instruments are Ru1empc, Ru2empc, Doc1empc, Doc2empc and exogenous variables in the model.

37
Table 8 Marginal Effects and Elasticities:
Estimates from ZINB and Optimal GMM Dependent Variable: Uspapp95a,b,c
Variable Big Data Small Data
ZINB GMM ZINB GMM
Article95 0.007 (0.341)
0.051 (2.169)
0.025 (1.070)
0.026 (1.382)
Yrsofphd 0.006 (0.545)
0.005 (0.336)
0.004 (0.253)
0.003 (0.181)
Femdum -0.093 -0.065 -0.024 -0.033 Ctzusdum 0.057 0.025 0.028 -0.013 Fedsupdum 0.067 0.023 -0.019 0.031 Compfield -0.088 -0.056 -0.129 -0.141 Phyfield 0.052 0.103 -0.070 0.006 Engfield 0.317 0.291 0.222 0.174 Reseremp 0.093 0.091 0.107 0.037 Medicemp 0.117 0.115 0.020 0.059 Tenure -0.056 -0.141 -0.081 -0.036 Tentrack 0.038 0.016 0.027 0.073 Instpat 0.0003
(0.092) 0.0002 (0.068)
0.0001 (0.038)
0.0003 (0.123)
Rddum 0.126 0.068 0.051 0.090 Ru1dege 0.025 0.042 -0.028 -0.021 Doc1dege 0.042 0.138 0.027 0.039 Doc2dege -0.012 -0.112 -0.057 -0.185 Medicodege 0.008 -0.003 -0.048 -0.100 Sample Size
10962 10962 5976 5976
a) The underlying coefficient estimates and t-ratios are shown in tables 6 and 7. b) Figures within parentheses indicate elasticities of the number of patent applications with respect to
the variable. c) For a dummy variable, the marginal effect is for discrete change from 0 to 1.

38
Appendix A
Table A1 The Impact of Publishing (Article95) on Patenting (Uspapp95)
Estimates from ZINB and GMM Models – By Field of Traininga
Model Field (Sample Size)
Coefficient (t-ratio)
Marginal Effectc
Elasticityc
Big Data with Set B Instrumentsb Life Science (5936) ZINB 0.1020***(3.24) 0.0141 0.8516 GMM 0.3924** (2.29) 0.1125 3.2794
Physical Science (2156)
ZINB 0.0131 (0.29) 0.0035 0.1188 GMM 0.0260 (1.36) 0.0031 0.2364
Engineering (1711) ZINB 0.0650 (1.60) 0.0290 0.5232 GMM 0.0735 (0.98) 0.0209 0.5891
Small Data with Set A Instrumentsb Life Science (3258) ZINB 0.1693*** (4.50) 0.0356 1.6415 GMM 0.1465 (1.06) 0.0243 1.4284 Physical & Engineering
Sciences (2225)
ZINB 0.0712*** (3.14) 0.0195 0.7830
* (**) [***] Statistically significantly different from zero at the 10% (5%) [1%] level of significance. a) See Table 3 for a complete list of other explanatory variables included in each model. b) Set A instruments include Articlfld92, Giniarticl92, Ru1empc,Ru2empc, Doc1empc, Doc2empc and exogenous variables in the model; set B instruments are Ru1empc,Ru2empc, Doc1empc, Doc2empc and exogenous variables in the model. Observations on two instrumental variables - Articlfld92 and Giniarticl92 - are available only for 5976 scientists. c) The reported marginal effects and elasticities are evaluated at the sample mean values of the explanatory variables.

39
Table A2 Results from Zero-Inflated Negative Binomial Regression With Instruments for Article95a – By Fields of Training
Dependent Variable: Uspapp95b
Big Data
Small Data
Modelc Variables Life
SciencesPhysical Science Engineer
Life Sciences
Engineer & Physics
Uspapp95 Coeff
(t-ratio)Coeff
(t-ratio)Coeff
(t-ratio) Coeff
(t-ratio) Coeff
(t-ratio)
Article95 0.102***
(3.24) 0.013 (0.29)
0.065 (1.60)
0.169*** (4.50)
0.071*** (3.14)
Yrsofphd 0.089***
(3.46) 0.093 (1.47)
0.007 (0.22)
-0.005 (-0.16)
0.023 (0.62)
Yrsofphdsq -0.001*
(-1.88) -0.001 (-0.77)
0.001 (0.98)
0.001 (0.83)
0.001 (0.85)
Femdum -0.035
(-0.18) -0.529 (-0.56)
-0.209 (-0.54)
0.525** (2.21)
-0.131 (-0.23)
Ctzusdum 0.080
(0.39) 0.408 (0.46)
-0.214 (-0.75)
0.029 (0.13)
-0.682* (-1.93)
Fedsupdum -0.070
(-0.38) -0.409 (-0.46)
-0.010 (-0.03)
-0.427 (-1.60)
-0.131 (-0.35)
Phyfield
-0.513 (-1.50)
Reseremp 0.190
(0.81) 0.729***
(2.62) -0.048 (-0.17)
0.751* (1.68)
0.101 (0.31)
Medicemp 0.056
(0.34) 1.262***
(3.11) 1.055***
(2.85) -0.108 (-0.45)
Tenure -0.574**
(-2.13) -0.207 (-0.54)
-0.151 (-0.39)
-0.865** (-2.37)
0.334 (0.82)
Tentrack -0.061
(-0.33) -0.011 (-0.01)
-0.305 (-0.91)
-0.313 (-1.03)
-0.013 (-0.02)
Rddum 0.652*
(1.89) -0.876 (-1.17)
0.032 (0.09)
-0.235 (-0.49)
-0.139 (-0.23)
Ru1dege -0.179
(-0.72) 0.019 (0.02)
0.624 (1.56)
-0.415 (-0.82)
0.475 (1.25)
Allodege -0.014
(-0.04) 0.184 (0.25)
-0.072 (-0.13)
Doc1dege 1.027
(1.54) 1.253*
(1.86)
Doc2dege -0.346
(-0.49) -0.062
(-0.10)
Partphys
-1.188***
(-2.61) -0.270
(-0.25)
Constant -3.906*
(-8.30) -1.861 (-0.88)
-1.742*** (-3.20)
-2.178** (-2.55)
-1.632 (-1.03)
Inflation Logit
Yrsofphd 0.506 0.118 0.037 0.056 0.087

40
(1.46) (0.14) (0.40) (0.62) (0.72)
Yrsofphdsq -0.008
(-1.40) -0.002 (-0.13)
0.0002 (0.13)
-0.001 (-0.42)
-0.001 (-0.68)
Femdum 3.856**
(2.11) 1.476 (0.57)
0.727 (0.70)
1.878** (2.18)
0.959 (0.97)
Ctzusdum -4.322
(-1.37) 4.780 (0.77)
-1.362** (-2.42)
-0.781 (-0.80)
-1.637 (-1.34)
Fedsupdum -2.458*
(-1.66) -3.308 (-0.95)
-0.368 (-0.59)
-0.722 (-0.69)
-0.473 (-0.75)
Phyfield
1.059** (2.37)
Reseremp -0.703
(-0.65) 0.622 (0.46)
-1.796 (-1.48)
1.084 (0.78)
-0.373 (-0.66)
Medicemp -3.961**
(-2.21) -0.471 (-0.20)
0.425 (0.48)
-2.024** (-2.40)
Tenure 0.580
(0.67) 1.227 (1.42)
-0.128 (-0.17)
-0.756 (-0.76)
0.964 (0.55)
Tentrack -2.478
(-1.46) -0.868 (-0.12)
-0.737 (-0.86)
-5.685*** (-4.00)
-0.524 (-0.31)
Instpat -0.012***
(-2.62) 0.001
(-0.10) -0.004 (-1.11)
-0.001 (-0.65)
-0.002 (-0.99)
Rddum -3.405*
(-1.95) -4.015 (-1.05)
-1.176* (-1.76)
-3.165** (-2.35)
-0.709 (-0.99)
Ru1dege -2.485*
(-1.70) -2.165 (-1.64)
14.526*** (5.99)
-1.233 (-0.69)
0.526 (0.60)
Allodege 0.901
(0.66) -1.448 (-0.78)
1.839 (0.80)
Doc1dege
15.267***
(5.76) 1.216
(0.86)
Doc2dege
12.250**
(2.11) -1.755
(-0.16)
Partphys
-1.283 (-0.51)
1.199 (0.92)
Constant 1.793
(0.50) -0.896 (-0.06)
-12.735***(-5.30)
3.549* (1.65)
-0.290 (-0.08)
Ln-alpha 2.017***
(36.18) 1.828***
(4.42) 1.220***
(4.60) 1.701*** (10.62)
1.271** (2.06)
Log-likelihood -2198.71 -892.18 -1151.01 -1502.59 -1229.68
N 5936 2156 1711 3258 2225 * (**) [***] Statistically significantly different from zero at the 10% (5%) [1%] level of significance. (a) t-ratios are based on robust standard errors. (b) For the small data, the instruments used for article include Articlfld92, Giniarticl92, Ru1empc,
Ru2empc, Doc1empc, Doc2empc and exogenous variables in the model. For the big data, the instruments used are Ru1empc, Ru2empc, Doc1empc,Doc2empc and exogenous variables in the model. Except for using robust t-ratios, all regression results from the ZINB model are not corrected for the inclusion of a predicted explanatory variable.
(c) The Uspapp95 part of the ZINB model gives estimates of the parameters in β; the inflation part provides estimates of the γ‘s.

41
Table A3
Optimal GMM from the Exponential Mean Regression – By Field of Training Dependent Variable: Uspapp95
Big Data with Set B I nstrumentsb
Small Data with Set A
Instrumentsa
Life
Sciences Physical Science Engineer
Life Sciences
Variable Coeff (t-ratio)
Coeff (t-ratio)
Coeff (t-ratio)
Coeff (t-ratio)
Article95 0.392** (2.29)
0.026 (1.36)
0.074 (0.97)
0.147 (1.06)
Yrsofphd -0.015 (-0.41)
0.058 (1.43)
0.040 (1.18)
-0.0005 (-0.01)
Yrsofphdsq 0.001 (0.65)
-0.0002 (-0.22)
-0.0003 (-0.42)
0.0003 (0.34)
Femdum 0.021 (0.07)
-1.249*** (-3.56)
-0.269 (-0.89)
0.037 (0.12)
Ctzusdum 0.109 (0.26)
-0.630 (-1.22)
0.112 (0.50)
0.168 (0.57)
Fedsupdum -0.038 (-0.18)
0.947*** (4.02)
0.112 (0.38)
-0.061 (-0.20)
Reseremp -0.087 (-0.22)
0.920*** (3.34)
0.619** (2.46)
-0.147 (-0.38)
Medicemp 0.485** (2.15)
1.507*** (3.90)
0.594* (1.83)
0.343** (1.85)
Tenure -0.484* (-1.71)
-0.005 (-0.01)
-0.195 (-0.53)
-0.208 (-0.49)
Tentrack 0.451 (1.36)
1.699*** (3.97)
0.031 (0.10)
0.797*** (2.84)
Instpat 0.001 (0.84)
0.003* (1.86)
0.002 (1.43)
0.0004 (0.57)
Rddum 0.702** (2.21)
1.399*** (3.37)
0.491 (1.48)
1.007** (2.42)
Ru1dege 0.500 (1.45)
1.345*** (2.65)
-0.074 (-0.25)
0.126 (0.43)
Allodege 0.674 (1.08)
1.198 (1.41)
-0.290 (-0.62)
-0.615 (-1.55)
Constant -5.714*** (-7.65)
-5.886*** (-7.65)
-2.811*** (-6.10)
-4.560*** (-8.33)
GMM J-test Statistic
3.91 (d.f. = 3,
p-value = 0.271)
10.15 (d.f. = 3,
p-value = 0.017)
1.86 (d.f. = 3,
p-value =0.602)
6.89 (d.f. = 5,
p-value = 0.229) N 5936 2156 1711 3258
* (**) [***] Statistically significantly different from zero at the 10% (5%) [1%] level of significance. a) Set A instruments include Articlfld92, Giniarticl92, Ru1empc, Ru2empc, Doc1empc, Doc2empc and exogenous variables in the model.
b) Set B instruments are Ru1empc, Ru2empc, Doc1empc, Doc2empc and exogenous variables in the model.

42
Table A4. Marginal Effects and Elasticities by Field of Training
Estimates from ZINB and GMM Dependent Variable: Uspapp95a,b,c
Big Data
Small Data
ZINB
GMM
ZINB
GMM
Life
Sciences Physical Science Engineer
Life Sciences
Physical Science Engineer
Life Sciences
Engineer &
Physics Life
Sciences Article95 0.014
(0.852) 0.004
(0.119) 0.029
(0.523) 0.112
(3.279) 0.003
(0.236) 0.021
(0.589) 0.036
(1.641) 0.020
(0.783) 0.024
(1.428) Yrsofphd 0.008
(0.781) 0.016
(0.901) 0.009
(0.228) 0.001
(0.023) 0.006
(0.780) 0.009
(0.354) 0.002
(0.137) 0.005
(0.246) 0.001
(0.118) Femdum -0.020 -0.179 -0.125 0.006 -0.150 -0.076 0.055 -0.129** 0.006 Ctzusdum 0.055 0.033 0.008 0.031 -0.076 0.032 0.025 0.040 0.028 Fedsupdum -0.005 0.078 0.015 -0.011 0.114 0.032 -0.078 0.016 -0.010 Phyfield -0.255 Reseremp 0.029 0.200 0.039 -0.025 0.111 0.176 0.164 0.069 -0.024 Medicemp 0.014 0.691 0.723 0.139 0.182 0.169 0.020 0.057 Tenure -0.078 -0.108 -0.061 -0.139 0.001 -0.056 -0.159 -0.011 -0.034 Tentrack -0.006 0.026 -0.098 0.129 0.205 0.009 -0.018 0.048 0.132 Instpat 0.00002
(0.007) 0.00002 (0.004)
0.0002 (0.023)
0.0002 (0.041)
0.0003 (0.151)
0.0005 (0.088)
0.00002 (0.009)
0.0002 (0.049)
0.0001 (0.037)
Rddum 0.087 0.125 0.093 0.201 0.169 0.139 0.093 0.045 0.167 Ru1dege -0.017 0.135 -0.064 0.143 0.162 -0.021 -0.057 0.069 0.021 Allodege -0.004 0.101 0.193 0.144 -0.082 -0.072 0.073 -0.102 Doc1deg -0.453 0.228 Doc2deg -0.469 0.107 Partphys -0.187 -0.166 N 5936 2156 1711 5936 2156 1711 3258 2225 3258
a) The underlying coefficient estimates and t-ratios are shown in tables A2 and A3. b) Figures within brackets indicate elasticities of the number of patent applications with respect to the
variable. c) For a dummy variable, the marginal effect is for discrete change from 0 to 1.