who’s afraid of the big, bad coyote? a survey of messaging
TRANSCRIPT

Who’s Afraid of the Big, Bad Coyote? A Survey of Messaging and Existing Attitudes in
the National Capital Region
A thesis submitted in partial fulfillment of the requirements for the degree of Master of Science at George Mason University
By
Megan Draheim Bachelor of Arts
George Washington University, 1999
Director: Larry L. Rockwood, Professor Department of Environmental Science and Policy
Fall Semester 2007 George Mason University

ii
Copyright 2007 Megan M. Draheim All Rights Reserved

iii
DEDICATION
This thesis is dedicated to my husband, David, and to my parents. Thanks for all of your support.

iv
ACKNOWLEDGEMENTS
I would like to thank the many friends, relatives, and supporters who have made this thesis happen. Drs. Rockwood, Parsons, and Guagnano were always willing to provide help and support throughout the process. Dr. John Hadidian of The Humane Society of the United States provided the funding that made the project possible. Jennifer Jackman provided the original inspiration for the project as well as valuable advice. Thanks also to Drs. Hillary Cressey and Kim Largen who allowed me into their classes to administer the surveys. Special thanks go to all of the teaching assistants who taught these classes and gave me the time to administer the surveys. Annaliesa Lundblad made the thesis and defense process much easier. And, of course, I owe a huge debt to my husband, David Harris, my parents, Jim Draheim, Linda Jo Clough, and Rodney Clough, and my friends for their support and humor throughout this process. Finally, my dogs and rabbits deserve mention for helping me relax by insisting I play with them.

v
TABLE OF CONTENTS
Page List of Tables…………………………………………………………………………….vii List of Figures…………………………………………………………………………….ix Abstract…………………………………………………………………………..…….….x 1. Introduction……………………………………………………………………..……..1 Human Culture and Coyotes…………………………….…………………………….2 Coyote Control Methods………………………………………………………………6 Coyote Ecology………………………………………………………………………10 General Attitudes Towards Animals…………………………………………………13 Attitudes Towards Predators…………………………………………………………14 Attitudes Towards Wildlife in Urban Areas…………………………………….…...17 Pet Ownership…………………………………………………………………...…...19 Environmental Education………………………………………………………….....20 Conclusion…………………………………………………………………………...22 2. Methodology…………………………………………………………………………23 Attitudes Towards Wildlife Management Policies…………………………………..25 Activities……………………………………………………………………………..25 Belief in Animal Mind………………………………………………………...……..26 Knowledge……………………………………………………………………….…..27 Fear…………………………………………………………………………………..28 Support…………………………………………………………………………….....29 Correlations………………………………………………………………………......29 Pets……………………………………………………………………………….......29 Media…………………………………………………………………………….…..31 Experiences with Coyotes……………………………………………………………32 Gender………………………………………………………………………………..33 Messaging……………………………………………………………………….…...34 3. Results of Attitudinal Section……………………………………………………......36 Awareness and General Attitudes……………………………………………….…...36 Attitudes Towards Coyote Management……………………………………...……..37 ACTIVITIES Index…………………………………………………………...……..38 BAM Index…………………………………………………………………………..40 Knowledge…………………………………………………………………...………41 FEAR Index……………………………………………………………………..…...42 SUPPORT Index……………………………………………………………..............45 Correlations…………………………………………………………………...….......46 Pets…………………………………………………………………………….……..47
vi
Media…………………………………………………………………………….......53 Experiences with Coyotes……………………………………………………...…….54 Gender……………………………………………..…………………………………58 4. Results of Messaging Section……………………………………………….….……60 Overall Results of Messaging………………………………….……………….……60 Human-Coyote Interaction Statements………………………………………………61 Behavior Statements………………………………………………………….....…...64 Images………………………………………………………………………………..66 Ecology Statements…………………………….…………………………………….69 5. Discussion………………………………………………………...………………….72 Attitudes………………………………………………………………………….......72 Messaging………………………………………………………………………........78 6. Conclusion………………………………………………………...…………………82 7. Appendix: Survey Instrument………………………………………………………..84 8. Works Cited………………………………………………………………………...104 9. Curriculum Vitae………………………………………………………………...…111

vii
LIST OF TABLES
Table Page 1. Responses to the question: “How much do you or don’t you support the coyote’s existence in the D.C. metro area?.......................................................... ……37 2. Responses to the question: “How much do you like or dislike coyotes?” ............... .37 3. Attitudes towards wildlife management ................................................................. .38 4. Summary of results of independent-samples t-tests ................................................. 40 5. Responses to knowledge about coyotes questions ................................................... 42 6. How concerned respondents are about specific fears related to coyotes................... 44 7. Results of correlation analysis of the four indices ................................................... 46 8. Pet owners’ responses to: “Please indicate how concerned you are that the following could happen to dogs that are outside unsupervised or are off-leash in the D.C. metro area.................................................................................. 47 9. Non-pet owners’ responses to: “Please indicate how concerned you are that the following could happen to dogs that are outside unsupervised or are off-leash in the D.C metro area.” ...................................................................... 48 10. Pet owners’ responses to: “Please indicate how concerned you are that the following could happen to cats that are unsupervised and off-leash in the D.C. metro area .......................................................................................................... 48 11. Non-pet owners’ responses to: “Please indicate how concerned you are that the following could happen to cats that are unsupervised and off-leash in the D.C. metro area................................................................................................. 49 12. Results of independent-samples t-tests comparing pet ownership with BAM, FEAR, and SUPPORT indices ......................................................................... 49 13. “How much do you or don’t you support the coyote’s existence in the D.C. metro area?” Results of a Chi-square test for independence ................................ 50 14. “How much do you like or dislike coyotes?” Results of a Chi-square test for independence.................................................................................................. 51 15. Level of agreement with whether coyotes should be blamed for predations of unsupervised pets .................................................................................. 51 16. Correlations between the BAM, SUPPORT, and FEAR indices and Q26.............. 52 17. With what types of media respondents saw or heard stories about coyotes ............ 53 18. Summary of independent-samples t-tests for whether or not respondents have had an experience with coyotes and the FEAR and SUPPORT indices ............... 54

viii
19. How respondents who have seen or heard a coyote rate their experience............... 55 20. Pearson product-moment correlations between ratings of experiences with coyotes and the BAM, FEAR, and SUPPORT indices ........................................ 55 21. Independent-samples t-tests comparing whether or not participants had changed their behavior due to the presence of coyotes and the FEAR and SUPPORT indices ............................................................................................... 56 22. How much those who did or did not change their behavior due to the presence of coyotes liked or disliked coyotes .................................................... 56 23. Results of independent-samples t-tests comparing knowledge of coyote attacks on pets and the SUPPORT and FEAR indices...................................... 57 24. The relationship between knowledge of a pet attack by a coyote and how much the respondents liked or disliked coyotes ............................................ 58 25. The relationship between gender and how much the respondents liked or disliked coyotes ............................................................................................. 58 26. The relationship between gender and how much the respondents supported the presence of coyotes in the D.C. metro area ........................................... 59 27. Summary of paired-samples t-tests for the overall effect of providing additional information to respondents ......................................................... 61 28. Summary of paired-samples t-tests for the human-culture form............................. 62 29. Participants’ responses to cultural statements........................................................ 63 30. Summary of paired-samples t-tests for the Behavior form..................................... 64 31. Participants’ responses to behavioral statements ................................................... 65 32. Paired-samples t-tests for the images form............................................................ 67 33. Participants’ responses to images.......................................................................... 68 34. Summary of paired-samples t-tests for the ecology form....................................... 70 35. Participants’ responses to ecological statements.................................................... 71

ix
LIST OF FIGURES
Figure Page 1. Range of respondents’ ACTIVITIES scores.................................................... ……39 2. Range of respondents’ BAM scores ....................................................................... .41 3. Range of respondents’ FEAR scores...................................................................... .43 4. Range of respondents’ SUPPORT scores …………………………………………...45

ABSTRACT
ATTITUDES TOWARDS COYOTES IN THE WASHINGTON, D.C. METROPOLITAN AREA AND THE EFFECTS OF MESSAGING ON ATTITUDES Megan M. Draheim George Mason University, 2007 Thesis Director: Dr. Larry L. Rockwood
Coyotes are relatively recent arrivals to the Washington, D.C. metropolitan area. In an
effort to understand and obtain baseline data about existing attitudes, a survey was
conducted in 2006. Most respondents had neutral attitudes towards coyotes, which might
be in part due to low levels of awareness about their presence in the area. Of particular
interest, pet owners seemed to have more extreme attitudes, either positively or
negatively, towards coyotes, and women tended to have more negative attitudes towards
coyotes. Wildlife managers and others interested in preventing and reducing human-
coyote conflict should capitalize on the current situation and develop outreach programs
that will teach people how to live near coyotes as well as engender positive attitudes
towards them. The survey also looked at the effect that small pieces of information in
various categories (coyote behavior and ecology, human-coyote interactions, and images
of coyotes) had on attitudes. Statements about coyote behavior, especially those that

emphasized the social aspects of their lives, proved to be the most effective in increasing
positive attitudes. Amongst other findings, statements about attempts to eradicate coyotes
were viewed negatively and some traditional images associated with coyotes (especially a
coyote howling) were also viewed negatively. This information will be useful to wildlife
managers and others interested in designing outreach materials.

1
Introduction
The purpose of this research project is twofold. First, as coyotes are relatively
recent additions to the fauna of the D.C. metropolitan area, understanding attitudes and
beliefs of local residents towards coyotes and wildlife management techniques is
important in order to plan for, reduce, and prevent coyote-human conflict. This project
attempts to measure these attitudes and beliefs. Second, although in-depth programs have
proven the most effective in changing attitudes towards wildlife species, many non-profit
organizations and wildlife managers have only a short period of time in which to get their
message across to large numbers of people, often in the form of a poster, flyer, brochure,
or other outreach materials. Therefore understanding what sorts of messages best
influences the public’s attitudes towards and capacity for tolerance of coyotes is
important. This project measures the impact that various types of information and
specific statements have on respondents’ attitudes towards coyotes. As many carnivore
conservation programs lack stringent program evaluations that provide guidance as to
what works and what does not (Draheim et al. 2006), this project attempts to provide
some basic guidelines as to the effectiveness of outreach materials.
Since the establishment of conservation biology as a discipline in the 1980s, there
has been a call to increase the human dimensions aspects of a field that many agree has
2
been dominated by natural scientists (Fox et al. 2006; Jacobson & McDuff 1998; Mascia
et al. 2003). Some have argued that human interaction skills are as important as
knowledge of the natural sciences in dealing with complex wildlife questions (Cannon et
al. 1996; Madden 2004). After all, a large part of conservation work is changing human
behavior (Mascia et al. 2003).
For carnivore conservation to be successful, the human dimensions of
conservation must be thoroughly understood and utilized, including policy and social
science issues (Primm & Clark 1996; Weber & Rabinowitz 1996). Referring to growing
populations of predators in parts of Europe that have not seen large carnivores for
centuries, John Linnell of the Norwegian Institute for Nature Research in Trondheim,
Norway, stated: “I hate to admit it as an ecologist, but the most pressing issues are related
to social science…Understanding the sociology of coexistence is really the key”
(Enserink & Vogel 2006, 747).
Human Culture and Coyotes
Animals play a vital role in our society. Harold Herzog, an expert on human-
animal relations, stated: “It would be difficult to overestimate the significance of animals
in the social and psychological life of our species. Images of animals are everywhere: in
our language, religion, dreams, television programs, and folklore. The feelings we exhibit
toward our fellow creatures are intense, complex, and paradoxical” (Herzog & Burghardt
1988, 75). Some have claimed that we best understand animal species as human-
constructs, with mythology, experiences, and folklore playing at least as important a role

3
as biology (Kellert et al. 1996; Lopez 1978). Canids and other large predators have been
particularly important to human cultures, both positively and negatively (Lopez 1978).
Coyotes are relatively recent arrivals to the metro Washington, D.C. region. In
fact, this is the last major metropolitan area to be colonized by coyotes in the United
States, with the exception of Hawaii (Parker 1995). Although they have not yet become
as ubiquitous here as in other parts of the country, there have been several human-coyote
conflicts in the area, most notably in the Fallsgrove community of Rockville, Maryland.
There, some residents were disturbed simply by the presence of coyotes—no incidents
had actually occurred—and so hired a trapper to remove and kill the coyotes frequenting
the area. This resulted in an acrimonious debate that ended up in court (Battiata 2006).
Stan Gehrt, a coyote researcher in Chicago, has explained the effect coyotes have
on some people: “Coyotes are canids, and people have always had a love-hate
relationship with canids. A lot of our wolf control was done more out of fear than any
damage done. Wolves just made us uncomfortable…usually, for people to consider an
animal to be a nuisance, that animal has to cause damage or inconvenience. But coyotes
are the one species that can be considered a nuisance simply by being fleetingly seen”
(Battiata 2006, 11).
In a recent study of attitudes in Cape Cod towards coyotes, part of the basis for
this project, Jackman (2005) found that some residents considered “coyotes staring” and
“coyotes that pass through yards or near children” a problem, illustrating the intolerance
that many have for the presence of coyotes, and perhaps projecting their personal fears
onto the behavior of coyotes. Echoing modern concerns, many early settlers in the

4
Western part of the country felt uncomfortable with wolves, a close relative of coyotes,
staring at them from outside their campsites and settlements. Many wolves were killed
for this transgression alone (Lopez 1978).
Coyotes hold a strong place in many indigenous cultures of the southwestern
United States and Central America. They play various roles in these cultures, and are
commonly portrayed as either tricksters or fools. Although in non-European cultures
coyotes play an important, mostly positive role, the Europeans and Euro-Americans who
settled in America treated them very differently.
In 1861, Mark Twain wrote a description of coyotes that aptly describes many
Euro-Americans’ opinions of coyotes:
The coyote is a long, slim, sick and sorry-looking skeleton, with a gray wolfskin stretched over it, a tolerably bushy tail that forever sags down with a despairing expression of forsakenness and misery, a furtive and evil eye, and a long sharp face, with slightly lifted lip and exposed teeth. He has a general slinking expression all over. The coyote is a living, breathing allegory of Want. He is always hungry. He is always poor, out of luck, and friendless. The meanest creatures despise him, and even the fleas would desert him for a velocipede. He is so spiritless and cowardly that even while his exposed teeth are pretending a threat, the rest of his face is apologizing for it. And he is so homely!—so scrawny, and ribby, and coarse-haired, and pitiful.
Twain continues:
He will eat anything in the world that his first cousins, the desert-frequenting tribes of Indians, will, and they will eat anything they can bite…. It is considered that the coyote, and the obscene bird [vulture], and the Indian of the desert, testify their blood kinship with each other in that they live together in the waste places of the earth on terms of perfect confidence and friendship, while hating all other creatures and yearning to assist at their funerals (Leydet 1977, 97-100).
5
When European settlers first arrived on the North American continent, they
carried with them attitudes towards large carnivores from Europe--that carnivores were
competitors and threats to human interests--as well as the belief that lethal predator
control was a necessary component of converting the continent from a wild place to a
properly civilized land (Messmer et al. 2001).
That predators should be wiped out from civilized lands was the predominant
view—even within the conservation community—until after World War II, when new
findings in ecology illuminated the importance of predators in a healthy ecosystem.
Messmer and his co-authors (2001) feel that when the media followed suit and began to
portray carnivores in a more positive light, public sentiment began to shift, until now the
majority of people, even in parts of the west where wolf restoration projects are being
considered, favor these projects (Meadow et al. 2005). Messmer et al. point out that this
transformation was due both to new findings in science and their translation into the
popular media. Stressing how important both of these steps are, they close: “…given the
dynamic nature of the competing forces shaping the natural environment, the biggest
impediment faced by wildlife managers seeking to incorporate science into public policy
may be our own inability to ‘market’ science-based management information” (1258).
Educational efforts to teach people about the need for predators in a healthy environment,
and how to live successfully with these predators, are therefore vital strategies in
preserving our nation’s ecosystems.

6
Today, predators often elicit strong emotions, either negative or positive. To
some, predators are killers and to be feared; for others, predators are symbolic of the
beauty and power of nature and are even used as totems in modern culture (sports teams
and cars, for example) (Fascione et al. 2004). These two attitudes are often at odds with
each other and often make predator conservation and coexistence programs controversial.
Humans sometimes admire predators until they interfere with human aspirations. For
example, in 2005 a bear entered Germany for the first time since 1835. He was welcomed
and nicknamed Bruno—until he killed a few sheep, at which point he was killed
(Stolzenburg 2006). However, there are cultures that have learned to coexist and
admire—even learn from—predators (Lopez 1978). Therefore, an attitudinal shift
towards coexistence is possible (Stolzenburg 2006).
Coyote Control Methods
A full description of the history of predator control in the United States is beyond
the scope of this project, although it will explore parts of the history that are directly
relevant to coyotes. Although all large predators (wolves, bears, mountain lions, etc.) in
the United States have been under lethal pressure since the arrival of European settlers,
the sheer numbers of coyotes killed is quite staggering. In 1934, the USDA (the
government agency charged with federal predator control) stated that their goal was the
“total extermination of the coyote in the United States” (in Fox & Papouchis 2005, 11).
Between 1916 and 1999, almost six million coyotes were killed by the federal
government, not including those killed by private citizens and state/local jurisdictions

7
(Fox & Papouchis 2005). In FY 2004, the federal government killed at least 75,674
coyotes (USDA-APHIS 2004); again, this number does not represent the coyotes killed
by individuals and state/local governments.
Federally funded killing of coyotes is justified by its proponents mainly because
of coyote predation of livestock, especially sheep (Berger 2006; Fox & Papouchis 2005).
However, Berger demonstrated that the decrease of financial rewards for sheep ranchers
in this country has happened for reasons other than predation. For example, she positively
correlated sheep population fluctuations with the market price and production costs of
sheep, including the cost of hay and competition with imported lamb. Predation rates
accounted for only a small percentage of the change in the number of sheep produced in
this country; therefore predation has little impact upon the financial well being of sheep
ranchers.
In many places, the emphasis on predator control is shifting from widespread,
non-targeted lethal control to an increase in the use of methods that are primarily non-
lethal to both prevent conflict and target only the individuals who have participated in
predation of livestock (Sillero-Zubiri & Switzer 2004). These non-lethal methods also
focus on changing human behavior and increasing tolerance for the presence of predatory
species (Sillero-Zubiri & Switzer 2004), and in most cases are preferred by the general
public. For example, in Minnesota, while most respondents supported wolf control to
decrease livestock predations, most preferred more humane techniques and targeted
approaches, with the exception of farmers (Kellert 1985). Non-farmers seem to be more
likely than farmers to prefer non-lethal methods of animal damage control for all species,
8
while farmers are more likely to prefer whichever methods work best, whether they are
lethal or non-lethal—with the exception of coyote control, where farmers tend to prefer
lethal methods (McIvor & Conover 1994). This is despite the fact that farmers believe
that coyotes are responsible for less livestock predation than non-farmers (McIvor &
Conover 1994).
Livestock producers more commonly use lethal control than non-lethal control, in
part because of the belief that these methods are less expensive, take less man-power, and
are more practical for large areas of land (Mitchell et al. 2004). These methods tend to
target as many coyotes as possible instead of targeting specific animals that have preyed
upon livestock. However, the public as a whole disapproves of “techniques that kill large
numbers of innocent animals” (Mitchell et al. 2004, 1214). The use of the work
“innocent” here implies that coyotes have knowledge of right and wrong in terms of what
species coyotes can legally, so to speak, target. Western culture has a history of declaring
certain animals guilty or innocent of crimes, even to the point of holding trials for
accused animals during certain periods of history (Lopez 1978). Both Western Europeans
and Euro-Americans have consistently placed symbolic guilt and innocence on predators
and livestock, respectively (Coleman 2004). The pervasiveness of this use of language is
clear even today, when even peer-reviewed journal articles continue to use words such as
innocent in the context of predators preying on domestic animals, as seen in the
aforementioned Mitchell et al. article.
People who grew up in urban areas have less support for predator control than
those from rural areas (Martínez-Espiñeira 2006; Reiter et al. 1999). Throughout all of

9
the regions that the Reiter et al. study surveyed, there was support for predator control,
but respondents had concerns about specific methods, with non-lethal and targeted
methods seen as more humane and preferred in all cases except for rodent control (Reiter
et al. 1999). Men were more likely to support the use of lethal coyote control than women
(Martínez-Espiñeira 2006), which has often been the case (Koval & Mertig 2004).
Although those who had experienced problems with coyotes were more likely to
approve of lethal control, those who had recently seen a coyote were less likely to support
lethal methods (Martínez-Espiñeira 2006). Similarly, in Saguaro National Park, Arizona,
people who had either visited the park or who had seen a mountain lion were less likely
to agree with predator control than those who had neither seen a mountain lion nor visited
the park (Casey et al. 2005).
Vancouver, British Columbia, had many human-coyote conflicts in the mid-1990s
and early 2000s. In fact, in 2001 there were six reported attacks on small children.
Whereas most jurisdictions in similar situations have turned to lethal control, Vancouver
decided to take a different approach, one that has proven to be highly effective. City
officials and wildlife professionals noted that in all of the attack incidents coyotes had
been regularly fed by humans, either purposefully or accidentally through garbage and
pet food left outside. Vancouver hired a full-time “Co-Existing with Coyotes” program
director, who both teaches people how to live safely with coyotes as well as training
“problem” coyotes who have lost their fear of humans by harassing them (throwing cans
filled with pebbles in their direction, etc.). In a few cases, coyotes have had to be
euthanized, but on the whole the program has been tremendously successful for both

10
humans and coyotes (Battiata 2006; Fox 2006). This demonstrates that the techniques
preferred by the general public can be highly effective in controlling human-coyote
conflict in urban areas.
Coyote Ecology
Stan Gehrt, of the comprehensive Cook County, Illinois, Coyote Project, has said
the Chicagoland public most wants to understand how coyotes function—how they go
about their daily business (Gehrt 2006). If this is the case, basic research into coyote
ecology and providing the results to the public can provide desired information and
perhaps lead people to the conclusion these animals can be good neighbors. Although
messaging about coyote ecology might not sway those with highly negative attitudes
towards this species, it might solidify the opinions of those who have strong positive
feelings about coyotes and cause those who have neutral attitudes to feel more positively
(Meadow et al. 2005).
Coyotes have been demonstrated to play an integral part in many ecosystems,
especially if they are the largest predatory species present in an area (Crooks & Soulé
1999). The authors used coyotes to test the theory of mesopredator release, where local
extinctions of larger mammalian carnivores leads to an increase in the density of smaller
carnivores that subsist mainly on birds and other small vertebrates. Mesopredators in the
study included the striped skunk, raccoon, grey fox, domestic cat and opossum. The
authors concluded that the presence of coyotes was the best indicator for total
mesopredator abundance in a patch of habitat, after the effects of fragment age, isolation,
11
and size were taken into account. The authors further concluded that coyotes, as the top
predator in the area, had a positive, albeit indirect, effect on bird diversity, especially the
scrub-specialist native birds that undergo frequent and rapid extinctions in the study area
(Crooks & Soulé 1999). Perhaps by learning more about the key roles that coyotes play,
we can build tolerance for their presence (Berger 2006; Estes 2004).
Although it appears that coyotes as a species have survived long-term and
extensive lethal control, such programs should still cause concern for conservation
biologists. It is almost impossible to fully understand the effect the removal of predators
such as coyotes has on ecosystems, because North American predator control by
European settlers and Euro-Americans started before the scientific evaluation of North
American ecosystems had gotten underway (Berger 2006). However, lethal predator
control causes the public to believe that predators kill a substantial number of livestock,
engendering a generally negative feeling towards them. This can affect their attitudes
towards recovery efforts for endangered and threatened predators (Berger 2006).
Western coyotes have long been residents in urban areas, and more recently
coyotes on the east coast have had an urban presence (Parker 1995). In Chicago, coyotes
have been found residing in areas where the human density is very high, pointing to the
adaptability of coyotes (Gehrt 2004a, b). In addition, coyotes tend to avoid humans,
either through spatial or temporal separation even in areas with high human density
(Andelt & Mahan 1980; Crooks 2002; Odell & Knight 2001; Riley et al. 2003; Tigas et
al. 2002).
12
Some (Timm et al. 2004) believe that coyotes in urban areas become less fearful
of humans, resulting in increased attacks. However, it remains unclear whether or not
increased negative encounters between humans and coyotes result from an increase in
human density (and therefore an increase in the probability of an encounter), an increased
association with humans and food (as a result of people feeding coyotes, intentionally or
not), or instead a lowered fear of humans, as Timm et al. proposed. It is probable that
modifying human interactions with coyotes would go far towards avoiding these
situations (Fox 2006).
In Arizona, residents who fed coyotes were visited by only one coyote group,
demonstrating that these houses were considered part of a group’s exclusive territory. It is
likely that even houses that did not purposefully feed coyotes were a source of easy food
through garbage and food left out for other wildlife. In about 35% of scats found in this
study area, human food items were found (McClure et al. 1996).
The story is different in Chicago, where coyotes rely on a large variety of food
items, most of which (such as large numbers of rodents) are only indirectly associated
with humans. In Chicago, 42% of the food items found in 1,429 scats were small rodents,
23% was fruit, deer (probably mostly fawns and road kill) was 22%, and rabbit accounted
for 18% of the diet. Unlike in Arizona, human-related food such as pet food and garbage
showed up in only 1.3% of the scats, and evidence of domestic cat (either scavenged or
predated) was found in only 1.9% of the scats (Gehrt 2006).

13
General Attitudes Towards Animals
Science is not value free, although historically it has been presented as such
(Clark et al. 2001; Primm & Clark 1996). Conservation biologists have run into problems
with the success of their projects when their own values and attitudes remain unexplored
(Clark et al. 2001). The values of locals have often been ignored in carnivore
conservation programs—for example, in the wolf reintroduction program in Michigan’s
Upper Peninsular in the 1970s (where all wolves were killed within eight months of their
release) and the Mexican wolf project. Where local values were taken into account (such
as the Yellowstone wolf and North Carolina red wolf projects), projects have been much
more successful (Clark et al. 2001).
Attitudes, especially strong attitudes, might be formed mainly by early, formative
experiences (Driscoll 1992). However, educational efforts can still play a vital role when
targeting those who feel neutral or ambivalent about animals, especially when dealing
with so-called “pest” species such as coyotes. There is some evidence to suggest that
persuasive arguments can influence those with weakly held beliefs and attitudes
(Meadow et al. 2005).
Stephen Kellert has explored in great depth the attitudes of Americans towards
animals in general and wildlife in particular (Kellert 1988; Kellert & Berry 1980). His
“positive” categories (those that indicate positive feelings and attitudes towards wildlife)
were slightly better represented than the “negative” categories (those that indicate
negative feelings and attitudes towards animals). Because this study occurred years ago,
it is possible that recent scientific discoveries about animal cognition and media coverage

14
of animal issues have changed the percentage of the population represented in some of
these categories.
Kellert also found that the American public tended to be under educated about
animals. In fact, only 24% correctly answered the true/false statement “Timber wolves,
bald eagles and coyotes are all endangered species of animals” (Kellert 1988). When
asked about coyote predation of livestock, 23% were found to be knowledgeable, while
52% were not. Predators in general were one of the least understood categories tested.
Coyotes were also included on the list of least liked species. However, coyotes had a high
standard deviation, leading Kellert to state that there was much difference of opinion
about this species (Kellert 1988; Kellert & Berry 1980).
Attitudes Towards Predators
It is possible to describe some of the root causes of both positive and negative
attitudes towards large carnivores (although coyotes are generally considered medium-
sized carnivores, they occupy the top-predator niche in the metropolitan Washington,
D.C. area, so many of the same attitudes might apply) (Clark et al. 1996):
Antagonistic attitudes towards large carnivores continue to be based on historical and cultural fears; concerns for human safety; beliefs about real or perceived competition with humans for livestock, game, and habitat; concerns over the loss of property rights under conservation legislation; and negative symbolism associated with large carnivores, such as viciousness and ferociousness. Supportive attitudes toward large carnivores are often based on perceptions of their attractiveness, an appreciation of their intelligence and strength, and affection for nature and animals; an understanding of the ecological role played by large

15
carnivores; moral and ethical beliefs; and positive symbolism associated with large carnivores, such as strength, courage, and endurance (945).
Although wolf restoration in the American West has been highly contentious, a
recent study found that most people (with the notable exception of ranchers) in states
involved in a proposed wolf restoration project supported wolf restoration—and yet, wolf
restoration programs have proven quite controversial (Meadow et al. 2005). Relatively
small groups—such as ranchers—with strong beliefs can dramatically influence policy
decisions. At the same time, larger groups with moderate, but positive, feelings towards
predators will have less influence policy decisions because they are less likely to
participate in lobbying of any sort. By extension, it is as important to strengthen the
attitudes of those who have moderately positive feelings towards coyotes to increase
tolerance for the species (Meadow et al. 2005). The authors found that persuasive
arguments did little to influence those who already held strong beliefs about wolves,
whether positive or negative. However, those with weaker attitudes and beliefs about
wolves were swayed by persuasive arguments, which demonstrates that predator
coexistence programs might be most successful if aimed at those who hold more neutral
attitudes and beliefs to begin with (Meadow et al. 2005).
Coyotes are relatively recent arrivals in the New England area, although they
have been present there longer than in the mid-Atlantic region (Parker 1995). Although
by 1994 only 20% of New England residents had ever seen a coyote, there was strong
support for the existence of coyotes in the area. Only 5% of New England residents felt
that coyotes should be completely eliminated. Thirty-nine percent agreed that coyotes
16
should be fully protected, while 40% disagreed. In addition, 70% disagreed with the
statement: “Coyotes are a menace and should be killed or driven away whenever
possible” (Stevens et al. 1994, 60).
Stevens also explored contingent valuation of coyotes in New England. Although
contingent valuation is a rather controversial method (Sagoff 1988), the author felt that it
was the only way for people to express the value they associate with coyotes (Stevens et
al. 1994). Younger, urban residents were most likely to pay to protect coyotes. Those
who would pay to protect coyotes allocated approximately 75% of their fictional payment
to an existence value: “Because coyotes have a right to exist independent of any benefit
or harm from humans” (Stevens et al. 1994).
It has been proposed that Americans value an animal species based on historical
attitudes, what emotions are elicited by the species, and its usefulness to humans
(Driscoll 1995). Coyotes would seem to fare poorly based on these criteria. For large,
attractive mammals, however, subjects did not differentiate between the usefulness of a
species and their intrinsic importance (Driscoll 1995). If people consider an animal to be
attractive for other reasons, they were also rated as being useful. Therefore, if the
popularity of animals such as coyotes is increased, the tolerance people hold for them
could be increased. This could be important not only for coyotes but also for less
common carnivores, as coyotes might act as a proxy for increasing support for the
conservation of other large carnivores (Berger 2006).

17
Attitudes towards wildlife in urban areas
Although human-wildlife conflict (HWC) might be most commonly thought of in
the context of rural areas, HWC also occurs in urban areas. A 1997 study found that
urban homeowners spent considerable time and expense in attempting to resolve HWC
with various urban wildlife species. In addition, they also spent considerable time and
money trying to attract species that are viewed positively. Urban residents seem to have a
strong interest in wildlife, either for pleasure (such as feeding and watching birds) or as
an inconvenience (such as repairing damage caused by wildlife) (Conover 1997).
In the Chicago metropolitan area, coyotes are perceived by residents as being the
greatest wildlife threat to human health and safety (Gehrt 2004c). Because of this, seeing
or hearing a coyote, regardless of actual damage, can be enough to cause residents to
want a coyote control program.
Where an animal population lives in relation to human populations probably plays
a role in determining peoples’ attitudes towards various species (Bjerke & Ostdahl 2004).
For example, while the authors found that most Norwegians favor the existence of large
predators in rural, sparsely populated areas, most had a much lower tolerance when they
lived closer to urban areas.
Personal experience can be very important in forming attitudes, both negatively
and positively. There is evidence to suggest that attitudes towards species are directly
related to whether or not that species causes an individual harm or inconvenience, as
defined by the individual (Bjerke & Ostdahl 2004). Another study found that a negative
experience with an urban wildlife species increased negative feelings only towards

18
species that are known to come into conflict with humans in urban areas (in this study,
the list included cats, dogs, rats, mice, gulls, crows, magpies and pigeons) (Bjerke et al.
2003). Because of this, it is likely that many urban residents have more positive attitudes
towards large predators such as wolves and bears, which tend not to venture into urban
areas on a regular basis, so the likelihood of conflict is low. This might change for
species such as coyotes, however, as they become more established and common in urban
areas. One study in Sweden, however, found that multigenerational city residents (whose
parents and perhaps grandparents were also city residents) actually held more negative
views of wolves and wildlife in general than those who lived in rural areas or city
residents who had regular experience in rural areas (Heberlein & Ericsson 2005).
Looking at the preferences of individuals for various species of urban wildlife in a
sample of large American metropolitan areas, it was found that birds were generally
considered more desirable than mammals, although some mammals also had high ratings.
Surprisingly, both Canada geese and deer, species generally considered nuisances in the
Washington, D.C. metropolitan area, were rated favorably. Conover felt that species that
were relatively uncommon in an area were rated more favorably than common species;
therefore, deer and Canada geese might be uncommon in many of the areas surveyed,
resulting in positive ratings (Conover 1997). It is possible that coyotes will become more
negatively viewed in newly colonized urban areas as their populations stabilize; on the
other hand, coyote populations are rather thinly dispersed across the area and so might be
better tolerated as they would be rarely seen. For example, foxes were reported to have a
neutral rating in an urban area in Norway (Bjerke & Ostdahl 2004).

19
In a study carried out in Minnesota, urban residents held strong protectionist
feelings and affection for wolves, while rural residents held weaker protectionist views
(Kellert 1985). In Michigan, people who grew up in rural areas, especially those with
concerns over economic losses due to predation, had more negative attitudes towards
predators in general (including coyotes) than others (Hook & Robinson 1982). In a
quantitative summary of attitudinal studies of wolves across several decades (1972-
2000), urban residents consistently had more positive attitudes towards wolves than most
rural residents, with the exception of hunters and trappers (Williams et al. 2002).
Pet Ownership
Pet ownership can play a role in influencing attitudes towards other animals.
Having a positive experience with a pet can increase positive attitudes towards animals;
however, having a negative experience with a pet does not result in increased negative
feelings towards animals (Fidler 2003). Pet ownership has been correlated with more
favorable attitudes towards urban wildlife than non-pet owners, although it is unclear
whether having a pet is merely an indicator of good feelings towards animals in general,
or if pet ownership itself influences these feelings (Bjerke et al. 2003). Another study
demonstrated that pet owners liked most urban wildlife species more than non-pet owners
(with the exception of rats, mosquitoes, snails, and insects) (Bjerke et al. 2003).
Conversely, yet another study found that while positive experiences with pets can
increase positive feelings towards animals, negative experiences with pets could do the

20
opposite (Knight et al. 2004). More research needs to be done to conclusively determine
the role of pet ownership in attitudes towards animals.
An attachment to animals has been linked to negative feelings towards large
carnivores in rural Norway. There, sheep farmers who formed attachments to their sheep
(i.e. felt sad when they went to slaughter, expressed fondness towards their sheep, etc.)
felt more negatively about carnivores than did farmers who did not express attachment to
their sheep. This makes sense, as large carnivores are sometimes a threat to domestic
sheep (and perhaps more importantly are usually perceived as threats to sheep); if farmers
feel close to their sheep, then they would naturally dislike non-human animals that might
do them harm (Vitterso et al. 1998).
Environmental Education
A major goal of canine education programs should be to encourage coexistence
(Taylor 2004). By understanding the attitudes of the population the educator is working
with, he or she can target the educational program specifically to the audience in
question, based in part on their worldview (Taylor 2004).
Worldviews are important to consider when dealing with a conflict situation, such
as when a population is divided on how they feel about the arrival of a carnivorous
species in their area. Worldview is defined as: “a concept that attempts to articulate the
consequences of human activities that are individual as well as collective, psychological
as well as social” (Docherty 2001, 50). Worldviews are dynamic and are a social
construct, developed by a group of people instead of individuals (Docherty 2001). At

21
times, those attempting to resolve conflicts disregard those who demonstrate high
emotions rather than reasoned arguments. However, this can marginalize certain groups,
leaving them unhappy with whatever solution is proposed. If a group of stakeholders is
unsatisfied with a management plan, they can work to undercut the effectiveness of the
program (Docherty 2001). Human wildlife conflict practitioners need to learn to navigate
between different worldviews. Understanding the basic attitudes of different stakeholder
groups is key to beginning to understand their worldview.
Education attempts to affect human behavior (Hungerford & Volk 1990). In 1977,
the Tbulisi Intergovernmental Conference on Environmental Education declared that the
objectives of environmental education (EE) were awareness, sensitivity, attitudes, skills,
and participation (Hungerford & Volk 1990). Reaching these objectives would create
environmentally responsible citizens. Although most EE programs still focus mainly on
increasing the knowledge of students, this has proven to have only a small influence on
human behavior (Hungerford & Volk 1990). However, learning the facts is the initial step
to a well-rounded EE program—students must have knowledge to make environmentally
responsible decisions (Hungerford & Volk 1990). Part of this study is an attempt to
define what type of knowledge is most effective in this initial step, recognizing that in
most public outreach program situations, educators and conservationists only have a
moment (for example, a glance at a flyer or brochure) to get their message across to the
public. In these cases, knowing what type of information best informs and influences
people is valuable as knowledge does comprise one aspect of attitude, especially for those
that know little to begin with (Reading & Kellert 1993).

22
Perception is often a more potent force in establishing attitudes than knowledge
(Kellert et al. 1996). Kellert et al. suggest four variables that affect people’s perceptions
of predators and predator conservation programs: 1) Basic, underlying values affect
feelings towards specific species; 2) The specific characteristics of the species influence
attitudes, i.e., their physical attributes, intelligence or perceived intelligence,
historical/cultural associations, etc. (Also in Driscoll, 1995); 3) Basic knowledge of a
species; and 4) The interactions that an individual has had with the species and whether
these were positive or negative experiences (978).
Conclusion
The goal of this project is to increase the understanding of Washington, D.C. area
residents’ attitudes towards and beliefs about coyotes. As coyotes are recent arrivals to
the D.C. area, this study will also provide baseline attitudinal data that will be helpful to
refer back to as awareness of coyotes grows over time. In addition, this project will
provide guidance to those who are designing outreach materials, such as flyers and
posters, for coyote coexistence programs by determining what sorts of short messages
about the species are most effective in influencing attitudes towards coyotes.
23
Methodology
In 2005, a survey was conducted in Cape Cod, Massachusetts, examining attitudes
towards coyotes in the area (Jackman 2005). The survey instrument used in this current
study was modeled on that used in Cape Cod, although some sections were changed and
expanded (notably the sections measuring the impact of messaging on respondents’
attitudes towards coyotes). In addition, the author was in communication with Jackman
before her survey and had some input on the questions asked in the initial 2005 project.
After Jackman finished her project, she and the author of this study discussed questions
that worked well or did not work as well, which provided guidance to the writing of this
survey instrument (Appendix), similar to a pilot study. In addition, the survey instrument
was given to 10 colleagues (fellow graduate students in the Environmental Science and
Policy department at George Mason University). Their input was incorporated into the
final draft of the survey.
The survey instrument was distributed to undergraduate students in introduction
to biology (BIOL 103) and introduction to environmental science (EVPP 110) courses at
George Mason University. These courses meet a general education science requirement at
George Mason University; therefore, the classes are composed primarily of students who
are seeking majors in non-science disciplines. George Mason University’s Human

24
Subjects Review Board approved the surveys and the procedure used while administering
the surveys.
The surveys were distributed to students in laboratory sections at the beginning of
the semester, with a response rate of 94.7% (n = 769 surveys completed). 84.3% of the
surveys were completed in introduction to biology lab sections, and 15.7% were
completed in introduction to environmental science labs. As an incentive to participation,
students were given a raffle ticket for a $100.00 gift certificate to an electronics store
upon turning in a completed survey. Collected surveys were assigned a number and were
coded according to a system that was developed on an Excel spreadsheet. Three
undergraduate students (two of whom were paid an hourly wage and one who earned
credit for her work as an independent study) assisted with the coding. Coding errors were
checked by selecting a random sample of 25 surveys, recoding them, and comparing
them to the originals. In all instances, there were no errors in the original.
Once the survey data were coded on the Excel spreadsheet, it was transferred to
SPSS 13 for Mac OS X. The new data file was again checked for errors by examining the
scores for each variable to ensure that each answer fell within the expected range. All
errors found were corrected by going back to the original survey and recoding incorrect
scores. SPSS 13 for Mac OS X was used for all statistical analyses. References to specific
questions in the survey will be accompanied by the question number (in form “Q#”) in
the survey. The survey instrument can be found in the Appendix.
The gender (Q38) and age (Q39) of each respondent were recorded. For analysis
purposes, age was collapsed into two categories: traditional students (19-25) and non-

25
traditional students (26-40), as the author was most interested in whether there might be
differences in attitudes towards coyotes between these two groups as this might indicate
whether or not college students had different attitudes than adults in the area. In addition,
each respondent was asked whether or not they belonged to any environmental, wildlife,
or animal protection organizations (Q42).
Respondents were asked whether they were aware that coyotes were present in the
Washington, D.C. metropolitan area (Q3), whether or not they had seen or heard a media
story about coyotes in the past year (Q5), how much they supported the existence of
coyotes in the D.C. area (Q4), and how much they liked or disliked coyotes (Q6).
Attitudes Towards Wildlife Management Policies
Participants were asked a series of three questions to determine their general
attitudes towards coyote management in the D.C. metropolitan area (Q27). The responses
were scored on a five-point Likert scale.
Activities
Past studies tell us that those who spend the most time participating in any sort of
outdoor activity tend to have the most positive feelings towards predators. Individuals
who regularly participated in non-consumptive wildlife-related activities had somewhat
more positive values towards predators than the general public, but there was not much
difference between consumptive and non-consumptive participants (Hook & Robinson
1982). On the other hand, hunting and having hunting as a family tradition actually

26
increased positive attitudes towards wolves, although this study looked specifically at
wolves and not at predators in general (Williams et al. 2002).
An ACTIVITIES index was created to show how much respondents participated
in wildlife-related activities in order to explore whether or not participation in such
activities influenced attitudes towards coyotes. The index was created by adding the total
scores for each part of Q1 for each respondent. The minimum and maximum possible and
actual scores were recorded, as well as the mean, median, and skewness score.
Independent-samples t-tests were conducted to compare the ACTIVITIES scores with
gender, age, and whether or not the respondents were members of an environmental,
wildlife, or animal protection organization.
Belief in Animal Mind
“Belief in Animal Mind” (BAM) can be defined as “how we attribute to animals
mental capacities such as intellect, the ability to reason, and feelings of emotion” (Knight
et al. 2004, 44). Higher levels of BAM have been correlated with less support of animal
use (i.e. in animal-model experiments). It is therefore possible that having higher levels
of BAM would predispose an individual to preferring non-lethal coyote management
techniques, as well as perhaps being more tolerant of their presence.
Although there is no standard way of measuring BAM, one was developed that
has proven useful (Hills 1995). Her original scale was modified by Jackman (2005) to
refer specifically to coyotes. That modified index (Q7) was used in this project as well

27
and was scored on a five-point Likert scale. The last item of Q7 was reverse-coded for
ease of understanding the index.
The Chronbach’s alpha for this index was 0.486; however, when the last question,
that begins “Coyotes are more like computer programs,” was removed from the index,
the internal reliability increased (Chronbach’s alpha = 0.583). In the 1995 Cape Cod
study, the last question was also removed for purposes of analysis (Jackman 2005). The
BAM index in Hills’ original study was highly internally reliable (Chronbach’s alpha =
0.900).
The BAM index was reverse coded for ease of interpretation. Independent-
samples t-tests were then performed to compare BAM scores with respondents’ gender,
age, and whether or not they were members in an environmental, wildlife, or animal
protection organization.
Knowledge
Although, as discussed earlier, efforts to change people’s attitudes towards
coyotes should not stop with providing facts about coyotes, increasing the knowledge that
residents’ have about coyotes is a necessary step in affecting attitudes (Reading & Kellert
1993). Therefore, exploring the level of knowledge that the sample population currently
holds is important.
To do this, an attempt was made to create a knowledge index (the sum of the parts
of Q2), but it proved internally unreliable (Chronbach’s alpha = 0.204). A factor analysis
28
of the index was performed, but removing items did not noticeably increase the reliability
of the index. However, individual items from Q9 proved interesting.
Fear Concerns about living in close proximity to wild animals help shape people’s
attitudes towards these animals. In the Chicago metropolitan area, coyotes were
perceived by residents as being the greatest wildlife threat to human health and safety
(Gehrt 2004c). In another study, the factor that most contributed to negative feelings
towards predators was fear (Hook & Robinson 1982).
This survey included a section on fears about coyotes, based on an elk study (Lee
& Miller 2003). Jennifer Jackman modified her index to apply it specifically to coyotes
(Jackman 2005). Jackman’s items were used in this project to create a FEAR index using
six items scored on a four-point scale (Q9). The index was created by adding the
components of participants’ responses to Q9. The index was found to be internally
reliable (Chronbach’s alpha = 0.868). The minimum and maximum possible and actual
scores were recorded, as well as the mean, median, and skewness score.
A factor analysis was attempted for the FEAR index; however, although it looked
promising in the correlation matrix, only one factor (consisting of all of the questions)
was extracted in the component matrix.
Independent-samples t-tests were performed to compare gender, age, and whether
or not respondents were members of an environmental, wildlife, or animal protection
organization with the FEAR index.

29
Support
A SUPPORT index was developed to measure the level of support respondents
had for coyotes in the Washington, D.C. metropolitan area. The index was based on
questions similar to those asked in Jackman’s (2005) Cape Cod survey. The index was
created by adding participants’ responses to four questions scored on a four-point scale
(the components of Q8). Two of the questions (“the current D.C. metro area coyote
population is a problem” and “coyotes don’t belong in the D.C. metro area”) were reverse
coded to make the creation of the index possible. In addition, the entire index, once
created, was reverse coded to simplify interpretation. The SUPPORT index was found to
be internally reliable (Chronbach’s alpha = 0.643), and the minimum, maximum, mean,
median and skewness values for the index were recorded.
Independent-samples t-tests were conducted to compare the SUPPORT index
with respondents’ gender, age, and whether or not they were members of an
environmental, wildlife, or animal protection organization.
Correlations
All possible combinations of the indices were tested for correlations using a
bivariate correlation process to create a Pearson product-moment correlation coefficient.
Pets
As was discussed in the introduction, it is possible that pet ownership can
influence attitudes towards other animals (Bjerke et al. 2003; Fidler 2003; Knight et al.
30
2004). Pet owners are important stakeholders in any discussion of coyote management
plans, as coyotes have been known to prey upon cats and small dogs. Therefore, this
project explored the role that pet ownership might have on attitudes towards coyotes.
Participants were asked whether they or their household has a dog (Q16) or cat
(Q20) in the Washington, D.C. metropolitan area. The percentages of dog owners and cat
owners were recorded, and a new variable, pet ownership, was created that included both
cat and dog owners. In Q19 and Q23, respondents were asked to rate particular concerns
that they might have about dog or cat safety on a four-point scale. Both pet owners and
non-pet owners’ responses were recorded.
Independent-samples t-tests were performed that compared whether or not a
respondent owned a pet (defined as a dog or cat) with the BAM, SUPPORT, and FEAR
indices. Chi-square tests for independence were run to compare pet ownership with
support for the existence of coyotes in the D.C. metropolitan area (Q4) and how much the
respondents liked or disliked coyotes (Q6).
Q26 addressed whether or not respondents felt that coyotes should be held
responsible for pet predation when the pet was outside unsupervised at the time. This
question was scored on a five-point scale. Responses were recorded for both the pet
owners and non-pet owners. In addition, a Chi-square test for independence was run to
compare pet ownership with Q26. Whether or not there was a correlation between Q26
and the FEAR, SUPPORT, and BAM indices were also explored, using Pearson product-
moment correlation coefficient.

31
Media
The media can have a powerful influence on people’s perceptions of problems. As
Stanley Gehrt, the coyote researcher in Chicago, said, coexistence happens 99% of the
time—it’s just the 1% of the time that you hear about it, often through the media, where
conflicts occur. This can present a skewed view of reality (Gehrt, personal
communication, 2007). On the other hand, an incident where an infant was killed by a
black bear in New York State that was widely covered in the media over a short period of
time caused the percentage of people who felt the risk of being attacked by a bear was
acceptably low to actually rise after the incident (81% pre-incident, 87% post-incident).
This might be because the media widely reported how rare such attacks were and
portrayed this as an isolated incident (Gore et al. 2005). Because of the impact the media
can have, its influence on the sample population’s attitudes was explored.
Respondents were asked whether they had seen or heard a media story about
coyotes in the Washington, D.C. metropolitan area, and, if so, in what form (Q5). A Chi-
square test for independence was then run to compare whether or not they had seen or
heard a media story with their support for coyotes in the D.C. metropolitan area (Q4) and
how much they liked or disliked coyotes (Q6). In addition, an independent-samples t-test
was performed to compare the FEAR index with whether or not the respondents had seen
or heard a media story.

32
Experiences with Coyotes
Respondents were asked whether or not they had seen (Q10) or heard (Q11) a
coyote in the D.C. metropolitan area, defined as an experience with a coyote for the
purposes of this study. Independent-samples t-tests were conducted to compare whether
or not they had seen or heard a coyote with the FEAR and SUPPORT indices. In
addition, a Chi-square test for independence was performed to look for relationships
between whether or not the respondents had seen or heard a coyote and how much they
liked or disliked coyotes.
Respondents were also asked to rate their experiences with coyotes (Q12). All
analyses for this question were conducted by selecting only those respondents who had
answered that they had seen or heard a coyote in Q10 and Q11. The relationship between
their ratings of their experience with the FEAR, BAM, and SUPPORT indices was
investigated using Pearson product-moment correlation coefficient.
Q14 and Q15 dealt with whether or not the respondents’ households had changed
their behavior in some way because of the presence of coyotes near their house.
Specifically, Q14 dealt with changes in behavior towards pets, and Q15 dealt with
changes to property. The responses were combined in a new variable that expressed
whether or not a respondent had changed their behavior due to the presence of coyotes
near their household. Independent-samples t-tests were performed to compare the FEAR
and SUPPORT indices with whether any behavioral changes had taken place. In addition,
a Chi-square test for independence was performed to explore whether there was any

33
relationship with respondents changing their behavior and how much they liked or
disliked coyotes.
Respondents were also asked whether they had any knowledge of a dog or cat,
either their own or someone else’s, being attacked by a coyote (Q24). A new variable was
created from this question that simply signified whether a respondent had knowledge of a
coyote attacking a pet. Independent-samples t-tests were performed to compare having
knowledge of such an attack and the SUPPORT and FEAR indices. In addition, a chi-
square test for independence was performed to compare the relationship between having
knowledge of such an attack and how much the respondent liked or disliked coyotes
(Q6).
Gender
Gender can be an important influence on people’s attitudes towards wildlife and
wildlife management policies (Bjerke & Ostdahl 2004; Bjerke et al. 2003; Casey et al.
2005; Czech et al. 2001; Lauber et al. 2001). Gender was given consideration when
discussing each index. In addition, Chi-square tests for independence were run to
compare gender with how much support an individual had for the presence of coyotes in
the D.C. metropolitan area (Q4) and how much the individual liked or disliked coyotes
(Q6).

34
Messaging
To explore what types of specific information—given in short “sound bites” such
as through outreach materials—might best influence peoples’ attitudes towards coyotes,
participants were presented with short statements about or images of coyotes in one of
four categories (behavioral, ecological, human-coyote relations, or images). In the
behavioral, ecological, and human-coyote relations forms, ten statements were given. In
the images form, nine images were presented to the respondents (Q29beh, Q29eco,
Q29cul, and Q29ima). Respondents were asked to indicate whether the provided
information made them feel more or less positively about coyotes on a five-point scale.
Although in the Appendix, all of the categories are presented in one survey form, it
should be noted that each respondent received only one of these sections. In all, 25.1%
(N=193) completed surveys that included the human-coyote relations statements, 25.9%
(N=199) included the behavioral statements, 24.4% (N=188) included the ecological
statements, and 24.6% (N=189) included the images.
A series of questions that had been asked before the statements or images had
been presented to the participants (pre-test) were asked again after the statements or
images were given to the participants (post-test). The paired questions were Q4 and Q30,
Q6 and Q31, Q27 and Q32, and the BAM index (Q7 and Q33). The second BAM index
was created in the same way the first was, by removing the last item to increase the
internal reliability of the index (Chronbach’s alpha = 0.714) and then reverse coding the
index to make the analysis more understandable.

35
Paired-samples t-tests were performed on all of the pre- and post-test matching
questions for all of the surveys together, in order to measure the effect that providing any
type of information might have on respondents’ attitudes towards coyotes.
For each of the four forms, the frequencies of how each individual statement or
image made the respondents feel more or less positively towards coyotes was recorded.
In addition, paired-sample t-tests were performed on all of the pre- and post-test matched
questions for each of the forms separately, in order to explore what specific category of
information might best influence attitudes towards coyotes.
36
Results of Attitudinal Section
Females made up 63.2% of the subjects while males made up 36.8%. The ages of
the students ranged from 18 to 47. Ages were collapsed into two categories: traditional
students (19-25; n= 686, 89.2%) and non-traditional students (26-40; n=48, 6.2%), as
differences in responses between these two categories might indicate whether traditional
college students have greatly different attitudes towards coyotes than the general public.
Overall, the median age was 20 and the mean was 24.
Only 36.7% (n = 764) of students were aware that coyotes are present in the
Washington, D.C. metropolitan region. Similarly, few students (13.7%, n = 764) had seen
a media report about coyotes in the past year. Tables 1 and 2 demonstrate that most
respondents had rather neutral feelings towards coyotes, with 80% of respondents either
“somewhat” or “not very much” supporting the existence of coyotes in the area, and
nearly 70% feel neutral about coyotes when asked how much they liked or disliked the
species.

37
Table 1. Responses to the question: “How much do you or don’t you support the coyote’s existence in the D.C. metro area?” Percentages are given in valid/actual format. N = 763. Very much Somewhat Not very much Coyotes should be
eliminated or driven out of the D.C. metro area
Percentage of respondents
12.2 / 12.1 41.4 / 41.1 40.9 / 40.6 5.5 / 5.5
Table 2. Responses to the question: “How much do you like or dislike coyotes?” Percentages are given in valid/actual format. N = 758 Dislike very
much Dislike somewhat
Neutral Like somewhat Like very much
Percentage of respondents
4.6 / 4.6 7.5 / 7.4 67.7 / 66.7 13.3 / 13.1 6.9 / 6.8
Attitudes Towards Coyote Management
Respondents were asked three questions relating to their general attitudes towards
coyote management. The responses are summarized in Table 3.

38
Table 3. Attitudes towards coyote management. Percentages are in valid/actual format. Strongly
agree Somewhat agree
Neither agree nor disagree
Somewhat disagree
Strongly disagree
N
The D.C. metro area coyote population should be protected and preserved
23.8 / 21.5
39.6 / 35.6
26.2 / 23.5
6.8 / 6.1 3.6 / 3.3 692
The D.C. metro area coyote population size should be controlled
20.2 / 18.2
45.7 / 41.2
24.1 / 21.7
5.5 / 4.9 4.5 / 4.0 693
The D.C. metro area coyote population should be completely eliminated
2.7 / 2.5 5.3 / 4.8 19.0 / 17.2
20.4 / 18.5 52.5 / 47.5
695
These data lend support to the idea that coyotes have a certain amount of support
in the study population. Most notably, the majority of respondents disagreed with the
statement: “The DC metro area coyote population should be completely eliminated.”
ACTIVITIES
The ACTIVITIES index (Chronbach’s alpha = 0.798) had a minimum possible
score of nine and a maximum possible of 45, with lower scores indicating less
participation in such activities. Actual scores covered the full possible range. The index
had a mean of 17.71, a median of 17.00, and a skewness score of 1.02 (SE = 0.09). Figure

39
1 shows the range of ACTIVITIES scores, demonstrating that most respondents spent
little or moderate time participating in wildlife-related activities.
Figure 1. Range of respondents’ ACTIVITIES Scores, showing how much time respondents spent participating in wildlife-related activities. Higher scores indicate higher rates of participation.
Table 4 presents the results of the independent-samples t-tests run with the
ACTIVITIES index. Only the test that compared whether participants were members of
an environmental, wildlife, or animal protection organization was significant (p < 0.001),

40
with members of such organizations participating at greater rates in wildlife related
activities than non-members.
Table 4: Summary of results of independent-samples t-tests. ACTIVITIES BAM SUPPORT FEAR Gender Male 17.94 ± 5.71 14.15 ± 2.96 12.82 ± 3.00 13.11 ± 4.62 Female 17.54 ± 5.10 14.32 ± 2.62 11.85 ± 2.75 15.13 ± 5.05 t(df) t(742) = -0.99 t(575) = 0.74 t(488) = -3.67* t(580) = 5.33* Membership Member 21.49 ± 6.11 14.53 ± 2.82 13.70 ± 2.53 12.56 ± 4.41 Non-member 17.29 ± 5.10 14.24 ± 2.75 12.06 ± 2.90 14.55 ± 5.01 t(df) t(730) = 6.42* t(564) = 0.76 t(481) = 3.74* t(667) = -3.10* Student status Traditional 17.64 ± 5.62 14.26 ± 2.73 12.22 ± 2.94 14.41 ± 4.98 Non-traditional 17.57 ± 5.28 14.38 ± 3.28 12.73 ± 2.30 13.49 ± 5.21 t(df) t(718) = 0.09 t(558) = -0.25 t(472) = -0.93 t(656) = 1.18 * equals p < 0.01
BAM
The BAM index (Chronbach’s alpha = 0.583) had a minimum possible and actual
score of 4 and a maximum possible and actual score of 20, with higher scores indicating a
greater degree of BAM. The sample population had a BAM score mean of 14.25, a
median of 14.00, and a skewness score of -0.32 (SE = 0.101). Figure 2 shows the range
of BAM scores respondents had which indicates how much they believe that coyotes are
thinking, feeling creatures.

41
Figure 2. The range of respondents’ BAM scores, indicating the strength of their belief in animal mind as it relates to coyotes. Higher scores indicate higher levels of BAM.
Table 4 shows the results of the BAM independent-samples t-tests. There were no
significant results.
Knowledge
The results of the series of questions that were asked to assess respondents’
knowledge about coyotes can be found in Table 5. Notably, most respondents correctly

42
agreed that coyote attacks on humans are not common, that coyotes will prey upon cats,
and that if you encounter a coyote you should not run away from it. On the other hand,
most respondents thought incorrectly that coyotes were endangered and that adult males
weigh an average of 100 pounds.
Table 5. Responses to knowledge about coyotes questions. The correct response is in bold print for each question. Percents are in valid/actual format. Agree Disagree N Coyotes are carnivores that eat only meat
59.4 / 58.6 40.6 / 40.1 769
Coyotes always travel in packs 44.5 / 44.1 55.5 / 55.0 762 Coyote attacks on humans are not common
81.2 / 80.1 18.8 / 18.6 759
Adult male coyotes weigh on average 100 lbs.
57.8 / 57.2 42.2 / 41.7 761
Coyotes are in danger of becoming extinct
70.2 / 69.6 29.8 / 29.5 762
Coyotes will kill cats on occasion
77.9 / 77.0 22.1 / 21.8 760
If you encounter a coyote, you should run away from it
28.8 / 28.5 71.2 / 70.5 761
Fear
The FEAR index (Chronbach’s alpha = 0.868) had a minimum possible and actual
score of 6 and a maximum possible and actual score of 24; the lower the score, the less
fear the respondent had of coyotes. The index had a mean of 14.37, a median of 14.00,
and a skewness score of 0.10 (SE = 0.09). Figure 3 shows the range of respondents’
FEAR scores, indicating how much or how little they fear coyotes.

43
Figure 3. The range of respondents’ FEAR scores, indicating how much or how little they fear coyotes. Higher scores indicate higher levels of fear.
The responses to individual components of the FEAR index provided valuable
information by pinpointing the strongest concerns respondents had about coyotes. Table 6
summarizes these results.

44
Table 6. How concerned respondents are about specific fears related to coyotes. Percents are in valid / actual format. Not a concern Minor concern Moderate
concern Major concern N
Potential risk to myself in a face-to-face encounter with a coyote
51.8 / 48.9 21.6 / 20.4 14.9 / 14.0 11.6 / 10.9 726
Coyotes attacking dogs
29.6 / 2 /7.7 30.8 / 28.9 26.5 / 24.8 13.1 / 12.2 720
Coyotes attacking cats
36.1 / 34.1 27.1 / 25.6 24.4 / 23.0 12.4 / 11.7 726
Having coyotes near my home
31.8 / 30.6 26.7 / 25.6 20.1 / 19.2 21.4 / 20.5 738
Coyotes spreading rabies
11.3 / 10.8 19.7 / 18.7 26.8 / 25.5 42.2 / 40.2 732
Coyotes attacking children
16.1 / 15.3 16.3 / 15.6 22.1 / 21.1 45.5 / 43.4 734
Of particular interest is that half of respondents felt that a face-to-face encounter
with a coyote was not a concern, while at the same time 43% of respondents felt that the
potential for a coyote to attack a child was a major concern. This is despite the fact that
most respondents knew that coyote attacks on humans were rare (see Knowledge section
above). In addition, 40% of respondents felt that coyotes spreading rabies was a major
concern even though coyotes are not a vector species for rabies in this area.
The results of independent-samples t-tests run with the FEAR index can be found
in Table 4 on page 40. Women had more fear of coyotes than men (p < 0.001) and
members of environmental, wildlife, or animal protection organizations had less fear than
non-members (p = 0.002).

45
Support
The SUPPORT index (Cronbach’s Alpha = 0.643) had a minimum possible and
actual score of 4 and a maximum possible and actual score of 20, with lower scores
indicating less support for coyotes. The index had a mean of 12.22, a median of 12.00,
and a skewness value of 0.076 (SE = 0.110). See Figure 4 for respondents’ SUPPORT
scores, indicating how much or how little they support the existence of coyotes.
Figure 4: Range of respondents’ SUPPORT scores, showing how much or how little respondents support the existence of coyotes. Higher scores indicate higher levels of support.

46
Table 4, on page 40, summarizes the results of a series of independent-samples t-
tests comparing SUPPORT to demographic variables. Men tended to be more supportive
of coyotes than women (p < 0.001) and members of environmental, wildlife, or animal
protection organizations tended to be more supportive of coyotes than non-members (p <
0.001).
Correlations
Pearson product-moment correlation coefficients were created to explore possible
relationships among the six possible combinations of indices (see Table 7).
Table 7. Results of correlation analysis of the four indices. Significant results are in bold print. ACTIVITIES
& BAM ACTIVITIES & SUPPORT
ACTIVITIES & FEAR
BAM & SUPPORT
BAM & FEAR
SUPPORT & FEAR
p-value 0.083 < 0.001 0.208 < 0.001 0.103 < 0.001 Pearson correlation coefficient
0.072 0.19 -0.49 0.17 -0.07 -0.33
The more an individual participated in wildlife-related activities, the more likely
he or she was to support the existence of coyotes. Similarly, the higher the degree of
BAM an individual held, the more likely he or she was to support the existence of
coyotes. The SUPPORT and FEAR indices had a negative correlation, indicating that the

47
more an individual supported the existence of coyotes, the less likely they were to fear
coyotes.
Pets
32.7% of respondents or their households owned dogs, while 19.7% of
respondents or their households owned cats. In total, 56.9% (n=431) of respondents had
no pets, while 43.1% (n=326) had one or more pets (pets here are defined as cats or
dogs).
Most respondents (whether pet owners or non-pet owners) were either not
concerned or had only minor concerns about dogs being attacked by coyotes. Even fewer
respondents were concerned about coyotes attacking cats (see Tables 8-11).
Table 8. Pet owners responses to: “Please indicate how concerned you are that the following could happen to dogs that are outside unsupervised or are off-leash in the DC metro area”. Percents are in valid/actual format. Not a concern Minor concern Moderate
concern Major concern N
Fighting with other dogs
15.9 / 15.3 33.0 / 31.9 33.3 / 32.2 17.8 / 17.2 315
Being hit by a car or truck
5.6 / 5.5 14.9 / 14.7 27.6 / 27.3 51.9 / 51.2 322
Being attacked by a coyote
38.9 / 37.4 38.5 / 37.1 13.1 /12.6 9.6 / 9.2 314
Being stolen for dog fighting
44.2 / 42.3 28.2 / 27.0 14.4 / 13.8 13.1 / 12.6 312

48
Table 9. Non-pet owners responses to: “Please indicate how concerned you are that the following could happen to dogs that are outside unsupervised or are off-leash in the DC metro area.” Percents are in valid/actual format. Not a concern Minor concern Moderate
concern Major concern N
Fighting with other dogs
22.9 / 21.3 29.9 / 27.8 34.6 / 32.3 12.7 / 11.8 402
Being hit by a car or truck
12.5 / 11.8 16.1 / 15.3 33.7 / 32.0 37.7 / 35.7 409
Being attacked by a coyote
34.5 / 31.8 27.2 / 25.1 19.6 / 18.1 18.6 / 17.2 397
Being stolen for dog fighting
37.8 / 34.1 21.1 / 19.0 20.6 / 18.6 20.6 / 18.6 389
Table 10. Pet owners’ responses to: “Please indicate how concerned you are that the following could happen to cats that are unsupervised and off-leash in the DC metro area.” Percents are in actual/valid format. Not a concern Minor concern Moderate
concern Major concern N
Being attacked by dogs
28.1 / 26.7 37.1 / 35.3 19.7 / 18.7 15.2 / 14.4 310
Being hit by a car or truck
17.4 / 16.6 20.6 / 19.6 27.1 / 25.8 34.8 / 33.1 310
Being attacked by a coyote
45.7 / 42.6 31.9 / 29.8 12.2 / 11.3 10.2 / 9.5 304
Being attacked by great horned owls or hawks
51.7 / 47.9 28.1 / 26.1 10.6 / 9.8 9.6 / 8.9 302

49
Table 11. Non-pet owners’ responses to: “Please indicate how concerned you are that the following could happen to cats that are unsupervised and off-leash in the DC metro area.” Percentages are in valid/actual format. Not a concern Minor concern Moderate
concern Major concern N
Being attacked by dogs
32.8 / 31.1 28.9 / 27.4 25.2 / 23.9 13.0 / 12.3 408
Being hit by a car or truck
20.7 / 19.7 21.9 / 20.9 29.9 / 28.5 27.5 / 26.2 411
Being attacked by a coyote
42.3 / 39.0 24.7 / 22.7 18.9 / 17.4 14.1 / 13.0 397
Being attacked by great horned owls or hawks
47.7 / 43.4 24.7 / 22.5 15.8 / 14.4 11.7 / 10.7 392
Pet owners and non-pet owners did not differ in their degree of BAM. Non-pet
owners feared coyotes more than pet owners (p = 0.003), and there was no difference in
levels of SUPPORT between pet owners and non-pet owners (see Table 12).
Table 12. Results of independent-samples t-tests comparing pet ownership status with BAM, FEAR, and SUPPORT indices. BAM FEAR SUPPORT Pet owners 14.36 ± 2.78 13.71 ± 4.62 12.43 ± 2.95 Non-pet owners 14.17 ± 2.70 14.84 ± 5.21 12.04 ± 2.81 t(df) t(578) = -0.84 t(664) = 3.00* t(490) = -1.50 * = p < .01
A chi-square test for independence was run to compare pet ownership with
support for the existence of coyotes in the DC Metro area, opposed to overall support for
the existence of coyotes as indicated by the SUPPORT index (see Table 13). There was a

50
significant relationship between pet owners and non-pet owners, with more pet owners
very much or somewhat supporting the existence of local coyotes, while more non-pet
owners did not have very much support, or believed that coyotes should be eliminated or
driven out of the D.C. metro area.
Table 13. “How much do you or don’t you support the coyote’s existence in the DC metro area?” Results of a chi-square test for independence (p = 0.041, Pearson-Chi-Square = 8.24, Cramer’s V = 0.10). Pet owners Non-pet owners Very much 15.4% 9.7% Somewhat 43.1% 40.1% Not very much 36.3% 44.3% Coyotes should be eliminated or driven out of the DC metro area
5.2% 5.8%
Totals 100% 99.9%
A chi-square test for independence was also run to compare pet ownership with
how much respondents liked or disliked coyotes (see Table 14). Again, there was a
significant relationship. Pet owners seemed to have more extreme feelings about coyotes,
either positively or negatively, than non-pet owners.

51
Table 14. “How much do you like or dislike coyotes?” Results of a Chi-square test for independence (p = 0.018, Pearson Chi-Square = 11.88, Cramer’s V = 0.13). Pet owners Non-pet owners Dislike very much 5.2% 4.2% Dislike somewhat 5.2% 8.9% Neutral 65.2% 69.6% Like somewhat 14.5% 12.6% Like very much 9.8% 4.7% Total 99.9% 100.0%
When asked whether or not they agreed with the statement: “If people allow their
pets outside unsupervised, they should not blame coyotes for pets that are attacked”
(Q26), most either agreed or felt neutral about the statement (see Table 15). A chi-square
test was run to look at the relationship between pet ownership with the above statement,
but there was no significant relationship (p = 0.550). Both pet owners and non-pet owners
seem to agree that pet owners have some responsibility towards keeping their pets safe
from coyotes.
Table 15. Level of agreement with whether coyotes should be blamed for predations of unsupervised pets. Percents are in valid/actual format. Strongly
agree Somewhat agree
Neither agree nor disagree
Somewhat disagree
Strongly disagree
N
Q26. If people allow their pets outside unsupervised, they should not blame coyotes for pets that are attacked
19.7 / 18.5 34.3 / 32.1 19.2 / 17.9 16.0 / 15.0 10.8 / 10.1 720
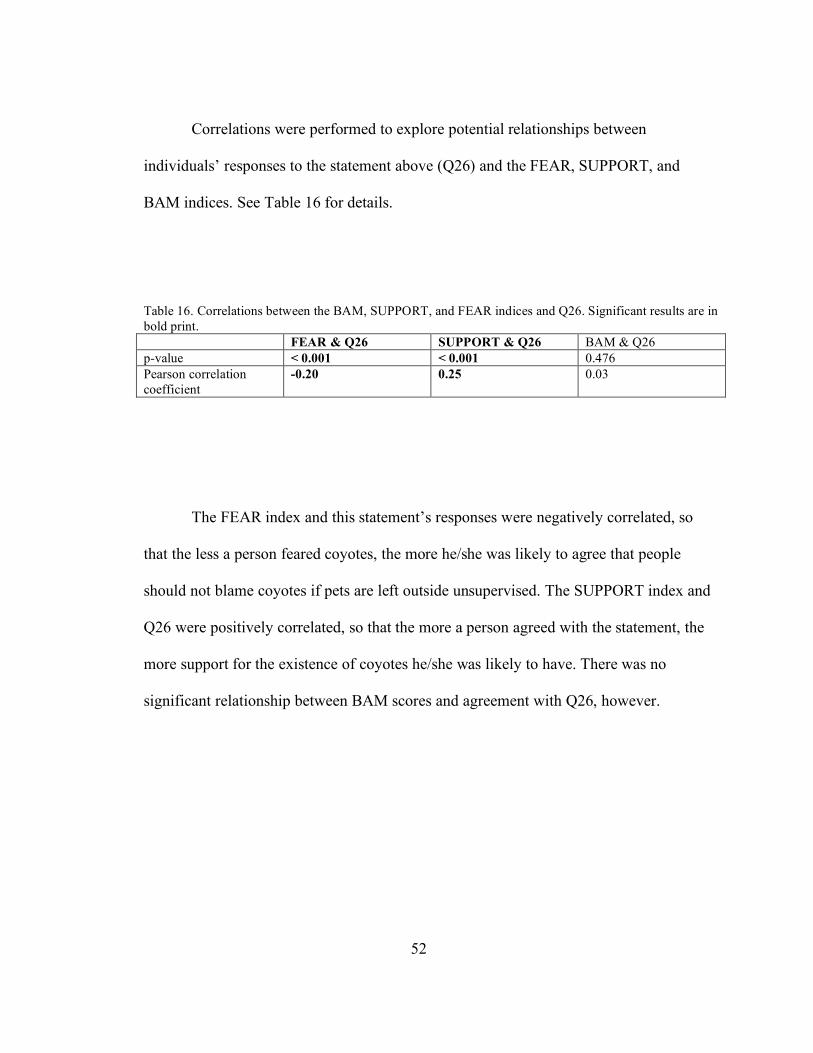
52
Correlations were performed to explore potential relationships between
individuals’ responses to the statement above (Q26) and the FEAR, SUPPORT, and
BAM indices. See Table 16 for details.
Table 16. Correlations between the BAM, SUPPORT, and FEAR indices and Q26. Significant results are in bold print. FEAR & Q26 SUPPORT & Q26 BAM & Q26 p-value < 0.001 < 0.001 0.476 Pearson correlation coefficient
-0.20 0.25 0.03
The FEAR index and this statement’s responses were negatively correlated, so
that the less a person feared coyotes, the more he/she was likely to agree that people
should not blame coyotes if pets are left outside unsupervised. The SUPPORT index and
Q26 were positively correlated, so that the more a person agreed with the statement, the
more support for the existence of coyotes he/she was likely to have. There was no
significant relationship between BAM scores and agreement with Q26, however.

53
Media
Only 13.7% of respondents had seen or heard a media story about coyotes in the
year prior to the administration of the survey. See Table 17 for the details on the type of
media utilized.
Table 17. With what types of media respondents saw or heard stories about coyotes. Percentages are in valid/actual format. Percentage of respondents who
saw/heard a story about coyotes N
Newspaper 5.2 / 5.2 762 Television 8.5 / 8.5 761 Radio 1.6 / 1.6 761 Internet 1.6 / 1.6 761 Other 3.7 / 3.6 761
Having heard or seen a media report about coyotes did not seem to have a
significant impact on respondents’ attitudes towards coyotes. Chi-square tests found no
relationship between whether respondents had seen or heard a media story and their level
of support for coyotes in the D.C. metropolitan area (p = 0.441) or how much
respondents liked or disliked coyotes (p = 0.652). Likewise, an independent-samples t-
test found no significant difference between the FEAR scores for those who had seen or
heard a media story versus those who had not (p = 0.514).
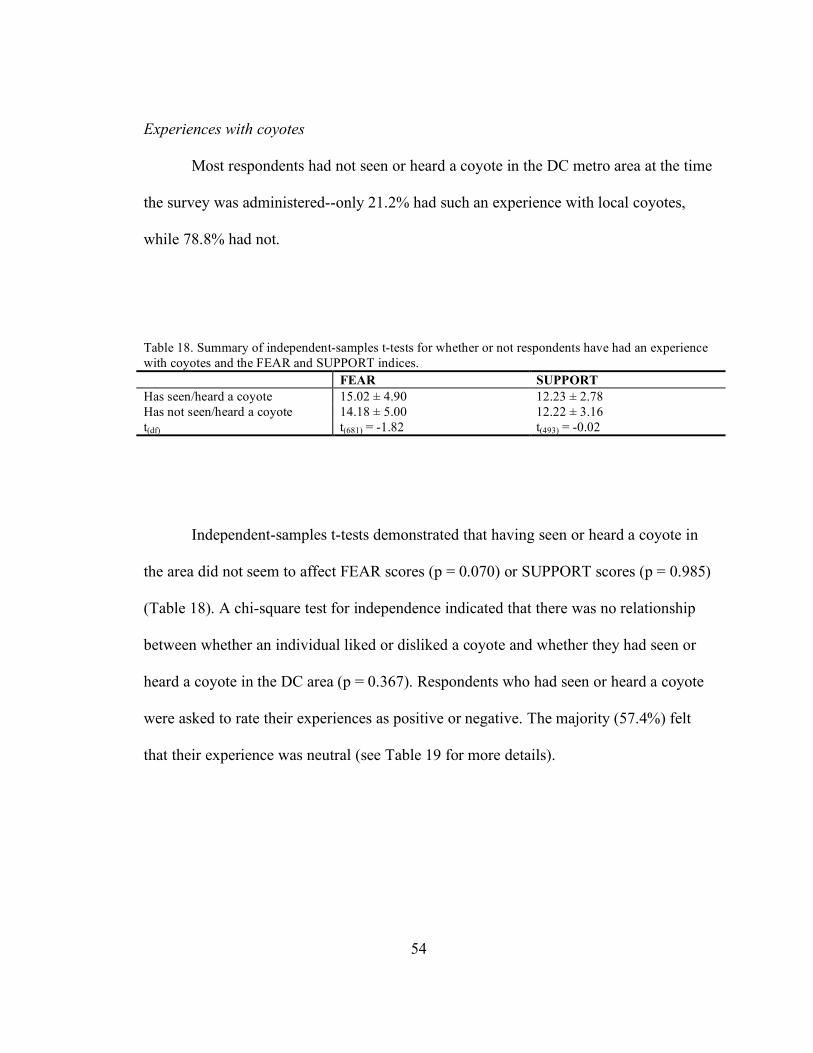
54
Experiences with coyotes
Most respondents had not seen or heard a coyote in the DC metro area at the time
the survey was administered--only 21.2% had such an experience with local coyotes,
while 78.8% had not.
Table 18. Summary of independent-samples t-tests for whether or not respondents have had an experience with coyotes and the FEAR and SUPPORT indices. FEAR SUPPORT Has seen/heard a coyote 15.02 ± 4.90 12.23 ± 2.78 Has not seen/heard a coyote 14.18 ± 5.00 12.22 ± 3.16 t(df) t(681) = -1.82 t(493) = -0.02
Independent-samples t-tests demonstrated that having seen or heard a coyote in
the area did not seem to affect FEAR scores (p = 0.070) or SUPPORT scores (p = 0.985)
(Table 18). A chi-square test for independence indicated that there was no relationship
between whether an individual liked or disliked a coyote and whether they had seen or
heard a coyote in the DC area (p = 0.367). Respondents who had seen or heard a coyote
were asked to rate their experiences as positive or negative. The majority (57.4%) felt
that their experience was neutral (see Table 19 for more details).

55
Table 19. How respondents who have seen or heard a coyote rate their experience. Percents are in valid/actual form. N = 756 Respondents who have seen or
heard a coyote Very Positive 9.7/9.3 Positive 20.0/19.3 Neither positive nor negative 57.4/55.3 Negative 7.1/6.8 Very negative 5.8/5.6
The more a person supported the existence of coyotes in the D.C. area, the higher
they were likely to rate the experience of having seen or heard a coyote; however, there
were no correlations between ratings of experiences (either seeing or hearing coyotes)
and the FEAR or BAM indices (see Table 20).
Table 20. Pearson product-moment correlations between ratings of experiences with coyotes and the BAM, FEAR, and SUPPORT indices. Significant findings are in bold print. FEAR BAM SUPPORT p-value 0.11 0.971 < 0.001 Pearson correlation coefficient
-0.06 0.00 0.19
Most respondents (90.0%) had not changed their behavior due to the presence of
coyotes near their homes (i.e. by feeding pets inside, securing garbage, building fences,
etc.). The less an individual feared coyotes, the lower the chance that they would have
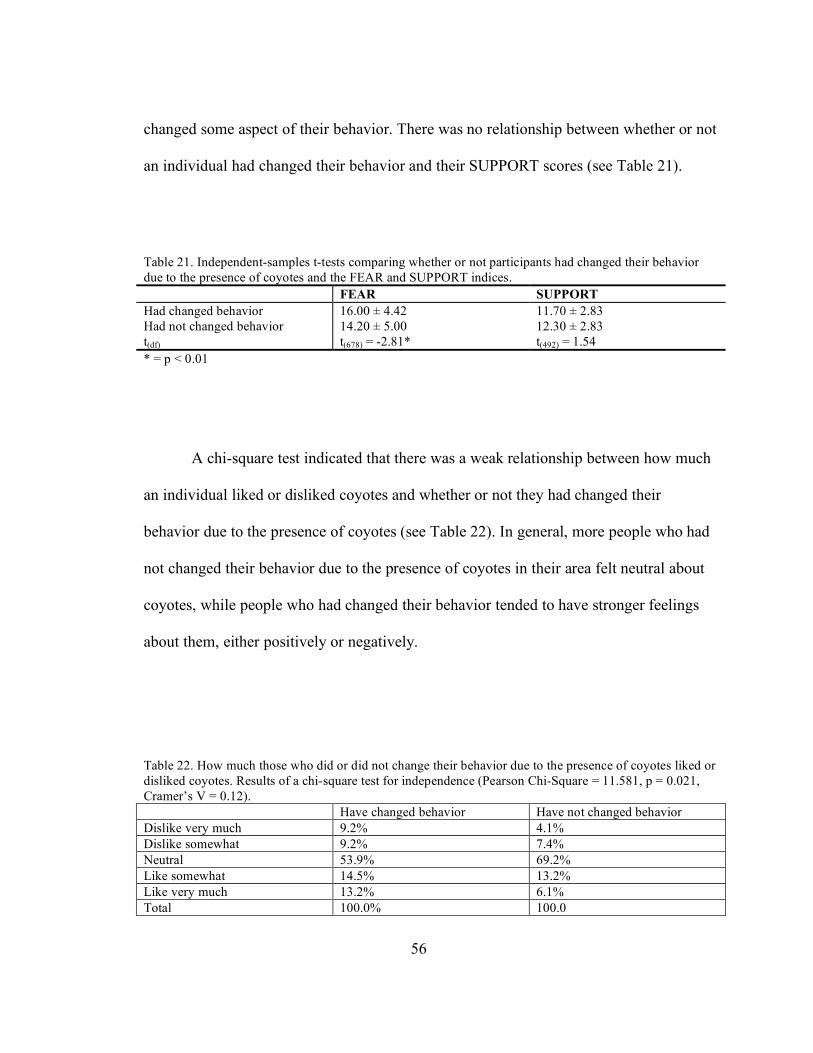
56
changed some aspect of their behavior. There was no relationship between whether or not
an individual had changed their behavior and their SUPPORT scores (see Table 21).
Table 21. Independent-samples t-tests comparing whether or not participants had changed their behavior due to the presence of coyotes and the FEAR and SUPPORT indices. FEAR SUPPORT Had changed behavior 16.00 ± 4.42 11.70 ± 2.83 Had not changed behavior 14.20 ± 5.00 12.30 ± 2.83 t(df) t(678) = -2.81* t(492) = 1.54 * = p < 0.01
A chi-square test indicated that there was a weak relationship between how much
an individual liked or disliked coyotes and whether or not they had changed their
behavior due to the presence of coyotes (see Table 22). In general, more people who had
not changed their behavior due to the presence of coyotes in their area felt neutral about
coyotes, while people who had changed their behavior tended to have stronger feelings
about them, either positively or negatively.
Table 22. How much those who did or did not change their behavior due to the presence of coyotes liked or disliked coyotes. Results of a chi-square test for independence (Pearson Chi-Square = 11.581, p = 0.021, Cramer’s V = 0.12). Have changed behavior Have not changed behavior Dislike very much 9.2% 4.1% Dislike somewhat 9.2% 7.4% Neutral 53.9% 69.2% Like somewhat 14.5% 13.2% Like very much 13.2% 6.1% Total 100.0% 100.0

57
Ninety-three percent of respondents had no experience of either a dog or cat being
attacked by a coyote (either their own pet or the pet of someone they know). Of the
remaining 7%, some attacks had been witnessed or there was other conclusive evidence
that a coyote was responsible, but in other cases, respondents assumed that a coyote was
the cause for the disappearance of a pet although there was no evidence. However, for the
purposes of this study, the belief that a coyote was involved is more important than the
actual facts of the case.
Independent-samples t-tests demonstrated that having knowledge of an attack on a
pet did not seem to affect respondents’ SUPPORT scores (p = 0.997) or FEAR scores (p
= 0.778) (see Table 23 for details).
Table 23. Results of independent-samples t-tests comparing knowledge of coyote attacks on pets and the SUPPORT and FEAR indices. SUPPORT FEAR Had knowledge of a pet attack 12.22 ± 3.42 14.20 ± 5.02 Did not have knowledge of a pet attack
12.22 ± 2.83 14.38 ± 5.00
t(df) t(491) = 0.00 t(680) = 0.282
A 2x5 chi-square test indicated that the relationship between having knowledge of
a coyote attack on a pet and how much that person likes or dislikes coyotes was

58
significant (p < 0.001). Fewer respondents who knew of a pet attack felt neutrally
towards coyotes, and more people who had knowledge of such an attack disliked coyotes
than those who did not know of a pet attack (see Table 24).
Table 24. The relationship between knowledge of a pet attack by a coyote and how much the respondents liked or disliked coyotes. Results of a chi-square test for independence (Pearson Chi-Square = 21.235, p < 0.001, Cramer’s V = 0.20). Have knowledge of a pet attack Have no knowledge of a pet
attack Dislike very much 15.1% 3.9% Dislike somewhat 5.7% 7.6% Neutral 54.7% 68.6% Like somewhat 9.4% 13.7% Like very much 15.1% 6.3% Total 100.0% 100.1%
Gender
Based on a chi-square test, there was a significant relationship between the gender
of the respondent and how much they liked or disliked coyotes. In general, men tended to
like coyotes more than women (see Table 25).

59
Table 25. The relationship between gender and how much the respondents liked or disliked coyotes. Results of a Chi-square test for independence (Pearson Chi-Square = 17.449, p = 0.002, Cramer’s V = 0.20). Female Male Dislike very much 5.7% 2.9% Dislike somewhat 9.3% 4.3% Neutral 68.6% 66.3% Like somewhat 10.9% 17.4% Like very much 5.5% 9.1% Total 100.0% 100.0%
Similarly, men tended to support the presence of coyotes in the area more than
women, with a chi-square test demonstrating a significant relationship between these two
variables (see Table 26).
Table 26. The relationship between gender and how much the respondents supported the presence of coyotes in the D.C. metro area. Results of a Chi-Square test for independence. (Pearson Chi-Square = 12.076, , p = 0.007, Cramer’s V = 0.13) Female Male Very much 9.6% 16.5% Somewhat 39.6% 43.5% Not very much 44.4% 35.6% Coyotes should be eliminated from the DC metro area
6.3% 4.3%
Totals 99.9% 99.9%

60
Results of Messaging Section
The final section of the survey asked part participants to rate how certain pieces of
information made them feel towards coyotes and explored the overall effect that different
categories of facts (ecological, behavioral, human cultural, or images) had on attitudes
towards coyotes in an attempt to find out categories could be used most effectively in
programs promoting coexistence with coyotes.
Overall effect of messaging
After being presented with a sample of information about coyotes, respondents
were asked to answer some of the same questions that they were asked in earlier sections
of the survey to create a pre/post-test design. Paired-samples t-tests were conducted to
determine the possible overall effect of all the categories of messages combined. For
every post-test attitudinal question, there was a significant difference pre- and post-test,
with support for coyotes increasing from pre-test to post-test (see Table 27).
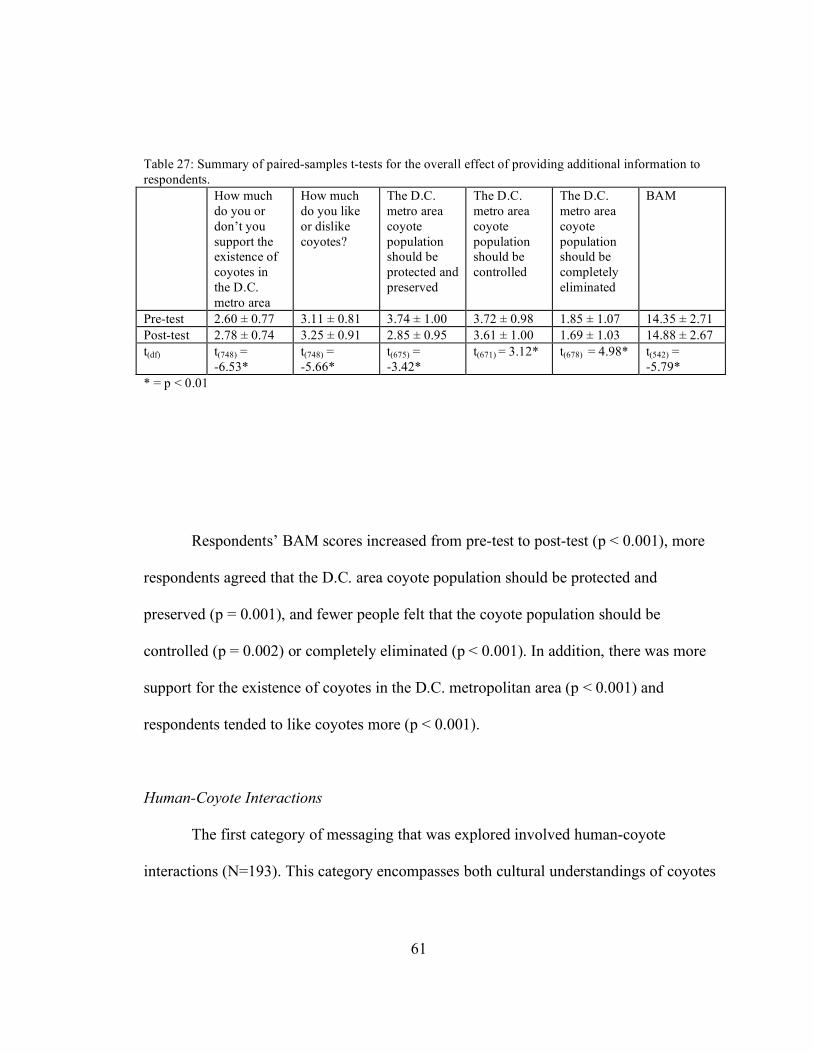
61
Table 27: Summary of paired-samples t-tests for the overall effect of providing additional information to respondents. How much
do you or don’t you support the existence of coyotes in the D.C. metro area
How much do you like or dislike coyotes?
The D.C. metro area coyote population should be protected and preserved
The D.C. metro area coyote population should be controlled
The D.C. metro area coyote population should be completely eliminated
BAM
Pre-test 2.60 ± 0.77 3.11 ± 0.81 3.74 ± 1.00 3.72 ± 0.98 1.85 ± 1.07 14.35 ± 2.71 Post-test 2.78 ± 0.74 3.25 ± 0.91 2.85 ± 0.95 3.61 ± 1.00 1.69 ± 1.03 14.88 ± 2.67 t(df) t(748) =
-6.53* t(748) = -5.66*
t(675) = -3.42*
t(671) = 3.12* t(678) = 4.98* t(542) = -5.79*
* = p < 0.01
Respondents’ BAM scores increased from pre-test to post-test (p < 0.001), more
respondents agreed that the D.C. area coyote population should be protected and
preserved (p = 0.001), and fewer people felt that the coyote population should be
controlled (p = 0.002) or completely eliminated (p < 0.001). In addition, there was more
support for the existence of coyotes in the D.C. metropolitan area (p < 0.001) and
respondents tended to like coyotes more (p < 0.001).
Human-Coyote Interactions
The first category of messaging that was explored involved human-coyote
interactions (N=193). This category encompasses both cultural understandings of coyotes

62
as well as how humans have behaved towards coyotes. The results of the paired-samples
t-tests run for this form are summarized in Table 28.
Table 28. Summary of paired-samples t-tests for the human-coyote interactions form. How much
do you or don’t you support the existence of coyotes in the D.C. metro area
How much do you like or dislike coyotes?
The D.C. metro area coyote population should be protected and preserved
The D.C. metro area coyote population should be controlled
The D.C. metro area coyote population should be completely eliminated
BAM
Pre-test 2.67 ± 0.78 3.10 ± 0.79 3.78 ± 0.99 3.68 ± 0.98 1.85 ± 1.12 14.25 ± 2.88 Post-test 2.77 ± 0.75 3.21 ± 0.91 3.85 ± 0.91 3.59 ± 1.10 1.64 ± 0.98 14.89 ± 2.73 t(df) t(187) =
-1.76 t(186) = -2.14* t(171) =
-0.97 t(169) = 1.31 t(169) =
3.12** t(137) = -3.43**
* = p < .05; ** = p < .01
Respondents tended to like coyotes more post-test (p = 0.034), had higher degrees
of BAM (p = 0.001), and disagreed more that the D.C. coyote population should be
eliminated (p = 0.002).
Table 29 describes how respondents felt about specific statements. Most
statements seemed to elicit a neutral response from participants. Statements viewed
positively included: “the Navajo word for coyote can be translated as ‘God’s Dog’”; “in
the tradition of the Miwok peoples, coyote, along with the help of the silver fox, created
the world”; and “coyotes were associated with the gods of dance and music in early
Mesoamerican cultures.” On the other hand, many participants viewed the statements that
described human attempts to kill coyotes negatively.

63
Table 29. Participants’ responses to cultural statements. Percents are in valid / actual format. Very
Positive Somewhat Positive
Neutral Somewhat Negative
Very Negative
N
One study stated that human and coyote coexistence occurred every day, but coyotes only make the news when a conflict occurs
12.1 / 11.9 27.4 / 26.9 38.4 / 37.8
15.8 / 15.5 6.3 / 6.2 190
The Navajo word for coyote can be translated as “God’s Dog”
21.6 / 21.2 32.1 / 31.6 43.2 / 42.5
2.6 / 2.6 0.5 / 0.5 190
The word “coyote” comes from the Aztec coyotyl, meaning trickster
3.7 / 3.6 16.3 / 16.1
46.3 / 45.6
31.1 / 30.6 2.6 / 2.6 190
The scientific name for coyotes, Canis latrans, is Latin for “barking dog”
3.2 / 3.1 15.3 / 15.0 68.3 / 66.8
12.2 / 11.9 1.1 / 1.0 189
In the tradition of the Miwok peoples, coyote, with the help of the silver fox, created the world
10.1 / 9.8 25.4 / 24.9 57.1 / 56.0
4.2 / 4.1 3.2 / 3.1 189
The Federal government spends three times the amount of money that ranchers lose due to predation even though predation accounts for the fewest livestock losses). Most of the money goes towards lethal predator control programs
3.2 / 3.1 10.6 / 10.4 48.1 / 47.2
27.0 / 26.4 11.1 / 10.9
189
Coyotes were associated with the gods of dance and music in early Mesoamerican cultures
12.2 / 11.9 34.4 / 33.7 49.2 / 48.2
2.6 / 2.6 1.6 / 1.6 189
One anthropologist assigned the coyote the role of mediator in North American mythology
10.6 / 10.4 31.9 / 31.1 51.6 / 50.3
3.7 / 3.6 2.1 / 2.1 188
Between 1916 and 1999, the Federal government killed nearly 6 million coyotes, almost 2 million since 1976.
6.9 / 6.7 9.6 / 9.3 27.7 / 26.9
28.7 / 28.0 27.1 / 26.4
188
The Federal government’s predator control program uses many inhumane methods of killing coyotes, including aerial gunning, traps, and poisons, amongst other methods
6.3 / 6.2 9.5 / 9.3 29.1 / 28.5
19.0 / 18.7 36.0 / 35.2
189

64
Behavior Statements
Behavioral statements about coyotes were also provided to a sample of the
respondents (N=199). Table 30 summarizes the paired-samples t-tests that were run for
this form.
Table 30. Summary of paired-samples t-tests for the Behavior form How much
do you or don’t you support the existence of coyotes in the D.C. metro area
How much do you like or dislike coyotes?
The D.C. metro area coyote population should be protected and preserved
The D.C. metro area coyote population should be controlled
The D.C. metro area coyote population should be completely eliminated
BAM
Pre-test 2.61 ± 0.78 3.14 ± 0.85 3.67 ± 1.02 3.62 ± 1.01 1.87 ± 0.99 14.31 ± 2.71 Post-test 2.86 ± 0.76 3.36 ± 0.93 3.85 ± 0.97 3.58 ± 0.98 1.66 ± 0.98 15.12 ± 2.55 t(df) t(192) =
-4.78* t(194) = -4.11* t(174) =
-3.19* t(172) = 0.65 t(173) = 3.51* t(144) =
-3.70* * = p < .01
There was a significant increase in support for the existence of coyotes in the D.C.
region (p < 0.001), and respondents liked coyotes significantly more (p < 0.001) post-test.
In addition, significantly more respondents felt that the coyote population should be
protected and preserved (p = 0.002) and significantly fewer people felt that the population
should be completely eliminated (p = 0.001). BAM scores also increased significantly
post-test (p < 0.001).

65
See Table 31 for details on how these individual statements influenced the
respondents’ perception of coyotes. Most of these statements caused respondents to feel
either positively or neutrally about coyotes. The three statements that provoked the most
negative attitudes towards coyotes were the three that refer to coyote attacks on people.
However, even in these cases, the majority of respondents answered either positively or
neutrally. One of these statements (“coyotes have only caused one human death; on the
other hand, domestic dogs killed 28 people in 2005 in the US”) had the most respondents
selecting “very positive.”
Other statements that people viewed positively included statements about coyotes
being monogamous, playful and social, including the fact that non-breeding members of
packs will help care for pups.
Table 31. Participants’ responses to behavioral statements. Percents are in valid / actual format. Very
Positive Somewhat Positive
Neutral Somewhat Negative
Very Negative
N
Coyotes engage in pair-bonding, are monogamous, and both sexes share in the care of young
34.2 / 33.7
28.1 / 27.6
36.2 / 35.7
1.5 / 1.5 0.0 / 0.0 196
Coyotes use visual, sound, touch, and smell signals in order to communicate, including eleven types of vocalizations
27.6 / 27.1
38.3 / 37.7
32.1 / 31.7
1.0 / 1.0 1.0 / 1.0 196
Coyotes are playful. Social play among coyotes includes cooperation, communication, and learning
35.2 / 34.7
33.2 / 32.7
28.1 / 27.6
2.0 / 2.0 1.5 / 1.5 196
Coyotes establish and maintain territories, using scent-marking, howling, and chasing to preserve boundaries. Coyotes rarely kill each other over territory.
23.0 / 22.6
37.2 / 36.7
32.1 / 31.7
6.1 / 6.0 1.5 / 1.5 196
In one scientific report, a coyote who had previously played with a golden retriever dog approached the dog while being walked by its owner, presumably for another positive interaction.
27.0 / 26.6
39.3 / 38.7
27.6 / 27.1
5.1 / 5.0 1.0 / 1.0 196
Coyote attacks on humans are very rare; the cause of the attacks can usually be
26.0 / 25.6
34.2 / 33.7
29.1 / 28.6
7.1 / 7.0 3.6 / 3.5 196
66
traced back to disease, intentional or unintentional feeding, or other human behavior. The only known human fatality due to a coyote was caused by human behavior.
29.7 / 29.1
30.8 / 30.2
29.2 / 28.6
7.2 / 7.0 3.1 / 3.0 195
Coyotes can live alone, as bonded pairs, or in family groups.
25.0 / 24.6
30.6 / 30.2
39.3 / 38.7
4.1 / 4.0 1.0 / 1.0 196
In coyote packs, non-breeding adults often help in the care of the pack’s pups; these pups are usually their younger siblings.
32.7 / 32.2
33.7 / 33.2
30.1 / 29.6
3.15 / 3.0 0.5 / 0.5 196
Coyotes have only caused one human death; on the other hand, domestic dogs killed 28 people in 2005, in the US.
37.8% 27.0% 26.0% 5.6% 3.6% 196
Images
Some respondents were provided with photographs of coyotes and asked how
these images made them feel about coyotes. Table 32 summarizes the paired-samples t-
tests for this form.

67
Table 32. Paired-samples t-tests for the images form. How much
do you or don’t you support the existence of coyotes in the D.C. metro area?
How much do you like or dislike coyotes?
The D.C. metro area coyote population should be protected and preserved
The D.C. metro area coyote population should be controlled
The D.C. metro area coyote population should be completely eliminated
BAM
Pre-test 2.55 ± 0.80 3.10 ± 0.86 3.71 ± 1.06 3.87 ± 1.00 1.79 ± 1.14 14.56 ± 2.68 Post-test 2. 76 ± 0.76 3.32 ± 0.86 3.77 ± 1.01 3.69 ± 1.00 1.69 ± 1.10 14.73 ± 2.90 t(df) t(185) =
-4.10* t(183) = -4.42* t(161) = -0.92 t(158) = 2.74* t(159) = 1.84 t(129) = -1.13
* = p < 0.01
Respondents supported the existence of coyotes significantly more (p < 0.001)
and significantly liked them more (p < 0.001) post-test. In addition, respondents
disagreed more strongly with the idea that local coyote population sizes should be
controlled post-test (p = 0.007).
Table 32 shows the responses participants had to various images of coyotes
(N=189). Most respondents viewed most images either neutrally or positively. However,
the image of a coyote howling was viewed negatively by many of the respondents.
Images that were viewed positively included a picture of one coyote licking another one’s
face, one of a coyote curled up, presumably asleep, and one of a coyote laying on a
human bed.

68
Table 33. Participants’ responses to images
Very positive
Somewhat positive
Neutral Somewhat negative
Very negative
N
8.6 / 8.5 16.0 / 15.9 32.6 / 32.3 31.6 /3 1.2 11.2 / 11.1 187
21.9 / 21.7 32.6 / 32.3 37.4 / 37.0 6.4 / 6.3 1.6 / 1.6 187
18.2 / 18.0 26.7 / 26.5 24.1 / 23.8 21.9 / 21.7 9.1 / 9.0 187
50.2.0 / 49.2
36.6 / 36.0 11.8 / 11.6 0.5 / 0.5 1.1 / 1.1 186
48.4 / 47.6 32.8 / 32.3 11.8 / 11.6 5.9 / 5.8 1.1 / 1.1 186
15.1 / 14.8 24.2 / 23.8 39.2 / 38.6 16.1 / 15.9 5.4 / 5.3 186
39.8 / 39.2 37.6 / 37.0 17.7 / 17.5 3.8 / 3.7 1.1 / 1.1 186

69
31.6 / 31.2 28.9 / 28.6 21.9 / 21.7 12.8 / 12.7 4.8 / 4.8 187
20.9 / 20.6 32.1 / 31.7 34.8 / 34.4 10.2 / 10.1 2.1 / 2.1 187
Ecology statements
The final type of form consisted of statements about coyote ecology (N=188). A
summary of the paired-samples t-tests run for the pre- and post-test questions can be
found in Table 34. Only two items showed a significant difference from pre-test to post-
test: respondents tended to show more support for coyotes post-test (p = 0.014) and
BAM scores tended to increase (p = 0.004).

70
Table 34. Summary of paired-samples t-tests for the ecology form. How much
do you or don’t you support the existence of coyotes in the D.C. metro area?
How much do you like or dislike coyotes?
The D.C. metro area coyote population should be protected and preserved
The D.C. metro area coyote population should be controlled
The D.C. metro area coyote population should be completely eliminated
BAM
Pre-test 2.57 ± 0.72 3.08 ± 0.76 3.81 ± 0.96 3.70 ± 0.94 1.86 ± 1.06 14.28 ± 2.56 Post-test 2.71 ± 0.69 3.11 ± 0.93 3.92 ± 0.92 3.57 ± 0.94 1.78 ± 1.08 14.76 ± 2.50 t(df) t(181) =
-2.49* t(182) = -0.56 t(166) = -1.83 t(169) = 1.71 t(174) = 1.42 t(129) =
-2.96** * = p < 0.05; ** = p < 0.01
See Table 35 for details about participants’ responses to specific ecological
statements. The most positively received statement seemed to be: “coyotes prey upon
rodents, and may control rodent populations.” The statement that appeared to be the
second most positively received was: “one study showed that coyotes in the Chicago area
rarely ate human-related food, preferring rodents, rabbits, and fruits.” Other statements
viewed positively included a statements about a study that showed that coyotes indirectly
increased native bird populations, that coyote populations tend to limit their own
population growth, and that rabies in coyotes is relatively rare.
The statement most negatively viewed described how removing coyotes from an
area does not reduce the overall population level in the long-term, as other coyotes will
move in and litter sizes will increase.

71
Table 35. Participants’ responses to ecological statements. Percentages are in valid/actual format. Very
positive Somewhat positive
Neutral Somewhat negative
Very negative
N
One study found that the presence of coyotes could indirectly increase local bird diversity, by decreasing the numbers of smaller predators that feed on birds.
13.0 / 12.8
38.6 / 37.8 44.0 / 43.1
3.3 / 3.2 1.1 / 1.1 184
Coyotes establish and maintain territories and therefore limit their own population growth.
16.8 / 16.5
42.7 / 42.0 36.2 / 35.6
3.8 / 3.7 0.5 / 0.5 185
Coyotes prey upon rodents, and may control rodent populations.
31.4 / 30.9
44.9 / 44.1 20.5 / 20.2
3.2 / 3.2 0.0 / 0.0 185
Removing coyotes will not reduce overall coyote populations in an area. If coyotes are removed, other coyotes will take over their territory and litter size and pup survival rates will increase to meet former population levels.
5.9 / 5.9
11.9 / 11.7 52.4 / 51.6
24.9 / 24.5
4.9 / 4.8 185
Humans, though land modification, make habitat that is very suitable for coyotes and one of their main pretty items, rodents.
9.7 / 9.6
26.5 / 26.1 49.7 / 48.9
12.4 / 12.2
1.6 / 1.6 185
Coyotes are close relatives of wolves, belonging to the same genus, Canis
11.9 / 11.7
20.0 / 19.7 51.9 / 51.1
14.1 / 13.8
2.2 / 2.1 185
One study showed that coyotes in the Chicago area rarely ate human-related food, preferring rodents, rabbits, and fruits
25.9 / 25.5
43.2 / 42.6 27.6 / 27.1
2.2 / 2.1 1.1 / 1.1 185
Some studies have shown that coyotes might be able to control Canada geese populations
16.2 / 16.0
29.2 / 28.7 45.4 / 44.7
8.1 / 8.0 1.1 / 1.1 185
Outbreaks of rabies in coyotes are rare; coyotes can actually provide a buffer between humans and rabies, by reducing the local population of foxes.
25.9 / 25.5
42.7 / 42.0 27.0 / 26.6
3.8 / 3.7 0.5 / 0.5 185
Coyotes are close relatives of dogs, belonging to the same genus, Canis.
16.8 / 16.5
28.3 / 27.7 51.6 / 50.5
3.3 / 3.2 0.0 / 0.0 184

72
Discussion
Attitudes
This project uncovered findings that will be of use to wildlife managers and
others concerned with reducing coyote-human conflicts. Awareness of coyotes tended to
be low in the study sample population. Perhaps because of this, most respondents had
neutral feelings towards and some level of support for the existence of coyotes in the
D.C. metropolitan area. Very few participants wanted to eliminate coyotes from the area.
Individuals who hold non-extreme attitudes about a species might be more open to
persuasive arguments than those with either positive or negative extreme attitudes
(Meadow et al. 2005). As negative feelings can be engendered through negative
encounters with animals (Bjerke et al. 2003), it is critical to reach D.C. metropolitan area
residents now with messages about the importance of coyotes in our ecosystem and
proactive messages to teach them how to reduce human-coyote conflict, before conflicts
increase.
Most of the sample population correctly answered some questions that indicated
they had some understanding of what it means and takes to live in an area with a coyote
population. They understood that attacks on humans were uncommon and that they
should not run away from a coyote if one is encountered. They also understood that

73
coyotes will kill cats on occasion, which is important – if residents do not know that this
could be a problem, they are unlikely to take steps (such as keeping unsupervised pets
inside, keeping dogs on leashes, and feeding pets inside) to protect pets. Augmenting
basic knowledge such as this can help prevent human-coyote conflicts and perhaps
increase tolerance for coyotes by preparing people for direct and indirect encounters with
coyotes.
On the other hand, most respondents had some basic misunderstandings about
coyotes. For example, the majority believed that coyotes were in danger of becoming
extinct. This might explain some of the support felt for coyotes by the respondents. It
might also demonstrate a lack of basic understanding of what endangered means –
because so few respondents had seen or heard a coyote, it is possible that some of them
took this to mean that the animals were rare. More research might uncover the reason
behind this misunderstanding. It bears mentioning that the findings in this project were
similar to those in a 1980 report, where about 60% of respondents answered the question:
“timber wolves, bald eagles and coyotes are all endangered species of animals”
incorrectly (Kellert & Berry 1980).
In addition, most respondents felt that male coyotes weighed on average 100
pounds, although coyotes are much smaller than this. It is possible that larger animals
engender more fear from respondents, and the author, personally, has at times decreased
fear of coyotes by explaining their average size to D.C. area residents; if this is the case,
this misunderstanding might be the cause for some of the fear noted in this study. It
would be interesting to explore this question in the future, as a statement addressing the

74
true average size of coyotes was not included in the messaging section of the survey
instrument.
Although most respondents understood that coyote attacks on people were rare,
and most respondents were not concerned with the potential risk of a face-to-face
encounter with a coyote, the potential for a coyote to attack a child was one of the
strongest concerns that people had about living near coyotes (the other was the potential
for coyotes to spread rabies). These findings might help those promoting coexistence
with coyotes to tailor their messages to the public, such as by providing information on
what children should do if they encounter a coyote (or even teaching children themselves
what to do, such as has been done in the aforementioned Vancouver program), the
likelihood of a coyote attacking a child, or more information about coyotes and rabies.
Most respondents, whether or not they owned pets, did not have much concern
about the potential for either dogs or cats to be attacked by a coyote – both pet owners
and non-pet owners seemed to agree that the risk was much greater for a dog or a cat to
be hit by a moving vehicle. In addition, the majority of both pet owners and non-pet
owners felt that coyotes should not be blamed for pet predations when the dog or cat was
left outside unsupervised, an encouraging finding that could be built upon with outreach
materials that stress the importance of pet owner responsibility. It should be noted that
the less a respondent feared coyotes, the more likely they were to agree that coyotes
should not be blamed in such situations, and the more a person disliked coyotes, the more
likely they were to believe that coyotes should be blamed in such situations.

75
Although there were no differences in average SUPPORT scores for pet owners
and non-pet owners, non-pet owners were more likely to have higher FEAR scores.
Overall, pet owners seemed to have more extreme attitudes towards coyotes, either
negatively or positively, than non-pet owners, perhaps because pet owners were in some
cases more likely to like all animals and in other cases were more concerned about
potential threats to their pets. Because of this, even though pet owners did not seem to
have much fear of coyotes attacking their cats or dogs, it might be useful to target pet
owners as a specific group in terms of outreach programs and materials, especially
regarding the steps they need to take to keep their dogs and cats safe. Understanding the
reasons why pet owners seemed to have more extreme feelings would be an important
avenue for future research.
Although the media has been demonstrated to have an impact on the public’s
perception of wildlife (Gore et al. 2005), this was found to not be the case in the sample
population. It might be that the sample population, university undergraduate students,
does not listen to or read local media on a regular basis; the participants’ level of media
consumption was not determined. Further research into the impact of media stories on the
larger public should be undertaken, with surveys targeting the mature, working adult
population. Wildlife managers and others concerned with decreasing human-coyote
conflict might also want to seek other outreach opportunities in addition to the media that
might be more accessible to the public.
Having seen or heard a coyote in the D.C. metropolitan area did not seem to affect
how much a person feared coyotes, supported their existence, or how much they liked or

76
disliked them. Most respondents who had seen or heard a coyote in the area rated their
experiences as neutral. Conversely, in another study people who had seen a large predator
(in this case a mountain lion) in the wild were less likely to agree with lethal predator
control (Casey et al. 2005), perhaps demonstrating increased support for their existence.
Not surprisingly, people who feared coyotes less and had higher SUPPORT scores were
more likely to rate their experiences positively.
The vast majority of respondents’ households had not changed their behavior due
to the presence of coyotes near their home. Those who had changed their behavior,
however, were more likely to have stronger feelings about coyotes, either positively or
negatively, than those who had not changed their behavior. This suggests that people
change their behavior due to the presence of coyotes either because they seek to reduce
the potential for human-coyote conflict, perhaps out of support for the idea of coexisting
with coyotes, or out of fear or dislike of coyotes (and, in fact, it was also found that the
more a person feared coyotes the more likely it was that they had changed their behavior
due to the presence of coyotes).
Few respondents had knowledge of a coyote attack on a dog or cat, and having
knowledge of such an attack seemed to have no effect on respondents’ FEAR and
SUPPORT scores. On the other hand, those who had knowledge of such an attack
appeared to have stronger feelings towards coyotes, either positively or negatively.
Therefore, it might be harder to influence people who already have knowledge of pet
predation. Exploring why knowledge of a pet attack prompts extreme feelings could
make outreach efforts stronger. Again, since people with neutral attitudes are probably

77
most open to new information about coyotes, it is important to have proactive campaigns
before rates of conflict increase.
Gender played an important role in predicting attitudes towards coyotes. Men
were more likely to support the presence of coyotes in the area, and tended to like
coyotes more than women. At the same time, women feared coyotes more than men. This
somewhat contradicts findings in other studies. For example, in one study women were
found to feel more positively about wolves than men (Williams et al. 2002). In another,
women felt more strongly that mountain lions should be protected and disagreed more
that they should be lethally controlled in areas dominated by humans than men (Casey et
al. 2005). The differences might be explained by how respondents categorize species –
wolves and mountain lions might be considered charismatic megafauna, while coyotes
might be considered pests. This would be an interesting avenue for further study.
Although, as will be seen below, the BAM scale was useful in determining what
types of messages most influenced attitudes towards coyotes, it provided little additional
information regarding the attitudes of the sample population. This might be because the
BAM index in this project was less internally reliable than it has been in other projects
(most notably Hill’s 1995 study, which had a Chronbach’s alpha of 0.90), perhaps
because other projects have focused on animals as a whole, and not specific species.
There are other measurements of BAM that have been developed by various authors –
perhaps one of these might have been more useful in this project, as BAM has been found
to be a useful tool for uncovering people’s attitudes towards animal use (animal use can

78
be broadly defined to include management techniques) in other studies (Driscoll 1992;
Driscoll 1995; Eddy et al. 1993; Hills 1995; Knight et al. 2004).
Messaging
When additional information (regardless of the type) was given to participants,
there was an increase in support for the existence of coyotes, in levels of BAM, and an
increase in the degree to which people liked coyotes. There was also a corresponding
decrease in the belief that coyotes should be eliminated from the D.C. metropolitan area.
Therefore, providing information to people seemed to influence attitudes at least in the
short term. It appears, then, that by carefully selecting text and images, those who are
producing outreach materials might be able to positively influence attitudes.
Statements referring to human-coyote interactions and relations seemed to
influence three out of six post-test measurements. Statements describing coyotes’ roles in
the mythologies of various cultures seemed to be positively viewed by respondents,
especially the meaning of the Navajo word for coyotes, which can be translated as
“God’s dog.” Inclusion of such information in outreach materials might prove useful,
perhaps as a counter-point to the common view that coyotes are considered a pest species
by demonstrating that other cultures hold or held them in high regard.
Although one might think that statements describing Euro-American cultures’
attempts to eradicate coyotes would solicit sympathy or empathy from respondents
towards coyotes, this did not prove to be the case as these statements were viewed
negatively. It is possible that respondents misunderstood the instructions that they were

79
being asked how these statements made them feel about coyotes, not how they felt in
general about the statement or about the government’s actions. However, outreach
materials might be more effective if they focus on positive aspects of coyotes and leave
out the history that coyotes have had with Euro-American culture. Perhaps respondents
believe that there must be a good reason for the government’s attempts to eradicate
coyotes, and therefore these actions are justified and coyotes have little value. Further
investigation into this question would prove useful.
Statements about coyote behavior seemed to be the most effective in influencing
attitudes out of the four categories, as five out of the six post-test measurements had
different results that demonstrated more positive attitudes towards coyotes. Explaining
the rarity of the coyote attacks on people was viewed positively by most of the sample
population, and should be included in outreach materials in order to give a realistic
impression of the risk of living near coyotes.
Statements that discussed coyote behavior that parallels ideal human behavior
(i.e., that they’re social, monogamous, playful and sometimes help raise pups that are not
their own) were also very popular. Perhaps these statements tend to elicit empathy for
coyotes. “Educating for empathy,” in Hill’s (1995, p. 140) words, can be an effective way
to encourage positive attitudes and foster coexistence with wildlife. Educating for
empathy does not mean anthropomorphizing animals, however. Rather, it means stressing
aspects of ecology that focus on the mental experiences of animals – namely animal
behavior and social structures (Hills 1995). In fact, the BAM scores of respondents
tended to be higher post-test than pre-test.
80
In the form where images of coyotes were presented to participants, changes
occurred in three out of six post-test measurements, with all changes demonstrating
increased positive attitudes towards coyotes. Coyotes are often pictured howling, in both
photographs and other visual art forms. However, this traditional representation, at least
in photographs, proved to be unpopular with the sample population. Instead, images that
showed coyotes in active, positive social behaviors (i.e., licking another coyote’s face as
opposed to three coyotes walking together) and that showed coyotes in passive positions
(such as being asleep) were viewed positively by most respondents.
One image showed a coyote that had been raised as a pet and is now living in a
coyote rescue facility. This particular image showed a coyote lying on a human bed, and
was viewed positively by most respondents. This might demonstrate the necessity for
wildlife professionals to educate the public that coyotes are not domestic animals and that
they should not be treated as such, either by attempting to tame pups to keep as pets or by
simply providing them with food, which can lead to human-coyote conflict.
Statements about coyote ecology seemed to have the least impact on attitudes,
with changes in only two out of six post-test measurements. Statements that demonstrated
that coyotes had a certain amount of utility for people (i.e., coyotes eat rodents and
coyotes might indirectly increase native bird populations in some areas) proved to be
viewed positively by respondents. The rodent statement proved especially popular,
perhaps demonstrating humans’ negative feelings towards rodents. In addition, a
statement that described a coyote population that did not directly rely on humans for food

81
was viewed positively, perhaps because it showed coyotes as self-supporting wild
animals, instead of “pests” that rely on human property.

82
Conclusion
The Washington, D.C. metropolitan area is in a rather unique situation at the
moment. The level of awareness of coyotes appears to be rather low, and although there
have been some conflicts reported in the media, the rate of conflict also appears to be
low. As such, it is likely that most residents in the area hold neutral attitudes towards
coyotes. This provides an opportunity for wildlife managers and others concerned with
reducing human-coyote conflict (such as non-profit environmental, wildlife, or animal
protection organizations) to reach the public before strong negative attitudes are formed
about coyotes. Increasing positive attitudes about coyotes and teaching people how to
live with coyotes at this early stage could prove highly successful in reducing the
possibility of human-wildlife conflict, decreasing the demand for lethal control methods,
and increasing awareness that changing human behavior is the most effective means of
reducing human-coyote conflict.
Although in-depth, comprehensive education programs provide the best chance of
influencing attitudes towards coyotes (Clark et al. 2001; Hungerford & Volk 1990;
Meadow et al. 2005; Taylor 2004), such programs are not practical in many situations.
Often, non-profit organizations and wildlife managers must rely heavily on outreach
materials, only occasionally supplemented by more in-depth programs. This project has

83
demonstrated that by carefully choosing what to include in such materials, organizations
and wildlife managers can engender positive attitudes towards coyotes, and therefore
perhaps increase tolerance for their presence and a willingness to change human
behavior.

84
Appendix Survey Instrument
Survey of Attitudes Towards Coyotes in the DC Metro Area
Q1. Please indicate how often you participate in the following wildlife-related activities on a scale from 1 to 5, where 1 is never and 5 is very often.
Reading books and articles about nature…. 1 2 3 4 5 Watching birds outside my home.. 1 2 3 4 5 Watching nature programs on TV… 1 2 3 4 5 Going hunting….. 1 2 3 4 5 Going fishing…… 1 2 3 4 5 Leaving home to watch birds or other wildlife…. 1 2 3 4 5 Feeding birds…… 1 2 3 4 5 Feeding wildlife other than birds… 1 2 3 4 5 Going to a zoo or aquarium….. 1 2 3 4 5
Knowledge about Coyotes Q2. We now would like to ask you some questions about coyotes. Please indicate whether you believe the following statements about coyotes are correct or incorrect. Correct Incorrect Coyotes are carnivores that eat only meat………. 0 1 Coyotes always travel in packs................................ 0 1

85
Coyote attacks on humans are not common.............. 0 1 Adult male coyotes weigh on average 100 lbs........ 0 1 Coyotes are in danger of becoming extinct.............. 0 1 Coyotes will kill cats on occasion…………………… 0 1 If you encounter a coyote, you should run away from it... 0 1
Attitudes Towards Coyotes Q3. Are you aware that there are coyotes in the DC metro area? [ ] yes [ ] no Q4. How much do you or don’t you support the coyote’s existence in the DC metro area? [ ] very much [ ] somewhat [ ] not very much [ ] coyotes should be eliminated or driven out of the DC metro area Q5. In the past year, have you seen or heard a media story about coyotes in the DC metro area? [ ] yes (Continue) [ ] no (Go to Q6) If yes, where did you see the stories (check all that apply)? [ ] newspaper [ ] TV news [ ] radio [ ] internet [ ] other Q6. How much do you like or dislike coyotes? [ ] dislike very much [ ] dislike somewhat [ ] neutral [ ] like somewhat [ ] like very much Q7. Please indicate the extent to which you believe coyotes have the following characteristics on a scale from 0 to 5, where 0 is "strongly agree" and 5 is "strongly disagree."

86
Coyotes are aware of what is happening to them….. 1 2 3 4 5 DK Coyotes are capable of experiencing a range of feelings and emotions (e.g. pain, fear, contentment, maternal affection)...... 1 2 3 4 5 DK Coyotes are able to think, to some extent, to solve problems and to make decisions about what to do………. 1 2 3 4 5 DK
Coyotes are more like computer programs, i.e. mechanically responding to instinctive urges without awareness of what they are doing…… 1 2 3 4 5 DK Q8. Please indicate the extent to which you agree or disagree with each of the following statements on a scale where 1 is strongly agree and 5 is strongly disagree. To me, coyotes symbolize the beauty and wonder of nature in the DC metro area.. 1 2 3 4 5 DK The current DC metro area coyote population is a problem.. 1 2 3 4 5 DK Coyotes are a positive addition to our community… 1 2 3 4 5 DK Coyotes don’t belong in the DC metro area… 1 2 3 4 5 DK Q9. Please indicate how concerned you are about the following. Potential risk to myself in a face-to-face encounter with a coyote......................................... 1 2 3 4 DK Coyotes attacking dogs.....…......... 1 2 3 4 DK Coyotes attacking cats……………. 1 2 3 4 DK Having coyotes near my home....... 1 2 3 4 DK

87
Coyotes spreading rabies................ 1 2 3 4 DK Coyotes attacking children................. 1 2 3 4 DK
Experiences with Coyotes Q10. How often have you seen a coyote in the DC metro area? [ ] never [ ] a few times [ ] about once a month [ ] two or three times a month [ ] about once a week [ ] more than once a week Q11. Have you ever heard a coyote howl in the DC metro area? [ ] never [ ] a few times [ ] about once a month [ ] two or three times a month [ ] about once a week [ ] more than once a week Q12. Overall, would you rate your experiences seeing and/or hearing coyotes as positive or negative? [ ] very positive [ ] positive [ ] neither positive nor negative [ ] negative [ ] very negative [ ] no experiences with coyote Q13. How often have you had problems with coyotes in your residential area (either permanent home or school housing)? [ ] never [ ] seldom [ ] often [ ] very often [ ] don’t know Q14. Have you started to feed or otherwise keep pets inside in order to protect them from coyotes? [ ] yes [ ] no Q15. Have you done anything to keep coyotes off of your property such as securing garbage, building fences, or installing lights? [ ] yes [ ] no

88
Q16. Do you or your household have a dog in the DC metro area? [ ] yes (Continue) [ ] no (Please continue to Q19) Q17. How often is your dog outside without supervision? [ ] never [ ] seldom [ ] often [ ] very often Q18. How often do you feed your dog its main meal(s) outside? [ ] never [ ] seldom [ ] often [ ] very often Q19. Please indicate how concerned you are that the following could happen to dogs that are outside unsupervised or are off-leash in the DC metro area. Not A Minor Moderate Major Don’t Concern Concern Concern Concern Know Fighting with other dogs........ 1 2 3 4 DK Being hit by a car or truck...... 1 2 3 4 DK Being attacked by a coyote.. 1 2 3 4 DK Being stolen for dog fighting… 1 2 3 4 DK Q20. Do you or your household have a cat in the DC metro area? [ ] yes (Continue) [ ] no (Go to Question 23). Q21. How often is your cat outside without supervision? [ ] never [ ] seldom [ ] often [ ] very often Q22. How often do you feed your cat its main meal(s) outside? [ ] never [ ] seldom [ ] often [ ] very often

89
Q23. Please indicate how concerned you are that the following could happen to cats that are unsupervised and off-leash in the DC metro area. Not A Minor Moderate Major Don’t Concern Concern Concern Concern Know Being attacked by dogs....... 1 2 3 4 DK Being hit by a car or truck...... 1 2 3 4 DK Being attacked by a coyote.. 1 2 3 4 DK Being attacked by great horned owls or hawks.......…. 1 2 3 4 DK Q24. Have you or anyone you know ever had a dog or cat attacked by a coyote (check as many as apply.) [ ] I have had a dog attacked by a coyote (Continue) [ ] I have had a cat attacked by a coyote (Continue) [ ] Someone I know has had a dog attacked by a coyote (Continue) [ ] Someone I know has had a cat attacked by a coyote (Continue) [ ] Neither I nor anyone I know has had a cat or dog attacked by a coyote (Go To Q26) Q25. If you or someone you know had a dog or cat attacked by a coyote, please tell us about the most recent attack. a. What kind of pet was attacked? [ ]cat [ ]dog b. Whose dog or cat was it? [ ]mine or my household’s [ ]someone else whom I know c. Why do you believe a coyote was responsible for the attack? [ ] witness to attack [ ] marks on body indicated coyote attack [ ] couldn’t tell from body, assumed coyote [ ] body never found, assumed coyote [ ] other ________________________ d. When was this attack? [ ] 2006 [ ] 2005 [ ] 2004 [ ] 2003 [ ] 2002 or earlier

90
Q26. Please tell us whether you strongly agree, somewhat agree, somewhat disagree, or strongly disagree with the following statement on a five-point scale where 1 is strongly agree and five is strongly disagree. If people allow their pets outside unsupervised, they should not blame coyotes for pets that are attacked.. 1 2 3 4 5 DK
Attitudes Towards Wildlife Management
Q27. Please tell us whether you strongly agree, somewhat agree, somewhat disagree, or strongly disagree with the following statements. The DC metro area coyote population should be protected and preserved…. 1 2 3 4 5 DK The DC metro area coyote population size should be controlled… 1 2 3 4 5 DK The DC metro area coyote population should be completely eliminated.1 2 3 4 5 DK Q28. Please tell us the extent to which you agree or disagree with the following specific policies and programs to prevent conflict between humans and coyotes on a five point scale where one is strongly agree and five is strongly disagree. Preserve natural areas to serve as a buffer between humans and coyotes.. 1 2 3 4 5 DK Warn residents to keep cats inside and dogs on leash with supervision… 1 2 3 4 5 DK Warn residents to remove food sources from outside.. 1 2 3 4 5 DK Kill as many coyotes as possible… 1 2 3 4 5 DK Kill specific coyotes that attack humans… 1 2 3 4 5 DK

91
Kill specific coyotes that attack pets… 1 2 3 4 5 DK
Implement birth control or sterilization measures to keep coyote population in check.. 1 2 3 4 5 DK Capture and relocate coyotes… 1 2 3 4 5 DK Leave coyotes alone… 1 2 3 4 5 DK Penalize residents who leave cats or dogs outside unattended… 1 2 3 4 5 DK Prohibit the intentional feeding of coyotes… 1 2 3 4 5 DK
Information on Coyotes
IMAQ29. The following are images of coyotes. Please indicate the extent to which these images make you feel more positively or negatively towards coyotes on a five point scale where one is very positive and five is very negative.
Jon Way 1 2 3 4 5
92
Dick Randall 1 2 3 4 5 Jon Way 1 2 3 4 5

93
Ed McGuirk 1 2 3 4 5 CeannLambert 1 2 3 4 5

94
Dick Randall 1 2 3 4 5 Ed McGuirk 1 2 3 4 5

95
Jon Way 1 2 3 4 5
Jon Way 1 2 3 4 5

96
ECOQ29. One study found that the presence of coyotes can indirectly increase local bird diversity, by decreasing the numbers of smaller predators that feed on birds…....... 1 2 3 4 5 Coyotes establish and maintain territories and therefore limit their own population growth….. 1 2 3 4 5 Coyotes prey upon rodents and may control rodent populations….. 1 2 3 4 5 Removing coyotes will not reduce overall coyote populations in an area. If coyotes are removed, other coyotes will take over their territory and litter size and pup survival rates will increase to meet former population levels……………….. 1 2 3 4 5 Humans, through land modification, make habitat that is very suitable for coyotes and one of their main prey items, rodents………….... 1 2 3 4 5 Coyotes are close

97
relatives of wolves, belonging to the same genus, Canis.. 1 2 3 4 5 One study showed that coyotes in the Chicago area rarely ate human-related food, preferring rodents, rabbits and fruit…… 1 2 3 4 5
Some studies have shown that coyotes might be able to control Canadian geese populations… 1 2 3 4 5 Outbreaks of rabies in coyotes are rare; coyotes can actually provide a buffer between humans and rabies, by reducing the local population of foxes… 1 2 3 4 5 Coyotes are close relatives of dogs, belonging to the same genus, Canis.. 1 2 3 4 5
CULQ29. One study stated that human and coyote coexistence occurred every day, but coyotes only make the news when a conflict occurs…….1 2 3 4 5 The Navajo word for coyote can be translated as “God’s Dog”……… 1 2 3 4 5 The word “coyote”

98
comes from the Aztec coyotyl, meaning trickster…. 1 2 3 4 5 The scientific name for coyotes, Canis latrans, is Latin for “barking dog”…….. 1 2 3 4 5 In the tradition of the Miwok peoples, coyote, with the help of the silver fox, created the world…. 1 2 3 4 5 The Federal government spends three times the amount of money that ranchers lose due to predation (even though predation accounts for the fewest livestock losses). Most of the money goes towards lethal predator control programs ……… 1 2 3 4 5
Coyotes were associated with the gods of dance and music in early Mesoamerican cultures…………… 1 2 3 4 5 One anthropologist assigned the coyote the role of Mediator in North American mythology…………. 1 2 3 4 5 Between 1916 and 1999, the Federal government killed nearly 6 million coyotes, almost 2 million since 1976… 1 2 3 4 5 The Federal government’s predator control programs use many inhumane methods of killing

99
coyotes, including aerial gunning, traps, and poisons, amongst other methods……… 1 2 3 4 5 BEHQ29. Coyotes engage in pair-bonding, are monogamous, and both sexes share in the care of young... 1 2 3 4 5 Coyotes use visual, sound, touch, and smell signals in order to communicate, including eleven types of vocalizations..........… 1 2 3 4 5 Coyotes are playful. Social play among coyotes includes cooperation, communication, and learning............. 1 2 3 4 5 Coyotes establish and maintain territories, using scent-marking, howling, and chasing to preserve boundaries. Coyotes rarely kill each other over territory... 1 2 3 4 5 In one scientific report, a coyote who had previously played with a golden retriever dog approached the dog while being walked by it’s owner one night, presumably for another positive interaction………. 1 2 3 4 5 Coyote attacks on

100
humans are very rare; the cause of the attacks can usually be traced back to disease, intentional or unintentional feeding or other human behavior… 1 2 3 4 5 The only known human fatality due to a coyote was caused by human behavior………….. 1 2 3 4 5 Coyotes can live alone, as bonded pairs, or in family groups…………. 1 2 3 4 5 In coyote packs, nonbreeding adults often help in the care of the pack’s pups; these pups are usually their younger siblings…. 1 2 3 4 5 Coyotes have only caused one human death; on the other hand, domestic dogs killed 28 people in 2005, in the US…… 1 2 3 4 5
Now that you have heard/seen more, we would like to ask you some questions again about coyotes. Q30. How much do you or don’t you support the coyote’s existence in the DC metro area? [ ] very much [ ] somewhat [ ] not very much [ ] coyotes should be eliminated or driven out of DC metro area

101
Q31. How much do you like coyotes? [ ] dislike very much [ ] dislike somewhat [ ] neutral [ ] like somewhat [ ] like very much Q32. Please tell us whether you strongly agree, somewhat agree, somewhat disagree, or strongly disagree with the following statements on a five point scale where one is strongly agree and five is strongly disagree. The DC metro area coyote population should be protected and preserved… 1 2 3 4 5 DK The DC metro area coyote population size should be controlled.. 1 2 3 4 5 DK The DC metro area coyote population should be completely eliminated.. 1 2 3 4 5 DK
Q33. Please indicate the extent to which you believe coyotes have the following characteristics on a scale from 0 to 5, where 0 is "strongly agree" and 5 is "strongly disagree." Coyotes are aware of what is happening to them… 1 2 3 4 5 DK Coyotes are capable of experiencing a range of feelings and emotions (e.g. pain, fear, contentment, maternal affection)… 1 2 3 4 5 DK Coyotes are able to think, to some extent, to solve problems and to make decisions about what to do… 1 2 3 4 5 DK Coyotes are more like computer

102
programs, i.e. mechanically responding to instinctive urges without awareness of what they are doing… 1 2 3 4 5 DK
Demographics Q36. Do you live on campus or off campus? [ ] On campus [ ] Off campus Q37. Did you grow up in the Northern Virginia/Metro DC area? [ ] Yes [ [ No Q38. Please indicate your sex. [ ] Female [ ] Male Q39. In what year were you born? _____________ Q40. Please indicate the highest level of education that you have completed. [ ] Less than high school [ ] High School Graduate/GED [ ] Some College/No 4-year Degree [ ] College Graduate [ ] Master’s degree [ ] Some graduate school [ ] Ph.D., M.D., D.V.M, or other terminal degree Q41. a. What is your mother’s profession? _________________ b. What is your father’s profession? _________________ Q42. Are you a member of or do you contribute to any environmental, wildlife or animal protection organizations? [ ] Yes [ ] No If so, which ones? ___________________________________________ Q43. What year are you expecting to graduate? ____________________________ Q44. If you are a degree-seeking student, have you declared a major? [ ] Yes [ ] No (continue to Q45)

103
If you have declared a major, what is it? _______________________ Q45. If you are a degree-seeking student, have you declared a minor? [ ] Yes [ ] No (continue to Q46) If you have declared a minor, what is it? ________________________ Q46. If you have not yet declared a major, do you have an idea of what you want to study? [ ] Yes [ ] No (you are finished!) If you have an idea of what you want your major to be, what category does it best fit? [ ] Biological sciences [ ] Environmental sciences [ ] Physical sciences [ ] Social sciences [ ] Applied sciences [ ] Humanities [ ] Fine or performing arts [ ] Other (please specify): ________________________________________ What is your intended major?: _____________________________________

104
Works Cited
105
Works Cited
Andelt, W. F., and B. R. Mahan. 1980. Behavior of an urban coyote. American Midland
Naturalist 103:399-400. Battiata, M. 2006. Meet the neighbors. Washington Post Magazine, April 16. Berger, K. M. 2006. Carnivore-livestock conflicts: Effects of subsidized predator control
and economic correlates on the sheep industry. Conservation Biology 20:751-761. Bjerke, T., and T. Ostdahl. 2004. Animal-related attitudes and activities in an urban
population. Anthrozoös 17:109-129. Bjerke, T., T. Ostdahl, and J. Kleiven. 2003. Attitudes and activities related to urban
wildlife: Pet owners and non-owners. Anthrozoös 16:253-263. Cannon, J. R., J. M. Dietz, and L. A. Dietz. 1996. Training conservation biologists in
human interaction skills. Conservation Biology 10:1277-1282. Casey, A. L., P. R. Krausman, W. W. Shaw, and H. G. Shaw. 2005. Knowledge and
attitudes toward mountain lions: A public survey of residents adjacent to Saguaro National Park, Arizona. Human Dimensions of Wildlife 10:29-38.
Clark, T. W., A. P. Curlee, and R. P. Reading. 1996. Crafting effective solutions to the
large carnivore conservation problem. Conservation Biology 10:940-948. Clark, T. W., D. J. Mattson, R. P. Reading, and B. J. Miller. 2001. Interdisciplinary
problem solving in carnivore conservation: An introduction in J. I. Gittleman, S. M. Funk, D. Macdonald, and R. K. Wayne, editors. Carnivore Conservation. Cambridge University Press, Cambridge, UK.
Coleman, J. T. 2004. Vicious: Wolves and Men in America. Yale University Press, New
Haven.

106
Conover, M. R. 1997. Wildlife management by metropolitan residents in the United States: Practices, perceptions, costs and values. Wildlife Society Bulletin 25:306-311.
Crooks, K. R. 2002. Relative sensitivities of mammalian carnivores to habitat
fragmentation. Conservation Biology 16:488-502. Crooks, K. R., and M. Soulé. 1999. Mesopredator release and avifaunal extinctions in a
fragmented system. Nature 400:87-102. Czech, B., P. K. Devers, and P. R. Krausman. 2001. The relationship of gender to species
conservation attitides. Wildlife Society Bulletin 29:187-194. Docherty, J. S. 2001. Learning Lessons from Waco: When the Parties Bring Their Gods
to the Negotiation Table. Syracuse University Press, Syracuse, NY. Draheim, M. M., F. Madden, and L. L. Rockwood. 2006. The effectiveness of predator
coexistence programs in the United States. Defenders of Wildlife Carnivores 2006, St. Petersburg, Florida.
Driscoll, J. W. 1992. Attitudes toward animal use. Anthrozoös 16:32-39. Driscoll, J. W. 1995. Attitudes towards animals: Species ratings. Society and Animals 3. Eddy, T. J., G. G. J. Gallup, and D. J. Povinelli. 1993. Attribution of cognitive states to
animals: Anthropomorphism in comparative perspective. Journal of Social Issues 49:87-102.
Enserink, M., and M. Vogel. 2006. The carnivore comeback. Science 314:746-749. Estes, J. A. 2004. Forward in N. Fascione, A. Delach, and M. E. Smith, editors. People
and Predators: From Conflict to Coexistence. Island Press, Washington, DC. Fascione, N., A. Delach, and M. E. Smith. 2004. Introduction. Pages xi-xiii in N.
Fascione, A. Delach, and M. E. Smith, editors. People and Predators: From Conflict to Coexistence. Island Press, Washington, DC.
Fidler, M. 2003. Animal status as a response to pet owner experience. Anthrozoös 16:75-
82. Fox, C. H. 2006. Coyotes and humans: Can we coexist? Pages 287-293 in R. M. Timm,
and J. M. O'Brien, editors. Proceedings of the 22nd Vertebrate Pest Conference. University of California, Davis.

107
Fox, C. H., and C. M. Papouchis 2005. Coyotes in Our Midst: Coexisting with an Adaptable and Resilient Carnivore. Animal Protection Institute, Sacramento, CA.
Fox, H., C. Christian, J. C. Nordby, O. R. Pergams, G. D. Peterson, and C. R. Pyke. 2006.
Perceived barriers to integrating social science and conservation. Conservation Biology 20:1817-1820.
Gehrt, S. 2004a. Chicago coyotes part I. Wildlife Control Technology 11:14-16. Gehrt, S. 2004b. Chicago coyotes part II. Wildlife Control Technology 11:20-21. Gehrt, S. 2004c. Ecology and management of striped skunks, raccoons, and coyotes in
urban landscapes. Pages 81-104 in N. Fascione, A. Delach, and M. E. Smith, editors. People and Predators: From Conflict to Coexistence. Island Press, Washington, DC.
Gehrt, S. D. 2006. Urban Coyote Ecology and Management: The Cook County, Illinois,
Coyote Project. The Ohio State University, Columbus, Ohio. Gore, M. L., W. F. Siemer, J. E. Shanahan, D. Schuefele, and D. J. Decker. 2005. Effects
of risk perception of media coverage of a black bear-related human fatality. Wildlife Society Bulletin 33:507-516.
Heberlein, T. A., and G. Ericsson. 2005. Ties to the countryside: Accounting for
urbanites attitudes toward hunting, wolves and wildlife. Human Dimensions of Wildlife 10:213-227.
Herzog, H. A., and G. M. Burghardt. 1988. Attitudes toward animals: Origins and
diversity. Pages 75-94 in A. N. Rowan, editor. Animals and People Sharing the World. University Press of New England, Hanover, NH.
Hills, A. M. 1995. Empathy and belief in the mental experience of animals. Anthrozoös
8:132-142. Hook, R. A., and W. L. Robinson. 1982. Attitudes of Michigan citizens toward predators.
Pages 382-394 in F. H. Harrington, and P. C. Paquet, editors. Wolves of the World. Noyes Publications, Park Ridge, NJ.
Hungerford, H. R., and T. L. Volk. 1990. Changing learner behavior through
environmental education . Journal of Environmental Education 21:8-21. Jackman, J. 2005. Coyotes, companion animals and conflict on Cape Cod: Attitudes
towards coyotes among Barnstable County, MA voters. Tufts University School

108
of Veterinary Medicine, Center for Animals and Public Policy, North Grafton, MA.
Jacobson, S. K., and M. D. McDuff. 1998. Training idiot savants: The lack of human
dimensions in conservation biology. Conservation Biology 12:263-267. Kellert, S. R. 1985. The public and the timber wolf in Minnesota. Anthrozoös 1:100-109. Kellert, S. R. 1988. Human-animal interactions: A review of American attitudes to wild
and domestic animals in the twentieth century. Pages 137-175 in A. N. Rowan, editor. Animals and People Sharing the World. University Press of New England, Hanover, NH.
Kellert, S. R., and J. K. Berry. 1980. Phase III: Knowledge, Affection and Basic Attitudes
Toward Animals in American Society. Page 162. American Attitudes, Knowledge, and Behaviors Toward Wildlife and Natural Habitats. USFWS and Yale University School of Forestry and Environmental Studies, New Haven.
Kellert, S. R., M. Black, C. R. Rush, and A. J. Bath. 1996. Human culture and large
carnivore conservation in North America. Conservation Biology 10:977-990. Knight, S., A. Vrij, J. Cherryman, and K. Nunkoosing. 2004. Attitudes towards animal
use and belief in animal mind. Anthrozoös 17:43-60. Koval, M. H., and A. G. Mertig. 2004. Attitudes of the Michigan public and wildlife
agency personnel toward lethal wildlife management. Wildlife Society Bulletin 31:232-243.
Lauber, B. T., M. L. Anthony, and B. A. Knuth. 2001. Gender and ethical judgements
about suburban deer management. Society and Natural Resources 14:571-583. Lee, M. E., and R. Miller. 2003. Managing elk in the wildland-urban interface: Attitudes
of Flagstaff, Arizona residents. Wildlife Society Bulletin 31:185-191. Leydet, F. 1977. The Coyote: Defiant Songdog of the West. University of Oklahoma
Press, Norman, OK. Lopez, B. H. 1978. Of Wolves and Men. Simon and Schuster, New York. Madden, F. 2004. Creating coexistence between humans and wildlife: Global
perspectives on local efforts to address human-wildlife conflict. Human Dimensions of Wildlife 9:247-257.
109
Martínez-Espiñeira, R. 2006. Public attitudes toward lethal coyote control. Human Dimensions of Wildlife 11:89-100.
Mascia, M. B., J. P. Brosius, T. A. Dobson, C. C. Forbes, L. Horowitz, M. McKean, and
N. J. Turner. 2003. Conservation and the social sciences. Conservation Biology 17:649-650.
McClure, M. F., N. S. Smith, and W. W. Shaw. 1996. Densities of coyotes at the
interface of Saguaro National Monument and Tucson, Arizona. The Southwestern Naturalist 41:83-86.
McIvor, D. E., and M. R. Conover. 1994. Perceptions of farmers and non-farmers toward
management of problem wildlife. Wildlife Society Bulletin 22:212-219. Meadow, R., R. P. Reading, M. Phillips, M. Mehringer, and B. J. Miller. 2005. The
influence of persuasive arguments on public attitudes toward a proposed wolf restoration in the southern Rockies. Wildlife Society Bulletin 33:154-163.
Messmer, T. A., D. K. Reiter, and B. C. West. 2001. Enhancing wildlife sciences' linkage
to public policy: Lessons from the predator-control pendulum. Wildlife Society Bulletin 29:1253-1259.
Mitchell, B. R., M. M. Jaeger, and R. H. Barrett. 2004. Coyote depredation management:
Current methods and research needs. Wildlife Society Bulletin 32:1209-1218. Odell, E. A., and R. L. Knight. 2001. Songbird and medium-sized mammal communities
associated with exurban development in Pitkin County, Colorado. Conservation Biology 15:1143-1150.
Parker, G. 1995. Eastern Coyote: The Story of its Success. Nimbus Publishing Limited,
Halifax, NS. Primm, S. A., and T. W. Clark. 1996. Making sense of the policy process for carnivore
conservation. Conservation Biology 10:1036-1045. Reading, R. P., and S. R. Kellert. 1993. Attitudes toward a proposed reintroduction of
black-footed ferrets (Mustela nigripes). Conservation Biology 7:569-580. Reiter, D. K., M. W. Brunson, and R. H. Schmidt. 1999. Public attitudes toward wildlife
damage management and policy. Wildlife Society Bulletin 27:746-758. Riley, S. P. D., R. M. Sauvajot, T. K. Fuller, E. C. York, D. A. Kamradt, C. Bromley, and
R. K. Wayne. 2003. Effects of urbanization and habitat fragmentation on bobcats and coyotes in Southern California. Conservation Biology 17:566-576.

110
Sagoff, M. 1988. The Economy of the Earth: Philosophy, Law, and the Environment. Cambridge University Press, Cambridge.
Sillero-Zubiri, C., and D. Switzer. 2004. Management of wild canids in human-
dominated landscapes. Pages 257-266 in C. Sillero-Zubiri, M. Hoffman, and D. W. Macdonald, editors. Canids: Foxes, Wolves, Jackals and Dogs: Status Survey and Conservation Action Plan. IUCN, Cambridge, UK.
Stevens, T. H., T. A. More, and R. J. Glass. 1994. Public attitudes about coyotes in New
England. Society and Natural Resources 7:57-66. Stolzenburg, W. 2006. Us or them. Conservation in Practice 7:14-21. Taylor, D. 2004. Conservation education and its relevance to wild canids. Pages 298-305
in C. Sillero-Zubiri, M. Hoffman, and D. W. Macdonald, editors. Canids: Foxes, Wolves, Jackals and Dogs: Status Survey and Conservation Action Plan. IUCN, Cambridge, UK.
Tigas, L. A., D. H. Van Vuren, and R. M. Sauvajot. 2002. Behavioral responses of
bobcats and coyotes to habitat fragmentation and corridors in an urban environment. Biological Conservation 108:299-306.
Timm, R. M., R. O. Baker, J. R. Bennett, and C. C. Coolahan. 2004. Coyote attacks: An
increasing suburban problem. North American Wildlife and Natural Resources Conferences, Spokane, WA.
USDA-APHIS. 2004. Number of animals killed and methods used by the WS program,
FY 2004. USDA-APHIS, Washington, DC. Vitterso, J., B. P. Kaltenborn, and T. Bjerke. 1998. Attachment to livestock and attitudes
toward large carnivores among sheep farmers in Norway. Anthrozoös 11:210-217.
Weber, W., and A. Rabinowitz. 1996. A global perspective on large carnivore
conservation. Conservation Biology 10:1046-1054. Williams, C. K., G. Ericsson, and T. A. Heberlein. 2002. A quantitative summary of
attitudes toward wolves and thier reintroduction (1972-2000). Wildlife Society Bulletin 30:575-584.

111
Curriculum Vitae
Megan Draheim received her B.A. from George Washington University in Fine Arts/Photography in 1995. She is currently enrolled in George Mason University’s PhD program in Environmental Science and Policy.