wholesale banking - nordea abg investor... · well diversified income and lending mix operating ......
TRANSCRIPT

1
Wholesale Banking
Martin Persson, Head of Wholesale Banking
Stockholm 2017-11-13

Wholesale Banking contribution to group
2
OPERATING INCOME OPERATING PROFIT ECONOMIC CAPITAL FTEs
Nordea Group Wholesale Banking
Key figures – YTD 17 (Q1-Q3)
22% 21% 30% 12%

Simple and flat business structure
3
Income
€ 1.6bn
Key figures – YTD 17 (Q1-Q3)
FTE
~4000
C/I
44%
RoCaR
8%
Governance
Wholesale
Banking
Russia COO C&IB* Markets
*Includes Shipping oil & offshore

Unique strategic positioning
4
Strategic position
Local competition
International
competition
Customer dimension:
Intensity
(Local presence and customer closeness)
Pro
duct dim
ensio
n:
Rele
van
ce
(Siz
e a
nd s
pan o
f c
om
pete
nces)
Market leader

Strong corporate client momentum in Sweden
5

6
Well diversified income and lending mix
Operating income split YTD - 17 (Q1-Q3) Lending per industry - 17 Q3
*Operates on a global basis
**Include holding companies
SE
NO
FI DK
FIG
SOO
Russia 21%
13%
13% 17%
14%
14%
8%
*
*
SOO
Real Estate
Institutional Industrial
Retail
Utilities
Energy
Material
Consumer
Transport
Other 18%
18%
14% 10%
8%
4%
4%
3%
3%
2%
17%
**

Transition from bank to capital markets financing
7
47% 42% 43% 46%
42% 37% 37%
32% 38% 36% 28% 34% 35% 35%
21% 19% 22% 26% 24% 28% 28%
0
1000
2000
3000
4000
5000
6000
7000
8000
9000
0%
10%
20%
30%
40%
50%
60%
70%
80%
90%
100%
2011 2012 2013 2014 2015 2016 2017 Annualised
Net Interest Income Net Fair Value Net Commision Income Economic Capital
Income Economic capital

Active business selection and de-risking of loan portfolio
8
50
60
70
80
90
100
Q1/16 Q2/16 Q3/16 Q4/16 Q1/17 Q2/17 Q3/17
WB SOO Russia WB excluding Russia & SOO
Net interest income (Q1 2016 rebased to 100)
102
52
88
86

Strategic focus in growing ancillary income
9
Debt Capital Markets deal value, €bn
Equity Capital Markets deal value,€bn
Mergers & Acquisitions deal value, €bn
+28%
Nordic Equity Prospera ranking
*Annualised
**Growth is calculated as Compounded Annual Growth Rate between 2011-2016
+89%
0
10
20
30
40
50
60
70
2011 2012 2013 2014 2015 2016 2017*
Th
ou
san
ds
0
2
4
6
8
10
12
2011 2012 2013 2014 2015 2016 2017*
Th
ou
san
ds
0
2
4
6
8
10
12
2011 2012 2013 2014 2015 2016 2017*
Th
ou
sa
nd
s
+9%**
2011 2012 2013 2014 2015 2016
1
5
10
15
**
**

Leading Nordic franchise in debt capital markets
10
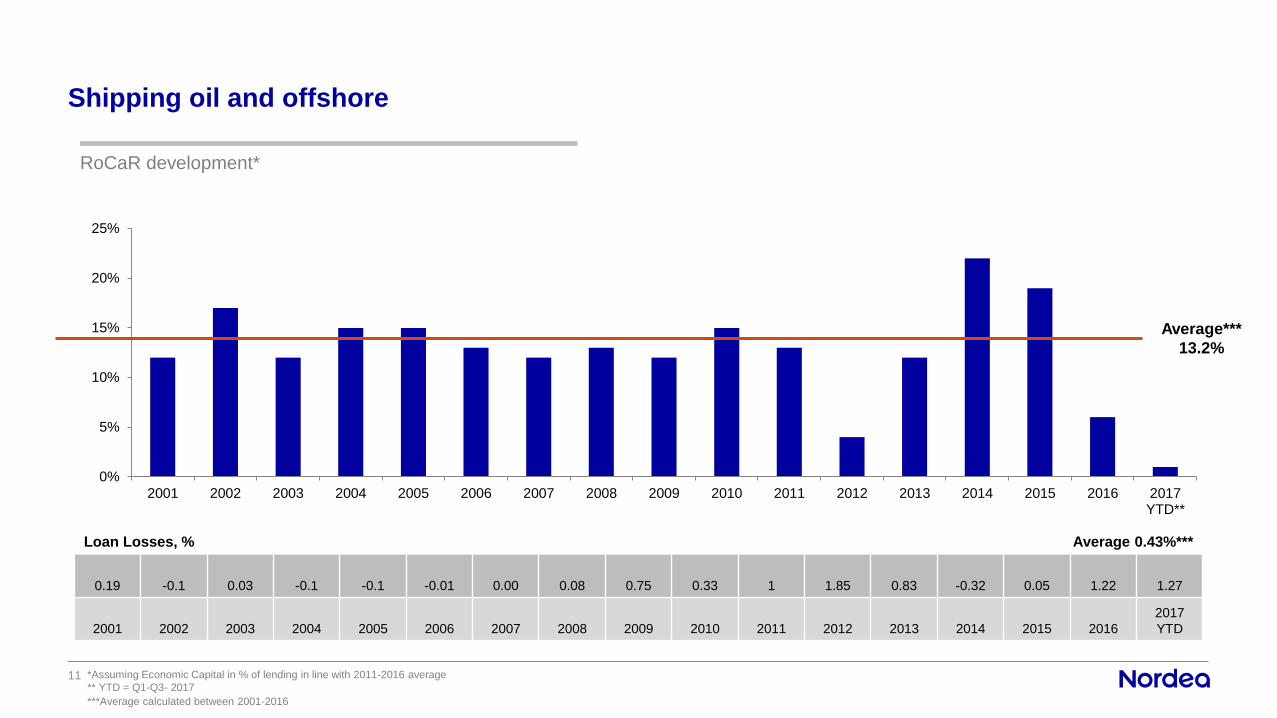
Shipping oil and offshore
11
Loan Losses, % Average 0.43%***
0.19 -0.1 0.03 -0.1 -0.1 -0.01 0.00 0.08 0.75 0.33 1 1.85 0.83 -0.32 0.05 1.22 1.27
2001 2002 2003 2004 2005 2006 2007 2008 2009 2010 2011 2012 2013 2014 2015 2016
2017
YTD
RoCaR development*
*Assuming Economic Capital in % of lending in line with 2011-2016 average
** YTD = Q1-Q3- 2017
***Average calculated between 2001-2016
0%
5%
10%
15%
20%
25%
2001 2002 2003 2004 2005 2006 2007 2008 2009 2010 2011 2012 2013 2014 2015 2016 2017YTD**
Average***
13.2%

Nordea Markets - resilient income generation despite record low volatility
12 *Stability fund fees and IAS adjustment have been excluded.
0
5
10
15
20
25
30
35
40
45
jan feb mar apr maj jun jul aug sep
2017 2016 2015 2014
VIX index YTD 17 Markets income €bn
1.2
1.5 1.4 1.4
2014 2015 2016 2017Annualised

Wholesale Banking transformation
13
Distribution/
Channels/
Service model
Credit proc. &
Prod.
IT &
Operations
Key support
functions
Business strategy unchanged, #1 relationship bank in the Nordics
• Streamlined customer service
• Further explore digital channels and services
Re-positioning of Markets
• Implement new cross-Nordic operating model for Markets business with
stronger customer ownership and clearly defined service and value
offerings
• Cross-sell and capital markets financing
Operational excellence,
• Simplified IT infrastructure, robotics and near-shoring to Poland
Strengthened capital governance and risk management
• Increase capital velocity
• Consolidate SOO franchise and normalised loan losses
Key transformation initiatives Cost efficiencies and quality gains
Where do the cost efficiencies come from?
Medium
Operational excellence,
• Simplified IT infrastructure, robotics and near-shoring to
Poland
Improved customer satisfaction
• Client coverage: A more coordinated, dedicated and holistic
approach to customer interaction
• Research: High uniform quality, easier and more transparent
to deal with and utilise pan-Nordic capacity
High High
Medium

Value drivers going forward – looking ahead
14
Top line
characteristics
Value drivers
Value creation
Market
characteristics
GDP growth
~2%
Interest rates
0%
Volatility
Low
Regulation
High
Lending Income NII
Pricing Fee & Comm. EC Loan losses
Market position
#1
Return
12%
Cost/Income
15
Thank you!