who we are - scotiabank€¦ · earnings per share (eps) performance: $2.01 eps is the net income a...
TRANSCRIPT

Contents
2 Notice of Annual General Meeting4 Financial & Other Highlights5 Directors’ Report6 Ten-Year Statistical Review8 Report to Shareholders30 Risk Management33 Economic Review35 Shareholdings36 Financial Report 2005
108 Glossary109 Corporate Governance110 Board of Directors112 Executive and Senior Management Officers114 Corporate Directory
Proxy Form
Who We Are
Scotiabank is Jamaica's leading financial institution. Through our network of 42 branches, supported by over 1,800 dedicated
and highly trained employees across the country, we offer a complete line of retail and commercial products and services.
Our 155 Automated Banking Machines islandwide are available for the 24 hour banking convenience of our customers.
At Scotiabank, our energies are focused on being the financial institution of choice - anticipating and
fulfilling our customers’ financial needs.
We are committed to our employees' welfare, and the maximization of our shareholders' wealth. We build strongrelationships with the communities we serve, through our
Scotiabank Volunteers and the contributions of Scotiabank Jamaica Foundation.

2005 Scotiabank Annual Report
1
2005 Performance
•Return on Average Equity (ROE)
Performance: 26.33%ROE measures how well the Bank is using common shareholders' invested money. It is calculated by dividing net income available
to common shareholders by average common shareholders' equity.
•Earnings Per Share (EPS)
Performance: $2.01EPS is the net income a company has generated per common share.
It is calculated by dividing net income available to shareholders by the average number of common shares outstanding.
•Productivity
Performance: 52.47%The Productivity Ratio measures the overall efficiency of the Bank. It expresses non-interest expenses as a percentage of total revenue. A lower ratio indicates
better productivity. By this measure, Scotiabank has historically been significantly better than the international benchmark of 60%.
•Risk Based Capital Adequacy
Performance: 21.53%The Risk Based Capital Adequacy Ratio is a measure of the Bank's overall strength.
It requires that the Bank maintain a ratio between its capital base and the aggregate of its risk weighted assets at no less than 10%. Scotiabank Jamaica
has continued to maintain a strong capital adequacy ratio.

Notice of Annual General Meeting
NOTICE IS HEREBY GIVEN that the Thirty-Ninth Annual General Meeting of THE BANK OF NOVA SCOTIA JAMAICALIMITED will be held on Friday the 17th February 2006 at 10:00 a.m. at the Jamaica Pegasus Hotel, 81 KnutsfordBoulevard, Kingston 5, Jamaica for the following purposes, namely: -
1. To consider the Company’s Accounts and the Reports of the Directors and the Auditors for the year endedOctober 31, 2005 and to consider and (if thought fit) pass the following resolution:
Resolution No. 1
“That the Directors’ Report, the Auditors’ Report and the Statements of Account of the Company for the year ended October 31, 2005 be approved and adopted.”
2. To approve and ratify interim dividends:-
To consider and (if thought fit) pass the following resolution:
Resolution No. 2
“That the interim dividends paid of 50 cents on April 7, 2005, 25 cents on July 7, 2005, 25 cents onOctober 13, 2005 and 25 cents on January 5, 2006 be and are hereby ratified.”
3. To elect Directors and fix their remuneration. The Directors retiring from office by rotation pursuant toArticle 90 of the Company’s Articles of Association are Miss Muna Issa, Mr. Charles Johnston, Mr. WarrenMcDonald and Dr. Herbert Thompson, who being eligible offer themselves for re-election.
In accordance with Article 93 of the Company’s Articles of Association, Mr. Joseph M. Matalon, ProfessorStephen Vasciannie and Miss Stacie-Ann Wright, having been appointed to the Board since the last AnnualGeneral Meeting shall cease to hold office and, being eligible, offer themselves for election.
To consider and (if thought fit) pass the following resolutions:
Resolution No. 3
a) “That retiring Director Muna Issa be and is hereby re-elected a Director of the Company.”
b) “That retiring Director Charles Johnston be and is hereby re-elected a Director of the Company.”
c) “That retiring Director Warren McDonald be and is hereby re-elected a Director of the company.”
d) “That retiring Director Herbert Thompson be and is hereby re-elected a Director of the Company.”
e) “That retiring Director Joseph M. Matalon be and is hereby elected a Director of the Company.”
f) “That retiring Director Stephen Vasciannie be and is hereby elected a Director of the Company.”
g) “That retiring Director Stacie-Ann Wright be and is hereby elected a Director of the Company.”
2005 Scotiabank Annual Report
2

4. To appoint Auditors and authorise the Directors to fix the remuneration of the Auditors.To consider and (if thought fit) pass the following resolution as a special resolution:
Resolution No. 4
“KPMG, Chartered Accountants, be and are hereby appointed Auditors of the Company to hold office untilthe next Annual General Meeting at a remuneration to be fixed by the Directors of the Company.”
5. Any other business for which due notice has been given.
BY ORDER OF THE BOARD
David NoëlSecretaryNovember 24, 2005
REGISTERED OFFICEScotiabank CentreDuke & Port Royal StreetsKingston
A member entitled to attend and vote at this meeting may appoint a Proxy to attend and vote in his/her stead. A Proxy neednot also be a Member of the Company. Enclosed is a Proxy Form for your convenience, which must be lodged at the Company’sRegistered Office at least forty-eight hours before the time appointed for holding the meeting. The Proxy Form shall bear thestamp duty of $100.00 before being signed. The stamp duty may be paid by adhesive stamp(s) to be cancelled by the personexecuting the Proxy.
2005 Scotiabank Annual Report
3

Financial & Other Highlights
Financial Position ($ Millions)2005 2004
Total Assets 183,461 168,168Earning Assets
Performing Loans, net of provisions 56,730 52,420Repos 27,227 25,046Non performing Loans 918 1,039Investments & Others 76,672 65,546
Deposits by the public 107,280 98,811Stockholders' Equity 23,525 20,605
Earnings and Dividends ($Millions)
Gross Operating revenue 25,008 25,313Profit before Taxation 8,330 8,173Profit after Taxation 5,886 5,856Dividends paid and proposed 2,927 3,118
Financial Ratios
Earnings per stock unit ($)* 2.01 2.00Dividends per stock unit ($)* 1.00 0.925Dividend payout ratio (%) 49.74 46.24Return on average equity after tax (%) 26.33 29.85Return on assets at year- end (%) 3.21 3.48Net Interest Margin (%) 7.34 8.36Risk based Capital Adequacy Ratio (%) 21.53 22.31
Other Statistics
Number of stock units (ordinary shares)* 2,927,232,000 2,927,232,000Stock price at year- end ($)* 21.14 25.26Number of stockholders 14,105 10,982Number of staff 1,843 1,864Number of offices 47 48
* 2004 restated to reflect the one-for-one bonus issue on March 10, 2005.
Where necessary, comparative figures have been restated to conform with changes in presentation in the current year.
2005 Scotiabank Annual Report
4

Directors’ Report
The Directors submit herewith the Statement of Consolidated Revenue, Expenses, Unappropriated Profits, Assets and Liabilitiesof the Bank for the year ended October 31, 2005.
The Consolidated Statement of Revenue and Expenses shows pre-tax profit for the year of $8,330 Million from which there hasbeen provided $2,444 Million for corporate income tax, leaving a balance of $5,886 Million.
On February 18, 2005, at the Annual General Meeting of the Members of the company, resolutions were passed increasing theAuthorised Share Capital from $1,500,000,000 to $3,000,000,000 and the Issued Share Capital from $1,463,616,000 to$2,927,232,000 by way of a 1 for 1 bonus share issue. The increase in the issued share capital was effected on March 10, 2005 andthe cost of the bonus shares was met from the Retained Earnings Reserve as at January 31, 2005.
The appropriation of earnings detailed in the financial statements includes:
i. An interim dividend of 25 cents per stock unit payable to stockholders on record as at December 14, 2005, payable on January 5, 2006. This brings the total distribution for the year to $1.00 per stock unit compared with $0.925 per stockunit for the previous year, after adjustment for the aforementioned 1 for 1 bonus shares.
ii. A transfer of $750,000,000 to the Retained Earnings Reserve.
iii. Capitalization of $1,463,616,000 from Retained Earnings Reserve by way of a 1 for 1 bonus issue of shares on March 10, 2005.
iv. A transfer of $1,463,616,000 from Retained Earnings Reserve to the Statutory Reserve Fund.
In view of the interim dividends paid, and to be paid, as mentioned above, the Directors do not recommend the declaration ofa final dividend at the Annual General Meeting to be held on February 17, 2006.
Miss Muna Issa, Mr. Charles Johnston, Mr. Warren McDonald and Dr. Herbert Thompson retire from the Board by rotation inaccordance with Article 90 and being eligible offer themselves for re-election.
In accordance with Article 93 of the Company’s Articles of Association, Mr. Joseph M. Matalon, Professor Stephen Vasciannie andMiss Stacie-Ann Wright having been appointed to the Board since the last Annual General Meeting cease to hold office and,being eligible, offers themselves for election.
Miss Minna Israel, Mr. Anthony Allen and Dr. Wayne Henry resigned from the Board on January 17, 2005, January 25, 2005 andJune 30, 2005, respectively. The Board wishes to express its sincere appreciation to Miss Israel, Mr. Allen and Dr. Henry for theircontributions to the Bank.
Your Directors are proposing that KPMG be appointed auditors of the Company at the next Annual General Meeting. Previously,both KPMG and PricewaterhouseCoopers were joint auditors of our parent company in Canada, the Bank of Nova Scotia. KPMGhas now been appointed the sole auditors in Canada, and their proposed appointment as auditors in Jamaica as well is designedto achieve greater efficiency in the preparation of the consolidated results for the Scotiabank Group.
PricewaterhouseCoopers have agreed to retire as auditors at the next Annual General Meeting and your Directors would like tothank them for their professionalism and the excellent service they have provided as auditors over the years.
Your Directors wish to thank the Management and Staff of the Bank for their performance during the year under review.
On behalf of the Board
R.H. PitfieldChairman, Kingston, JamaicaNovember 24, 2005
2005 Scotiabank Annual Report
5

Restated Restated Restated2005 2004 2003 2002
$'000
Total Assets 183,460,943 168,167,649 147,653,177 127,367,433Performing Loans 56,730,432 52,420,106 47,111,019 38,513,658Non-Performing Loans 918,164 1,039,396 963,695 906,857Repos 27,227,255 25,046,360 17,593,444 14,120,663Investments & Other Earning Assets 76,672,095 65,554,244 60,908,823 52,326,933Deposits by the public 107,280,146 98,810,819 87,067,332 76,947,608Securities Sold Under Repurchase Agreement 16,705,889 18,546,429 15,292,996 11,566,632Stockholders' Equity 23,524,953 20,605,017 17,651,197 14,065,776Profit Before Tax 8,329,812 8,172,633 7,307,403 5,308,735Net profit after tax 5,885,586 5,856,057 5,456,670 3,869,782Dividends paid, gross 2,927,232 2,707,689 2,561,328 1,683,158Unappropriated Profits at year end 11,918,737 9,710,382 6,580,207 4,265,864Number of stock units at year end(1) 2,927,232 2,927,232 2,927,232 2,927,232
FINANCIAL RATIOS
Earnings per stock unit(1) 2.01 2.00 1.86 1.32Price earnings ratio 10.51 12.62 4.80 5.92Dividends paid per stock unit(1) 1.00 0.925 0.875 0.575Dividend yield (%)(1) 3.88% 4.41% 9.78% 7.34%Dividend payout ratio (%) 49.74% 46.24% 46.94% 43.49%Return on average equity pre-tax (%) 37.26% 41.65% 45.83% 40.00%Return on average equity (%) 26.33% 29.85% 34.22% 29.16%Return on assets at year end (%) 3.21% 3.48% 3.70% 3.04%
OTHER DATA
Stock price at year end ($)(1) 21.14 25.26 8.95 7.83Price change from last year (%) -16.31% 182.18% 14.30% 2.49%JSE Index at year end 102,445 104,001 60,304 41,044Change in JSE Index from last year (%) -1.50% 72.46% 46.93% 25.92%Number of staff 1,843 1,864 1,851 1,805Number of offices 47 48 47 49Number of stockholders 14,105 10,982 9,401 9,447Exchange Rate J$1=US$ 0.0156 0.0162 0.0166 0.0203Inflation Rate Year Over Year (%) 15.90% 11.60% 14.13% 5.04%
Net Profit in US$ 92,061 94,805 90,549 78,387
DIVIDEND PAID QUARTERLY
Quarter 1 731,808 585,446 446,403 402,493Quarter 2 731,808 658,627 446,403 417,131Quarter 3 731,808 731,808 526,902 417,131Quarter 4 731,808 731,808 1,141,620 446,403
Total 2,927,232 2,707,689 2,561,328 1,683,158
(1) Amounts have been retroactively adjusted to reflect the one-for-one bonus issues on March 10, 2005 and October 6, 1997.Where necessary, comparative figures have been restated to conform with changes in presentation in the current year.
Ten-year Statistical Review
2005 Scotiabank Annual Report
6

Restated2001 2000 1999 1998 1997 1996
102,563,972 88,430,400 77,719,597 65,615,624 54,926,384 42,226,57325,244,790 20,357,184 16,669,180 17,196,178 19,081,775 16,810,175
911,345 1,217,056 1,324,321 1,237,930 720,465 332,67914,715,189 9,171,222 9,933,153 7,908,520 7,547,662 5,015,32446,653,347 44,585,417 39,149,800 36,599,592 17,132,218 13,188,10067,809,259 60,384,105 54,537,781 46,222,803 41,677,670 30,427,2908,392,202 8,701,050 8,016,576 6,072,443 4,257,049 2,647,531
11,880,802 8,353,262 6,996,243 5,916,542 4,942,448 4,089,0244,418,438 3,484,976 2,946,473 2,577,282 2,262,128 2,475,2823,214,178 2,557,184 2,031,051 1,764,447 1,584,559 1,661,3951,463,616 1,200,165 951,350 790,353 731,808 658,6282,829,240 1,038,755 635,886 338,959 201,223 510,9172,927,232 2,927,232 2,927,232 2,927,232 2,927,232 2,927,232
1.10 0.87 0.69 0.60 0.54 0.576.96 7.38 4.83 5.56 9.05 6.560.50 0.41 0.33 0.27 0.25 0.11
6.54% 6.35% 9.70% 8.06% 5.10% 3.02%45.54% 46.93% 46.84% 44.79% 46.18% 39.64%44.72% 44.05% 44.00% 46.32% 50.09% 69.34%32.53% 32.32% 30.33% 31.71% 35.09% 46.54%3.13% 2.89% 2.61% 2.69% 2.88% 3.93%
7.64 6.46 3.35 3.35 4.90 3.7318.27% 92.84% 0.00% -31.63% 31.54% 9.56%32,595 29,776 21,124 20,050 18,147 15,3239.47% 40.96% 5.36% 10.49% 18.43% -2.20%1,756 1,691 1,757 1,874 1,666 1,617
48 50 49 50 51 509,165 9,040 8,912 8,073 7,948 10,379
0.0210 0.0224 0.0250 0.0271 0.0278 0.02857.56% 8.30% 6.44% 7.14% 9.98% 22.76%
67,498 57,281 50,776 47,746 44,052 47,333
329,314 182,952 182,952 146,361 292,723 439,085358,586 182,952 182,952 146,362 292,723 439,085373,222 292,723 182,952 146,362 365,904 439,085402,494 541,538 402,494 702,536 512,266 329,314
1,463,616 1,200,165 951,350 1,141,621 1,463,616 1,646,568
2005 Scotiabank Annual Report
7

2005 Scotiabank Annual Report
8
Report to Shareholders
* Restated for Bonus issue
0
500
1,000
1,500
2,000
2,500
3,000
3,500
4,000
2001 2002* 2003 2004 2005
0
4,000
8,000
12,000
16,000
0
20
40
60
0
2,000
4,000
6,000
8,000
10,000
2,000
0
4,000
8,000
12,000
16,000
20,000
24,000
28,000
2003
0.00
1.00
2.00
3.00
20.00
0
0.00
10.00
20.00
30.00
40.00
2001 2002* 2003 2004 2005
%
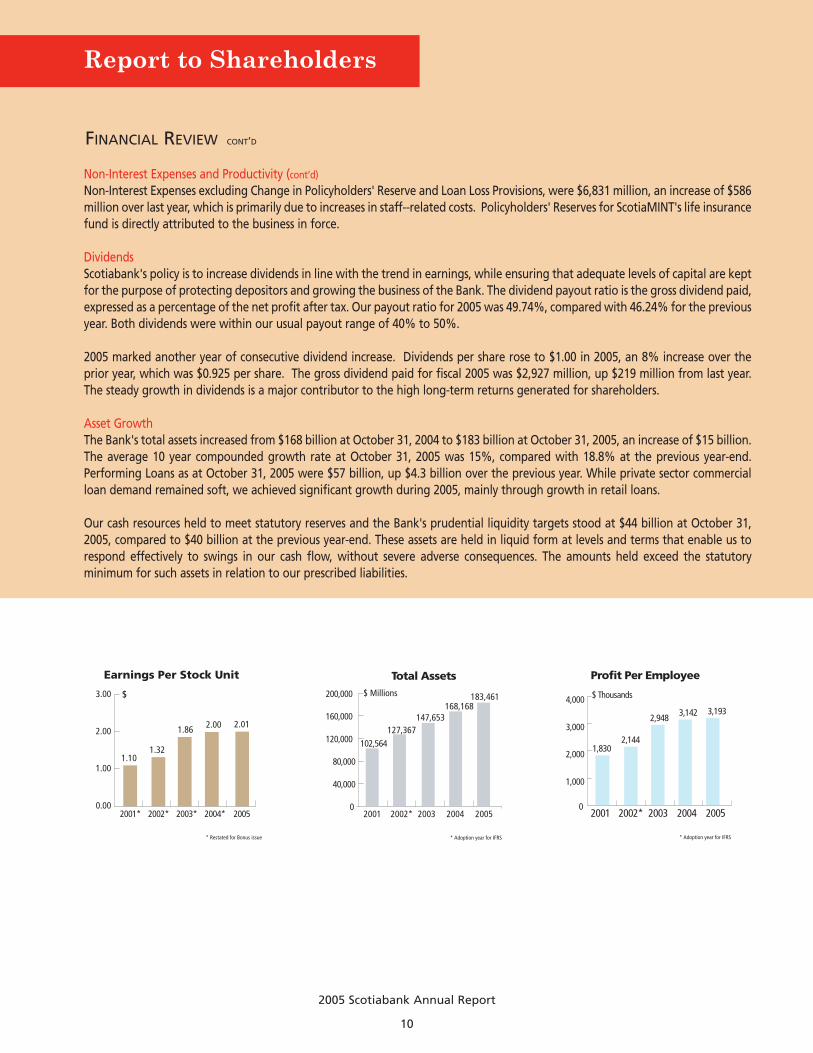
Dividend Paid Per Stock Unit
2001* 2002* 2003* 2004* 20050.00
0.40
0.80
1.20
0.500.57
0.880.925 1.00
$$
* Restated for Bonus issue
Return on Assets
0.0
1.0
2.0
3.0
4.0
2001* 2002* 2003 2004 2005
3.13 3.04
3.703.48
3.21
%
*Adoption year for IFRS*Adoption year for IFRS *Adoption year for IFRS
Expenses
2001 2002* 2003 2004 2005
* Adoption year for IFRS
0
4,000
6,000
8,000
10,000
5,003 5,303
7,153
8,5339,197$ Millions
Total Assets
2001 2002* 2003 2004 2005
40,000
80,000
120,000
160,000
200,000
0
$ Millions
102,564127,367
147,653168,168
* Adoption year for IFRS
183,461
Profit Per Employee
0
1,000
2,000
3,000
4,000 $ Thousands
1,8302,144
2,948 3,142 3,193
2001 2002* 2003 2004 2005
* Adoption year for IFRS
Dividends
2001 2002 2003 2004 2005
500
1,000
1,500
2,000
2,500
3,000
3,500 $ Millions
1,4641,683
2,561 2,7082,927
Dividend Payout Ratio
*Adoption year for IFRS *Adoption year for IFRS
*Adoption year for IFRS*Adoption year for IFRS
*Adoption year for IFRS
*Adoption year for IFRS *Adoption year for IFRS
2001 2002* 2003 2004 20050.00
10.00
30.00
40.00
50.00
60.00
43.4946.94 46.24
49.7445.54
%
Productivity Ratio
2001 2002* 2003 2004 2005
54.1049.97 49.46 51.08 52.47
%
0
2,000
4,000
6,000
8,000
10,000
2001 2002* 2003 2004 2005
Revenue Per Employee
5,481 5,825
7,7668,938 9,362$ Thousands
Stockholders Equity
2001 2002* 2004 2005
11,88114,066
17,65120,605
23,525$ Millions
Profit Before Tax
2001 2002* 2003 2004 2005
4,4185,309
7,3078,173 8,330
$ Millions
Other Income
1,784 1,853
2,433 2,595
3,463$ Millions
Net Interest Income
2001 2002* 2003 2004 2005
$ Millions
7,8418,759
12,027
14,111 14,064
2001* 2002* 2003 2004 2005
26,156
39,421
48,07553,460
57,649
$ Millions
0
10,000
20,000
30,000
40,000
50,000
60,000
70,000
Total Loans
2001 2002 2003 2004 20050
20,000
40,000
60,000
80,000
100,000
120,000 $ Millions
67,80976,948
87,06798,811
107,280
Total Deposits
Earnings Per Stock Unit
2001* 2002* 2003* 2004* 2005
1.101.32
1.86 2.00 2.01
32.53 34.2229.85
26.3329.16
Return on Average Equity
Allocation of Revenue 2005
35%
35%
8%5%11%
13%
18%
9%
Source of Revenue 2005
50%
36%
14%
* Restated for Bonus issue
0
500
1,000
1,500
2,000
2,500
3,000
3,500
4,000
2001 2002* 2003 2004 2005
0
4,000
8,000
12,000
16,000
0
20
40
60
0
2,000
4,000
6,000
8,000
10,000
2,000
0
4,000
8,000
12,000
16,000
20,000
24,000
28,000
2003
0.00
1.00
2.00
3.00
20.00
0
0.00
10.00
20.00
30.00
40.00
2001 2002* 2003 2004 2005
%
Dividend Paid Per Stock Unit
2001* 2002* 2003* 2004* 20050.00
0.40
0.80
1.20
0.500.57
0.880.925 1.00
$$
* Restated for Bonus issue
Return on Assets
0.0
1.0
2.0
3.0
4.0
2001* 2002* 2003 2004 2005
3.13 3.04
3.703.48
3.21
%
*Adoption year for IFRS*Adoption year for IFRS *Adoption year for IFRS
Expenses
2001 2002* 2003 2004 2005
* Adoption year for IFRS
0
4,000
6,000
8,000
10,000
5,003 5,303
7,153
8,5339,197$ Millions
Total Assets
2001 2002* 2003 2004 2005
40,000
80,000
120,000
160,000
200,000
0
$ Millions
102,564127,367
147,653168,168
* Adoption year for IFRS
183,461
Profit Per Employee
0
1,000
2,000
3,000
4,000 $ Thousands
1,8302,144
2,948 3,142 3,193
2001 2002* 2003 2004 2005
* Adoption year for IFRS
Dividends
2001 2002 2003 2004 2005
500
1,000
1,500
2,000
2,500
3,000
3,500 $ Millions
1,4641,683
2,561 2,7082,927
Dividend Payout Ratio
*Adoption year for IFRS *Adoption year for IFRS
*Adoption year for IFRS*Adoption year for IFRS
*Adoption year for IFRS
*Adoption year for IFRS *Adoption year for IFRS
2001 2002* 2003 2004 20050.00
10.00
30.00
40.00
50.00
60.00
43.4946.94 46.24
49.7445.54
%
Productivity Ratio
2001 2002* 2003 2004 2005
54.1049.97 49.46 51.08 52.47
%
0
2,000
4,000
6,000
8,000
10,000
2001 2002* 2003 2004 2005
Revenue Per Employee
5,481 5,825
7,7668,938 9,362$ Thousands
Stockholders Equity
2001 2002* 2004 2005
11,88114,066
17,65120,605
23,525$ Millions
Profit Before Tax
2001 2002* 2003 2004 2005
4,4185,309
7,3078,173 8,330
$ Millions
Other Income
1,784 1,853
2,433 2,595
3,463$ Millions
Net Interest Income
2001 2002* 2003 2004 2005
$ Millions
7,8418,759
12,027
14,111 14,064
2001* 2002* 2003 2004 2005
26,156
39,421
48,07553,460
57,649
$ Millions
0
10,000
20,000
30,000
40,000
50,000
60,000
70,000
Total Loans
2001 2002 2003 2004 20050
20,000
40,000
60,000
80,000
100,000
120,000 $ Millions
67,80976,948
87,06798,811
107,280
Total Deposits
Earnings Per Stock Unit
2001* 2002* 2003* 2004* 2005
1.101.32
1.86 2.00 2.01
32.53 34.2229.85
26.3329.16
Return on Average Equity
Allocation of Revenue 2005
35%
35%
8%5%11%
13%
18%
9%
Source of Revenue 2005
50%
36%
14%
Robert H. PitfieldChairman
FINANCIAL REVIEW
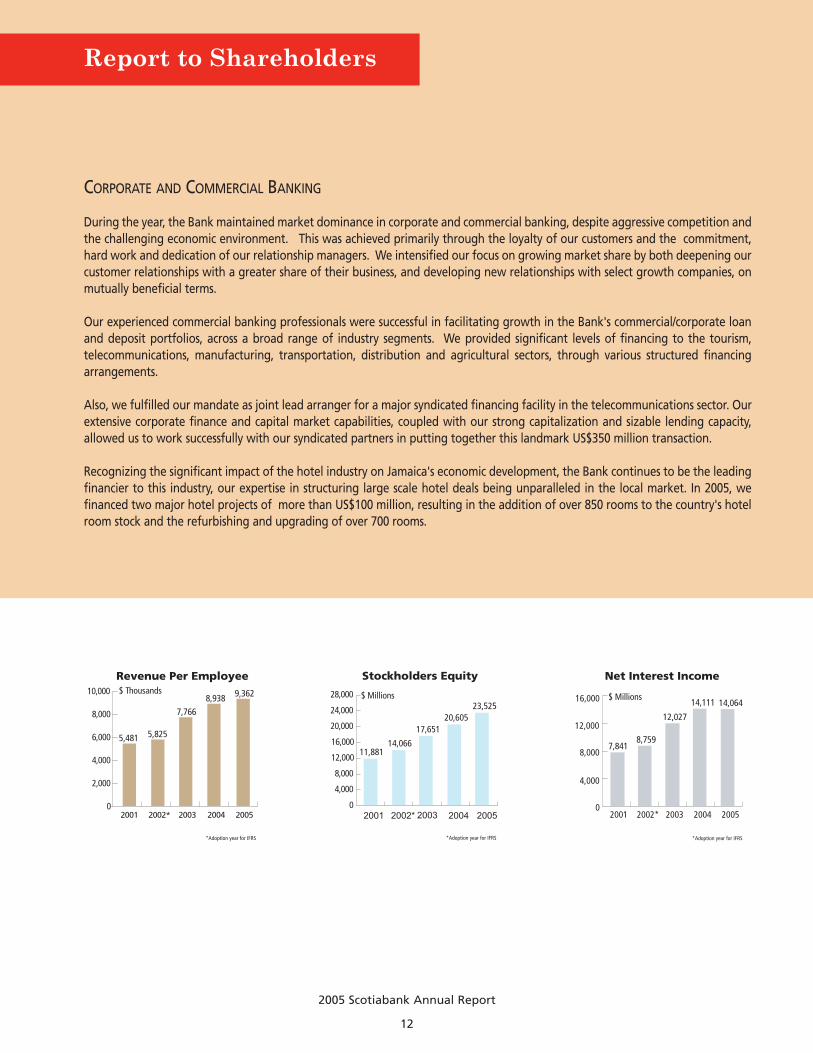
We are pleased to report on another successful year of operations for Scotiabank and itsSubsidiaries (The Bank). Scotiabank reported net income of $5,886 million for the yearended October 31, 2005, the ninth consecutive year of increased profits. These resultswere achieved in spite of very challenging economic times, which saw significantreductions in market interest rates. Our results reflect the strength of our well-diversifiedbusiness lines, as we remain focused on our core business to achieve solid earnings andlong-term sustainable growth. Strong growth in retail banking continues to be a majorcontributor to our solid performance, with volume growth in retail and credit card loansand fee income being major contributors to retail banking profits.
Total RevenueTotal revenue comprising net interest revenue and other income was $17,526 million.While we experienced a marginal reduction in net interest revenue (consistent with thereduction in market interest rates), our other revenue increased by 33%. This was fueledby strong growth in foreign exchange trading profit, credit card revenue, and other retailfees.
Net Interest IncomeNet interest income, the excess of gross interest earned over gross interest expenses,continues to be a significant source of revenue. For the year ended October 31, 2005, netinterest income was $14,064 million, down marginally by $47 million from last year. Therewas strong portfolio volume growth, which would otherwise have resulted in aconsiderable increase in net interest revenue; however, there was a reduction in netinterest margin occasioned by the significant reduction in market interest rates.
2005 Scotiabank Annual Report
9
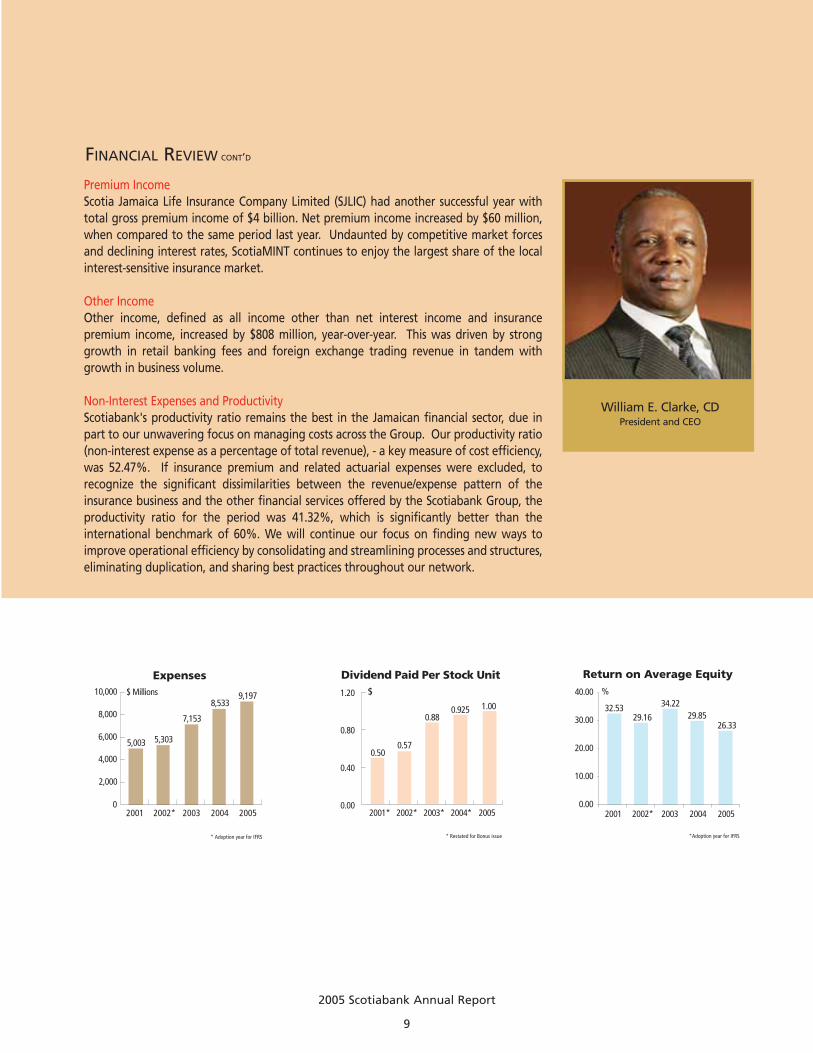
William E. Clarke, CDPresident and CEO
* Restated for Bonus issue
0
500
1,000
1,500
2,000
2,500
3,000
3,500
4,000
2001 2002* 2003 2004 2005
0
4,000
8,000
12,000
16,000
0
20
40
60
0
2,000
4,000
6,000
8,000
10,000
2,000
0
4,000
8,000
12,000
16,000
20,000
24,000
28,000
2003
0.00
1.00
2.00
3.00 $
20.00
0
0.00
10.00
20.00
30.00
40.00
2001 2002* 2003 2004 2005
%
Dividend Paid Per Stock Unit
2001* 2002* 2003* 2004* 20050.00
0.40
0.80
1.20
0.500.57
0.880.925 1.00
$$
* Restated for Bonus issue
Return on Assets
0.0
1.0
2.0
3.0
4.0
2001* 2002* 2003 2004 2005
3.13 3.04
3.703.48
3.21
%
*Adoption year for IFRS*Adoption year for IFRS *Adoption year for IFRS
Expenses
2001 2002* 2003 2004 2005
* Adoption year for IFRS
0
4,000
6,000
8,000
10,000
5,003 5,303
7,153
8,5339,197$ Millions
Total Assets
2001 2002* 2003 2004 2005
40,000
80,000
120,000
160,000
200,000
0
$ Millions
102,564127,367
147,653168,168
* Adoption year for IFRS
183,461
Profit Per Employee
0
1,000
2,000
3,000
4,000 $ Thousands
1,8302,144
2,948 3,142 3,193
2001 2002* 2003 2004 2005
* Adoption year for IFRS
Dividends
2001 2002 2003 2004 2005
500
1,000
1,500
2,000
2,500
3,000
3,500 $ Millions
1,4641,683
2,561 2,7082,927
Dividend Payout Ratio
*Adoption year for IFRS *Adoption year for IFRS
*Adoption year for IFRS*Adoption year for IFRS
*Adoption year for IFRS
*Adoption year for IFRS *Adoption year for IFRS
2001 2002* 2003 2004 20050.00
10.00
30.00
40.00
50.00
60.00
43.4946.94 46.24
49.7445.54
%
Productivity Ratio
2001 2002* 2003 2004 2005
54.1049.97 49.46 51.08 52.47
%
0
2,000
4,000
6,000
8,000
10,000
2001 2002* 2003 2004 2005
Revenue Per Employee
5,481 5,825
7,7668,938 9,362$ Thousands
Stockholders Equity
2001 2002* 2004 2005
11,88114,066
17,65120,605
23,525$ Millions
Profit Before Tax
2001 2002* 2003 2004 2005
4,4185,309
7,3078,173 8,330
$ Millions
Other Income
1,784 1,853
2,433 2,595
3,463$ Millions
Net Interest Income
2001 2002* 2003 2004 2005
$ Millions
7,8418,759
12,027
14,111 14,064
2001* 2002* 2003 2004 2005
26,156
39,421
48,07553,460
57,649
$ Millions
0
10,000
20,000
30,000
40,000
50,000
60,000
70,000
Total Loans
2001 2002 2003 2004 20050
20,000
40,000
60,000
80,000
100,000
120,000 $ Millions
67,80976,948
87,06798,811
107,280
Total Deposits
Earnings Per Stock Unit
2001* 2002* 2003* 2004* 2005
1.101.32
1.86 2.00 2.01
32.53 34.2229.85
26.3329.16
Return on Average Equity
Allocation of Revenue 2005
35%
35%
8%5%11%
13%
18%
9%
Source of Revenue 2005
50%
36%
14%
* Restated for Bonus issue
0
500
1,000
1,500
2,000
2,500
3,000
3,500
4,000
2001 2002* 2003 2004 2005
0
4,000
8,000
12,000
16,000
0
20
40
60
0
2,000
4,000
6,000
8,000
10,000
2,000
0
4,000
8,000
12,000
16,000
20,000
24,000
28,000
2003
0.00
1.00
2.00
3.00 $
20.00
0
0.00
10.00
20.00
30.00
40.00
2001 2002* 2003 2004 2005
%
Dividend Paid Per Stock Unit
2001* 2002* 2003* 2004* 20050.00
0.40
0.80
1.20
0.500.57
0.880.925 1.00
$$
* Restated for Bonus issue
Return on Assets
0.0
1.0
2.0
3.0
4.0
2001* 2002* 2003 2004 2005
3.13 3.04
3.703.48
3.21
%
*Adoption year for IFRS*Adoption year for IFRS *Adoption year for IFRS
Expenses
2001 2002* 2003 2004 2005
* Adoption year for IFRS
0
4,000
6,000
8,000
10,000
5,003 5,303
7,153
8,5339,197$ Millions
Total Assets
2001 2002* 2003 2004 2005
40,000
80,000
120,000
160,000
200,000
0
$ Millions
102,564127,367
147,653168,168
* Adoption year for IFRS
183,461
Profit Per Employee
0
1,000
2,000
3,000
4,000 $ Thousands
1,8302,144
2,948 3,142 3,193
2001 2002* 2003 2004 2005
* Adoption year for IFRS
Dividends
2001 2002 2003 2004 2005
500
1,000
1,500
2,000
2,500
3,000
3,500 $ Millions
1,4641,683
2,561 2,7082,927
Dividend Payout Ratio
*Adoption year for IFRS *Adoption year for IFRS
*Adoption year for IFRS*Adoption year for IFRS
*Adoption year for IFRS
*Adoption year for IFRS *Adoption year for IFRS
2001 2002* 2003 2004 20050.00
10.00
30.00
40.00
50.00
60.00
43.4946.94 46.24
49.7445.54
%
Productivity Ratio
2001 2002* 2003 2004 2005
54.1049.97 49.46 51.08 52.47
%
0
2,000
4,000
6,000
8,000
10,000
2001 2002* 2003 2004 2005
Revenue Per Employee
5,481 5,825
7,7668,938 9,362$ Thousands
Stockholders Equity
2001 2002* 2004 2005
11,88114,066
17,65120,605
23,525$ Millions
Profit Before Tax
2001 2002* 2003 2004 2005
4,4185,309
7,3078,173 8,330
$ Millions
Other Income
1,784 1,853
2,433 2,595
3,463$ Millions
Net Interest Income
2001 2002* 2003 2004 2005
$ Millions
7,8418,759
12,027
14,111 14,064
2001* 2002* 2003 2004 2005
26,156
39,421
48,07553,460
57,649
$ Millions
0
10,000
20,000
30,000
40,000
50,000
60,000
70,000
Total Loans
2001 2002 2003 2004 20050
20,000
40,000
60,000
80,000
100,000
120,000 $ Millions
67,80976,948
87,06798,811
107,280
Total Deposits
Earnings Per Stock Unit
2001* 2002* 2003* 2004* 2005
1.101.32
1.86 2.00 2.01
32.53 34.2229.85
26.3329.16
Return on Average Equity
Allocation of Revenue 2005
35%
35%
8%5%11%
13%
18%
9%
Source of Revenue 2005
50%
36%
14%
Premium IncomeScotia Jamaica Life Insurance Company Limited (SJLIC) had another successful year withtotal gross premium income of $4 billion. Net premium income increased by $60 million,when compared to the same period last year. Undaunted by competitive market forcesand declining interest rates, ScotiaMINT continues to enjoy the largest share of the localinterest-sensitive insurance market.
Other IncomeOther income, defined as all income other than net interest income and insurancepremium income, increased by $808 million, year-over-year. This was driven by stronggrowth in retail banking fees and foreign exchange trading revenue in tandem withgrowth in business volume.
Non-Interest Expenses and ProductivityScotiabank's productivity ratio remains the best in the Jamaican financial sector, due inpart to our unwavering focus on managing costs across the Group. Our productivity ratio(non-interest expense as a percentage of total revenue), - a key measure of cost efficiency,was 52.47%. If insurance premium and related actuarial expenses were excluded, torecognize the significant dissimilarities between the revenue/expense pattern of theinsurance business and the other financial services offered by the Scotiabank Group, theproductivity ratio for the period was 41.32%, which is significantly better than theinternational benchmark of 60%. We will continue our focus on finding new ways toimprove operational efficiency by consolidating and streamlining processes and structures,eliminating duplication, and sharing best practices throughout our network.
FINANCIAL REVIEW CONT’D
2005 Scotiabank Annual Report
10
Report to Shareholders
FINANCIAL REVIEW CONT’D
* Restated for Bonus issue
0
500
1,000
1,500
2,000
2,500
3,000
3,500
4,000
2001 2002* 2003 2004 2005
0
4,000
8,000
12,000
16,000
0
20
40
60
0
2,000
4,000
6,000
8,000
10,000
2,000
0
4,000
8,000
12,000
16,000
20,000
24,000
28,000
2003
0.00
1.00
2.00
3.00
20.00
0
0.00
10.00
20.00
30.00
40.00
2001 2002* 2003 2004 2005
%
Dividend Paid Per Stock Unit
2001* 2002* 2003* 2004* 20050.00
0.40
0.80
1.20
0.500.57
0.880.925 1.00
$$
* Restated for Bonus issue
Return on Assets
0.0
1.0
2.0
3.0
4.0
2001* 2002* 2003 2004 2005
3.13 3.04
3.703.48
3.21
%
*Adoption year for IFRS*Adoption year for IFRS *Adoption year for IFRS
Expenses
2001 2002* 2003 2004 2005
* Adoption year for IFRS
0
4,000
6,000
8,000
10,000
5,003 5,303
7,153
8,5339,197$ Millions
Total Assets
2001 2002* 2003 2004 2005
40,000
80,000
120,000
160,000
200,000
0
$ Millions
102,564127,367
147,653168,168
* Adoption year for IFRS
183,461
Profit Per Employee
0
1,000
2,000
3,000
4,000 $ Thousands
1,8302,144
2,948 3,142 3,193
2001 2002* 2003 2004 2005
* Adoption year for IFRS
Dividends
2001 2002 2003 2004 2005
500
1,000
1,500
2,000
2,500
3,000
3,500 $ Millions
1,4641,683
2,561 2,7082,927
Dividend Payout Ratio
*Adoption year for IFRS *Adoption year for IFRS
*Adoption year for IFRS*Adoption year for IFRS
*Adoption year for IFRS
*Adoption year for IFRS *Adoption year for IFRS
2001 2002* 2003 2004 20050.00
10.00
30.00
40.00
50.00
60.00
43.4946.94 46.24
49.7445.54
%
Productivity Ratio
2001 2002* 2003 2004 2005
54.1049.97 49.46 51.08 52.47
%
0
2,000
4,000
6,000
8,000
10,000
2001 2002* 2003 2004 2005
Revenue Per Employee
5,481 5,825
7,7668,938 9,362$ Thousands
Stockholders Equity
2001 2002* 2004 2005
11,88114,066
17,65120,605
23,525$ Millions
Profit Before Tax
2001 2002* 2003 2004 2005
4,4185,309
7,3078,173 8,330
$ Millions
Other Income
1,784 1,853
2,433 2,595
3,463$ Millions
Net Interest Income
2001 2002* 2003 2004 2005
$ Millions
7,8418,759
12,027
14,111 14,064
2001* 2002* 2003 2004 2005
26,156
39,421
48,07553,460
57,649
$ Millions
0
10,000
20,000
30,000
40,000
50,000
60,000
70,000
Total Loans
2001 2002 2003 2004 20050
20,000
40,000
60,000
80,000
100,000
120,000 $ Millions
67,80976,948
87,06798,811
107,280
Total Deposits
Earnings Per Stock Unit
2001* 2002* 2003* 2004* 2005
1.101.32
1.86 2.00 2.01
32.53 34.2229.85
26.3329.16
Return on Average Equity
Allocation of Revenue 2005
35%
35%
8%5%11%
13%
18%
9%
Source of Revenue 2005
50%
36%
14%
* Restated for Bonus issue
0
500
1,000
1,500
2,000
2,500
3,000
3,500
4,000
2001 2002* 2003 2004 2005
0
4,000
8,000
12,000
16,000
0
20
40
60
0
2,000
4,000
6,000
8,000
10,000
2,000
0
4,000
8,000
12,000
16,000
20,000
24,000
28,000
2003
0.00
1.00
2.00
3.00 $
20.00
0
0.00
10.00
20.00
30.00
40.00
2001 2002* 2003 2004 2005
%
Dividend Paid Per Stock Unit
2001* 2002* 2003* 2004* 20050.00
0.40
0.80
1.20
0.500.57
0.880.925 1.00
$$
* Restated for Bonus issue
Return on Assets
0.0
1.0
2.0
3.0
4.0
2001* 2002* 2003 2004 2005
3.13 3.04
3.703.48
3.21
%
*Adoption year for IFRS*Adoption year for IFRS *Adoption year for IFRS
Expenses
2001 2002* 2003 2004 2005
* Adoption year for IFRS
0
4,000
6,000
8,000
10,000
5,003 5,303
7,153
8,5339,197$ Millions
Total Assets
2001 2002* 2003 2004 2005
40,000
80,000
120,000
160,000
200,000
0
$ Millions
102,564127,367
147,653168,168
* Adoption year for IFRS
183,461
Profit Per Employee
0
1,000
2,000
3,000
4,000 $ Thousands
1,8302,144
2,948 3,142 3,193
2001 2002* 2003 2004 2005
* Adoption year for IFRS
Dividends
2001 2002 2003 2004 2005
500
1,000
1,500
2,000
2,500
3,000
3,500 $ Millions
1,4641,683
2,561 2,7082,927
Dividend Payout Ratio
*Adoption year for IFRS *Adoption year for IFRS
*Adoption year for IFRS*Adoption year for IFRS
*Adoption year for IFRS
*Adoption year for IFRS *Adoption year for IFRS
2001 2002* 2003 2004 20050.00
10.00
30.00
40.00
50.00
60.00
43.4946.94 46.24
49.7445.54
%
Productivity Ratio
2001 2002* 2003 2004 2005
54.1049.97 49.46 51.08 52.47
%
0
2,000
4,000
6,000
8,000
10,000
2001 2002* 2003 2004 2005
Revenue Per Employee
5,481 5,825
7,7668,938 9,362$ Thousands
Stockholders Equity
2001 2002* 2004 2005
11,88114,066
17,65120,605
23,525$ Millions
Profit Before Tax
2001 2002* 2003 2004 2005
4,4185,309
7,3078,173 8,330
$ Millions
Other Income
1,784 1,853
2,433 2,595
3,463$ Millions
Net Interest Income
2001 2002* 2003 2004 2005
$ Millions
7,8418,759
12,027
14,111 14,064
2001* 2002* 2003 2004 2005
26,156
39,421
48,07553,460
57,649
$ Millions
0
10,000
20,000
30,000
40,000
50,000
60,000
70,000
Total Loans
2001 2002 2003 2004 20050
20,000
40,000
60,000
80,000
100,000
120,000 $ Millions
67,80976,948
87,06798,811
107,280
Total Deposits
Earnings Per Stock Unit
2001* 2002* 2003* 2004* 2005
1.101.32
1.86 2.00 2.01
32.53 34.2229.85
26.3329.16
Return on Average Equity
Allocation of Revenue 2005
35%
35%
8%5%11%
13%
18%
9%
Source of Revenue 2005
50%
36%
14%
Non-Interest Expenses and Productivity (cont’d)
Non-Interest Expenses excluding Change in Policyholders' Reserve and Loan Loss Provisions, were $6,831 million, an increase of $586million over last year, which is primarily due to increases in staff--related costs. Policyholders' Reserves for ScotiaMINT's life insurancefund is directly attributed to the business in force.
DividendsScotiabank's policy is to increase dividends in line with the trend in earnings, while ensuring that adequate levels of capital are keptfor the purpose of protecting depositors and growing the business of the Bank. The dividend payout ratio is the gross dividend paid,expressed as a percentage of the net profit after tax. Our payout ratio for 2005 was 49.74%, compared with 46.24% for the previousyear. Both dividends were within our usual payout range of 40% to 50%.
2005 marked another year of consecutive dividend increase. Dividends per share rose to $1.00 in 2005, an 8% increase over theprior year, which was $0.925 per share. The gross dividend paid for fiscal 2005 was $2,927 million, up $219 million from last year.The steady growth in dividends is a major contributor to the high long-term returns generated for shareholders.
Asset GrowthThe Bank's total assets increased from $168 billion at October 31, 2004 to $183 billion at October 31, 2005, an increase of $15 billion.The average 10 year compounded growth rate at October 31, 2005 was 15%, compared with 18.8% at the previous year-end.Performing Loans as at October 31, 2005 were $57 billion, up $4.3 billion over the previous year. While private sector commercialloan demand remained soft, we achieved significant growth during 2005, mainly through growth in retail loans.
Our cash resources held to meet statutory reserves and the Bank's prudential liquidity targets stood at $44 billion at October 31,2005, compared to $40 billion at the previous year-end. These assets are held in liquid form at levels and terms that enable us torespond effectively to swings in our cash flow, without severe adverse consequences. The amounts held exceed the statutoryminimum for such assets in relation to our prescribed liabilities.

2005 Scotiabank Annual Report
11
FINANCIAL REVIEW CONT’D
* Restated for Bonus issue
0
500
1,000
1,500
2,000
2,500
3,000
3,500
4,000
2001 2002* 2003 2004 2005
0
4,000
8,000
12,000
16,000
0
20
40
60
0
2,000
4,000
6,000
8,000
10,000
2,000
0
4,000
8,000
12,000
16,000
20,000
24,000
28,000
2003
0.00
1.00
2.00
3.00
20.00
0
0.00
10.00
20.00
30.00
40.00
2001 2002* 2003 2004 2005
%
Dividend Paid Per Stock Unit
2001* 2002* 2003* 2004* 20050.00
0.40
0.80
1.20
0.500.57
0.880.925 1.00
$$
* Restated for Bonus issue
Return on Assets
0.0
1.0
2.0
3.0
4.0
2001* 2002* 2003 2004 2005
3.13 3.04
3.703.48
3.21
%
*Adoption year for IFRS*Adoption year for IFRS *Adoption year for IFRS
Expenses
2001 2002* 2003 2004 2005
* Adoption year for IFRS
0
4,000
6,000
8,000
10,000
5,003 5,303
7,153
8,5339,197$ Millions
Total Assets
2001 2002* 2003 2004 2005
40,000
80,000
120,000
160,000
200,000
0
$ Millions
102,564127,367
147,653168,168
* Adoption year for IFRS
183,461
Profit Per Employee
0
1,000
2,000
3,000
4,000 $ Thousands
1,8302,144
2,948 3,142 3,193
2001 2002* 2003 2004 2005
* Adoption year for IFRS
Dividends
2001 2002 2003 2004 2005
500
1,000
1,500
2,000
2,500
3,000
3,500 $ Millions
1,4641,683
2,561 2,7082,927
Dividend Payout Ratio
*Adoption year for IFRS *Adoption year for IFRS
*Adoption year for IFRS*Adoption year for IFRS
*Adoption year for IFRS
*Adoption year for IFRS *Adoption year for IFRS
2001 2002* 2003 2004 20050.00
10.00
30.00
40.00
50.00
60.00
43.4946.94 46.24
49.7445.54
%
Productivity Ratio
2001 2002* 2003 2004 2005
54.1049.97 49.46 51.08 52.47
%
0
2,000
4,000
6,000
8,000
10,000
2001 2002* 2003 2004 2005
Revenue Per Employee
5,481 5,825
7,7668,938 9,362$ Thousands
Stockholders Equity
2001 2002* 2004 2005
11,88114,066
17,65120,605
23,525$ Millions
Profit Before Tax
2001 2002* 2003 2004 2005
4,4185,309
7,3078,173 8,330
$ Millions
Other Income
1,784 1,853
2,433 2,595
3,463$ Millions
Net Interest Income
2001 2002* 2003 2004 2005
$ Millions
7,8418,759
12,027
14,111 14,064
2001* 2002* 2003 2004 2005
26,156
39,421
48,07553,460
57,649
$ Millions
0
10,000
20,000
30,000
40,000
50,000
60,000
70,000
Total Loans
2001 2002 2003 2004 20050
20,000
40,000
60,000
80,000
100,000
120,000 $ Millions
67,80976,948
87,06798,811
107,280
Total Deposits
Earnings Per Stock Unit
2001* 2002* 2003* 2004* 2005
1.101.32
1.86 2.00 2.01
32.53 34.2229.85
26.3329.16
Return on Average Equity
Allocation of Revenue 2005
35%
35%
8%5%11%
13%
18%
9%
Source of Revenue 2005
50%
36%
14%
* Restated for Bonus issue
0
500
1,000
1,500
2,000
2,500
3,000
3,500
4,000
2001 2002* 2003 2004 2005
0
4,000
8,000
12,000
16,000
0
20
40
60
0
2,000
4,000
6,000
8,000
10,000
2,000
0
4,000
8,000
12,000
16,000
20,000
24,000
28,000
2003
0.00
1.00
2.00
3.00
20.00
0
0.00
10.00
20.00
30.00
40.00
2001 2002* 2003 2004 2005
%
Dividend Paid Per Stock Unit
2001* 2002* 2003* 2004* 20050.00
0.40
0.80
1.20
0.500.57
0.880.925 1.00
$$
* Restated for Bonus issue
Return on Assets
0.0
1.0
2.0
3.0
4.0
2001* 2002* 2003 2004 2005
3.13 3.04
3.703.48
3.21
%
*Adoption year for IFRS*Adoption year for IFRS *Adoption year for IFRS
Expenses
2001 2002* 2003 2004 2005
* Adoption year for IFRS
0
4,000
6,000
8,000
10,000
5,003 5,303
7,153
8,5339,197$ Millions
Total Assets
2001 2002* 2003 2004 2005
40,000
80,000
120,000
160,000
200,000
0
$ Millions
102,564127,367
147,653168,168
* Adoption year for IFRS
183,461
Profit Per Employee
0
1,000
2,000
3,000
4,000 $ Thousands
1,8302,144
2,948 3,142 3,193
2001 2002* 2003 2004 2005
* Adoption year for IFRS
Dividends
2001 2002 2003 2004 2005
500
1,000
1,500
2,000
2,500
3,000
3,500 $ Millions
1,4641,683
2,561 2,7082,927
Dividend Payout Ratio
*Adoption year for IFRS *Adoption year for IFRS
*Adoption year for IFRS*Adoption year for IFRS
*Adoption year for IFRS
*Adoption year for IFRS *Adoption year for IFRS
2001 2002* 2003 2004 20050.00
10.00
30.00
40.00
50.00
60.00
43.4946.94 46.24
49.7445.54
%
Productivity Ratio
2001 2002* 2003 2004 2005
54.1049.97 49.46 51.08 52.47
%
0
2,000
4,000
6,000
8,000
10,000
2001 2002* 2003 2004 2005
Revenue Per Employee
5,481 5,825
7,7668,938 9,362$ Thousands
Stockholders Equity
2001 2002* 2004 2005
11,88114,066
17,65120,605
23,525$ Millions
Profit Before Tax
2001 2002* 2003 2004 2005
4,4185,309
7,3078,173 8,330
$ Millions
Other Income
1,784 1,853
2,433 2,595
3,463$ Millions
Net Interest Income
2001 2002* 2003 2004 2005
$ Millions
7,8418,759
12,027
14,111 14,064
2001* 2002* 2003 2004 2005
26,156
39,421
48,07553,460
57,649
$ Millions
0
10,000
20,000
30,000
40,000
50,000
60,000
70,000
Total Loans
2001 2002 2003 2004 20050
20,000
40,000
60,000
80,000
100,000
120,000 $ Millions
67,80976,948
87,06798,811
107,280
Total Deposits
Earnings Per Stock Unit
2001* 2002* 2003* 2004* 2005
1.101.32
1.86 2.00 2.01
32.53 34.2229.85
26.3329.16
Return on Average Equity
Allocation of Revenue 2005
35%
35%
8%5%11%
13%
18%
9%
Source of Revenue 2005
50%
36%
14%
* Restated for Bonus issue
0
500
1,000
1,500
2,000
2,500
3,000
3,500
4,000
2001 2002* 2003 2004 2005
0
4,000
8,000
12,000
16,000
0
20
40
60
0
2,000
4,000
6,000
8,000
10,000
2,000
0
4,000
8,000
12,000
16,000
20,000
24,000
28,000
2003
0.00
1.00
2.00
3.00
20.00
0
0.00
10.00
20.00
30.00
40.00
2001 2002* 2003 2004 2005
%
Dividend Paid Per Stock Unit
2001* 2002* 2003* 2004* 20050.00
0.40
0.80
1.20
0.500.57
0.880.925 1.00
$$
* Restated for Bonus issue
Return on Assets
0.0
1.0
2.0
3.0
4.0
2001* 2002* 2003 2004 2005
3.13 3.04
3.703.48
3.21
%
*Adoption year for IFRS*Adoption year for IFRS *Adoption year for IFRS
Expenses
2001 2002* 2003 2004 2005
* Adoption year for IFRS
0
4,000
6,000
8,000
10,000
5,003 5,303
7,153
8,5339,197$ Millions
Total Assets
2001 2002* 2003 2004 2005
40,000
80,000
120,000
160,000
200,000
0
$ Millions
102,564127,367
147,653168,168
* Adoption year for IFRS
183,461
Profit Per Employee
0
1,000
2,000
3,000
4,000 $ Thousands
1,8302,144
2,948 3,142 3,193
2001 2002* 2003 2004 2005
* Adoption year for IFRS
Dividends
2001 2002 2003 2004 2005
500
1,000
1,500
2,000
2,500
3,000
3,500 $ Millions
1,4641,683
2,561 2,7082,927
Dividend Payout Ratio
*Adoption year for IFRS *Adoption year for IFRS
*Adoption year for IFRS*Adoption year for IFRS
*Adoption year for IFRS
*Adoption year for IFRS *Adoption year for IFRS
2001 2002* 2003 2004 20050.00
10.00
30.00
40.00
50.00
60.00
43.4946.94 46.24
49.7445.54
%
Productivity Ratio
2001 2002* 2003 2004 2005
54.1049.97 49.46 51.08 52.47
%
0
2,000
4,000
6,000
8,000
10,000
2001 2002* 2003 2004 2005
Revenue Per Employee
5,481 5,825
7,7668,938 9,362$ Thousands
Stockholders Equity
2001 2002* 2004 2005
11,88114,066
17,65120,605
23,525$ Millions
Profit Before Tax
2001 2002* 2003 2004 2005
4,4185,309
7,3078,173 8,330
$ Millions
Other Income
1,784 1,853
2,433 2,595
3,463$ Millions
Net Interest Income
2001 2002* 2003 2004 2005
$ Millions
7,8418,759
12,027
14,111 14,064
2001* 2002* 2003 2004 2005
26,156
39,421
48,07553,460
57,649
$ Millions
0
10,000
20,000
30,000
40,000
50,000
60,000
70,000
Total Loans
2001 2002 2003 2004 20050
20,000
40,000
60,000
80,000
100,000
120,000 $ Millions
67,80976,948
87,06798,811
107,280
Total Deposits
Earnings Per Stock Unit
2001* 2002* 2003* 2004* 2005
1.101.32
1.86 2.00 2.01
32.53 34.2229.85
26.3329.16
Return on Average Equity
Allocation of Revenue 2005
35%
35%
8%5%11%
13%
18%
9%
Source of Revenue 2005
50%
36%
14%
The Bank's portfolio of Government securities (including repurchase agreements) grew from $60 billion at last year-end to $67billion at October 31, 2005 as deposit and repo liability growth outpaced loan growth. The average yield on the portfolio decreasedyear over year in line with market trends.
Credit QualityScotiabank's credit quality continues to be outstanding, both by international standards and when compared with our peers locally.Non-performing Loans at October 31, 2005 were $918 million, an improvement of $121 million when compared to $1,039 million ayear ago. The Group's non-performing loans now represent 1.59% of total loans and 0.50% of total assets, compared to 1.93% and0.62% respectively in the prior year.
Most non-performing loans are secured, the majority with real estate security. Provisions for loan losses are considered adequateand are reviewed regularly in light of changing market conditions. Provision for loan losses on an IFRS (International FinancialReporting Standards) basis was $495 million at year-end. However, the total provisions based on the Bank of Jamaica's statutoryrequirements were $1,302 million. The difference between the statutory and the IFRS provision is reported in the LLP Reserve, as acomponent of shareholders' equity. We are confident that, with this level of provisioning, the Group is adequately protected shouldthe economy suffer a short-term down turn.
DepositsOur Bank continues to increase its deposits, despite the noticeable market shift from traditional bank deposits to investments in awide variety of market instruments, ranging from Government of Jamaica securities to money market products. The Bank's deposits grew by 10 %, from $104 billion at last year-end to $114 billion at this year-end, as public confidence in the Bank remains very high.
The mix of the portfolio was dominated by retail savings accounts; however, term deposits liabilities continued to grow steadily.
2005 Scotiabank Annual Report
12
Report to Shareholders
* Restated for Bonus issue
0
500
1,000
1,500
2,000
2,500
3,000
3,500
4,000
2001 2002* 2003 2004 2005
0
4,000
8,000
12,000
16,000
0
20
40
60
0
2,000
4,000
6,000
8,000
10,000
2,000
0
4,000
8,000
12,000
16,000
20,000
24,000
28,000
2003
0.00
1.00
2.00
3.00
20.00
0
0.00
10.00
20.00
30.00
40.00
2001 2002* 2003 2004 2005
%
Dividend Paid Per Stock Unit
2001* 2002* 2003* 2004* 20050.00
0.40
0.80
1.20
0.500.57
0.880.925 1.00
$$
* Restated for Bonus issue
Return on Assets
0.0
1.0
2.0
3.0
4.0
2001* 2002* 2003 2004 2005
3.13 3.04
3.703.48
3.21
%
*Adoption year for IFRS*Adoption year for IFRS *Adoption year for IFRS
Expenses
2001 2002* 2003 2004 2005
* Adoption year for IFRS
0
4,000
6,000
8,000
10,000
5,003 5,303
7,153
8,5339,197$ Millions
Total Assets
2001 2002* 2003 2004 2005
40,000
80,000
120,000
160,000
200,000
0
$ Millions
102,564127,367
147,653168,168
* Adoption year for IFRS
183,461
Profit Per Employee
0
1,000
2,000
3,000
4,000 $ Thousands
1,8302,144
2,948 3,142 3,193
2001 2002* 2003 2004 2005
* Adoption year for IFRS
Dividends
2001 2002 2003 2004 2005
500
1,000
1,500
2,000
2,500
3,000
3,500 $ Millions
1,4641,683
2,561 2,7082,927
Dividend Payout Ratio
*Adoption year for IFRS *Adoption year for IFRS
*Adoption year for IFRS*Adoption year for IFRS
*Adoption year for IFRS
*Adoption year for IFRS *Adoption year for IFRS
2001 2002* 2003 2004 20050.00
10.00
30.00
40.00
50.00
60.00
43.4946.94 46.24
49.7445.54
%
Productivity Ratio
2001 2002* 2003 2004 2005
54.1049.97 49.46 51.08 52.47
%
0
2,000
4,000
6,000
8,000
10,000
2001 2002* 2003 2004 2005
Revenue Per Employee
5,481 5,825
7,7668,938 9,362$ Thousands
Stockholders Equity
2001 2002* 2004 2005
11,88114,066
17,65120,605
23,525$ Millions
Profit Before Tax
2001 2002* 2003 2004 2005
4,4185,309
7,3078,173 8,330
$ Millions
Other Income
1,784 1,853
2,433 2,595
3,463$ Millions
Net Interest Income
2001 2002* 2003 2004 2005
$ Millions
7,8418,759
12,027
14,111 14,064
2001* 2002* 2003 2004 2005
26,156
39,421
48,07553,460
57,649
$ Millions
0
10,000
20,000
30,000
40,000
50,000
60,000
70,000
Total Loans
2001 2002 2003 2004 20050
20,000
40,000
60,000
80,000
100,000
120,000 $ Millions
67,80976,948
87,06798,811
107,280
Total Deposits
Earnings Per Stock Unit
2001* 2002* 2003* 2004* 2005
1.101.32
1.86 2.00 2.01
32.53 34.2229.85
26.3329.16
Return on Average Equity
Allocation of Revenue 2005
35%
35%
8%5%11%
13%
18%
9%
Source of Revenue 2005
50%
36%
14%
* Restated for Bonus issue
0
500
1,000
1,500
2,000
2,500
3,000
3,500
4,000
2001 2002* 2003 2004 2005
0
4,000
8,000
12,000
16,000
0
20
40
60
0
2,000
4,000
6,000
8,000
10,000
2,000
0
4,000
8,000
12,000
16,000
20,000
24,000
28,000
2003
0.00
1.00
2.00
3.00
20.00
0
0.00
10.00
20.00
30.00
40.00
2001 2002* 2003 2004 2005
%
Dividend Paid Per Stock Unit
2001* 2002* 2003* 2004* 20050.00
0.40
0.80
1.20
0.500.57
0.880.925 1.00
$$
* Restated for Bonus issue
Return on Assets
0.0
1.0
2.0
3.0
4.0
2001* 2002* 2003 2004 2005
3.13 3.04
3.703.48
3.21
%
*Adoption year for IFRS*Adoption year for IFRS *Adoption year for IFRS
Expenses
2001 2002* 2003 2004 2005
* Adoption year for IFRS
0
4,000
6,000
8,000
10,000
5,003 5,303
7,153
8,5339,197$ Millions
Total Assets
2001 2002* 2003 2004 2005
40,000
80,000
120,000
160,000
200,000
0
$ Millions
102,564127,367
147,653168,168
* Adoption year for IFRS
183,461
Profit Per Employee
0
1,000
2,000
3,000
4,000 $ Thousands
1,8302,144
2,948 3,142 3,193
2001 2002* 2003 2004 2005
* Adoption year for IFRS
Dividends
2001 2002 2003 2004 2005
500
1,000
1,500
2,000
2,500
3,000
3,500 $ Millions
1,4641,683
2,561 2,7082,927
Dividend Payout Ratio
*Adoption year for IFRS *Adoption year for IFRS
*Adoption year for IFRS*Adoption year for IFRS
*Adoption year for IFRS
*Adoption year for IFRS *Adoption year for IFRS
2001 2002* 2003 2004 20050.00
10.00
30.00
40.00
50.00
60.00
43.4946.94 46.24
49.7445.54
%
Productivity Ratio
2001 2002* 2003 2004 2005
54.1049.97 49.46 51.08 52.47
%
0
2,000
4,000
6,000
8,000
10,000
2001 2002* 2003 2004 2005
Revenue Per Employee
5,481 5,825
7,7668,938 9,362$ Thousands
Stockholders Equity
2001 2002* 2004 2005
11,88114,066
17,65120,605
23,525$ Millions
Profit Before Tax
2001 2002* 2003 2004 2005
4,4185,309
7,3078,173 8,330
$ Millions
Other Income
1,784 1,853
2,433 2,595
3,463$ Millions
Net Interest Income
2001 2002* 2003 2004 2005
$ Millions
7,8418,759
12,027
14,111 14,064
2001* 2002* 2003 2004 2005
26,156
39,421
48,07553,460
57,649
$ Millions
0
10,000
20,000
30,000
40,000
50,000
60,000
70,000
Total Loans
2001 2002 2003 2004 20050
20,000
40,000
60,000
80,000
100,000
120,000 $ Millions
67,80976,948
87,06798,811
107,280
Total Deposits
Earnings Per Stock Unit
2001* 2002* 2003* 2004* 2005
1.101.32
1.86 2.00 2.01
32.53 34.2229.85
26.3329.16
Return on Average Equity
Allocation of Revenue 2005
35%
35%
8%5%11%
13%
18%
9%
Source of Revenue 2005
50%
36%
14%
CORPORATE AND COMMERCIAL BANKING
During the year, the Bank maintained market dominance in corporate and commercial banking, despite aggressive competition andthe challenging economic environment. This was achieved primarily through the loyalty of our customers and the commitment,hard work and dedication of our relationship managers. We intensified our focus on growing market share by both deepening ourcustomer relationships with a greater share of their business, and developing new relationships with select growth companies, onmutually beneficial terms.
Our experienced commercial banking professionals were successful in facilitating growth in the Bank's commercial/corporate loanand deposit portfolios, across a broad range of industry segments. We provided significant levels of financing to the tourism,telecommunications, manufacturing, transportation, distribution and agricultural sectors, through various structured financingarrangements.
Also, we fulfilled our mandate as joint lead arranger for a major syndicated financing facility in the telecommunications sector. Ourextensive corporate finance and capital market capabilities, coupled with our strong capitalization and sizable lending capacity,allowed us to work successfully with our syndicated partners in putting together this landmark US$350 million transaction.
Recognizing the significant impact of the hotel industry on Jamaica's economic development, the Bank continues to be the leadingfinancier to this industry, our expertise in structuring large scale hotel deals being unparalleled in the local market. In 2005, wefinanced two major hotel projects of more than US$100 million, resulting in the addition of over 850 rooms to the country's hotelroom stock and the refurbishing and upgrading of over 700 rooms.

2005 Scotiabank Annual Report
13
The President’s Council: Standing from left to right: Rosemarie Voordouw - Director, Employee Communications & Consultations; H. Wayne Powell - ExecutiveVice President, Retail Sales Management; Stacie-Ann Wright - Executive Vice President & Chief Financial Officer; David Noël - Senior Vice President/SeniorLegal Counsel & Corporate Secretary; Rosemarie Pilliner - Executive Vice President, Operations & Service Delivery; Audrey Tugwell Henry - Senior VicePresident, Retail & Electronic Banking; Michael Jones - Senior Vice President, Human Resources; Henri Bourdeau - Vice President, Risk Management;Wayne Hewitt - Vice President, Corporate & Commercial Banking and sitting, William E. Clarke - President & Chief Executive Officer.
* Restated for Bonus issue
0
500
1,000
1,500
2,000
2,500
3,000
3,500
4,000
2001 2002* 2003 2004 2005
0
4,000
8,000
12,000
16,000
0
20
40
60
0
2,000
4,000
6,000
8,000
10,000
2,000
0
4,000
8,000
12,000
16,000
20,000
24,000
28,000
2003
0.00
1.00
2.00
3.00
20.00
0
0.00
10.00
20.00
30.00
40.00
2001 2002* 2003 2004 2005
%
Dividend Paid Per Stock Unit
2001* 2002* 2003* 2004* 20050.00
0.40
0.80
1.20
0.500.57
0.880.925 1.00
$$
* Restated for Bonus issue
Return on Assets
0.0
1.0
2.0
3.0
4.0
2001* 2002* 2003 2004 2005
3.13 3.04
3.703.48
3.21
%
*Adoption year for IFRS*Adoption year for IFRS *Adoption year for IFRS
Expenses
2001 2002* 2003 2004 2005
* Adoption year for IFRS
0
4,000
6,000
8,000
10,000
5,003 5,303
7,153
8,5339,197$ Millions
Total Assets
2001 2002* 2003 2004 2005
40,000
80,000
120,000
160,000
200,000
0
$ Millions
102,564127,367
147,653168,168
* Adoption year for IFRS
183,461
Profit Per Employee
0
1,000
2,000
3,000
4,000 $ Thousands
1,8302,144
2,948 3,142 3,193
2001 2002* 2003 2004 2005
* Adoption year for IFRS
Dividends
2001 2002 2003 2004 2005
500
1,000
1,500
2,000
2,500
3,000
3,500 $ Millions
1,4641,683
2,561 2,7082,927
Dividend Payout Ratio
*Adoption year for IFRS *Adoption year for IFRS
*Adoption year for IFRS*Adoption year for IFRS
*Adoption year for IFRS
*Adoption year for IFRS *Adoption year for IFRS
2001 2002* 2003 2004 20050.00
10.00
30.00
40.00
50.00
60.00
43.4946.94 46.24
49.7445.54
%
Productivity Ratio
2001 2002* 2003 2004 2005
54.1049.97 49.46 51.08 52.47
%
0
2,000
4,000
6,000
8,000
10,000
2001 2002* 2003 2004 2005
Revenue Per Employee
5,481 5,825
7,7668,938 9,362$ Thousands
Stockholders Equity
2001 2002* 2004 2005
11,88114,066
17,65120,605
23,525$ Millions
Profit Before Tax
2001 2002* 2003 2004 2005
4,4185,309
7,3078,173 8,330
$ Millions
Other Income
1,784 1,853
2,433 2,595
3,463$ Millions
Net Interest Income
2001 2002* 2003 2004 2005
$ Millions
7,8418,759
12,027
14,111 14,064
2001* 2002* 2003 2004 2005
26,156
39,421
48,07553,460
57,649
$ Millions
0
10,000
20,000
30,000
40,000
50,000
60,000
70,000
Total Loans
2001 2002 2003 2004 20050
20,000
40,000
60,000
80,000
100,000
120,000 $ Millions
67,80976,948
87,06798,811
107,280
Total Deposits
Earnings Per Stock Unit
2001* 2002* 2003* 2004* 2005
1.101.32
1.86 2.00 2.01
32.53 34.2229.85
26.3329.16
Return on Average Equity
Allocation of Revenue 2005
35%
35%
8%5%11%
13%
18%
9%
Source of Revenue 2005
50%
36%
14%
* Restated for Bonus issue
0
500
1,000
1,500
2,000
2,500
3,000
3,500
4,000
2001 2002* 2003 2004 2005
0
4,000
8,000
12,000
16,000
0
20
40
60
0
2,000
4,000
6,000
8,000
10,000
2,000
0
4,000
8,000
12,000
16,000
20,000
24,000
28,000
2003
0.00
1.00
2.00
3.00
20.00
0
0.00
10.00
20.00
30.00
40.00
2001 2002* 2003 2004 2005
%
Dividend Paid Per Stock Unit
2001* 2002* 2003* 2004* 20050.00
0.40
0.80
1.20
0.500.57
0.880.925 1.00
$$
* Restated for Bonus issue
Return on Assets
0.0
1.0
2.0
3.0
4.0
2001* 2002* 2003 2004 2005
3.13 3.04
3.703.48
3.21
%
*Adoption year for IFRS*Adoption year for IFRS *Adoption year for IFRS
Expenses
2001 2002* 2003 2004 2005
* Adoption year for IFRS
0
4,000
6,000
8,000
10,000
5,003 5,303
7,153
8,5339,197$ Millions
Total Assets
2001 2002* 2003 2004 2005
40,000
80,000
120,000
160,000
200,000
0
$ Millions
102,564127,367
147,653168,168
* Adoption year for IFRS
183,461
Profit Per Employee
0
1,000
2,000
3,000
4,000 $ Thousands
1,8302,144
2,948 3,142 3,193
2001 2002* 2003 2004 2005
* Adoption year for IFRS
Dividends
2001 2002 2003 2004 2005
500
1,000
1,500
2,000
2,500
3,000
3,500 $ Millions
1,4641,683
2,561 2,7082,927
Dividend Payout Ratio
*Adoption year for IFRS *Adoption year for IFRS
*Adoption year for IFRS*Adoption year for IFRS
*Adoption year for IFRS
*Adoption year for IFRS *Adoption year for IFRS
2001 2002* 2003 2004 20050.00
10.00
30.00
40.00
50.00
60.00
43.4946.94 46.24
49.7445.54
%
Productivity Ratio
2001 2002* 2003 2004 2005
54.1049.97 49.46 51.08 52.47
%
0
2,000
4,000
6,000
8,000
10,000
2001 2002* 2003 2004 2005
Revenue Per Employee
5,481 5,825
7,7668,938 9,362$ Thousands
Stockholders Equity
2001 2002* 2004 2005
11,88114,066
17,65120,605
23,525$ Millions
Profit Before Tax
2001 2002* 2003 2004 2005
4,4185,309
7,3078,173 8,330
$ Millions
Other Income
1,784 1,853
2,433 2,595
3,463$ Millions
Net Interest Income
2001 2002* 2003 2004 2005
$ Millions
7,8418,759
12,027
14,111 14,064
2001* 2002* 2003 2004 2005
26,156
39,421
48,07553,460
57,649
$ Millions
0
10,000
20,000
30,000
40,000
50,000
60,000
70,000
Total Loans
2001 2002 2003 2004 20050
20,000
40,000
60,000
80,000
100,000
120,000 $ Millions
67,80976,948
87,06798,811
107,280
Total Deposits
Earnings Per Stock Unit
2001* 2002* 2003* 2004* 2005
1.101.32
1.86 2.00 2.01
32.53 34.2229.85
26.3329.16
Return on Average Equity
Allocation of Revenue 2005
35%
35%
8%5%11%
13%
18%
9%
Source of Revenue 2005
50%
36%
14%

2005 Scotiabank Annual Report
14
CORPORATE AND COMMERCIAL BANKING CONT’D
Over the years, we have shared a mutually rewardingrelationship with the Port Authority of Jamaica (PAJ). In 2004,the PAJ embarked on the expansion and upgrading of theKingston Container Terminal (KCTPhase 4), which has beensuccessfully completed. ScotiabankJamaica was able to leverage itsinternational linkages withScotiabank in Canada to assist inproviding a customized solutionfor a project the size of KCT Phase4. As a result, PAJ now boasts oneof the most modernized trans-shipment terminals in the region.Plans are being prepared toundertake Phase 5 of thisredevelopment.
Scotiabank has been equally active in facilitating smallerbusiness opportunities. During the year, the Bank continuedto show its unreserved commitment to nation building andprivate enterprise through ongoing support to small andmedium size enterprises. Through the Scotiabank Jamaica
Production Fund, some J$800million was disbursed to 37businesses in the manufacturingsector, at a subsidized interest rateof 9.5%. Financing was alsoprovided to several smaller typeindustries, such as transportation,clothing and textile, resulting inan increase in the number of busesutilized for the transportation oftourists, as well as the addition ofstate-of-the-art equipment tofacilitate computerized embroider-ing on t-shirts.
Report to Shareholders
Jamaica’s largest and one of the newest hotels on the North Coast is Club Riu Hotel, Ocho Rios for which Scotiabank provided the financing. Here, CarolLogan, Senior Relationship Manager, Corporate & Commercial Banking Center, Scotiabank, and General Manager Frank Sondern are seen in discussions.
A view of the impressive lobby area of the Club Riu Hotel, Ocho Rios.
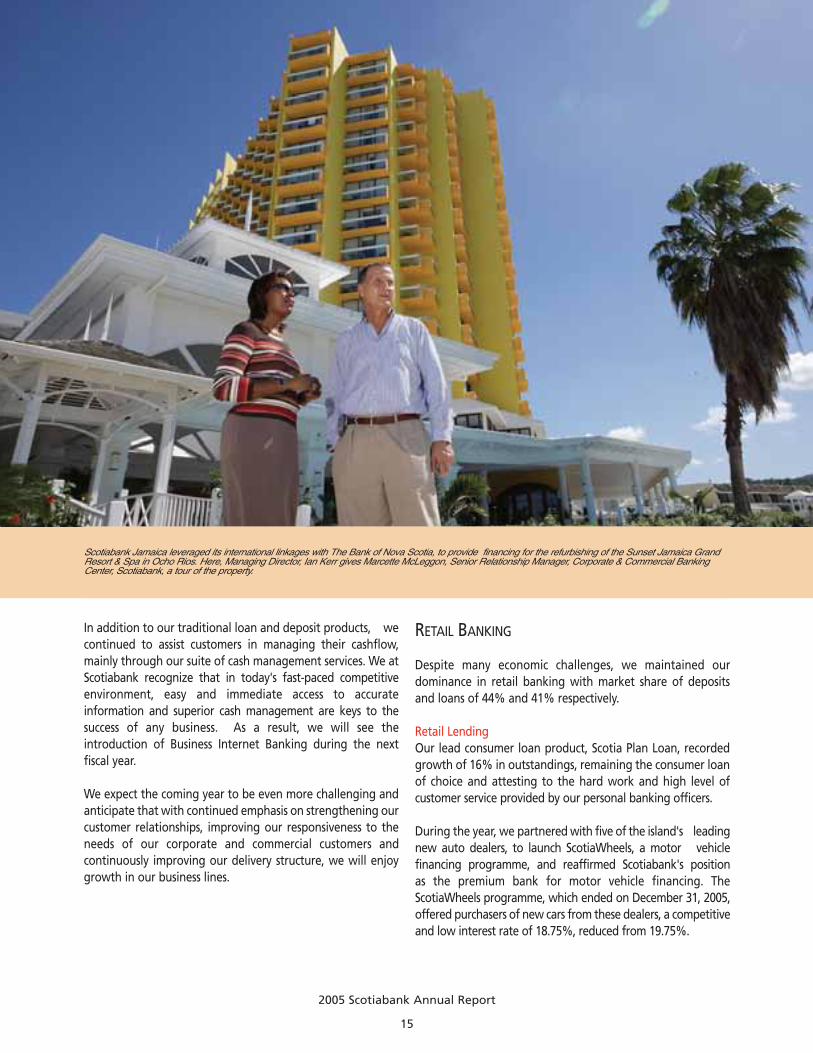
2005 Scotiabank Annual Report
15
Scotiabank Jamaica leveraged its international linkages with The Bank of Nova Scotia, to provide financing for the refurbishing of the Sunset Jamaica GrandResort & Spa in Ocho Rios. Here, Managing Director, Ian Kerr gives Marcette McLeggon, Senior Relationship Manager, Corporate & Commercial BankingCenter, Scotiabank, a tour of the property.
In addition to our traditional loan and deposit products, wecontinued to assist customers in managing their cashflow,mainly through our suite of cash management services. We atScotiabank recognize that in today's fast-paced competitiveenvironment, easy and immediate access to accurateinformation and superior cash management are keys to thesuccess of any business. As a result, we will see theintroduction of Business Internet Banking during the nextfiscal year.
We expect the coming year to be even more challenging andanticipate that with continued emphasis on strengthening ourcustomer relationships, improving our responsiveness to theneeds of our corporate and commercial customers andcontinuously improving our delivery structure, we will enjoygrowth in our business lines.
RETAIL BANKING
Despite many economic challenges, we maintained ourdominance in retail banking with market share of depositsand loans of 44% and 41% respectively.
Retail LendingOur lead consumer loan product, Scotia Plan Loan, recordedgrowth of 16% in outstandings, remaining the consumer loanof choice and attesting to the hard work and high level ofcustomer service provided by our personal banking officers.
During the year, we partnered with five of the island's leadingnew auto dealers, to launch ScotiaWheels, a motor vehiclefinancing programme, and reaffirmed Scotiabank's position as the premium bank for motor vehicle financing. TheScotiaWheels programme, which ended on December 31, 2005,offered purchasers of new cars from these dealers, a competitiveand low interest rate of 18.75%, reduced from 19.75%.

2005 Scotiabank Annual Report
16
ScotiaLine Gold is an innovative solution that providescustomers with electronic access to their ScotiaLine product,via the MasterCard and MultiLink ABM networks, 24 hours perday. In addition, customers can continue to use theirpersonalized ScotiaLine cheques. During the year, ourScotiaLine portfolio recorded growth of 28.6% inoutstanding balances.
Year over year, there was overall growth in our savingsportfolio. Our youth accounts, ScotiaFirst & ScotiaWise, grewby 11.8 % and 13.6 % respectively. This was due mainly toour School Savings Promotion, which targeted potential andexisting savers in these two youth savings accounts. Theobjective of this promotion was to encourage our youth tostart saving at an early age.
During the year, we also looked at ways to provide benefits toour adult savers. The 'Gain A Million' promotion was launchedin August, 2005, and ends on April 30, 2006. During the
promotional period, customers will have the opportunity towin up to $3 million.
We continued to provide discounted fees and free services toour customers 55 years and over. Balances for the ScotiaPlus 55portfolio increased by 8.5%.
ELECTRONIC BANKING Credit CardsScotiabank has remained the market leader in the local creditcard market, offering the widest range of cards to meetvarious customer needs. We extended our credit card line withthe Platinum MasterCard last year, bringing our total offer toseven distinct credit cards to suit our customers' diverselifestyles. The Platinum MasterCard portfolio has been steadilygrowing, over 100% year over year. Our Magna MasterCard CreditCard is the market leader, with more than 44% of our credit cardcustomers holding a Magna Card, a 12% growth since thebeginning of the financial year.
The current capacity of the Kingston Container Terminal has doubled, with the recent completion of Phase 4 of the expansion project. Here, representatives ofAPM Terminals (Ja.) Limited, responsible for the expansion and Scotiabank, financiers, look at the drawings for Phase 5 . From left to right are BrianCunningham - Vice President, Global Risk Management Caribbean, Scotiabank Toronto; Peter Ford - General Manager APM Terminals (Ja.) Limited, MarcetteMcLeggon - Senior Relationship Manager, Corporate & Commercial Banking Center, Scotiabank Jamaica; Wilma Johnson - Client Services Manager, APMTerminals; Winston Boothe - Senior Vice President Finance & Administration, Port Authority; Wayne Hewitt - Vice President, Corporate & Commercial BankingCenter, Scotiabank Jamaica and Robert Pitfield - Chairman, Scotiabank Jamaica.

Report to Shareholders
2005 Scotiabank Annual Report
17
Barrington Chishlom, Manager, New Kingston branch poses with Kenneth Loshusan owner of the Barbican Center which houses the Loshusan Supermarket inaddition to 9 other shops, a Scotiabank financed project. The Center was officially opened on September 8, 2005 by William Clarke, President & CEO ofScotiabank Jamaica.
Merchant ServicesSolutions to our merchants, in particular e-commerce solutionsto facilitate conducting business online, were expandedduring the year. The Inland Revenue Department was amongthe many merchants we partnered with to provide e-paymentsystems for their customers. This partnership marked a newbeginning for Jamaicans, who can now pay property taxes andvarious other taxes and fees online, using their credit cards.
There was steady growth in the merchant base, and asignificant 24% increase in the total revenue from credit cardpoint of sale transactions. Debit point of sale transactionsgrew by an impressive 1,340%.
ScotiaCard ScotiaCard is now positioned as the umbrella vehicle forcustomers to conduct their banking safely, conveniently andquickly, using our reliable self-service Banking channels –Internet Banking, TeleScotia, ABMs, point of sale and in-
branch banking. As ScotiaCard is the nucleus for driving usageof these channels, we launched a ScotiaCard advertisingcampaign, urging customers to SIMPLIFY their lives usingScotiaCard. This campaign was well received, in conjunctionwith several internal initiatives promoting ScotiaCard,resulting in the issuance of over 145,000 ScotiaCards this year.ScotiaCard's share of the Debit Card Market is nowapproximately 50%. The percentage of our active customerbase now using ScotiaCard to access the self-service bankingchannels also grew by close to 60%.
Automated Banking MachinesDuring the year, we added 12 machines to the network, whichbrings the total number of Scotiabank ABMs to 155, adding ahigher level of flexibility and concurrence. ABMs are thepreferred choice for our customers to do their routinetransactions, as demonstrated by the growth in the numberof transactions.

2005 Scotiabank Annual Report
18
Internet BankingMany of our customers are enjoying the convenience ofbanking on line with Scotiabank Internet Banking. To date,we have signed up some 20,000 customers and 87 billpayment merchants, an increase of 50% and 40% respectivelyover the past year.
TeleScotiaTeleScotia continues to be attractive to many of ourcustomers, due to its convenience and reliability. This isevidenced by an 11% increase in the number of transactions.To date, more than 100 merchants accept bill payments viaTeleScotia. We have an active customer base of 41,000.
Business Internet BankingOur new online banking solution for commercial customers,Business Internet Banking, was being piloted for launch inJanuary 2006. This solution will offer, among other services,information on bank accounts, direct deposit payments,consolidated cash plans and cheque reconciliationfunctionalities. Eventually, all customers on the current CashManagement Services platform will be transferred to theBusiness Internet Banking platform. This will assist ourcommercial customers to enhance their working capital,improve information flow and simplify administration.
Payment CardScotiabank, recognizing the need for a safe and convenientavenue for employers to make payroll payments toemployees, has designed the QuickPay card - an electronicpayroll card. In January 2006, employees will be able to quicklyand conveniently access their salaries at over 300 ABMs orutilize the card at 11,000 point of sale terminals islandwide.
BANKING OPERATIONS
We concluded the implementation of the InternationalBanking Platform (IBP) within our branch network, a cutting-edge technology, which realized our objectives to shift fromtraditional banking methods to a modern service arena.
This initiative focused on needs-based selling, personalizedservice, relationship building and the delivery of 'one-stop'shopping experiences for all customers. Our tellers are able toefficiently expedite transactions by accessing the CustomerInformation File data base, which comprehensively captures
demographic, account and personal information on allScotiabank Jamaica customers. The Interactive ApplicationProcess, complements the Interactive Telling Platform, byautomating application-taking for our suite of bankingproducts: viz-a-viz, credit cards, loans, lines of credit and retailaccounts.
Real EstateWe improved on our real estate aesthetics by refurbishing andrenovating a number of our branches, which enhanced ourmerchandising approach to encompass the sales and serviceculture. The recent relocation of our Junction Branch to amore spacious and attractive locale, is indicative of ourcommitment to ensuring a mix of comfort and superior service.
Branch rationalization is ongoing, as we strategically positionour branches to leverage market opportunities. We closed ourAppleton Sub-branch on May 31, 2005, and the transition tothe main branch, Santa Cruz was seamless, with customersutilizing the alternate delivery channels to effect bankingtransactions. The Appleton Sub-branch was established toprimarily facilitate cheque encashment.
HUMAN RESOURCES
The year 2005 was a successful one for the Bank's HumanResources function, with various strategically relevant issuesbeing brought to completion. Our focus was in concert withthe HR vision “adding value on the inside, creating value onthe outside.”
Recruitment and TrainingTo assure the availability of resources to support turnover in keybusiness lines and support areas, we continued our focus on talentidentification and additional development interventions.Succession Planning was cascaded to lower levels to allow theidentification of a wider pool for earlier development.
We improved our predictive recruitment capability byimplementing a wider range of psychometric tools.
Training became increasingly competency-based, and newinitiatives have either been implemented or planned toachieve the delivery of an exceptional customer serviceexperience, management of the employee experience, orcareer development and leadership. We have also expanded
Report to Shareholders

2005 Scotiabank Annual Report
19
on-line training opportunities to our staff to supplementtraining currently offered at our Training Centre. Mandatorycross-training was also implemented across the BNSJ Group.
Employee SatisfactionHR technology also saw improvement through the additionalmining of data to support HR metrics. Based on an internalstaff survey, employee satisfaction improved year over year,from 72% to 77%, and the participation rate increased from77% to 82%, reflecting increased emphasis on communicationand employee relationship issues.
Wellness and Staff WelfareWellness initiatives continued, including a very well receivedtraining programme for culinary staff on Professional Cookingfor Healthy Living. Our new HR intranet also includes a HealthRisk Assessment resource.
New efforts took place to increase 'social capital'. Our mainrecreational facility was re-branded and arrangements forsimilar facilities made for rural area branch staff. OurEmployee Annual General Meeting (EAGM) and Fun Day werewell supported by our staff from across the island. TheEmployee Share Ownership Programme maintained a healthy
My association with Scotiabank began in 1995 when I received a scholarship from the Bank to complete my first degree in Management Studies andEconomics at the University of the West Indies (UWI). I graduated from this programme with First Class Honors.
My career at the Bank started at the East Queen Street branch where I received training as a Consumer Credit Officer. I then relocated to the Ocho Rios branchin 1998, where I worked as a Personal Banking Officer for two years. I was later promoted to the position of Senior Personal Banking Officer at the Sam SharpeSquare (Montego Bay) branch, and later a similar post at Hagley Park Road branch. I was subsequently trained in Commercial Credit. I have acted as ReliefBranch Manager at the Port Antonio and Oxford Road branches.
In October 2005, I was promoted to my current post – Assistant Manager, Personal Banking at the New Kingston Branch.
Eight years at Scotiabank, for me, has been very fulfilling and rewarding. There is scope for upward mobility within the organization and the Bank provides training opportunities to assist employees to enhance their career development, as evidenced by my own career growth and advancement. I wouldcertainly recommend Scotiabank as a great place to work.
Mr. Andre Harvey

20
2005 Scotiabank Annual Report
Mrs. Christine Wilson
Wellness and Staff Welfare (cont’d)
participation level with an increase from 74% in fiscal 2004 to83% in fiscal 2005. Employees attest to the significant benefitsgained from participation in this programme from year toyear.
Several retirement-related initiatives were executed duringthe year. Our first pensioners' luncheon was held in the firstquarter of 2005 and was well received. This was followed up
later in the year with a pre-retirement seminar, speciallygeared towards employees who are near retirement. Greaterattention is being placed on assisting our staff to prepare forthe future from early on in their careers.
Union negotiations with the Bustamante Industrial TradeUnion for full-time and part-time employees were successfullyconcluded, culminating in a new three-year CollectiveBargaining Agreement.
To me, Scotiabank represents an institution where there are opportunities for employees to enhance their individual development and build successfulcareers. My career with the Bank started at the Santa Cruz branch as a teller in April 1997. In 1999, I was transferred to the Mandeville branch at myrequest in order to complete my Bachelor’s Degree at Northern Caribbean University (NCU). At that time, Scotiabank had also enhanced its educational
assistance to staff and I am very proud to say that I was one of the first persons to receive a scholarship to NCU from the Bank. I graduated in 2003 MagnaCum Laude. I recently completed my MBA with Nova Southeastern University and hope to further my studies in Human Resource Management.
Receiving the scholarship afforded me the opportunity to receive formal training in most functional areas of the Bank. This, coupled with on the job training,has allowed me to improve the quality of service that I offer to our customers in my current post as Relationship Officer at the Mandeville branch.
Scotiabank has shown me what it means for a company to be truly customer centric and what it takes to be a successful team player in any organisation.Being customer focused is the key to doing business in such a dynamic and competitive market place and I will always endeavour to put our customers first.
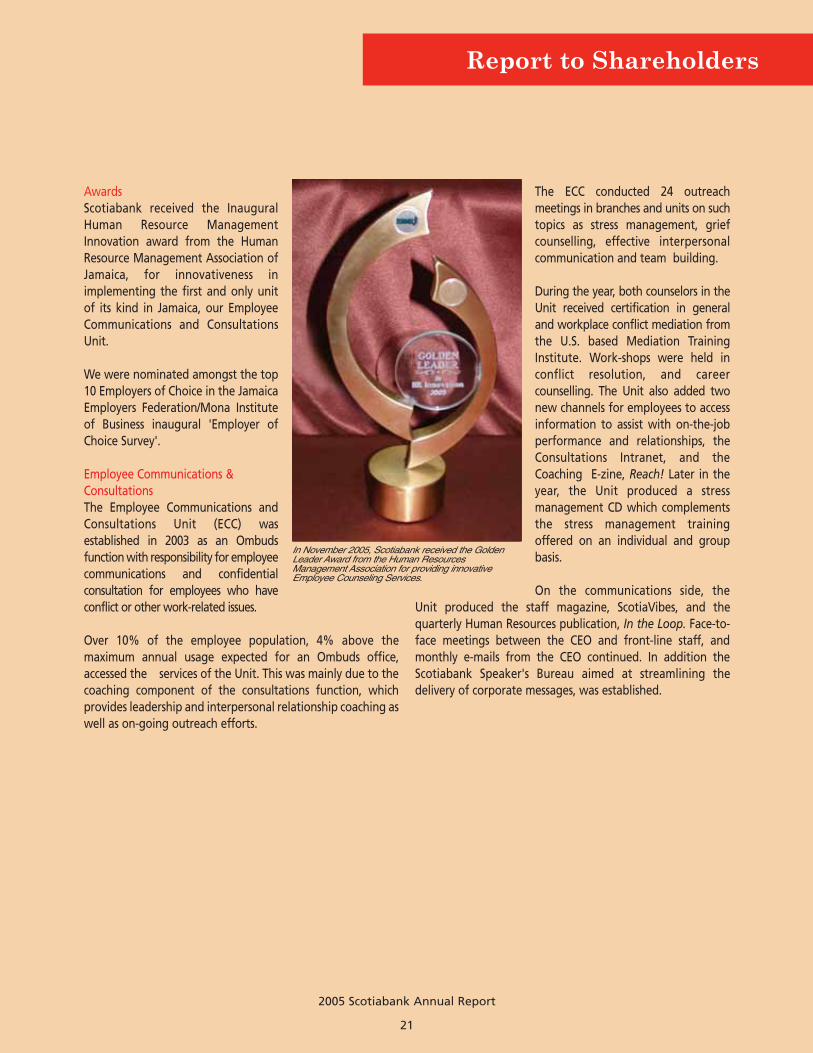
2005 Scotiabank Annual Report
21
AwardsScotiabank received the InauguralHuman Resource ManagementInnovation award from the HumanResource Management Association ofJamaica, for innovativeness inimplementing the first and only unitof its kind in Jamaica, our EmployeeCommunications and ConsultationsUnit.
We were nominated amongst the top10 Employers of Choice in the JamaicaEmployers Federation/Mona Instituteof Business inaugural 'Employer ofChoice Survey'.
Employee Communications &ConsultationsThe Employee Communications andConsultations Unit (ECC) wasestablished in 2003 as an Ombudsfunction with responsibility for employeecommunications and confidentialconsultation for employees who haveconflict or other work-related issues.
Over 10% of the employee population, 4% above themaximum annual usage expected for an Ombuds office,accessed the services of the Unit. This was mainly due to thecoaching component of the consultations function, whichprovides leadership and interpersonal relationship coaching aswell as on-going outreach efforts.
The ECC conducted 24 outreachmeetings in branches and units on suchtopics as stress management, griefcounselling, effective interpersonalcommunication and team building.
During the year, both counselors in theUnit received certification in generaland workplace conflict mediation fromthe U.S. based Mediation TrainingInstitute. Work-shops were held inconflict resolution, and careercounselling. The Unit also added twonew channels for employees to accessinformation to assist with on-the-jobperformance and relationships, theConsultations Intranet, and theCoaching E-zine, Reach! Later in theyear, the Unit produced a stressmanagement CD which complementsthe stress management trainingoffered on an individual and groupbasis.
On the communications side, the Unit produced the staff magazine, ScotiaVibes, and thequarterly Human Resources publication, In the Loop. Face-to-face meetings between the CEO and front-line staff, andmonthly e-mails from the CEO continued. In addition theScotiabank Speaker's Bureau aimed at streamlining thedelivery of corporate messages, was established.
Report to Shareholders
In November 2005, Scotiabank received the GoldenLeader Award from the Human ResourcesManagement Association for providing innovativeEmployee Counseling Services.

2005 Scotiabank Annual Report
22
Our Subsidiaries
Scotia Jamaica Building Society
Scotia Jamaica Life Insurance Co. Ltd.
Scotia Investments
Over the years, the contribution of our Subsidiaries to theGroup’s net profit has grown steadily. This year, their combined
contribution stands at 24.4% as shown below.
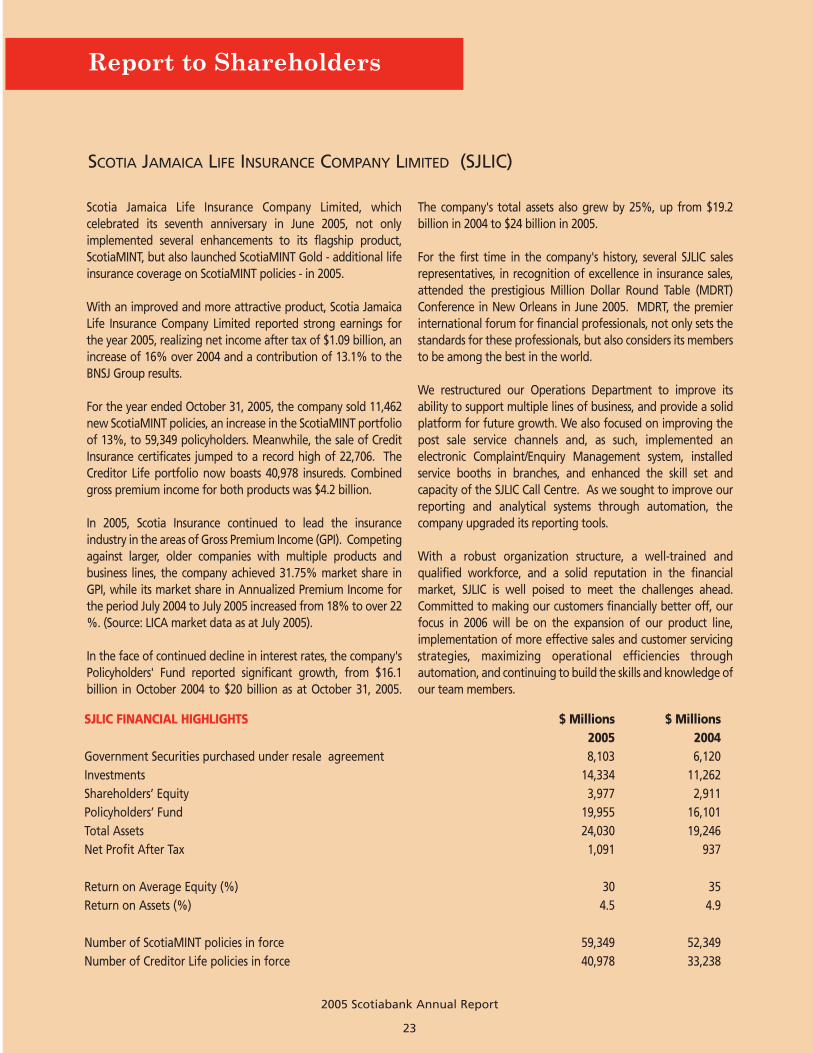
2005 Scotiabank Annual Report
23
Scotia Jamaica Life Insurance Company Limited, whichcelebrated its seventh anniversary in June 2005, not only implemented several enhancements to its flagship product,ScotiaMINT, but also launched ScotiaMINT Gold - additional lifeinsurance coverage on ScotiaMINT policies - in 2005.
With an improved and more attractive product, Scotia JamaicaLife Insurance Company Limited reported strong earnings forthe year 2005, realizing net income after tax of $1.09 billion, anincrease of 16% over 2004 and a contribution of 13.1% to theBNSJ Group results.
For the year ended October 31, 2005, the company sold 11,462new ScotiaMINT policies, an increase in the ScotiaMINT portfolioof 13%, to 59,349 policyholders. Meanwhile, the sale of CreditInsurance certificates jumped to a record high of 22,706. TheCreditor Life portfolio now boasts 40,978 insureds. Combinedgross premium income for both products was $4.2 billion.
In 2005, Scotia Insurance continued to lead the insuranceindustry in the areas of Gross Premium Income (GPI). Competingagainst larger, older companies with multiple products andbusiness lines, the company achieved 31.75% market share inGPI, while its market share in Annualized Premium Income forthe period July 2004 to July 2005 increased from 18% to over 22%. (Source: LICA market data as at July 2005).
In the face of continued decline in interest rates, the company'sPolicyholders' Fund reported significant growth, from $16.1 billion in October 2004 to $20 billion as at October 31, 2005.
The company's total assets also grew by 25%, up from $19.2billion in 2004 to $24 billion in 2005.
For the first time in the company's history, several SJLIC sales representatives, in recognition of excellence in insurance sales,attended the prestigious Million Dollar Round Table (MDRT)Conference in New Orleans in June 2005. MDRT, the premierinternational forum for financial professionals, not only sets thestandards for these professionals, but also considers its membersto be among the best in the world.
We restructured our Operations Department to improve its ability to support multiple lines of business, and provide a solidplatform for future growth. We also focused on improving thepost sale service channels and, as such, implemented an electronic Complaint/Enquiry Management system, installedservice booths in branches, and enhanced the skill set and capacity of the SJLIC Call Centre. As we sought to improve ourreporting and analytical systems through automation, the company upgraded its reporting tools.
With a robust organization structure, a well-trained and qualified workforce, and a solid reputation in the financial market, SJLIC is well poised to meet the challenges ahead.Committed to making our customers financially better off, ourfocus in 2006 will be on the expansion of our product line, implementation of more effective sales and customer servicingstrategies, maximizing operational efficiencies through automation, and continuing to build the skills and knowledge ofour team members.
Report to Shareholders
SCOTIA JAMAICA LIFE INSURANCE COMPANY LIMITED (SJLIC)
SJLIC FINANCIAL HIGHLIGHTS $ Millions $ Millions2005 2004
Government Securities purchased under resale agreement 8,103 6,120 Investments 14,334 11,262 Shareholders’ Equity 3,977 2,911 Policyholders’ Fund 19,955 16,101 Total Assets 24,030 19,246 Net Profit After Tax 1,091 937
Return on Average Equity (%) 30 35 Return on Assets (%) 4.5 4.9
Number of ScotiaMINT policies in force 59,349 52,349 Number of Creditor Life policies in force 40,978 33,238
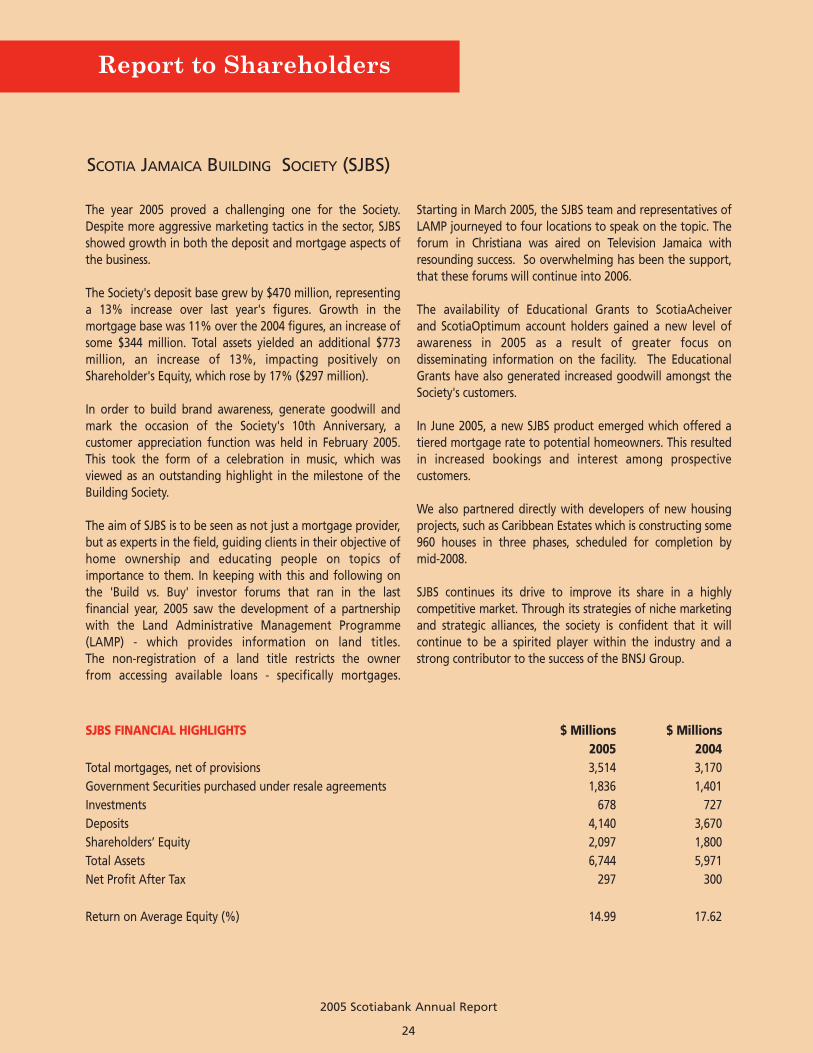
Report to Shareholders
2005 Scotiabank Annual Report
24
The year 2005 proved a challenging one for the Society.Despite more aggressive marketing tactics in the sector, SJBSshowed growth in both the deposit and mortgage aspects ofthe business.
The Society's deposit base grew by $470 million, representinga 13% increase over last year's figures. Growth in the mortgage base was 11% over the 2004 figures, an increase ofsome $344 million. Total assets yielded an additional $773 million, an increase of 13%, impacting positively onShareholder's Equity, which rose by 17% ($297 million).
In order to build brand awareness, generate goodwill andmark the occasion of the Society's 10th Anniversary, a customer appreciation function was held in February 2005.This took the form of a celebration in music, which wasviewed as an outstanding highlight in the milestone of theBuilding Society.
The aim of SJBS is to be seen as not just a mortgage provider,but as experts in the field, guiding clients in their objective ofhome ownership and educating people on topics of importance to them. In keeping with this and following onthe 'Build vs. Buy' investor forums that ran in the last financial year, 2005 saw the development of a partnershipwith the Land Administrative Management Programme(LAMP) - which provides information on land titles.The non-registration of a land title restricts the owner from accessing available loans - specifically mortgages.
Starting in March 2005, the SJBS team and representatives ofLAMP journeyed to four locations to speak on the topic. Theforum in Christiana was aired on Television Jamaica withresounding success. So overwhelming has been the support,that these forums will continue into 2006.
The availability of Educational Grants to ScotiaAcheiver and ScotiaOptimum account holders gained a new level of awareness in 2005 as a result of greater focus ondisseminating information on the facility. The EducationalGrants have also generated increased goodwill amongst theSociety's customers.
In June 2005, a new SJBS product emerged which offered atiered mortgage rate to potential homeowners. This resultedin increased bookings and interest among prospectivecustomers.
We also partnered directly with developers of new housingprojects, such as Caribbean Estates which is constructing some960 houses in three phases, scheduled for completion by mid-2008.
SJBS continues its drive to improve its share in a highly competitive market. Through its strategies of niche marketingand strategic alliances, the society is confident that it will continue to be a spirited player within the industry and astrong contributor to the success of the BNSJ Group.
SCOTIA JAMAICA BUILDING SOCIETY (SJBS)
SJBS FINANCIAL HIGHLIGHTS $ Millions $ Millions 2005 2004
Total mortgages, net of provisions 3,514 3,170Government Securities purchased under resale agreements 1,836 1,401Investments 678 727Deposits 4,140 3,670Shareholders’ Equity 2,097 1,800Total Assets 6,744 5,971Net Profit After Tax 297 300
Return on Average Equity (%) 14.99 17.62

2005 Scotiabank Annual Report
25
Scotia Investments' main objective is to provide for theinvestment needs of our customer. This need was addressed bythe creation of an investment sales team to offer investment solutions to our customers across the island. The role of theinvestment specialist is to strengthen and deepenrelationships with our customers, offering a holistic approachto investment management, via access to a range ofinvestment options specifically suited to their individual needs.
We plan even more changes in 2006, as we gear the companyto be a fully functional securities, trading and investment salesentity while increasing our market presence.
Scotia Investments achieved a 20% increase over 2004, in totalrepurchase agreements (repos), with total client portfoliomoving from $25 billion in 2004 to $30 billion as at October 31, 2005. Interest rates were generally low and stable during the fiscal year; and as a result there was a reduction in revenues earned from 'repo' sales ($158.8 millionin 2004 versus $120.3 million in 2005). However, revenue fromMutual Fund sales increased by 50% (from $9.5 million in2004, to $14.2 million in 2005). Scotia Investments achievedprofit after tax of $206 million - a reduction of $38 million or16% below 2004.
Scotia Investments' securities trading activities in 2005, delivered a 28.94% increase in non-interest revenue. ThePension and Asset Management Unit experienced growth inrevenue of 7.87% over 2004, while simultaneously increasingassets under management, moving from J$17.6 billion toJ$19.6 billion, an 11.36% increase. The Trust & Registrar Unitcontinued to grow through the addition of new escrowaccounts with the main focus being geared towards corporateaccounts.
The Scotia Investments team is adequately armed and motivated to become a major player in the investment marketplace. The focus for 2006 will be on building brand awarenessand brand equity for our company. Additionally, the company's initiatives include the restructuring of its operational efficiencies to improve productivity and service tointernal and external customers. This focus will serve to effectively offer full support to field sales officers. In ourefforts to make our customers financially better off, Scotia Investments will generate research and analyses fordevelopment of products and services in 2006.
SCOTIA JAMAICA INVESTMENT MANAGEMENT LIMITED (SCOTIA INVESTMENTS)
SJIM FINANCIAL HIGHLIGHTS $ Millions $ Millions2005 2004
BOJ Securities purchased under resale agreements 17,288 18,784Investments 815 728Shareholders' Equity 1,310 1,107Total Assets 18,892 20,741Net Profit After Tax 206 244Return on Average Equity (%) 16.84 23.02

26
Micro Enterprise Financing Limited continues to fulfil itsmandate to assist individuals to achieve their dream ofentrepreneurship. These individuals have defied the odds andare recording success in their small business ventures.
The number of active clients have grown from 939 inSeptember 2004 to 1,365 in September 2005, a 45.3% growthin the portfolio. The growth in clientele resulted from thedeepening of lending in existing inner city communities, aswell as the opening of services in new rural and urbancommunities.
In June 2005, the year the company opened its first ruralbranch office in the parish of St. Elizabeth. This will assist indiversification of the loan portfolio, by mixing more agri-business loans with retail and wholesale trade activities.
During the first four months of operation, disbursement of$2,800,000 in loan funds was made to 88 clients.
MEFL clients have in excess of $7,780,000 in combinedsavings at Scotiabank, allowing them a sense of security andwealth creation. Funds can be used in the case of illness,family emergencies, natural disasters, or to assist with loanrepayment in slow business periods.
Five major factors explain the success of MEFL to date: thework of the Board of Directors, the strong leadership anddedication of the management team; the ongoing traininggiven to all members of staff; growth in small entrepreneurs;and importantly, the commitment of all employees,stakeholders and sponsors to the mission, goals and vision ofMicro Enterprise Financing Limited.
Report to Shareholders
With the opening of its first office outside of Kingston, the Micro Enterprise Financing Limited (MEFL) is now providing financing for agricultural projects. Here, Executive Director of MEFL, Debra Williams (center) visits with two sorrel farmers Goston Murray (left) and Alburn Bromfield in Brinkley District, Nain,St. Elizabeth. The men are among the first set of farmers to receive a loan through the Santa Cruz office.
MICRO ENTERPRISE FINANCING LIMITED (MEFL)
MEFL FINANCIAL HIGHLIGHTS
Loans disbursed $70.6 millionLoans to Women 79%Average loan size $21,554Active Clients 1,365New rural branch June 2005Retention rate 78%Repayment rate 97%Portfolio at risk 5.91%
2005 Scotiabank Annual Report

2005 Scotiabank Annual Report
27
Over the past year, Scotiabank continued to make tangiblecontributions to the communities in which we do business,through both the Scotiabank Jamaica Foundation, and othercommunity activities. We placed an emphasis on buildingrelationships and encouraged the involvement of our staffmembers in community activities, through the ScotiabankVolunteer Programme, as a means of further demonstratingour corporate responsibility.
THE BANKIn 2005, Scotiabank, donated more than $40 million tonumerous outreach activities and civic groups, giving priorityto the educational and health needs of our children.
Scotiabank VolunteersScotiabank Volunteers participated in two annual majorprojects, Teachers' Day and National Labour Day. On Teachers'Day 250 staff members volunteered to teach in 200 schools,kindergarten to tertiary levels island wide. Efforts focussed onpreparing our children for natural disasters; hence the subjectfor the day was Earthquakes and Hurricanes. We teamed-upwith the Office of Disaster Preparedness and EmergencyManagement, (ODPEM), and provided posters and othermaterials to schools. The ODPEM, provided our staff with tipson hurricane and earthquake disaster preparedness andassisted us in conducting an earthquake drill for all thestudents and teachers at the Holy Family Infant and PrimarySchool.
The Teacher's Day focus was planned to dovetail into theNational Labour Day theme: 'Prepare for Disaster, RecoverFaster'. On Labour Day, 177 Scotiabank Volunteers worked atnine schools across the country. Several of these schools weredamaged during Hurricane Ivan and were repaired byScotiabank, at a cost of $20 million.
Scotiabank Chorale members are volunteers and havedonated their time and talent on such occasions asChristmas Tree Lighting Ceremony at the Sir William GrantPark, children's treat at the Bustamante Children's Hospitaland the launch of the Annual Salvation Army ChristmasKettle Appeal.
While building relationships Scotiabank Volunteers willidentify projects in their communities. To that end, they willhelp to organize fund-raising events, provide manpowersupport, sit on boards and committees.
We hosted our 'Take Our Kids To Work Day' in July and 122children of Scotiabank employees had the opportunity tofamiliarize themselves with the duties of their parents. TheKiddy Cricket programme now boasts 220 schools throughoutthe island. Our employees continue to volunteer as coaches,ensuring that the rudiments of the game are observed in play.
Public EducationDuring 2005, Scotiabank conducted various seminars andpresentations with the objective of providing businessleaders and our customers with information on effectivemanagement and leadership. In April 2005, our VicePresident, International Research, Pablo Bréard, presentedour Annual Economic Seminar on trends in the globaleconomy and the potential impact of these trends on Jamaica.
In June, our annual lecture series featured Harvard UniversityProfessor, Rosabeth Moss Kanter. She is listed among the '50most influential business thinkers in the world,' the '100 mostimportant women in America' and the '50 most powerfulwomen in the world.' Professor Moss Kanter's presentationwas entitled Delivering Confidence: Winning Streaks, LosingStreaks and the Role of Leadership.
International RecognitionScotiabank Jamaica was awarded Bank of the Year in Jamaicafor 2005, for the third consecutive year, demonstrating ourcontinued excellence in banking. This prestigious award isgiven by the Banker Magazine, a publication of the FinancialTimes of London.
We were also awarded Bank of the Year for 2005 by LatinFinance, a leading magazine of finance and investments inLatin America, which stated, “We selected Scotiabank for itsstrong overall financial performance, breadth and quality ofservice to customers”.
OUR CORPORATE RESPONSIBILITY
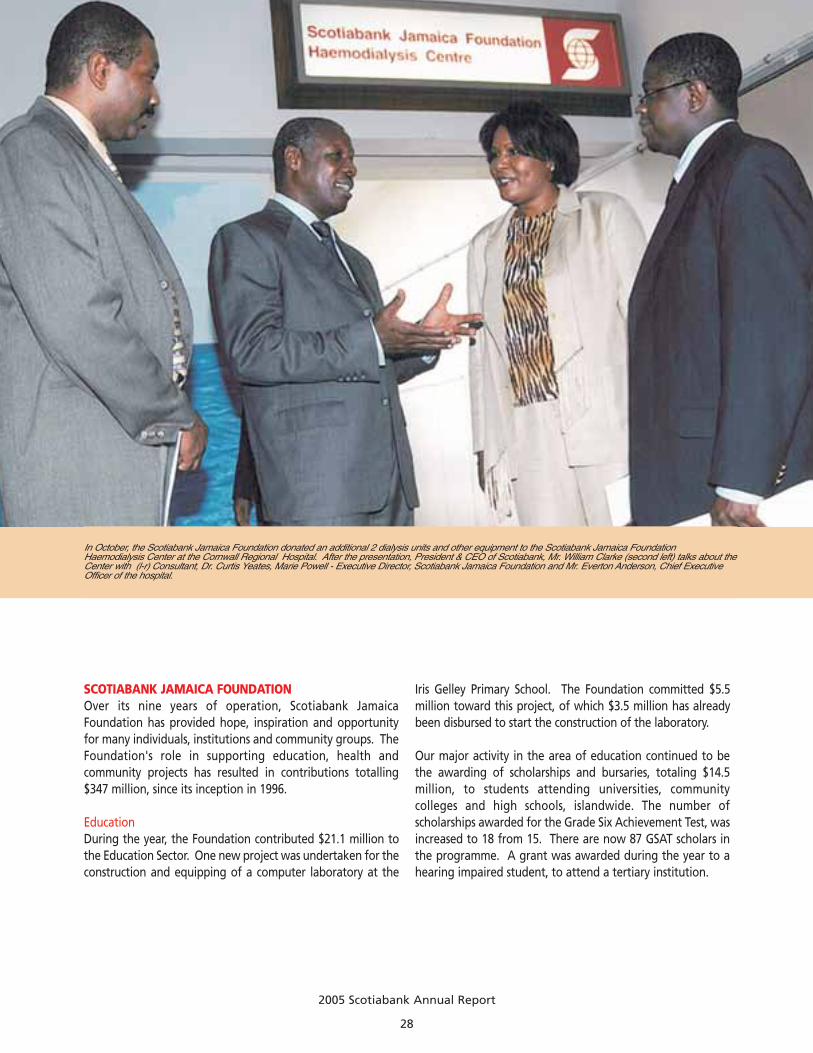
2005 Scotiabank Annual Report
28
In October, the Scotiabank Jamaica Foundation donated an additional 2 dialysis units and other equipment to the Scotiabank Jamaica Foundation Haemodialysis Center at the Cornwall Regional Hospital. After the presentation, President & CEO of Scotiabank, Mr. William Clarke (second left) talks about theCenter with (l-r) Consultant, Dr. Curtis Yeates, Marie Powell - Executive Director, Scotiabank Jamaica Foundation and Mr. Everton Anderson, Chief ExecutiveOfficer of the hospital.
SCOTIABANK JAMAICA FOUNDATIONOver its nine years of operation, Scotiabank JamaicaFoundation has provided hope, inspiration and opportunityfor many individuals, institutions and community groups. TheFoundation's role in supporting education, health andcommunity projects has resulted in contributions totalling$347 million, since its inception in 1996.
EducationDuring the year, the Foundation contributed $21.1 million tothe Education Sector. One new project was undertaken for theconstruction and equipping of a computer laboratory at the
Iris Gelley Primary School. The Foundation committed $5.5million toward this project, of which $3.5 million has alreadybeen disbursed to start the construction of the laboratory.
Our major activity in the area of education continued to bethe awarding of scholarships and bursaries, totaling $14.5million, to students attending universities, communitycolleges and high schools, islandwide. The number ofscholarships awarded for the Grade Six Achievement Test, wasincreased to 18 from 15. There are now 87 GSAT scholars inthe programme. A grant was awarded during the year to ahearing impaired student, to attend a tertiary institution.

2005 Scotiabank Annual Report
29
We launched the Scotiabank Jamaica Foundation Scholars'Club (SJFSC) in February and an executive committee waselected to manage the ongoing activities of the Club. Theobjectives of the SJFSC are to create an environment in whichour scholars can develop social awareness, as well as establisha lasting relationship with each other. There are 40 scholarsenrolled in the programme.
HealthThe Health Sector remained a major beneficiary of theFoundation's donations with this year's contributionsamounting to $31.2 million. We continued to focus onHaemodialysis Care, Breast Cancer Screening and Accidentand Emergency Services.
The Scotiabank Jamaica Foundation Haemodialysis Centre atthe Cornwall Regional Hospital received two new dialysismachines and equipment, valued at $5.2 million. We providedfor the annual upkeep and maintenance of the Centre for theninth year and serviced the Renal Unit machines at theKingston Public Hospital, at a total cost of $9.1 million.
International Centre for Environmental and Nuclear Sciences(ICENS)This year, Scotiabank disbursed the first tranche of its $25million commitment, payable over five years, to The Universityof the West Indies to support a professional research fellow atthe International Centre for Environmental and NuclearSciences (ICENS), on the Mona Campus.
The donation reinforces Scotiabank's commitment to theimprovement of health care in Jamaica. The grant will be usedto strengthen ICENS' capability to examine essential andpotentially harmful substances in the Jamaican diet. Possiblelinks between the high levels of heavy metals in Jamaican soilsand the high incidence in Jamaica of diabetes, renal diseaseand prostate cancer will also be investigated. The grant willbe used to provide training and education to researchers.
Community ProjectsWe cared for the 41 elderly residents of Cluster F at the GoldenAge Home for the 10th year, through the provision of dailymeals. The Foundation also partnered with the Rotary Club ofSt. Andrew, contributing $1.5 million toward the club's SpecialCentenary Project, which is the construction of a home forstreet boys. During the year, contributions to communityprojects totalled $4.5 million.
Report to Shareholders
Our continued success is the result of the support of our customers, the confidence of our shareholdersand the solid contribution of our over 1800 dedicated Scotiabankers.
By focussing on our core strengths in customer satisfaction, people, diversification, expense and riskmanagement, we have continued to achieve outstanding returns and dividend growth for our shareholders.
We are committed to being a leader in corporate social responsibility, responding to the needs of thecommunities in which we live and work, and alleviating poverty primarily in the areas of health andeducation.
ROBERT H. PITFIELDChairman
WILLIAM E. CLARKEPresident & CEO

Risk Management
2005 Scotiabank Annual Report
30
The Scotiabank risk management framework has beendeveloped to address the diversity of the Bank's businessactivities. This framework is supported by a robust riskmanagement culture and a strong commitment to activemanagement of risks by both executive and business linemanagement. Scotiabank's primary risk managementobjectives are to protect and ensure the safety and stability ofcustomers' funds that are placed in our fiduciary care, and tocreate and protect shareholder value. Through our variousbusiness activities we are exposed to four major types of risks -credit risk, market risk, liquidity risk and operational risk.
The risk management framework is driven by the principles thatare set out below; these principles are applied to all businessesand risk types.
• Board oversight - Risk strategies, policies and limits aresubject to Board review and approval
• Diversification - Policies and limits are designed with a view to ensuring that risks are well diversified
• Assessment - processes are designed to ensure that risks are properly assessed at the transaction, customer and portfoliolevels
• Review and Reporting - Risk profiles of individual customers and portfolios are subjected to ongoing review andreporting to executive management and the Board.
• Accountability - Business units are accountable for all risksand the related returns
• Audit Review - Individual risks and portfolios are subject to comprehensive internal audit review, with independent reporting to the Audit Committee of the Board on the effectiveness of the risk management policies and the adherence to internal controls.
The various processes within the Bank's risk managementframework are designed to ensure that risks in the variousbusiness activities are properly identified, measured, assessedand controlled. Risk management strategies, policies and limitsare then designed to ensure that the Bank's risk taking isconsistent with its business objectives and risk tolerance. Risksare managed within the limits established by the Board ofDirectors.
Scotiabank's Asset Liability Management (ALM) Programmefocuses on measuring, managing and controlling the risks
arising in the Bank's lending, funding and investing activities.Scotiabank's ALM process is designed to maintain a balancebetween enhancing interest revenue and maintaining strongliquidity within a framework of sound and prudent practices. TheAsset and Liability Committee (ALCO) is responsible forsupervising the ALM program. The Committee meets at leastonce monthly to review risks, evaluate performance and providestrategic direction.
CREDIT RISKCredit risk is the risk of loss resulting from the failure of aborrower or counterparty to honor its financial contractualobligation. Credit risk arises both in the Bank's direct lendingoperations and its funding and investment activities, wherecounterparties have repayment or other obligations to the Bank.
Scotiabank's credit risk is managed through strategies policiesand limits that are approved by the Board of Directors. Thesestrategies include centralized credit processes, portfoliodiversification, enhanced credit analysis and strong Boardoversight. The Bank's credit risk limits to counterparties in thefinancial and government sectors are also managed centrally tooptimize the use of credit availability and to avoid excessive riskconcentration.
Credit ProcessesScotiabank employs a highly centralized credit granting processthat ensures all major lending decisions are referred to a SeniorCredit Committee, or where appropriate, to a Loan PolicyCommittee. Credit proposals on major corporate andcommercial accounts are submitted directly to the CreditDepartment by client relationship officers in the business lines.Credit specialists, who are independent of the business line,analyse the proposal. A risk rating system is used to quantifyand evaluate the risk, and determine whether the Bank is beingadequately compensated, and the Board reviews and ratifies allmajor credits.
Once a credit proposal has been authorized, a company'sfinancial condition is monitored by business line and CreditDepartment personnel for signs of deterioration, which couldaffect the borrower's ability to meet its obligations to the Bank.In addition, a full review and risk analysis of each clientrelationship is undertaken at least annually. Additional reviewsare carried out more frequently in the case of higher risk credits.
Decisions on small and medium-sized commercial credits aremade utilizing a centralized loan underwriting system, whichuses a computerized scoring model. This process is significantlymore efficient than the previous manual scoring system, thusthe turnaround time is significantly improved.
Retail loan portfolios continue to be reviewed on a monthlybasis for emerging trends in credit quality, in addition toregularly subjected analytical reviews to confirm the validity ofthe parameters used in the scoring models.
OVERVIEW
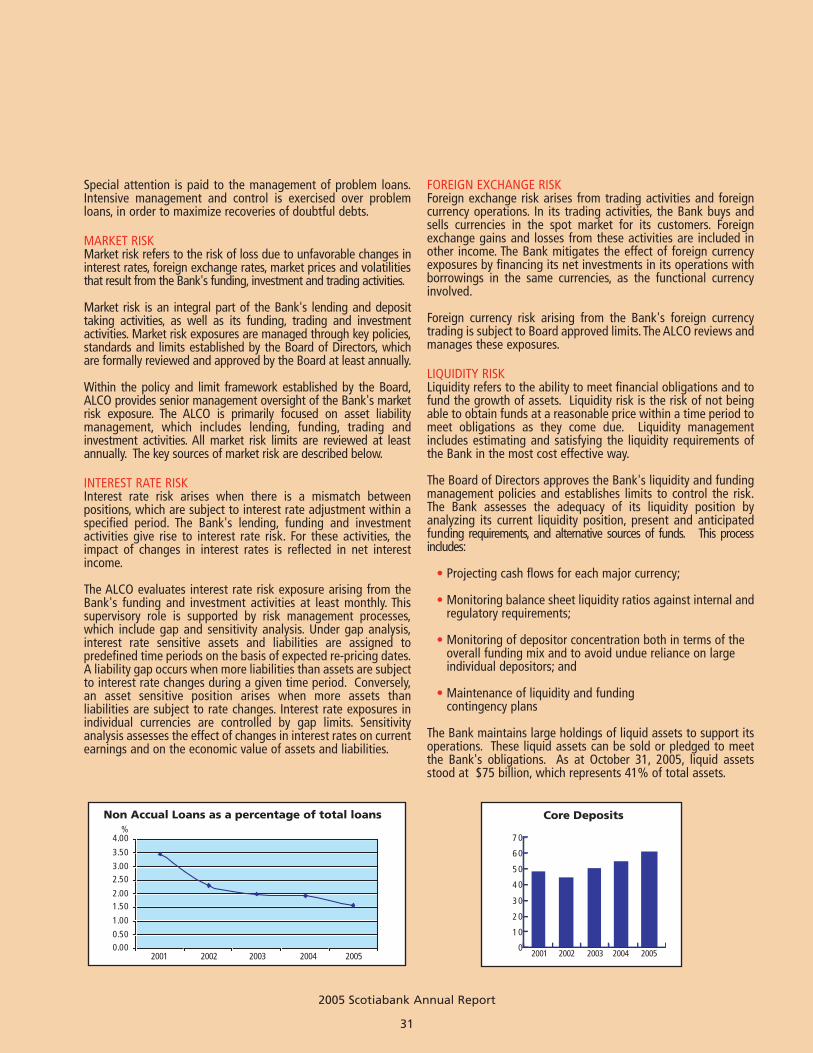
2005 Scotiabank Annual Report
31
Special attention is paid to the management of problem loans.Intensive management and control is exercised over problemloans, in order to maximize recoveries of doubtful debts.
MARKET RISKMarket risk refers to the risk of loss due to unfavorable changes ininterest rates, foreign exchange rates, market prices and volatilitiesthat result from the Bank's funding, investment and trading activities.
Market risk is an integral part of the Bank's lending and deposittaking activities, as well as its funding, trading and investmentactivities. Market risk exposures are managed through key policies,standards and limits established by the Board of Directors, whichare formally reviewed and approved by the Board at least annually.
Within the policy and limit framework established by the Board,ALCO provides senior management oversight of the Bank's marketrisk exposure. The ALCO is primarily focused on asset liabilitymanagement, which includes lending, funding, trading andinvestment activities. All market risk limits are reviewed at leastannually. The key sources of market risk are described below.
INTEREST RATE RISKInterest rate risk arises when there is a mismatch betweenpositions, which are subject to interest rate adjustment within aspecified period. The Bank's lending, funding and investmentactivities give rise to interest rate risk. For these activities, theimpact of changes in interest rates is reflected in net interestincome.
The ALCO evaluates interest rate risk exposure arising from theBank's funding and investment activities at least monthly. Thissupervisory role is supported by risk management processes,which include gap and sensitivity analysis. Under gap analysis,interest rate sensitive assets and liabilities are assigned topredefined time periods on the basis of expected re-pricing dates.A liability gap occurs when more liabilities than assets are subjectto interest rate changes during a given time period. Conversely,an asset sensitive position arises when more assets thanliabilities are subject to rate changes. Interest rate exposures inindividual currencies are controlled by gap limits. Sensitivityanalysis assesses the effect of changes in interest rates on currentearnings and on the economic value of assets and liabilities.
FOREIGN EXCHANGE RISKForeign exchange risk arises from trading activities and foreigncurrency operations. In its trading activities, the Bank buys andsells currencies in the spot market for its customers. Foreignexchange gains and losses from these activities are included inother income. The Bank mitigates the effect of foreign currencyexposures by financing its net investments in its operations withborrowings in the same currencies, as the functional currencyinvolved.
Foreign currency risk arising from the Bank's foreign currencytrading is subject to Board approved limits. The ALCO reviews andmanages these exposures.
LIQUIDITY RISKLiquidity refers to the ability to meet financial obligations and tofund the growth of assets. Liquidity risk is the risk of not beingable to obtain funds at a reasonable price within a time period tomeet obligations as they come due. Liquidity managementincludes estimating and satisfying the liquidity requirements ofthe Bank in the most cost effective way.
The Board of Directors approves the Bank's liquidity and fundingmanagement policies and establishes limits to control the risk.The Bank assesses the adequacy of its liquidity position byanalyzing its current liquidity position, present and anticipatedfunding requirements, and alternative sources of funds. This processincludes:
• Projecting cash flows for each major currency;
• Monitoring balance sheet liquidity ratios against internal andregulatory requirements;
• Monitoring of depositor concentration both in terms of theoverall funding mix and to avoid undue reliance on large individual depositors; and
• Maintenance of liquidity and funding contingency plans
The Bank maintains large holdings of liquid assets to support itsoperations. These liquid assets can be sold or pledged to meetthe Bank's obligations. As at October 31, 2005, liquid assetsstood at $75 billion, which represents 41% of total assets.
05
10
15
20
25
30
0
1 0
2 0
3 0
4 0
5 0
6 0
7 0
0.000.50
1.00
1.502.00
2.503.00
3.50
4.00%
2001 2002 2003 2004 20052001 2002 2003 2004 2005
Core DepositsNon Accual Loans as a percentage of total loans
Average Savings and Lending Rates
JSE Index
95
100
105
110
115
120
125‘000
Sep-04
Oct-04
Nov-04
Dec-04
Jan-05
Feb-05
Mar-05
Apr-05
May-05
Jun-05
Jul-05
Aug-05
Sep-05
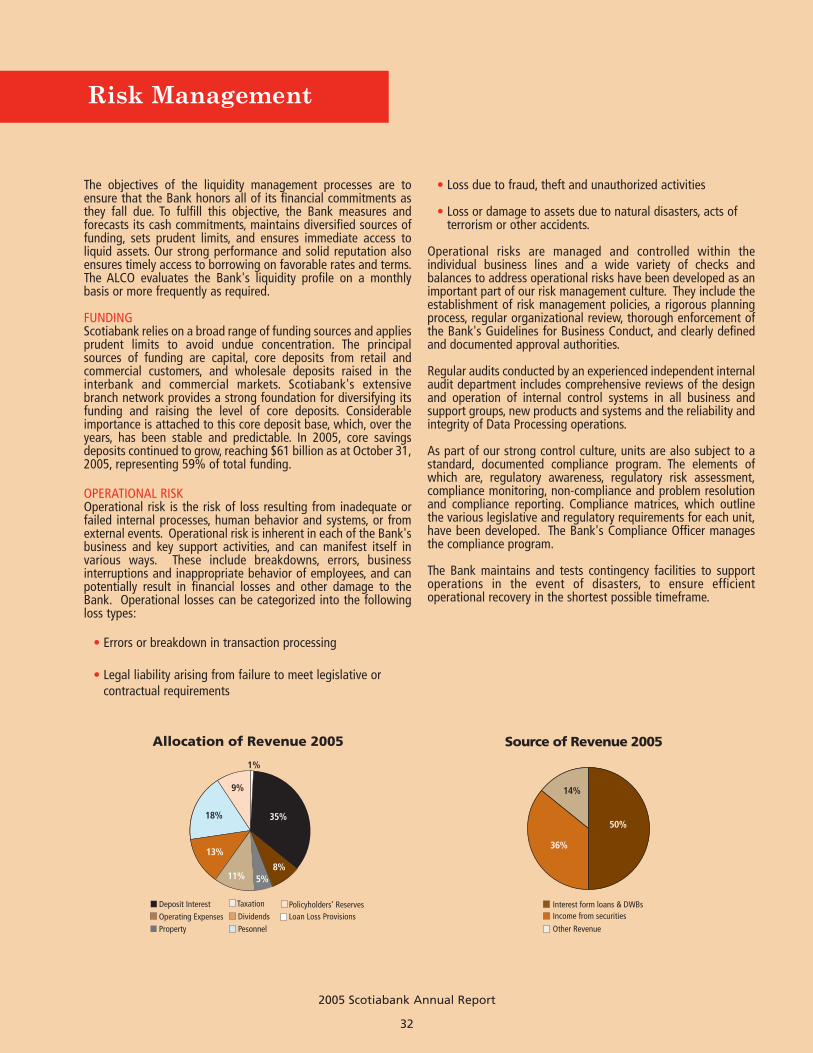
2005 Scotiabank Annual Report
32
The objectives of the liquidity management processes are toensure that the Bank honors all of its financial commitments asthey fall due. To fulfill this objective, the Bank measures andforecasts its cash commitments, maintains diversified sources offunding, sets prudent limits, and ensures immediate access toliquid assets. Our strong performance and solid reputation alsoensures timely access to borrowing on favorable rates and terms.The ALCO evaluates the Bank's liquidity profile on a monthlybasis or more frequently as required.
FUNDINGScotiabank relies on a broad range of funding sources and appliesprudent limits to avoid undue concentration. The principalsources of funding are capital, core deposits from retail andcommercial customers, and wholesale deposits raised in theinterbank and commercial markets. Scotiabank's extensivebranch network provides a strong foundation for diversifying itsfunding and raising the level of core deposits. Considerableimportance is attached to this core deposit base, which, over theyears, has been stable and predictable. In 2005, core savingsdeposits continued to grow, reaching $61 billion as at October 31,2005, representing 59% of total funding.
OPERATIONAL RISKOperational risk is the risk of loss resulting from inadequate orfailed internal processes, human behavior and systems, or fromexternal events. Operational risk is inherent in each of the Bank'sbusiness and key support activities, and can manifest itself invarious ways. These include breakdowns, errors, businessinterruptions and inappropriate behavior of employees, and canpotentially result in financial losses and other damage to theBank. Operational losses can be categorized into the followingloss types:
• Errors or breakdown in transaction processing
• Legal liability arising from failure to meet legislative or contractual requirements
• Loss due to fraud, theft and unauthorized activities
• Loss or damage to assets due to natural disasters, acts of terrorism or other accidents.
Operational risks are managed and controlled within theindividual business lines and a wide variety of checks andbalances to address operational risks have been developed as animportant part of our risk management culture. They include theestablishment of risk management policies, a rigorous planningprocess, regular organizational review, thorough enforcement ofthe Bank's Guidelines for Business Conduct, and clearly definedand documented approval authorities.
Regular audits conducted by an experienced independent internalaudit department includes comprehensive reviews of the designand operation of internal control systems in all business andsupport groups, new products and systems and the reliability andintegrity of Data Processing operations.
As part of our strong control culture, units are also subject to astandard, documented compliance program. The elements ofwhich are, regulatory awareness, regulatory risk assessment,compliance monitoring, non-compliance and problem resolutionand compliance reporting. Compliance matrices, which outlinethe various legislative and regulatory requirements for each unit,have been developed. The Bank's Compliance Officer managesthe compliance program.
The Bank maintains and tests contingency facilities to supportoperations in the event of disasters, to ensure efficientoperational recovery in the shortest possible timeframe.
* Restated for Bonus issue
0
500
1,000
1,500
2,000
2,500
3,000
3,500
4,000
2001 2002* 2003 2004 2005
0
4,000
8,000
12,000
16,000
0
20
40
60
0
2,000
4,000
6,000
8,000
10,000
2,000
0
4,000
8,000
12,000
16,000
20,000
24,000
28,000
2003
0.00
1.00
2.00
3.00 $
20.00
0
0.00
10.00
20.00
30.00
40.00
2001 2002* 2003 2004 2005
%
Dividend Paid Per Stock Unit
2001* 2002* 2003* 2004* 20050.00
0.40
0.80
1.20
0.500.57
0.880.925 1.00
$$
* Restated for Bonus issue
Return on Assets
0.0
1.0
2.0
3.0
4.0
2001* 2002* 2003 2004 2005
3.13 3.04
3.703.48
3.21
%
*Adoption year for IFRS*Adoption year for IFRS *Adoption year for IFRS
Expenses
2001 2002* 2003 2004 2005
* Adoption year for IFRS
0
4,000
6,000
8,000
10,000
5,003 5,303
7,153
8,5339,197$ Millions
Total Assets
2001 2002* 2003 2004 2005
40,000
80,000
120,000
160,000
200,000
0
$ Millions
102,564127,367
147,653168,168
* Adoption year for IFRS
183,461
Profit Per Employee
0
1,000
2,000
3,000
4,000 $ Thousands
1,8302,144
2,948 3,142 3,193
2001 2002* 2003 2004 2005
* Adoption year for IFRS
Dividends
2001 2002 2003 2004 2005
500
1,000
1,500
2,000
2,500
3,000
3,500 $ Millions
1,4641,683
2,561 2,7082,927
Dividend Payout Ratio
*Adoption year for IFRS *Adoption year for IFRS
*Adoption year for IFRS*Adoption year for IFRS
*Adoption year for IFRS
*Adoption year for IFRS *Adoption year for IFRS
2001 2002* 2003 2004 20050.00
10.00
30.00
40.00
50.00
60.00
43.4946.94 46.24
49.7445.54
%
Productivity Ratio
2001 2002* 2003 2004 2005
54.1049.97 49.46 51.08 52.47
%
0
2,000
4,000
6,000
8,000
10,000
2001 2002* 2003 2004 2005
Revenue Per Employee
5,481 5,825
7,7668,938 9,362$ Thousands
Stockholders Equity
2001 2002* 2004 2005
11,88114,066
17,65120,605
23,525$ Millions
Profit Before Tax
2001 2002* 2003 2004 2005
4,4185,309
7,3078,173 8,330
$ Millions
Other Income
1,784 1,853
2,433 2,595
3,463$ Millions
Net Interest Income
2001 2002* 2003 2004 2005
$ Millions
7,8418,759
12,027
14,111 14,064
2001* 2002* 2003 2004 2005
26,156
39,421
48,07553,460
57,649
$ Millions
0
10,000
20,000
30,000
40,000
50,000
60,000
70,000
Total Loans
2001 2002 2003 2004 20050
20,000
40,000
60,000
80,000
100,000
120,000 $ Millions
67,80976,948
87,06798,811
107,280
Total Deposits
Earnings Per Stock Unit
2001* 2002* 2003* 2004* 2005
1.101.32
1.86 2.00 2.01
32.53 34.2229.85
26.3329.16
Return on Average Equity
Allocation of Revenue 2005
35%
35%
8%5%11%
13%
18%
9%
Source of Revenue 2005
50%
36%
14%
* Restated for Bonus issue
0
500
1,000
1,500
2,000
2,500
3,000
3,500
4,000
2001 2002* 2003 2004 2005
0
4,000
8,000
12,000
16,000
0
20
40
60
0
2,000
4,000
6,000
8,000
10,000
2,000
0
4,000
8,000
12,000
16,000
20,000
24,000
28,000
2003
0.00
1.00
2.00
3.00 $
20.00
0
0.00
10.00
20.00
30.00
40.00
2001 2002* 2003 2004 2005
%
Dividend Paid Per Stock Unit
2001* 2002* 2003* 2004* 20050.00
0.40
0.80
1.20
0.500.57
0.880.925 1.00
$$
* Restated for Bonus issue
Return on Assets
0.0
1.0
2.0
3.0
4.0
2001* 2002* 2003 2004 2005
3.13 3.04
3.703.48
3.21
%
*Adoption year for IFRS*Adoption year for IFRS *Adoption year for IFRS
Expenses
2001 2002* 2003 2004 2005
* Adoption year for IFRS
0
4,000
6,000
8,000
10,000
5,003 5,303
7,153
8,5339,197$ Millions
Total Assets
2001 2002* 2003 2004 2005
40,000
80,000
120,000
160,000
200,000
0
$ Millions
102,564127,367
147,653168,168
* Adoption year for IFRS
183,461
Profit Per Employee
0
1,000
2,000
3,000
4,000 $ Thousands
1,8302,144
2,948 3,142 3,193
2001 2002* 2003 2004 2005
* Adoption year for IFRS
Dividends
2001 2002 2003 2004 2005
500
1,000
1,500
2,000
2,500
3,000
3,500 $ Millions
1,4641,683
2,561 2,7082,927
Dividend Payout Ratio
*Adoption year for IFRS *Adoption year for IFRS
*Adoption year for IFRS*Adoption year for IFRS
*Adoption year for IFRS
*Adoption year for IFRS *Adoption year for IFRS
2001 2002* 2003 2004 20050.00
10.00
30.00
40.00
50.00
60.00
43.4946.94 46.24
49.7445.54
%
Productivity Ratio
2001 2002* 2003 2004 2005
54.1049.97 49.46 51.08 52.47
%
0
2,000
4,000
6,000
8,000
10,000
2001 2002* 2003 2004 2005
Revenue Per Employee
5,481 5,825
7,7668,938 9,362$ Thousands
Stockholders Equity
2001 2002* 2004 2005
11,88114,066
17,65120,605
23,525$ Millions
Profit Before Tax
2001 2002* 2003 2004 2005
4,4185,309
7,3078,173 8,330
$ Millions
Other Income
1,784 1,853
2,433 2,595
3,463$ Millions
Net Interest Income
2001 2002* 2003 2004 2005
$ Millions
7,8418,759
12,027
14,111 14,064
2001* 2002* 2003 2004 2005
26,156
39,421
48,07553,460
57,649
$ Millions
0
10,000
20,000
30,000
40,000
50,000
60,000
70,000
Total Loans
2001 2002 2003 2004 20050
20,000
40,000
60,000
80,000
100,000
120,000 $ Millions
67,80976,948
87,06798,811
107,280
Total Deposits
Earnings Per Stock Unit
2001* 2002* 2003* 2004* 2005
1.101.32
1.86 2.00 2.01
32.53 34.2229.85
26.3329.16
Return on Average Equity
Allocation of Revenue 2005
35%
35%
8%5%11%
13%
18%
9%
Source of Revenue 2005
50%
36%
14%
Risk Management

Economic Review
2005 Scotiabank Annual Report
33
OverviewJamaica's economic performance over the last fiscal year(November 04 - September 05) got off to a promising start in thefirst half of the year but has since dampened as a result of severalinternal and external shocks that have continued to buffet thecountry. At the start of the year, the country was expected torecover from the disruption in production and the inflationaryeffects of Hurricane Ivan last September. This confidence wasreflected in the country's 2005 budget forecast where the economywas expected to grow by some 3.6% in real terms, driven largelyby increased activity in sectors such as construction, mining &quarrying and tourism, as well as the recovery of agriculturalexports to pre-Ivan levels.
However, an unusually active hurricane season, sustained high oilprices in the US (against which we benchmark our rates) and GCTreforms in May have contributed to spiralling inflation (At the endof October, inflation was 15.9% in the 12 months since November2004 and 10.88% in the 7 months of the country's fiscal year).There was a 1.8% decline in the Jamaican dollar against its UScounterpart over a four-week period in October 2005. Given thefact that the 12-month period (Sept 04 - Sept 05) prior to Octobersaw a slow decline in the dollar's value of 1.6%, this has notserved to bolster confidence in the near-term prospects for theeconomy.
In response, central bank operations, with the government being anet seller of foreign exchange bolstered by buoyant netinternational reserves of US$2.12 billion (September), have helpedto stabilize the currency and mop up excess liquidity, thus reigningin some inflationary pressure.
While the government continues to surpass its expenditure targetsthrough aggressive capital expenditure cuts, tax revenues for theApril - September period were $7.3 billion less than projected,with collections for local GCT and GCT on imports accounting forapproximately 67% of the shortfall. The net effect on the fiscalaccounts at the end of August is a fiscal deficit of $18 billion, whichis $3.7 billion more than projected.
Finally, while the unemployment rate as at July 2005 stood at11.2% there was a net inward private transfer of funds for theJanuary - August period that offset some of the undue straincaused by unemployment. Remittances account for 85% of thisinflow is from remittances, which have shown strong growth year-over-year for the period. It is noteworthy that commercial bankshandle only 28% of the inward remittances while handlingapproximately 91% of the remittance outflow traffic.
The Financial SectorAt the end of August 2005, total assets of commercial banks stoodat $347 billion, representing an increase of 6.2% over the previousyear. Deposits at commercial banks stood at $235 billion at theend of August, representing an increase of 8.2% over the previousyear.
The Central Bank, on two occasions lowered its Special DepositRequirement for Commercial Banks and FIA institutions. Thisdevelopment, coupled with the lowering of rates on governmentinstruments led to slower but steady decline in average savingsand lending rates over the period. While the country has begun toexperience real negative savings interest rates due to inflation, thelow interest rate environment has fuelled growth in loans andadvances from commercial banks over the 12-month period of12.29%.
Deposits lodged with building societies grew by 11.64% over theprevious year to $61 billion at the end of August 2005. Loans andadvances made at building societies at the end of August 2005stood at $34 billion, representing an increase of 27.2% over theprevious year.
Merchant banks and other finance houses posted deposit gains of12.1% over the previous year to balances of $11 billion at the endof August 2005.
05
10
15
20
25
30
Sep-04 Sep-05Average Saving Rates Average Lending Rates
0
1 0
2 0
3 0
4 0
5 0
6 0
7 0
0.000.50
1.00
1.502.00
2.503.00
3.50
4.00%
2001 2002 2003 2004 20052001 2002 2003 2004 2005
Core DepositsNon Accual Loans as a percentage of total loans
Average Savings and Lending Rates
JSE Index
95
100
105
110
115
120
125‘000
Sep-04
Oct-04
Nov-04
Dec-04
Jan-05
Feb-05
Mar-05
Apr-05
May-05
Jun-05
Jul-05
Aug-05
Sep-05
Economic Review
2005 Scotiabank Annual Report
34
The Jamaica Stock Exchange Index as of the end of September,increased by 3.52% over the previous year, but this is not reflectiveof the mixed performance of the index. The first 5 months saw theindex increase by 18%, reflecting the liquidity within the economyand a measure of confidence and expectations for profitabilitywithin the private sector. The ensuing months however have seenan average 13% decline in the index, reflecting changing investorconfidence due to lower than projected corporate earnings andhigher inflation.
OutlookGDP growth is expected to continue to be fuelled by the mining,construction and tourism sectors and while significant FDI inflowsdemonstrate this optimism, the impact of the active hurricaneseason will limit the early growth expected from these sectors.
The outlook for the agricultural sector for the remainder of thefiscal year is less than positive given the weather phenomenonover the latter half of the year. Further, the likely dislocationexpected from the downgrading of the preferential pricing onsugar exported to EU countries, coupled with the continuedinefficient sugar production practices in many of the sugar estates,will be significant.
Crime and violence continues to have an adverse impact on thegrowth potential for the economy and the level of FDI that isattracted, despite recent successes in this regard. The direct andindirect impact of crime on the economy remains to be measuredbut, as the business confidence indices show, what is clear is thatit is significant.
Finally, the government's major challenge over the next fiscal yearcontinues to be to manage the fiscal deficit and contain the debtburden, while encouraging local and foreign investment through astable exchange rate, a sustained low interest rate environmentand moderate inflation. Jamaica will have a harder time meetingits medium term targets as budgeted revenues fall short andexpenditures increase in the wake of the natural disasters andrising inflation.

2005 Scotiabank Annual Report
35
Shareholdings
Shareholders Holding the Ten Largest Blocks of Sharesin The Bank of Nova Scotia Jamaica Limited
as at October 31, 2005
Units
1. The Bank of Nova Scotia, Toronto, Canada 2,049,062,400
2. Scotia Jamaica Investment Management Limited
- A/C 3119 76,977,650
3. Life of Jamaica Pooled Equity Fund No. 1 57,155,855
4. Scotia Jamaica Investment Management Limited
- A/C 560 39,487,461
5. Guardian Life Limited 32,903,235
6. National Insurance Fund 26,041,444
7. Capital & Credit Merchant Bank Limited 25,162,654
8. Investment Nominees Limited
- A/C Lascelles Henriques S/A Fund 15,153,996
9. Manchester Pension Trust Fund 13,017,444
10. West Indies Trust Co. Ltd. A/C WT89 12,983,520
Shareholdings of Senior Management Officers of The Bank of Nova Scotia Jamaica Limited as
at October 31, 2005*
Units
William E. Clarke, CD 92,980
Egerton Anderson 95,288
- Joan Anderson 19,598
Ronald Bourdeau NIL
Bevan Callam 1,045,810
Roger Cogle 98,512
Sharon Colquhoun NIL
Wayne Hewitt 2,000
Michael Jones 219,562
Bridget Lewis 113,800
Suzette McLeod 160,000
David Noël 120,745
Yvonne Pandohie 95,640
Rosemarie Pilliner 294,538
H. Wayne Powell 1,198,338
- Yanissa Investments 144,448
Marie Powell 58,512
Shirley Ramsaran NIL
- Reginald Ramsaran 40,229
Janice V. Robinson 38,512
Jacqueline Sharp 98,000
Clyde Singh 240,616
Michael Thompson 50,000
Audrey Tugwell Henry 12,446
Rosemarie Voordouw NIL
David M. Williams 131,130
Donald O. Williams 155,872
- Eileen H. Williams 151,702
Gladstone Whitelocke 84,000
- Elaine Whitelocke NIL
- Justin Whitelocke 1,200
- Renee Whitelocke 1,320
Stacie-Ann Wright 43,501
*Inclusive of shares in Jamaica Central Securities Depository
Shareholdings of Directors and Connected Personsin The Bank of Nova Scotia Jamaica Limited
as at October 31, 2005*
Units
Robert Pitfield 9,270
William E. Clarke, CD 92,980
Anthony Chang 3,274
Professor Celia D. C. Christie 20,000
Dr. Jean A. Dixon 72,530
Muna M. Issa 19,986
Charles Johnston 2.328
- Marine Management Services 64,472
Warren McDonald 10,000
Joseph M. Matalon NIL
Hon. Mayer M. Matalon, OJ 100,000
William A. McConnell, CD 10,000
Dr. Herbert J. Thompson 29,640
Professor Stephen Vasciannie NIL
Richard E. Waugh NIL
Stacie-Ann Wright 43,501
*Inclusive of shares in Jamaica Central Securities Depository

24 November 2005
To the Members ofThe Bank of Nova Scotia Jamaica LimitedKingston
Auditors' Report
We have audited the financial statements set out on pages 37 to 107, and have received all theinformation and explanations which we considered necessary. These financial statements arethe responsibility of the Bank's management. Our responsibility is to express an opinion onthese financial statements based on our audit.
We conducted our audit in accordance with International Standards on Auditing. Thosestandards require that we plan and perform the audit to obtain reasonable assurance aboutwhether the financial statements are free of material misstatements. An audit includesexamining, on a test basis, evidence supporting the amounts and disclosures in the financialstatements. An audit also includes assessing the accounting principles used and significantestimates made by management, as well as evaluating the overall financial statementpresentation. We believe that our audit provides a reasonable basis for our opinion.
In our opinion, proper accounting records have been kept and the financial statements, whichare in agreement therewith, give a true and fair view of the state of affairs of the Group andthe Bank as at 31 October 2005 and of the results of operations, changes in stockholders'equity and cash flows of the Group and the Bank for the year then ended in accordance withInternational Financial Reporting Standards and comply with the provisions of the JamaicanCompanies Act applicable to banking companies.
Chartered AccountantsKingston, Jamaica
E.L. McDonald M.G. Rochester P.W. Pearson E.A. Crawford D.V. Brown J.W. Lee C.D.W. Maxwell P.E. Williams G.L. Lewars L.A. McKnight L.E. Augier A.K. Jain B.L. Scott B.J. Denning
PricewaterhouseCoopersScotiabank CentreDuke StreetBox 372Kingston JamaicaTelephone (876) 922 6230Facsimile (876) 922 7581
36

2005 Scotiabank Annual Report
37
Statement of Consolidated Revenue and Expenses(expressed in thousands of Jamaican dollars unless otherwise stated)
Year ended 31 October 2005

2005 Scotiabank Annual Report
38
Consolidated Balance Sheet(expressed in thousands of Jamaican dollars unless otherwise stated)
31 October 2005

2005 Scotiabank Annual Report
39
Consolidated Balance Sheet (continued)(expressed in thousands of Jamaican dollars unless otherwise stated)
31 October 2005
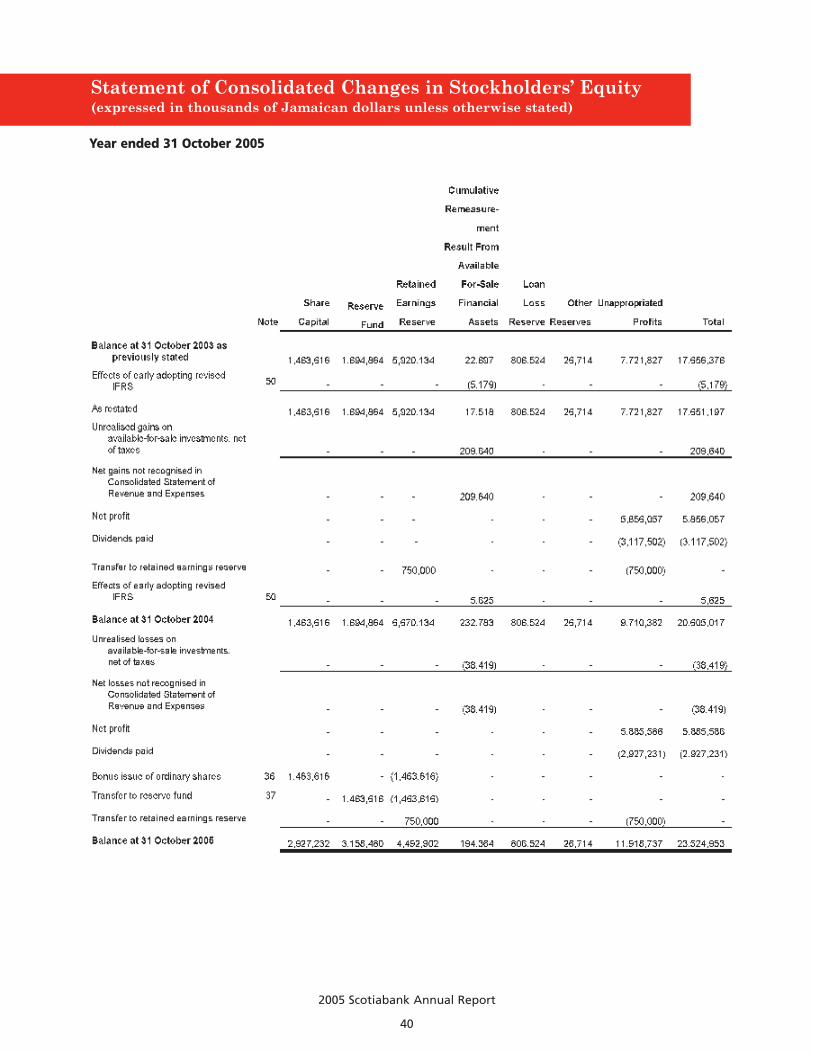
Statement of Consolidated Changes in Stockholders’ Equity(expressed in thousands of Jamaican dollars unless otherwise stated)
Year ended 31 October 2005
2005 Scotiabank Annual Report
40
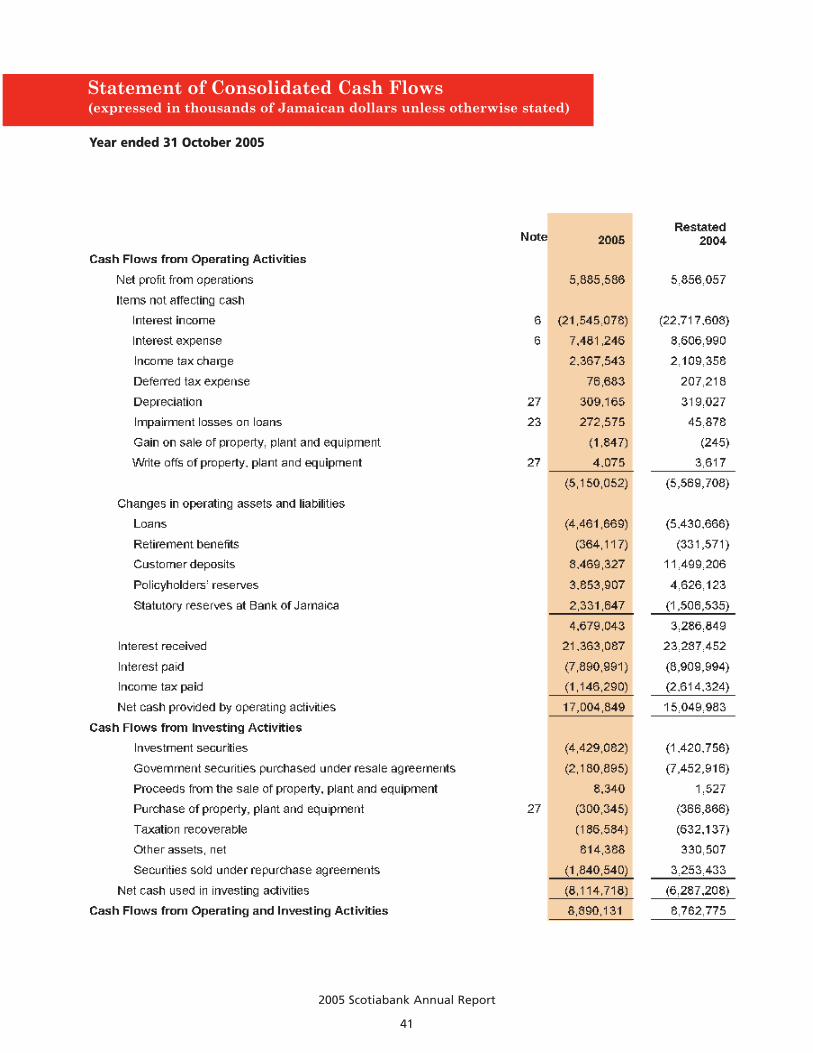
Statement of Consolidated Cash Flows(expressed in thousands of Jamaican dollars unless otherwise stated)
Year ended 31 October 2005
2005 Scotiabank Annual Report
41
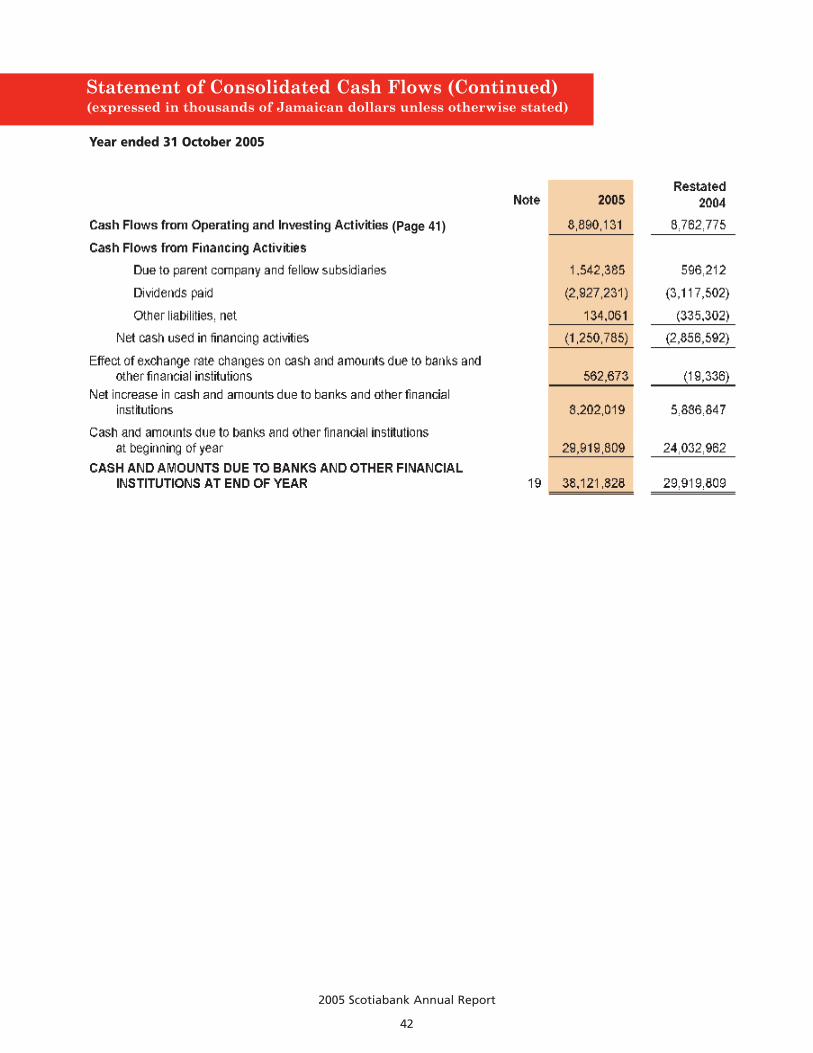
2005 Scotiabank Annual Report
42
Statement of Consolidated Cash Flows (Continued)(expressed in thousands of Jamaican dollars unless otherwise stated)
Year ended 31 October 2005
(Page 41)

2005 Scotiabank Annual Report
43
Statement of Revenue and Expenses(expressed in thousands of Jamaican dollars unless otherwise stated)
Year ended 31 October 2005

2005 Scotiabank Annual Report
44
Balance Sheet(expressed in thousands of Jamaican dollars unless otherwise stated)
31 October 2005

2005 Scotiabank Annual Report
45
Balance Sheet (Continued)(expressed in thousands of Jamaican dollars unless otherwise stated)
31 October 2005
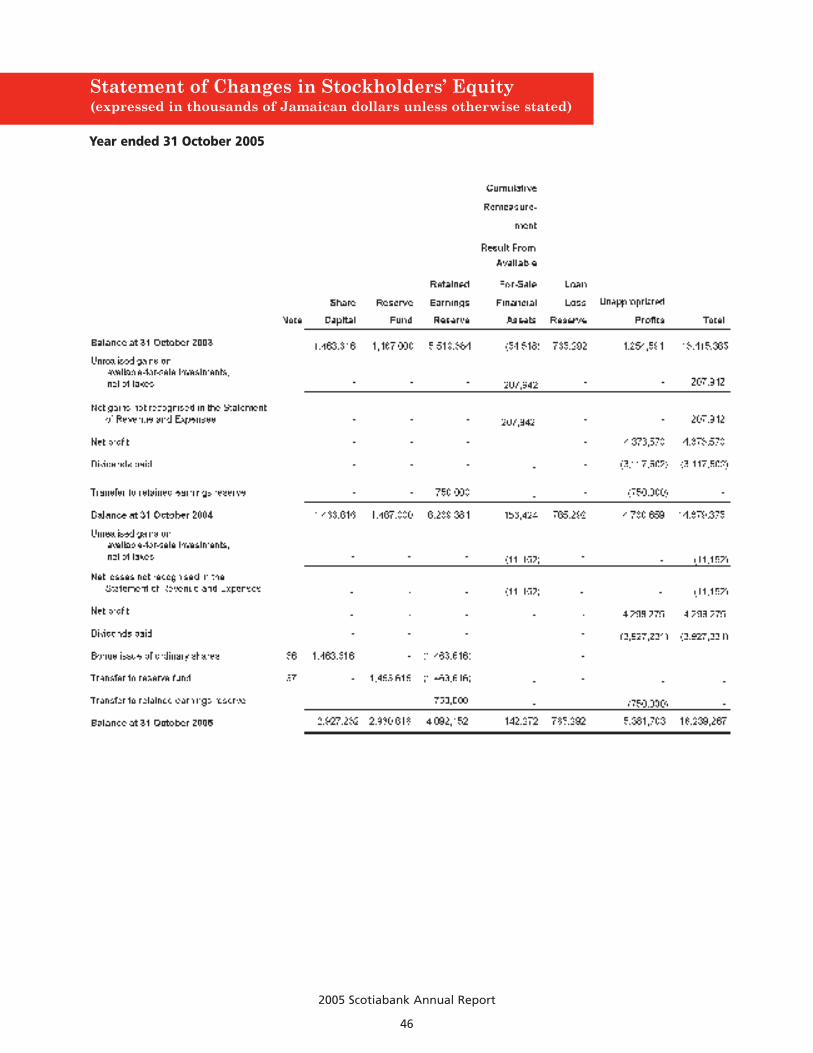
2005 Scotiabank Annual Report
46
Statement of Changes in Stockholders’ Equity(expressed in thousands of Jamaican dollars unless otherwise stated)
Year ended 31 October 2005
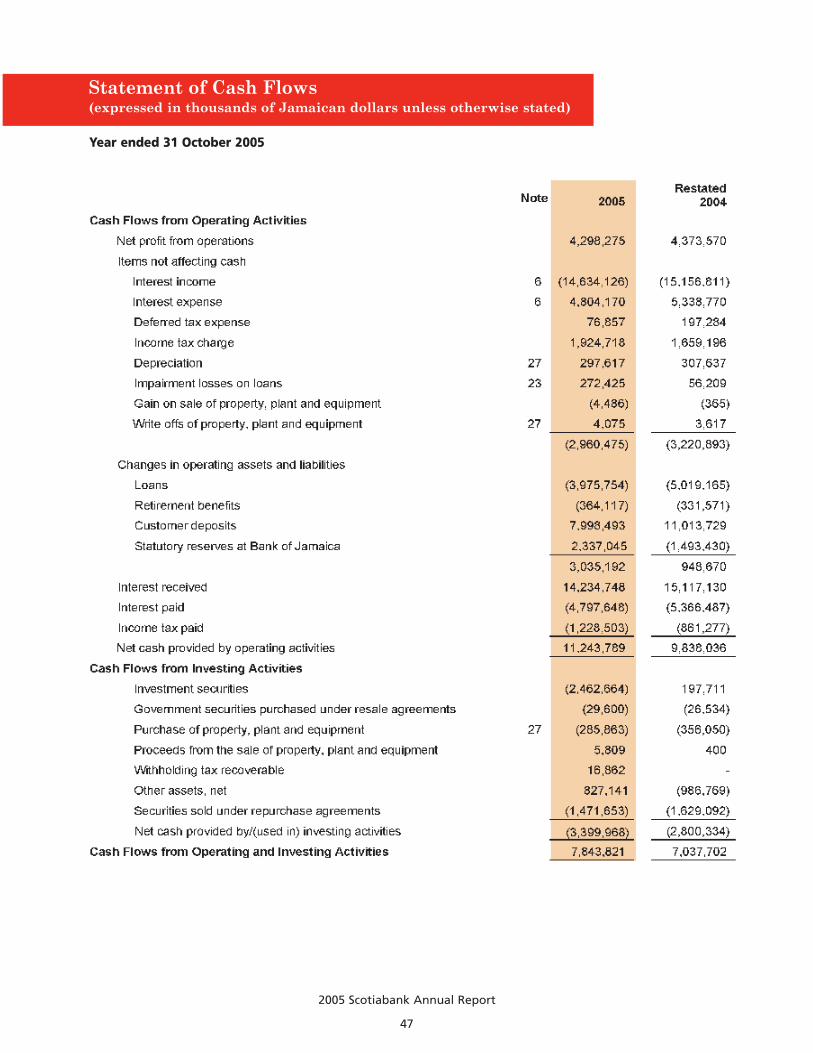
2005 Scotiabank Annual Report
47
Statement of Cash Flows(expressed in thousands of Jamaican dollars unless otherwise stated)
Year ended 31 October 2005
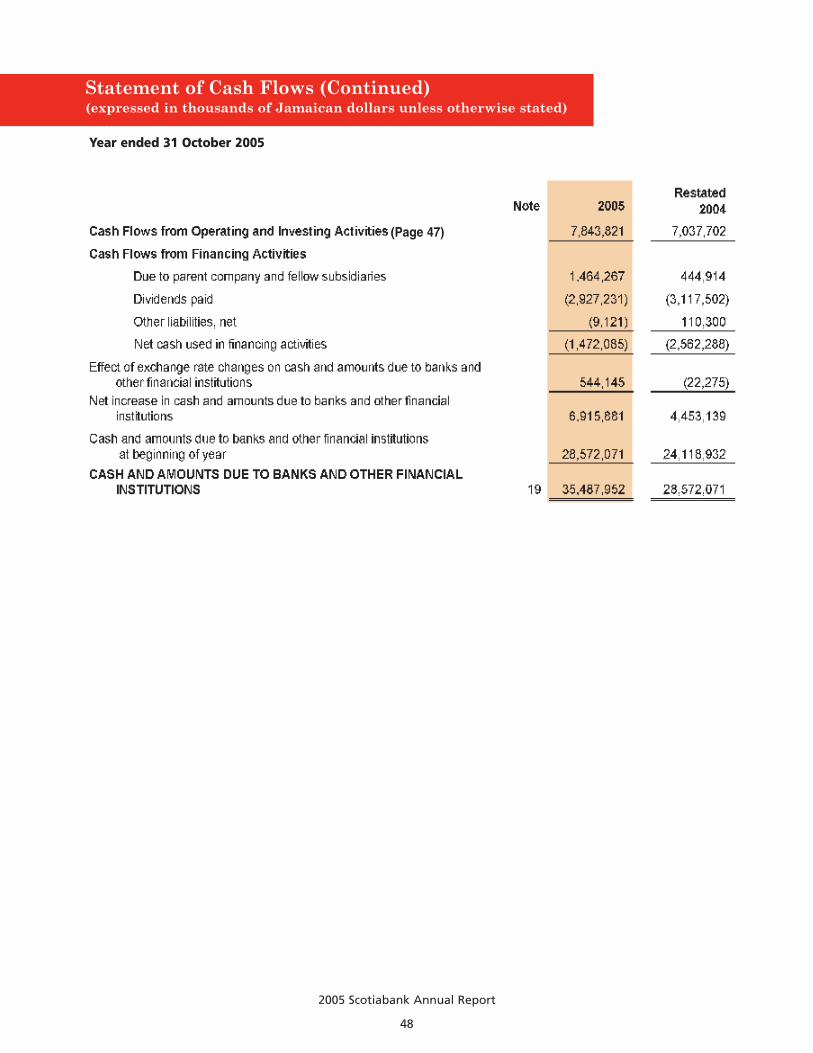
2005 Scotiabank Annual Report
48
Statement of Cash Flows (Continued)(expressed in thousands of Jamaican dollars unless otherwise stated)
Year ended 31 October 2005
(Page 47)
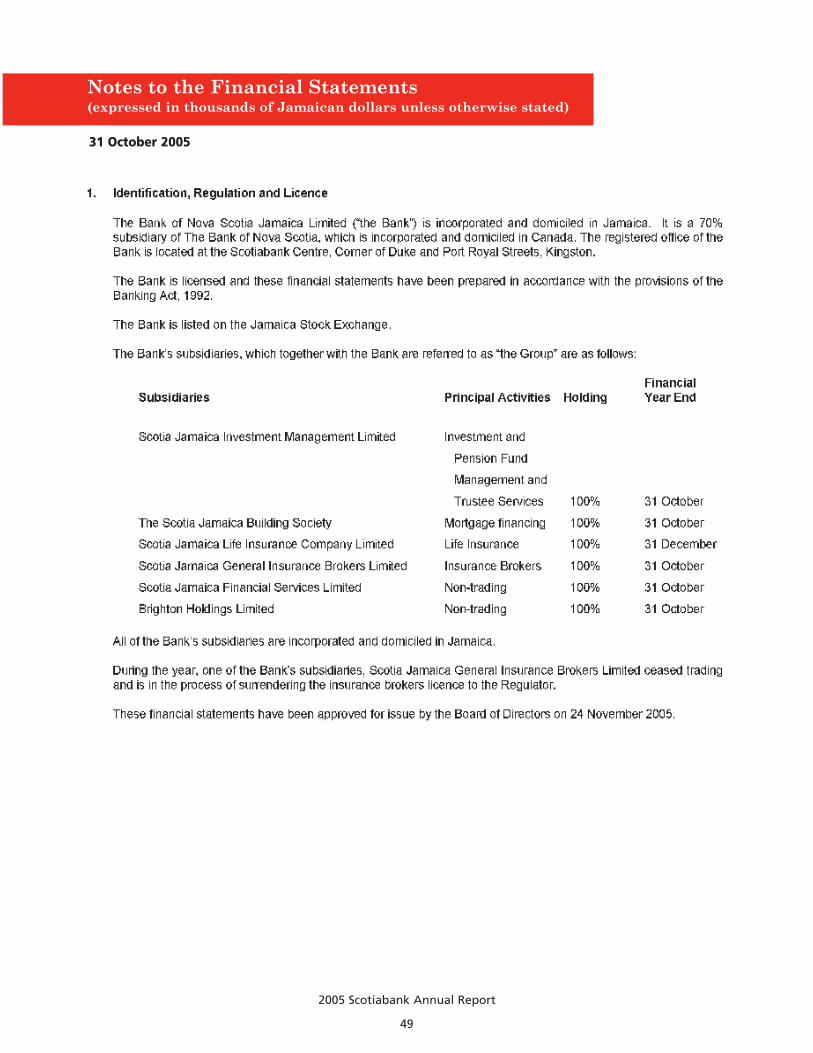
2005 Scotiabank Annual Report
49
Notes to the Financial Statements(expressed in thousands of Jamaican dollars unless otherwise stated)
31 October 2005

2005 Scotiabank Annual Report
50
Notes to the Financial Statements(expressed in thousands of Jamaican dollars unless otherwise stated)
31 October 2005

2005 Scotiabank Annual Report
51
Notes to the Financial Statements(expressed in thousands of Jamaican dollars unless otherwise stated)
31 October 2005
2005 Scotiabank Annual Report
52
Notes to the Financial Statements(expressed in thousands of Jamaican dollars unless otherwise stated)
31 October 2005

2005 Scotiabank Annual Report
53
Notes to the Financial Statements(expressed in thousands of Jamaican dollars unless otherwise stated)
31 October 2005

2005 Scotiabank Annual Report
54
Notes to the Financial Statements(expressed in thousands of Jamaican dollars unless otherwise stated)
31 October 2005

2005 Scotiabank Annual Report
55
Notes to the Financial Statements(expressed in thousands of Jamaican dollars unless otherwise stated)
31 October 2005
2005 Scotiabank Annual Report
56
Notes to the Financial Statements(expressed in thousands of Jamaican dollars unless otherwise stated)
31 October 2005

2005 Scotiabank Annual Report
57
Notes to the Financial Statements(expressed in thousands of Jamaican dollars unless otherwise stated)
31 October 2005
2005 Scotiabank Annual Report
58
Notes to the Financial Statements(expressed in thousands of Jamaican dollars unless otherwise stated)
31 October 2005

2005 Scotiabank Annual Report
59
Notes to the Financial Statements(expressed in thousands of Jamaican dollars unless otherwise stated)
31 October 2005
2005 Scotiabank Annual Report
60
Notes to the Financial Statements(expressed in thousands of Jamaican dollars unless otherwise stated)
31 October 2005

2005 Scotiabank Annual Report
61
Notes to the Financial Statements(expressed in thousands of Jamaican dollars unless otherwise stated)
31 October 2005

2005 Scotiabank Annual Report
62
Notes to the Financial Statements(expressed in thousands of Jamaican dollars unless otherwise stated)
31 October 2005

2005 Scotiabank Annual Report
63
Notes to the Financial Statements(expressed in thousands of Jamaican dollars unless otherwise stated)
31 October 2005

2005 Scotiabank Annual Report
64
Notes to the Financial Statements(expressed in thousands of Jamaican dollars unless otherwise stated)
Year ended 31 October 2005
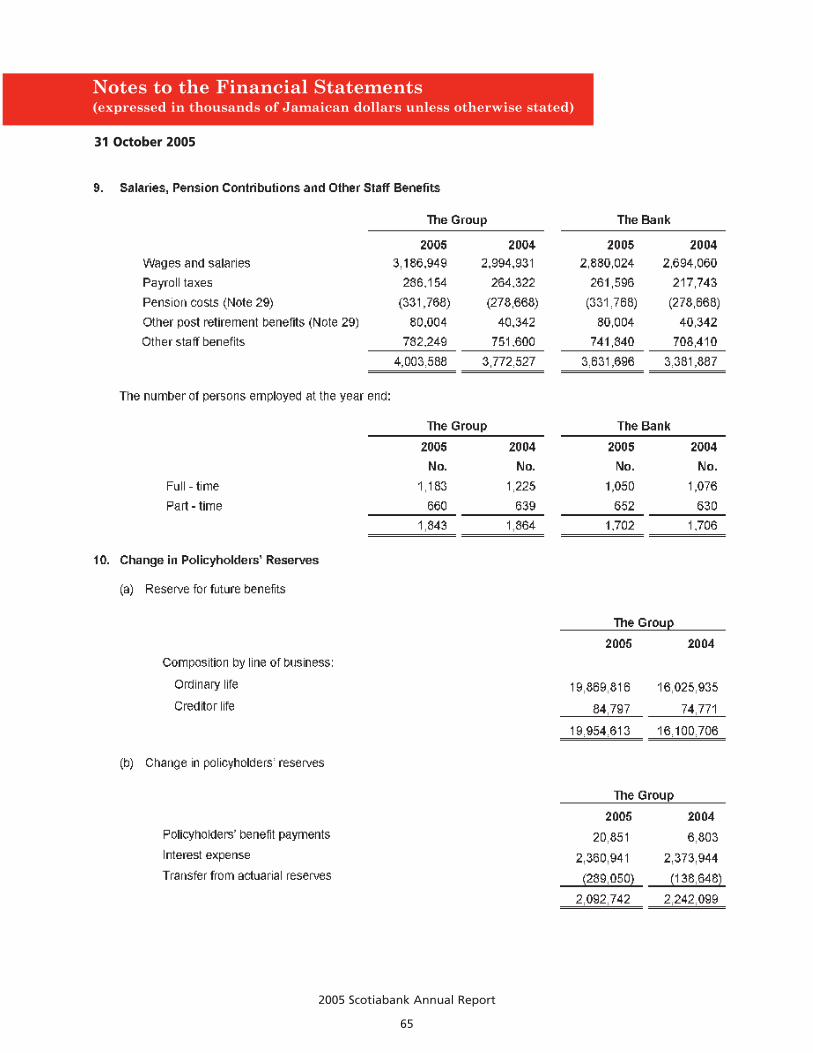
2005 Scotiabank Annual Report
65
Notes to the Financial Statements(expressed in thousands of Jamaican dollars unless otherwise stated)
31 October 2005
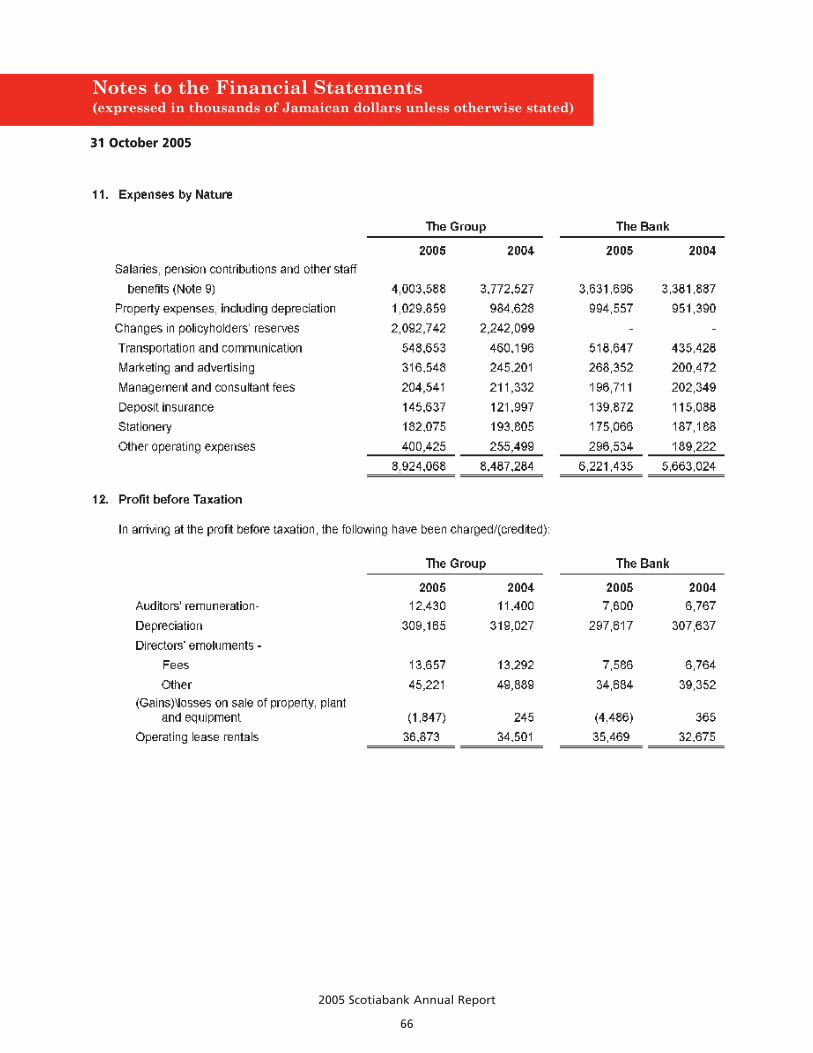
2005 Scotiabank Annual Report
66
Notes to the Financial Statements(expressed in thousands of Jamaican dollars unless otherwise stated)
31 October 2005

2005 Scotiabank Annual Report
67
Notes to the Financial Statements(expressed in thousands of Jamaican dollars unless otherwise stated)
31 October 2005

2005 Scotiabank Annual Report
68
Notes to the Financial Statements(expressed in thousands of Jamaican dollars unless otherwise stated)
31 October 2005

2005 Scotiabank Annual Report
69
Notes to the Financial Statements(expressed in thousands of Jamaican dollars unless otherwise stated)
31 October 2005

2005 Scotiabank Annual Report
70
Notes to the Financial Statements(expressed in thousands of Jamaican dollars unless otherwise stated)
31 October 2005

2005 Scotiabank Annual Report
71
Notes to the Financial Statements(expressed in thousands of Jamaican dollars unless otherwise stated)
31 October 2005

2005 Scotiabank Annual Report
72
Notes to the Financial Statements(expressed in thousands of Jamaican dollars unless otherwise stated)
31 October 2005

2005 Scotiabank Annual Report
73
Notes to the Financial Statements(expressed in thousands of Jamaican dollars unless otherwise stated)
31 October 2005
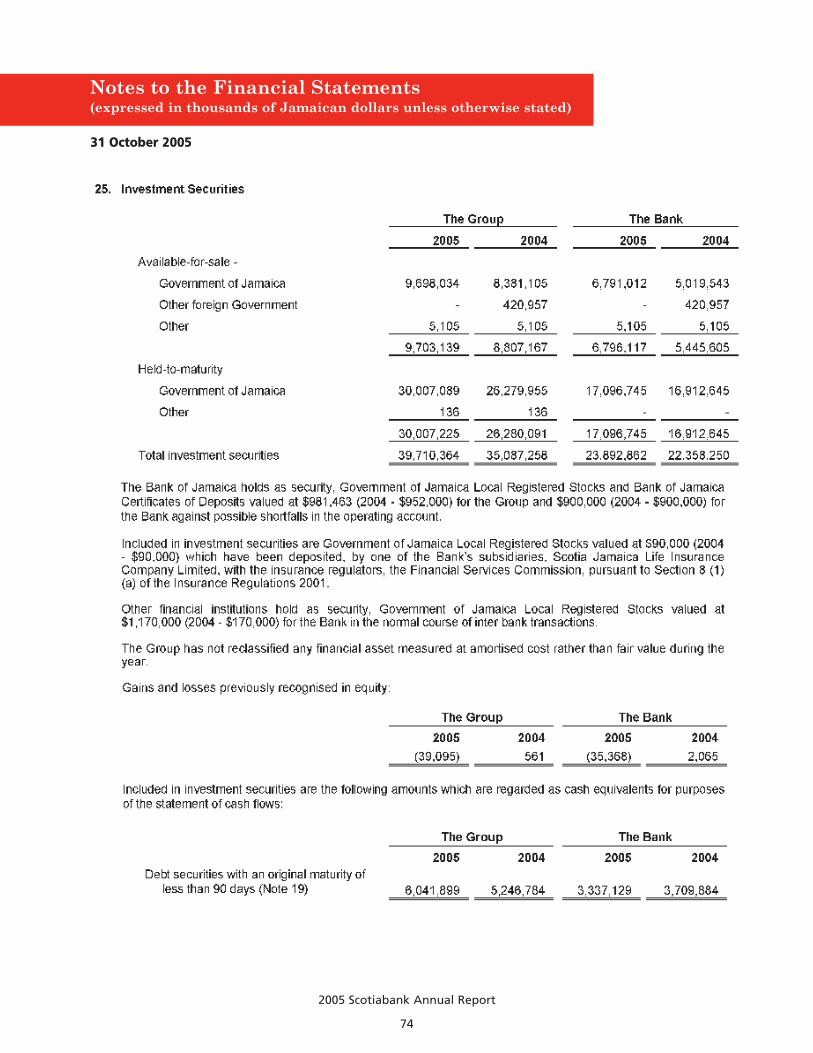
2005 Scotiabank Annual Report
74
Notes to the Financial Statements(expressed in thousands of Jamaican dollars unless otherwise stated)
31 October 2005

2005 Scotiabank Annual Report
75
Notes to the Financial Statements(expressed in thousands of Jamaican dollars unless otherwise stated)
31 October 2005

2005 Scotiabank Annual Report
76
Notes to the Financial Statements(expressed in thousands of Jamaican dollars unless otherwise stated)
31 October 2005

2005 Scotiabank Annual Report
77
Notes to the Financial Statements(expressed in thousands of Jamaican dollars unless otherwise stated)
31 October 2005
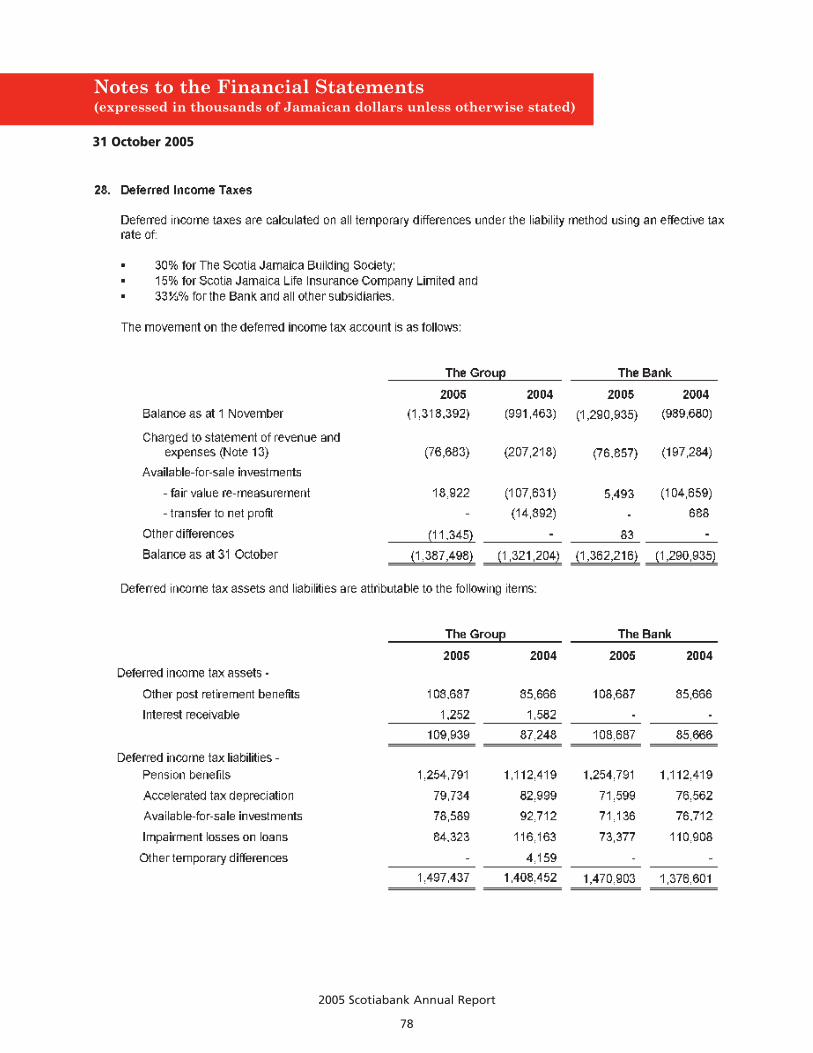
2005 Scotiabank Annual Report
78
Notes to the Financial Statements(expressed in thousands of Jamaican dollars unless otherwise stated)
31 October 2005

2005 Scotiabank Annual Report
79
Notes to the Financial Statements(expressed in thousands of Jamaican dollars unless otherwise stated)
31 October 2005

2005 Scotiabank Annual Report
80
Notes to the Financial Statements(expressed in thousands of Jamaican dollars unless otherwise stated)
31 October 2005

2005 Scotiabank Annual Report
81
Notes to the Financial Statements(expressed in thousands of Jamaican dollars unless otherwise stated)
31 October 2005

2005 Scotiabank Annual Report
82
Notes to the Financial Statements(expressed in thousands of Jamaican dollars unless otherwise stated)
31 October 2005

2005 Scotiabank Annual Report
83
Notes to the Financial Statements(expressed in thousands of Jamaican dollars unless otherwise stated)
31 October 2005

2005 Scotiabank Annual Report
84
Notes to the Financial Statements(expressed in thousands of Jamaican dollars unless otherwise stated)
31 October 2005

2005 Scotiabank Annual Report
85
Notes to the Financial Statements(expressed in thousands of Jamaican dollars unless otherwise stated)
31 October 2005

2005 Scotiabank Annual Report
86
Notes to the Financial Statements(expressed in thousands of Jamaican dollars unless otherwise stated)
31 October 2005
2005 Scotiabank Annual Report
87
Notes to the Financial Statements(expressed in thousands of Jamaican dollars unless otherwise stated)
31 October 2005
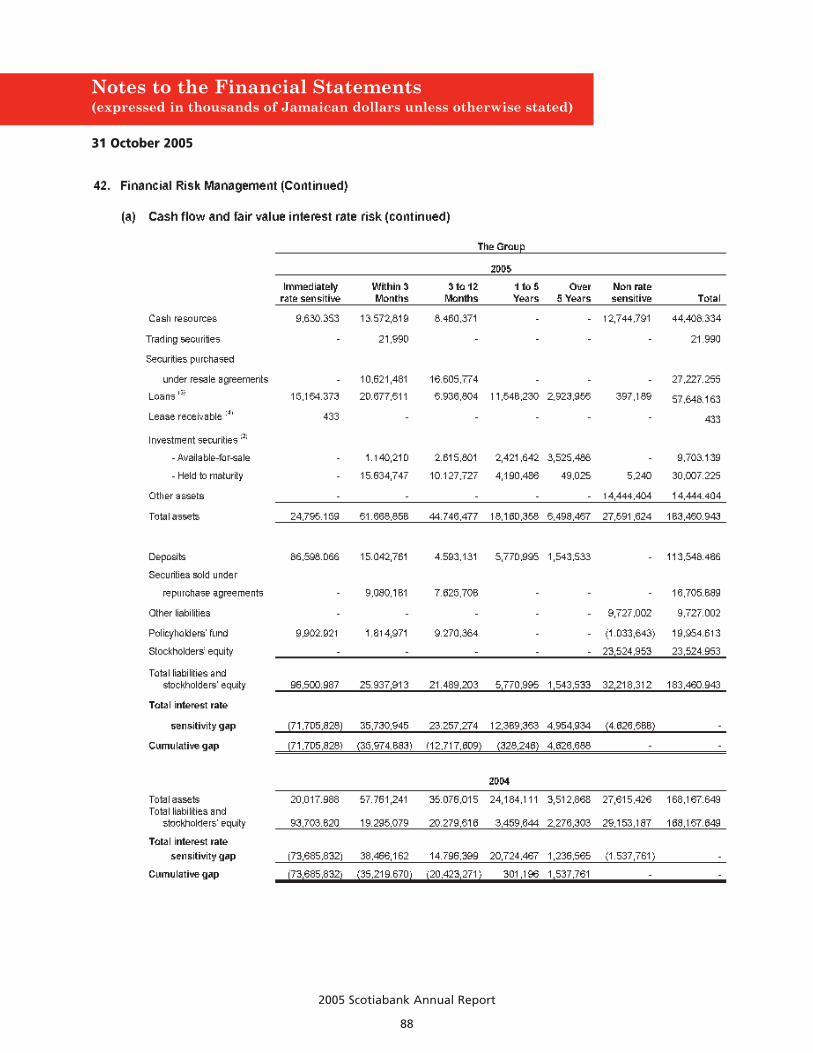
2005 Scotiabank Annual Report
88
Notes to the Financial Statements(expressed in thousands of Jamaican dollars unless otherwise stated)
31 October 2005

2005 Scotiabank Annual Report
89
Notes to the Financial Statements(expressed in thousands of Jamaican dollars unless otherwise stated)
31 October 2005
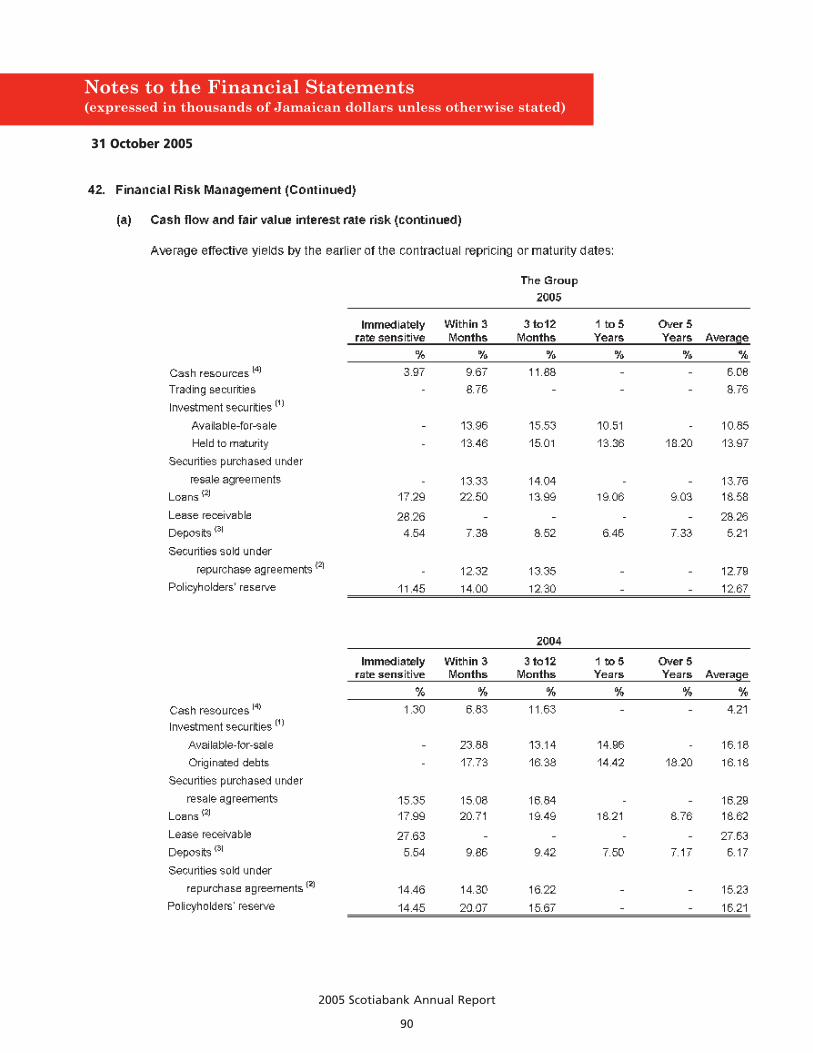
2005 Scotiabank Annual Report
90
Notes to the Financial Statements(expressed in thousands of Jamaican dollars unless otherwise stated)
31 October 2005

2005 Scotiabank Annual Report
91
Notes to the Financial Statements(expressed in thousands of Jamaican dollars unless otherwise stated)
31 October 2005
2005 Scotiabank Annual Report
92
Notes to the Financial Statements(expressed in thousands of Jamaican dollars unless otherwise stated)
31 October 2005

2005 Scotiabank Annual Report
93
Notes to the Financial Statements(expressed in thousands of Jamaican dollars unless otherwise stated)
31 October 2005
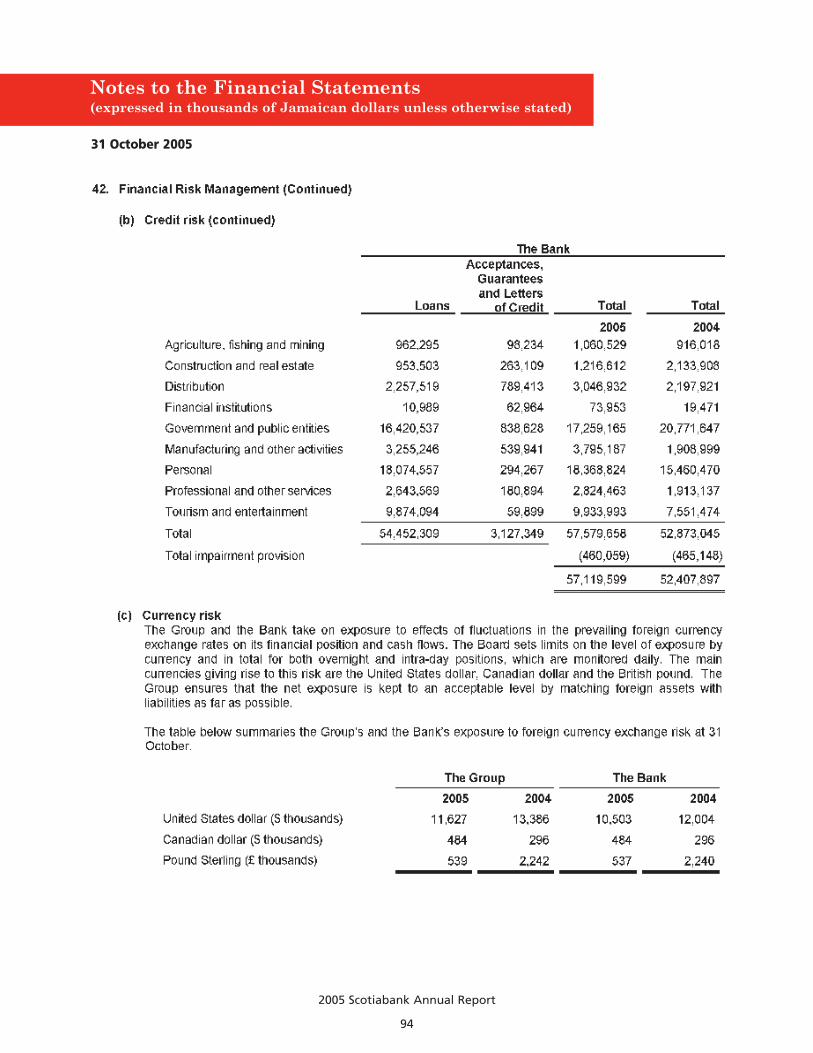
2005 Scotiabank Annual Report
94
Notes to the Financial Statements(expressed in thousands of Jamaican dollars unless otherwise stated)
31 October 2005

2005 Scotiabank Annual Report
95
Notes to the Financial Statements(expressed in thousands of Jamaican dollars unless otherwise stated)
31 October 2005
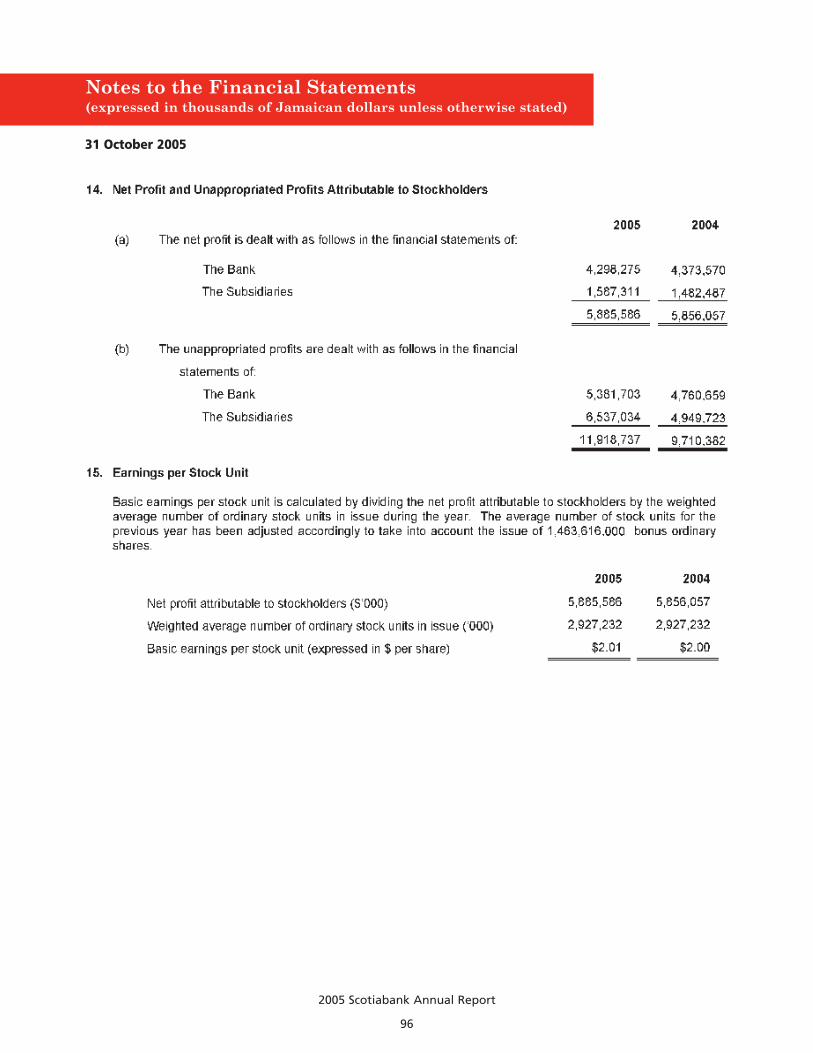
2005 Scotiabank Annual Report
96
Notes to the Financial Statements(expressed in thousands of Jamaican dollars unless otherwise stated)
31 October 2005
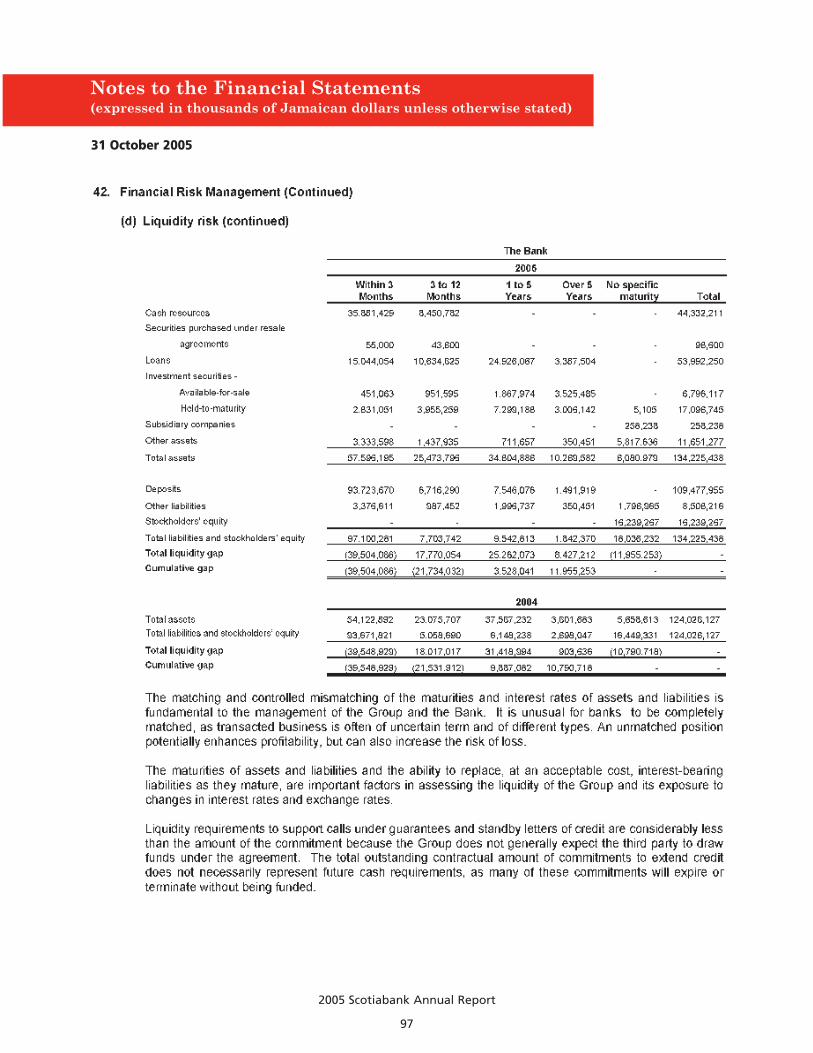
2005 Scotiabank Annual Report
97
Notes to the Financial Statements(expressed in thousands of Jamaican dollars unless otherwise stated)
31 October 2005
2005 Scotiabank Annual Report
98
Notes to the Financial Statements(expressed in thousands of Jamaican dollars unless otherwise stated)
31 October 2005
2005 Scotiabank Annual Report
99
Notes to the Financial Statements(expressed in thousands of Jamaican dollars unless otherwise stated)
31 October 2005

2005 Scotiabank Annual Report
100
Notes to the Financial Statements(expressed in thousands of Jamaican dollars unless otherwise stated)
31 October 2005
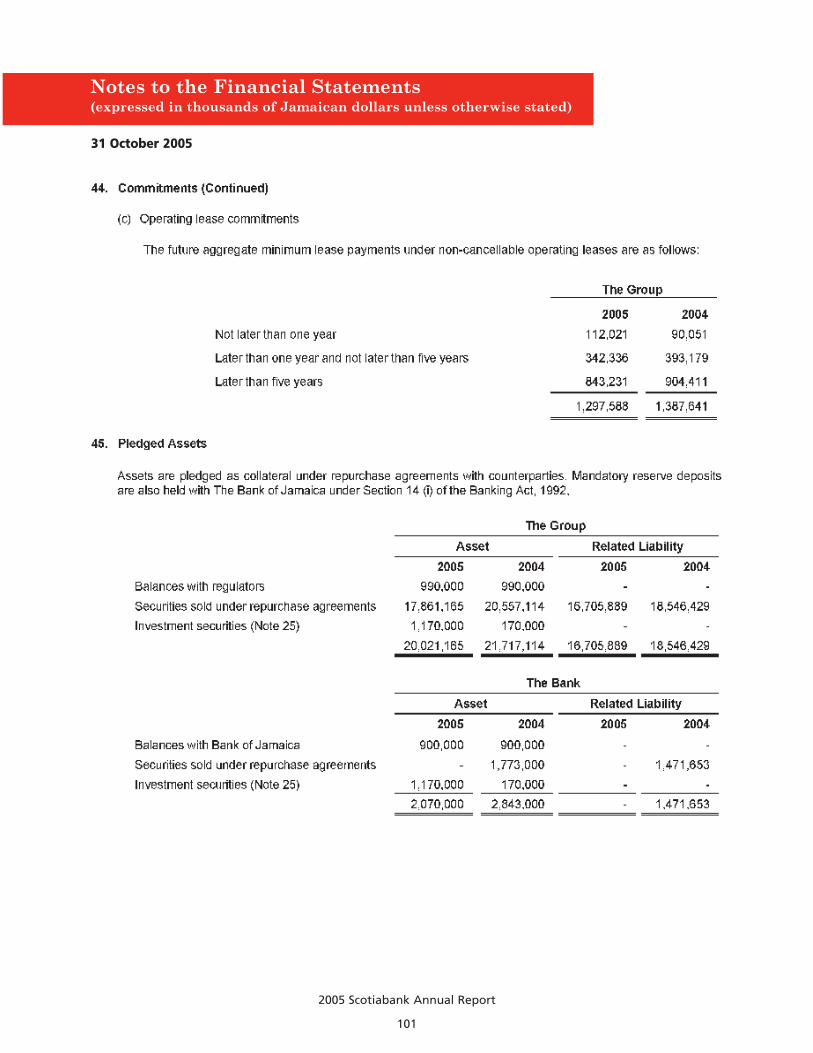
2005 Scotiabank Annual Report
101
Notes to the Financial Statements(expressed in thousands of Jamaican dollars unless otherwise stated)
31 October 2005

2005 Scotiabank Annual Report
102
Notes to the Financial Statements(expressed in thousands of Jamaican dollars unless otherwise stated)
31 October 2005
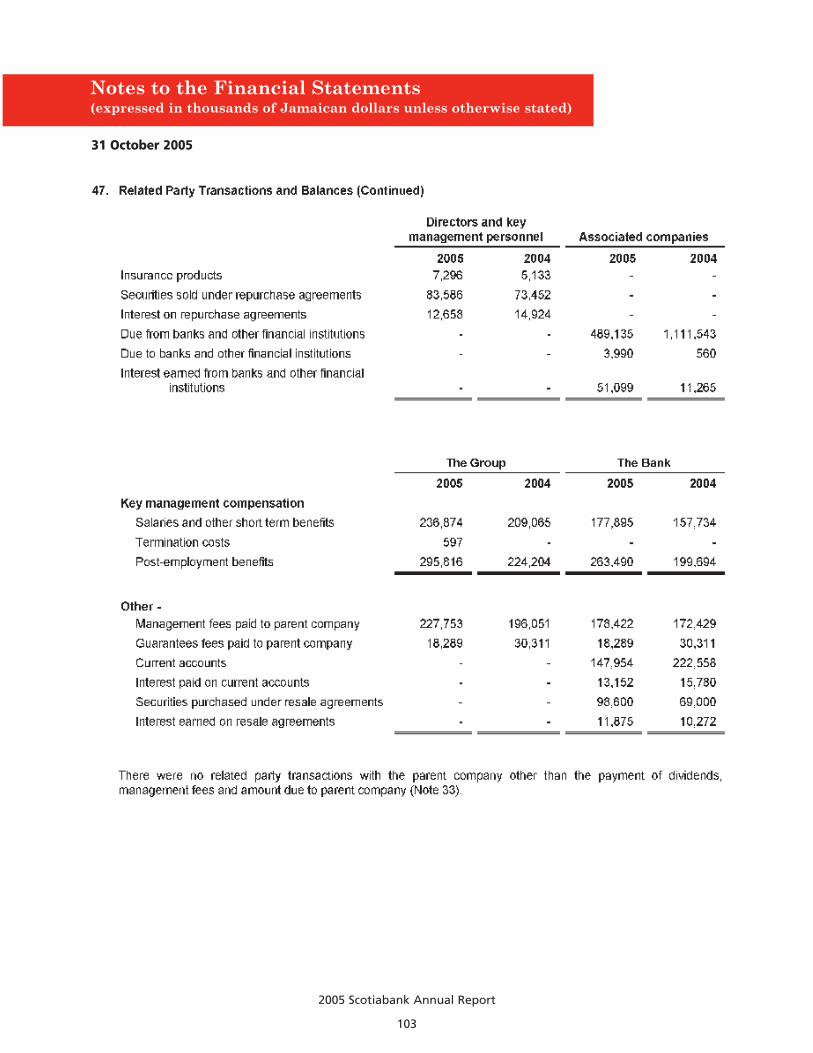
2005 Scotiabank Annual Report
103
Notes to the Financial Statements(expressed in thousands of Jamaican dollars unless otherwise stated)
31 October 2005
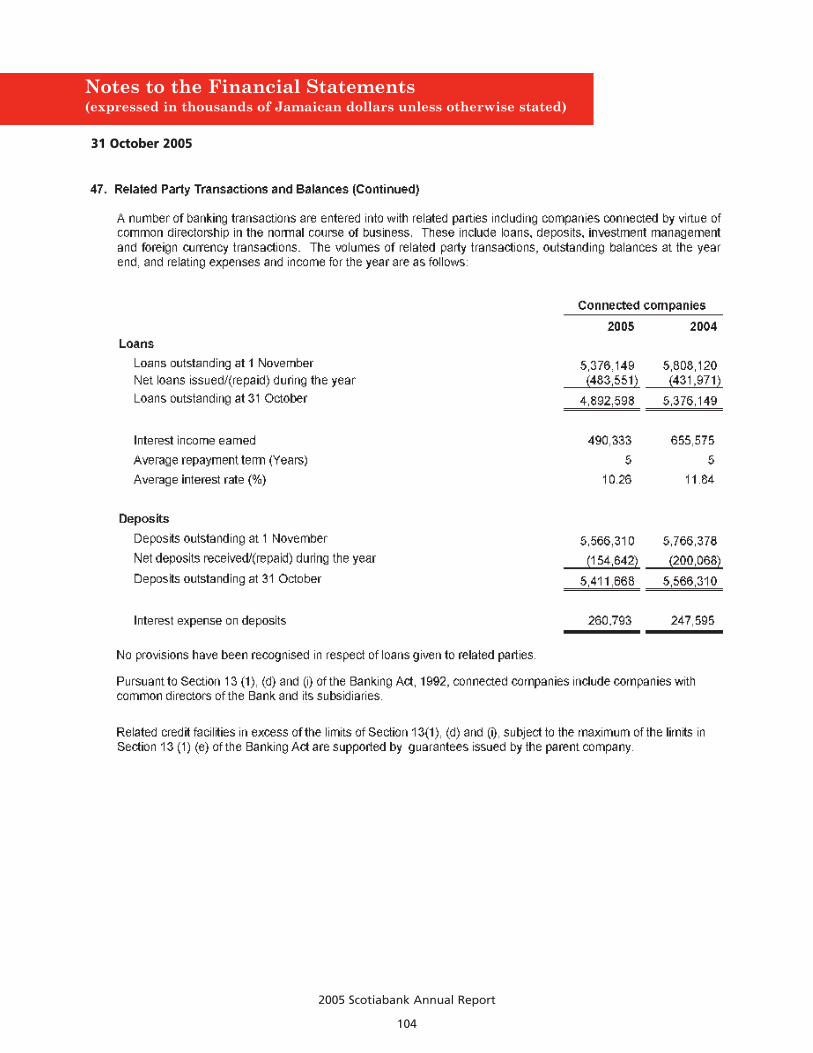
2005 Scotiabank Annual Report
104
Notes to the Financial Statements(expressed in thousands of Jamaican dollars unless otherwise stated)
31 October 2005

2005 Scotiabank Annual Report
105
Notes to the Financial Statements(expressed in thousands of Jamaican dollars unless otherwise stated)
31 October 2005
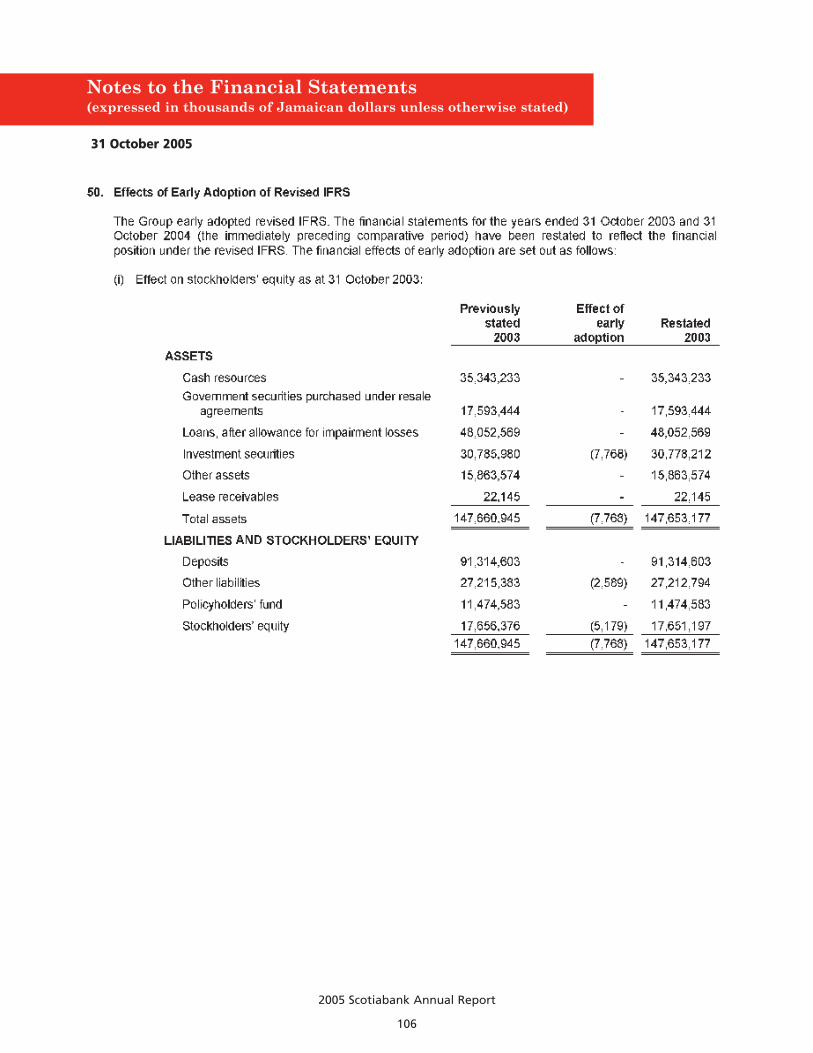
2005 Scotiabank Annual Report
106
Notes to the Financial Statements(expressed in thousands of Jamaican dollars unless otherwise stated)
31 October 2005

2005 Scotiabank Annual Report
107
Notes to the Financial Statements(expressed in thousands of Jamaican dollars unless otherwise stated)
31 October 2005

Glossary
2005 Scotiabank Annual Report
108
Assets held in TrustAssets administered by the Bank and its subsidiaries, which arebeneficially owned by customers and are therefore not reportedon the consolidated balance sheet. Services provided in respectof these assets are administrative in nature, such as securitycustody, trusteeship, stock transfer and personal trust services.
Bankers’ Acceptances (BAs) A type of negotiable, short-term debt security, generally issuedby a non-financial entity and guaranteed for a fee, by theissuer’s bank.
Basis PointA unit of measure defined as one-hundredth of one per cent.
Capital Consists of common shareholders' equity and preferredshareholders’ equity. Capital funds support asset growth,provide against loan losses, and protect the Bank’s depositors.
General ProvisionEstablished against the loan portfolio in the Bank’s business lines when the Bank’s assessment of economic trendssuggests that losses may occur, but that such losses cannot yetbe determined on an item-by-item basis.
Guarantees & Letters of CreditAssurances given by the Bank that it will make payments onbehalf of customers to third parties in the event that thecustomers default. The Bank normally has recourse against itscustomers for funds advanced under such arrangements.
Net Interest Margin Net interest income,expressed as a percentage of average totalassets.
Non-Performing LoansLoans on which the Bank no longer has reasonable assuranceas to the timely collection of interest and principal, or where acontractual payment is past due a prescribed period. Interest isnot accrued on non-performing loans.
Off-Balance Sheet InstrumentsThese instruments are comprised of indirect creditcommitments, which include the Bank’s commitments toextend credit facilities to its customers which are not yet drawn.
Productivity RatioProductivity ratio measures the efficiency with which the Bankincurs expenses to generate revenue. It expresses non-interestexpenses as a percentage of the sum of net interest incomeand other income. A lower ratio indicates improvedproductivity.
Provisions for Loan LossesAn allowance set aside from income, which, in management’sopinion, is adequate to absorb all credit-related losses in itsportfolio of both on and off-balance sheet items. It is decreasedby write-offs, realized losses and recoveries, and increased bynew provisions for loan losses. The provisions for loan losses isdeducted from the related asset category on the balance sheet.
ReposRepos is the short form for “obligations related to assets soldunder repurchase agreements” - a short-term transactionwhereby the Bank sells securities to a customer andsimultaneously agrees to repurchase the securities on aspecified date and at a specified price. It is a form of short-termfunding.
Return on Equity (ROE)Net income, less preferred share dividends, expressed as apercentage of average common shareholders equity.
Reverse ReposReverse Repos is the short form for “assets purchased underresale agreements” -a short-term transaction whereby theBank purchases securities from a customer and simultaneouslyagrees to resell the securities on a specified date and at aspecified price. It is a form of short-term collateralized lending.
Risk-Adjusted AssetsCalculated using weights based on the degree of credit risk foreach class of counterparty. Off-balance sheet instruments areconverted to balance sheet equivalents, using specifiedconversion factors, before the appropriate risk weights areapplied.
Tier 1, Tier 2 Capital RatiosThese are ratios of capital to risk-adjusted assets, as stipulated by the Bank of Jamaica, based on guidelinesdeveloped under the auspices of the Bank for InternationalSettlements (BIS). Tier 1 capital, the more permanent,consists primarily of common shareholders’ equity plusnon-cumulative preferred shares, and certain designatedretained earnings which by statute may not be distributedor reduced without permission from the Bank of Jamaica.Tier 2 is mainly the general provision.
2005 Scotiabank Annual Report
109
Scotiabank believes that sound and effective corporate governance practices are essential to our long-term
success. Our corporate governance practices are designed to ensure the independence of our Board of
Directors and its ability to effectively supervise management’s operation of the Bank. Good corporate
governance practices are important to the creation of shareholder value and maintaining the confidence of depositors
and investors.
Board independence ensures that the Bank is managed for the long-term benefit of all stakeholders – shareholders,
employees, customers and the communities in which we operate. Our Bank therefore ensures that the majority of our
Directors are independent with eleven of our fifteen current Directors being independent of the Bank, its parent or its
affiliates (and thirteen Directors being non-executive Directors). The composition of the Board therefore provides
management with independent and objective oversight and strategic guidance. The Board also ensures that key
committees (such as the Audit Committee, the Conduct Review Committee and the Human Resources Committee) are
comprised of independent directors who have the requisite skills to carry out the respective mandates.
The effectiveness of any Board of Directors will also be dependent on the quality of the individuals who serve as
Directors. Our Bank prides itself on having individuals serving as directors who are business and community leaders who
have distinguished themselves in various fields of business and academia. Our Directors have contributed significantly to
the Bank’s success over the years and we are confident that they will continue to do so in the future.
From time to time, new Directors are appointed to the Board who are able to provide a different perspective to the
Board’s deliberations. The process of continually appointing new Directors as others retire ensures that the Board
continues to evolve in changing times. In 2005, three new Directors were appointed to the Board.
The Scotiabank Group is committed to good corporate governance and will continue to comply with international best
practices and with any guidance from the Jamaica Stock Exchange, the Bank of Jamaica and the Financial Services
Commission.
Corporate Governance

2005 Scotiabank Annual Report
110
Board of Directors of the Bank
Mr. Robert H. Pitfield is the ExecutiveVice President, International Banking, ofthe parent Company, The Bank of NovaScotia, Canada and is responsible for allof the Bank’s retail and commercialoperations outside of Canada & USA. Hewas appointed a Director and Chairman ofThe Bank of Nova Scotia Jamaica Limited onMay 22, 2003 and is a member of the Executiveand Pension Committees.
Hon. Mayer Matalon is the DeputyChairman of the I.C.D. Group Limited.He is also the Deputy Chairman of theBoard of the Bank and Chairman of theExecutive Committee of the Board.Mr. Matalon has been a Director of theBank since 1966.
Mr. William Clarke, President and CEO of theBank, was appointed to the Board on May 18, 1995. He is a member of theExecutive and Pension Committees of theBoard and is also a Director of Scotia JamaicaInvestment Management Limited, The ScotiaJamaica Building Society, Scotia Jamaica LifeInsurance Company Limited, Scotia JamaicaGeneral Insurance Brokers Limited, Scotia FinancialServices Limited and Scotiabank Jamaica Foundation.
Dr. Jean Dixon is the PermanentSecretary in the Ministry of Industry,Commerce and Technology. She hasbeen a Director since February 19, 1998and is a member of the Executive andAudit Committees of the Board. Dr. Dixonis also the Chairperson of the Board ofDirectors of The Scotia Jamaica BuildingSociety and Scotiabank Jamaica Foundation.
Mr. Anthony Chang is the ManagingDirector of T. Geddes Grant Limited. Hewas appointed to the Board of the Bankon February 5, 2001 and is a member ofthe Human Resources and PensionCommittees of the Board. Mr. Chang isalso a Director of Scotia Jamaica LifeInsurance Company Limited.
Celia Christie is a Professor of Pediatricsand a specialist in Pediatric infectiousdiseases, epidemiology and PublicHealth at the University of the WestIndies. Professor Christie has been aDirector of the Bank since February 5, 2001and is also a member of the Audit andConduct Review Committees of the Board.She is also a Director of Scotia Jamaica LifeInsurance Company Limited.
Miss Muna Issa is the Treasurer ofSuperClubs. She has been a Director ofthe Bank since August 26, 1999 and isalso a member of the Human ResourcesCommittee of the Board. Miss Issa is alsothe Chairperson of the Board of ScotiaJamaica Life Insurance Company Limitedand a member of the Board of The ScotiaJamaica Building Society.
W. E. Clarke, C.D.
A. V. Chang
Hon. M. M. Matalon, O.J. Deputy Chairman
R. H. Pitfield Chairman
Dr. J. A. Dixon
Prof. C. D.C. Christie
Mr. Charles Johnston is the Chairmanand Managing Director of Jamaica Fruitand Shipping Company Limited. He wasappointed to the Board of the Bank onAugust 22, 2002 and is the Chairmanof the Human Resources Committee and a member of the Executive and AuditCommittees of the Board.
C. H. Johnston
M. M. Issa

2005 Scotiabank Annual Report
111
Mr. William McConnell is the ManagingDirector of Lascelles DeMercado CompanyLimited. He has been a Director of theBank since February 18, 1988. He is alsoa member of the Executive and PensionCommittees of the Board and Chairman ofScotia Jamaica Investment ManagementLimited.
Dr. Herbert Thompson is the President ofThe Northern Caribbean University. Hewas appointed to the Board of the Bankon August 19, 1998 and is also amember of the Executive, Audit andConduct Review Committees of the Board.Dr. Thompson is also Deputy Chairman ofthe Board of the Scotia Jamaica BuildingSociety.
Miss Stacie Ann Wright is the ExecutiveVice President and Chief FinancialOfficer of the Bank and was appointedto the Board on September 1, 2005.Miss Wright is also a Director of ScotiaJamaica Life Insurance Company Limited,Scotia Jamaica Building Society, ScotiaJamaica Investment Management Limited,Scotia Jamaica Financial Services Limited and Scotiabank Jamaica Foundation.
Mr. Richard E. Waugh is the President ofThe Bank of Nova Scotia, Canada. Mr.Waugh is a member of the Board ofDirectors of The Bank of Nova Scotia andseveral of the Bank’s subsidiaries andaffiliates. He was appointed to the Boardof Directors of The Bank of Nova ScotiaJamaica Limited on February 20, 2003.
Mr. Joseph M. Matalon is the Chairmanand Chief Executive Officer of the ICDGroup Limited. He was appointed aDirector on September 1, 2005 and is amember of the Audit and HumanResources Committees of the Board.
Stephen Vasciannie is currently Professorof International Law at the University ofthe West Indies and Head of theInternational Division of the AttorneyGeneral’s Chambers. Professor Vascianniewas appointed a Director on September 1,2005. He is a member of the ConductReview and Pension Committees of the Boardand is also a Director of Scotia Jamaica LifeInsurance Company Limited and Scotia JamaicaInvestment Management Limited.
R. E. WaughW. A. McConnell, C.D.
J. M. Matalon
Dr. H. J. Thompson
S. A. Wright
Prof. S. C. Vasciannie
Mr. Warren McDonald is the ManagingDirector and Chief Executive Officer ofBerger Paints Jamaica Limited.Mr. McDonald was appointed to theBoard of the Bank on February 5, 2001and is a member of the Audit and PensionCommittees of the Board. He is also aDirector of Scotia Jamaica InvestmentManagement Limited.
W. A. McDonald
2005 Scotiabank Annual Report
112
Executive and Senior Management Officers
EXECUTIVE OFFICERS
William E. ClarkePresident and CEO
H. Wayne PowellExecutive Vice President,Retail Sales Management
Mrs. Rosemarie A. PillinerExecutive Vice President,Operations & Service Delivery
Miss Stacie-Ann WrightExecutive Vice President,& Chief Financial Officer
Michael D. Jones Senior Vice President,Human Resources
David A. NoëlSenior Vice President / Senior Legal Counsel & Corporate Secretary
Mrs. Audrey M. Tugwell Henry Senior Vice President,Retail & Electronic Banking
SENIOR MANAGEMENT OFFICERS
AuditYvonne M. Pandohie Vice President & Chief Auditor
Corporate Affairs & MarketingMrs. Marie Powell Vice President,Corporate Affairs & Marketing
Corporate & Commercial Banking CentreWayne P. HewittVice President,Corporate & Commercial Banking
Bevan A. Callam Assistant General Manager,Corporate & Commercial Risk
Michael A. Thompson Assistant General Manager,Business Development
Credit Risk ManagementHenri R. BourdeauVice President, Risk Management
Donald O. Williams Vice President,Credit Risk Management
District Vice Presidents
Egerton G. Anderson
Roger R. Cogle
Employee Communications & Consultations UnitMrs. Rosemarie A. VoordouwDirector
2005 Scotiabank Annual Report
113
SENIOR MANAGEMENT OFFICERS cont’d.
FinanceMiss Shirley K. Ramsaran Assistant General Manager,Finance & Comptroller
Hugh G. MillerAssistant General Manager,Treasury & Foreign Exchange
Information Systems CentreMiss Sharon A. Colquhoun Director
Operations and Shared ServicesMrs. Suzette A. M. McLeodVice President, Shared Services
David M. WilliamsAssistant General Manager,Operations & Sales Support
Private Banking Services
Miss Bridget A. LewisGeneral Manager
Retail & Electronic Banking
Clyde C. Singh Assistant General Manager,Electronic Banking
Mrs. Karen TomlinsonDirectorRetail Banking
SENIOR MANAGEMENT OFFICERS cont’d.
The Scotia Jamaica Building Society
Gladstone F. WhitelockeGeneral Manager
Scotia Jamaica Investment Management Limited
Miss Janice V. Robinson Vice President & General Manager
Scotia Jamaica Life Insurance Company Limited
Mrs. Jacqueline T. SharpVice President & General Manager
Scotiabank Jamaica Foundation
Mrs. Marie Powell Executive Director

2005 Scotiabank Annual Report
114
Corporate Directory
BLACK RIVER6 High StreetP. O. Box 27Black RiverSt. Elizabeth
R. R. Reid, Manager
BROWN’S TOWNMain StreetP. O. Box 35Brown’s Town St. Ann
Mrs. D. A. Maxwell, Manager
CHRISTIANAMain StreetP. O. Box 11Christiana, Manchester
C. A. Dawes, Manager
CORPORATE & COMMERCIAL BANKING CENTREMiss M. P. McLeggon, Snr. Relationship ManagerMiss C.A. Logan, Snr. Relationship ManagerP. R. Gajraj, Snr. Relationship ManagerL. M. Reynolds, Snr. Relationship ManagerC. M. Newman, Snr. Relationship ManagerMrs. D.A. Mighty, Relationship ManagerMrs. S. M. Chambers-Creary, Relationship ManagerK.A.Townsend, Relationship ManagerH. P. Ebanks, Relationship ManagerMrs.A. M. Buckley, Relationship ManagerM. G.Verley, Relationship Manager
CROSS ROADS86 Slipe RoadP. O. Box 2Kingston 5
J. A. Clarke, Manager
FALMOUTHTrelawny WharfP. O. Box 27Falmouth,Trelawny
S. H. Thompson, Manager
HAGLEY PARK ROAD128 Hagley Park RoadP. O. Box 5Kingston 11
Miss V. I. Omess, Manager
Mrs. Y. T. Leslie, Asst. Manager
HALF-WAY-TREE80 Half-Way-Tree RoadP. O. Box 5Kingston 10
D. E. Walters, Manager
Miss G. N. Crawford, Senior Account Manager
L. S. Estick, Account Manager
Mrs. V. J. James, Account Manager
V. A. Harvey,Assistant Manager, Operations & Service
Miss D. A. Hyman, Account Manager,
Mrs. K. N. Chang, Account Manager
HIGHGATEMain StreetP. O. Box 9HighgateSt. Mary
O.W. Stephenson, Manager
IRONSHORE SERVICE CENTREShops 2 & 3, Golden Triangle Shopping CentreIronshoreMontego Bay
Miss D. M. Mortimer, Manager
JUNCTIONJunction P. O.St. Elizabeth
Mrs. C.A. Sanderson, Manager
KING STREET35-45 King StreetP. O. Box 511, Kingston
T. V. Allen, Manager
Mrs. W. D. O’Connor, Asst. Manager
C.C. Wiggan, Asst. Manager
Mrs. L. D. Stewart, Asst. Manager, Operations
D. W. Quarrie, Asst. Manager,Personal Banking
LIGUANEA125-127 Old Hope RoadP. O. Box 45Kingston 6
S.A. Distant, Manager
LINSTEAD42 King StreetP. O. Box 19Linstead St. Catherine
Miss J. Carter, Manager
Mrs. A. Y. Howard, Asst. Manager
LUCEAWillie Delisser BoulevardP. O. Box 63Lucea Hanover
M. A. Elliot, Manager
MANDEVILLE 1A Caledonia RoadP. O. Box 106Mandeville, Manchester
A. C. Bright, Manager
Miss A. E. Senior, Asst. Manager, Credit
J. J. Smalling, Manager,Personal Banking
Mrs. L. M. Vickers, Asst. Manager,Operations & Service
MAY PEN36 Main StreetP.O. Box 32May Pen Clarendon
Mrs. B. M. Corrie, Manager
MONTEGO BAY6-7 Sam Sharpe SquareP.O. Box 311 Montego BaySt. James
Miss M. A. Flake, Manager
C. A. Marshall, Asst. Manager, Credit
Mrs. A. E. Bell-Grant, Account Manager
Mrs. A. M. Walters, Asst. Manager, Operations
W. O. Carr, Asst. Manager,Personal Banking
MORANT BAY23 Queen StreetP. O. Box 30 Morant Bay St. Thomas
C. A. Wright, Manager
BRANCHES AND MANAGERS

2005 Scotiabank Annual Report
115
NEGRILNegril Square Negril P. O.Westmoreland
G. E. Gray, Manager
NEW KINGSTON2 Knutsford BoulevardP. O. Box 307Kingston 5
B. C. Chisholm, Manager
Miss S. C. Lue, Asst. Manager
A. O. Harvey, Asst. Manager,Personal Banking
M. S. Nelson. Asst. Manager, Operations
OCHO RIOSMain StreetP. O. Box 150Ocho RiosSt.Ann
Miss T. M. Palmer, Manager
K. E. Reese,Asst. Manager
OLD HARBOUR4 South StreetP. O. Box 43Old HarbourSt. Catherine
Miss M.A. Foster, Manager
OXFORD ROAD6 Oxford RoadP. O. Box 109Kingston 5
Miss. J.A. Sutherland, Manager
PORT ANTONIO3 Harbour StreetP. O. Box 79Port Antonio Portland
F. O.Wright, Manager
PORT MARIA57 Warner StreetP. O. Box 6Port MariaSt. Mary
Mrs. O.A.Whittaker, Manager
PORTMORELot 2 Cookson Pen, Bushy Park P.O. Box 14.Greater Portmore,St Catherine.
A. D. Johnson, Manager
PREMIER 10 Constant Spring RoadP. O. Box 509Kingston 10
A.A. Boyd, Manager
ST. ANN’S BAY18 Bravo StreetP. O. Box 2St.Ann's Bay St.Ann
Mrs. N. F. Haughton, Manager
SANTA CRUZ77 Main StreetP. O. Box 20Santa CruzSt. Elizabeth
D. A. James, Manager
SAVANNA-LA-MAR19 Great George’s StreetP.O. Box 14Savanna-La-MarWestmoreland
M. E. Shaw, Manager
Miss T. E. Buddo,Asst. Manager
SCOTIABANK CENTRECnr. Duke & Port Royal StreetsP. O. Box 59Kingston
D.A. Hanson, Manager
T. C. James,Account Manager
Mrs.W. M. Mowatt, Operations Manager
SPANISH TOWN27 Adelaide StreetSpanish Town St. Catherine
R.A. Sangster, Manager
Mrs. I. C. Tucker, Asst. Manager
UWI, MONA CAMPUSCnr. Ring Road & Shed LaneKingston 7
Miss P. N. Buchanan, Manager
VICTORIA & BLAKE29 Victoria AvenueP.O. Box 625Kingston
N. L. Stultz, Manager
WESTGATEWestgate Shopping CentreP.O. Box 11Montego BaySt. James
Mrs. G.A. Morrison, Manager
SUB-BRANCHES
BARNETT STREET (Sub to Montego Bay)51 Barnett StreetMontego BaySt. James
CLAREMONT(Sub to St.Ann’s Bay)Claremont P.O.Claremont St.Ann
CLARK'S TOWN (Sub to Falmouth)Clark's Town P. O.Trelawny
FRANKFIELD (Sub to Christiana)FrankfieldClarendon
GAYLE (Sub to Ocho Rios)Gayle P. O.St. Mary
ORACABESSA(Sub to Port Maria)Oracabessa P. O.St. Mary
PARK CRESCENT(Sub to Mandeville)17 Park CrescentMandevilleManchester

2005 Scotiabank Annual Report
116
Corporate Directory
SCOTIA JAMAICA INVESTMENT MANAGEMENT LIMITED
4th Floor, Scotiabank CentreCnr. Duke & Port Royal StreetsP.O. Box 627 Kingston, Jamaica
Board of DirectorsW. A. McConnell, C.D. - ChairmanW. E. Clarke, C.D.Ms. E. M. Brown Mrs. A. M. Tugwell-HenryC. H. JohnstonW. A. McDonald R. U. PatrickH. W. PowellProf. S. C. VasciannieMiss S. A. Wright
Senior Officers:Miss J. V. RobinsonVice President & General Manager
K. HarrisSenior Manager Investments
Miss N. K. HinesManager, Trust & Registration Services
G. A. WhiteManager, Finance & Operations
B. O. FrazerManager, Securities, Trading & Investments
SCOTIA JAMAICA LIFE INSURANCE COMPANY LIMITED
5th Floor, Scotiabank CentreCnr. Duke & Port Royal StreetsKingston, Jamaica
Board of DirectorsMiss M. M. Issa - ChairpersonW. E. Clarke, C.D.A. V. Chang Prof. C. D. C. ChristieH. W. PowellH. A. ReidDr. A. E. SamuelsP. B. ScottMiss S. A. WrightMs. E. Leung
Senior Officers:Mrs. J. T. SharpVice President & General Manager
Mrs. M. AnthonySenior Manager, Finance & Investments
Mrs. E. A. HendricksManager, Marketing & Communications
Ms. L. S. HeslopManager, Operations & Customer Service
THE SCOTIA JAMAICA BUILDING SOCIETY
95 Harbour StreetP.O. Box 8463Kingston, Jamaica
Board of DirectorsDr. J. A. Dixon - ChairpersonDr. H. J. Thompson - Deputy Chairman Dr. C. D. ArcherW. E. Clarke, C.D.Miss M. M. Issa H. W. PowellMrs. M. PowellMiss J. A. ThompsonMiss S. A. Wright
Senior Officers:G. F. WhitelockeGeneral Manager
Ms. L. FullerManager, Finance & Operations
P. F. WilliamsManager, Mortgage Services
SCOTIA JAMAICA FINANCIAL SERVICES LIMITED
Scotiabank CentreCnr. Duke & Port Royal StreetsP.O. Box 709Kingston, Jamaica
Board of DirectorsW. E. Clarke, C.D.- Chairman Mrs. A. M. Tugwell-HenryH. W. PowellMrs. M. PowellMiss S. A. Wright
SCOTIABANK JAMAICA FOUNDATION
Scotiabank CentreCnr. Duke & Port Royal StreetsP.O. Box 709Kingston, Jamaica
Board of DirectorsDr. J. A. Dixon - ChairpersonE. H. AndersonMs. E. M. BrownW. E. Clarke, C.D., Deputy ChairmanM. JonesMrs. R. A. PillinerH. W. PowellMrs. M. Powell Miss S. A. Wright
Senior Officer:Mrs. M. PowellExecutive Director
SCOTIA JAMAICA GENERAL INSURANCE BROKERS LIMITED
5th Floor, Scotiabank CentreCnr. Duke & Port Royal StreetsKingston, Jamaica
Board of DirectorsW. E. Clarke, C.D. - Chairman E. H. AndersonH. W. PowellMrs. R. A. PillinerMiss J. V. RobinsonG. F. Whitelocke
BRIGHTON HOLDINGS LIMITED
Scotiabank CentreCnr. Duke & Port Royal StreetsKingston, Jamaica
Board of DirectorsW.E. Clarke, C.D. - ChairmanE. H. AndersonH. W. PowellMiss S. A. Wright
BOARDS OF DIRECTORS AND SENIOR OFFICERSas at 31 October 2005
WHOLLY-OWNED SUBSIDIARIES AND SCOTIABANK JAMAICA FOUNDATION
2005 Scotiabank Annual Report
117
EXECUTIVE COMMITTEE OF THE BOARD
Hon. M. M. Matalon, O.J.Chairman
W. E. Clarke, C.D.Dr. J. A. DixonW. A. McConnell, C.D.C. H. JohnstonR. H. PitfieldDr. H. J. Thompson
AUDIT COMMITTEE
Dr. J. A. DixonChairperson
Prof. C. D. C. ChristieW. A. McDonaldC. H. JohnstonDr. H. J. ThompsonJ. M. Matalon
HUMAN RESOURCES COMMITTEE
C. H. Johnston Chairman
A. V. Chang Miss M. M. IssaDr. J. A. DixonJ. M. Matalon
PENSION COMMITTEE
W. A. McConnell, C.D.Chairman
R. H. PitfieldW. E. Clarke, C.D.A. V. ChangW. A. McDonaldProf. S. C. Vasciannie
CONDUCT REVIEW COMMITTEE
Dr. H. J. ThompsonChairman
Prof. C. D. C. ChristieProf. S. C. VasciannieMiss M. M. Issa
AUDITORS
PricewaterhouseCoopersScotiabank CentreCnr. Duke & Port Royal StreetsP.O. Box 372Kingston, Jamaica
Telephone: (876) 922.6230Fax: (876) 922.7581
REGISTERED OFFICE
Scotiabank CentreCnr. Duke & Port Royal StreetsP.O. Box 709Kingston, Jamaica
Telephone: (876) 922.1000Fax: (876) 922.6548Website: www.jamaica.scotiabank.comTelex: 2297SWIFT Bic Code: NOSCJMKN
REGISTRAR & TRANSFER AGENT
Scotia Jamaica Investment Management Limited4th Floor, Scotiabank CentreCnr. Duke & Port Royal StreetsP.O. Box 627Kingston, Jamaica
Telephone: (876) 922.1810Fax: (876) 922.3378
SECRETARY
David A. NoëlSenior Vice President/Senior Legal Counsel& Corporate Secretary
The Bank of Nova Scotia Jamaica LimitedExecutive OfficesScotiabank CentreCnr. Duke & Port Royal StreetsP.O. Box 709Kingston, Jamaica
THE BANK OF NOVA SCOTIA JAMAICA LIMITED COMMITTEES & MEMBERS

NOTES

I/We......................................................................................................................................................................................of..........................................................................................................................................................................................in the parish of ...........................................................being a Member of the above Company, hereby appointthe Chairman of the Meeting or failing him (see Note 1)....................................................................................................................................................................................................................................................................................of...................................................................................................................................................................or failingthem.................................................................................................................................................................................of............................................................................................................................................as my/our Proxy to vote forme/us on my/our behalf at the Annual General Meeting of the Company to be held on the 17th day ofFebruary 2006 and at any adjournment thereof.
Please indicate by inserting a cross in the appropriate square how you wish your votes to be cast. Unlessotherwise instructed, the Proxy will vote or abstain from voting, at his discretion.
....................................................................................Signature
1. If you wish to appoint a proxy other than the Chairman of the Meeting, please insert the person's name and address and delete (initialing the deletion) "the Chairman of the Meeting".
2. To be valid, this form of proxy and the power of attorney or other authority (if any) under which it is signed must be lodged at the office of the Registrar of the Company, Scotia Jamaica Investment Management Limited (formerly Scotiabank Jamaica Trust and Merchant Bank Limited), 4th Floor, Scotiabank Centre, Cnr. Duke & Port Royal Streets, Kingston, at least 48 hours before the time appointed for the holding of the meeting.
3. To this form must be affixed a $100.00 stamp in payment of stamp duty.
4. In the case of joint shareholders, the vote of the senior who tenders a vote, whether in person or by proxy, shall be accepted to the exclusion of the vote(s) of the other joint holder(s) and for this purpose seniority shall be determined by the order in which the names stand in the register of members.
5. To be effective, this form of proxy must be signed by the appointer or his attorney, duly authorised in writing or, if the appointer is a corporation, must be under its common seal or be signed by some officer or attorney duly authorised in that behalf.
PROXY FORM
THE BANK OF NOVA SCOTIA JAMAICA LIMITED
RESOLUTION
NO. 1
NO. 2
NO. 3(a)
NO. 3(b)
NO. 3(c)
NO. 3(d)
NO. 3(e)
NO. 3(f)
NO. 3(g)
NO. 4
FOR AGAINST
As witness my hand this...............................................................................................................day
of................................................................................................................................200...................