who is high income, anyway? social comparison, subjective
TRANSCRIPT

Who Is High Income, Anyway? Social Comparison,
Subjective Group Identification, and Preferences
over Progressive Taxation
Asli Cansunar, University of Oxford
Why are high-income and low-income earners not significantly polarized in their support for progressive income tax-
ation? This article posits that the affluent fail to recognize that they belong to the high-income income group and this
misperception affects their preferences over progressive taxation. To explain this mechanism theoretically, I introduce a
formal model of subjective income-group identification through self-comparison to an endogenous reference group. In
making decisions about optimal tax rates, individuals then use these subjective evaluations of their own income group and
earnings of other groups. Relying on ISSP data, I find strong evidence for the model’s empirical implications: most high-
income earners support progressive taxation when they identify themselves with a lower group. Additionally, individuals
who overestimate the earnings of the rich are more likely to support progressive taxation.
Investigating the determinants of support for welfare pro-
vision has been one of the fundamental themes in polit-
ical science. This centrality seems emblematic of Laswell’s
(1936) famous definition of politics as a process of determin-
ing “who gets what, when, and how.” Although it has not re-
ceived as much scholarly attention, of equal importance is “who
pays what, when, and how.” The size of the welfare budget and
the number of recipients both depend on the revenue that the
government raises through taxation. “Who gets?” and “who
pays?” are not rival but complementary lines of inquiry for the
size and the feasibility of the governmental provision of anti-
poverty programs, direct transfers, public services, and social
insurance. It is the disjunction between the receivers and payers,
as well as the magnitude and direction of the net transfers
between these groups, that define both the progressivity of the
welfare system and, consequently, the intensity of class conflict.
In most welfare systems in advanced industrial countries,
the current position of an individual in the income distribu-
tion determines the amount of benefits to which she is enti-
tled. The link between income level and welfare-related gains,
or losses, becomes even more significant when societies have
very progressive statutory tax regimes, in other words, tax
policies in which the tax rate increases as the taxable income
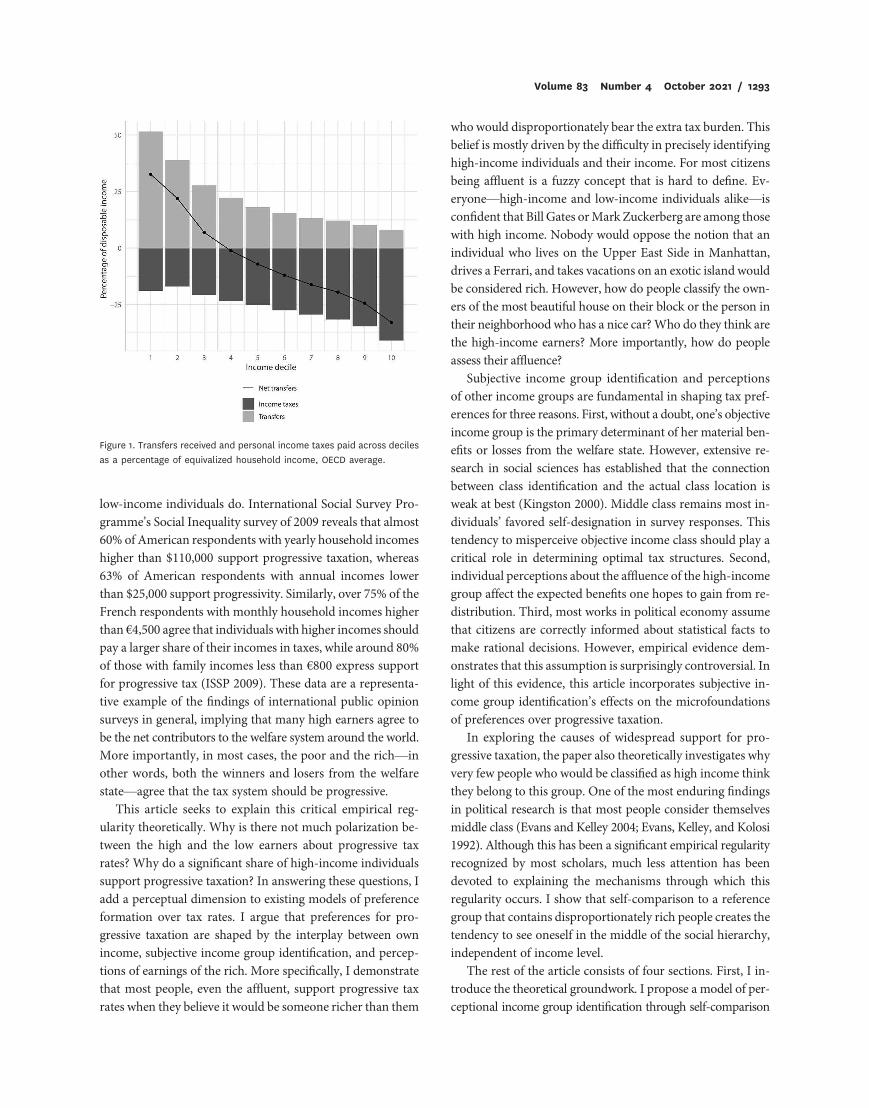
increases. Figure 1 displays the income taxes and government
transfers as a percentage of equivalized household disposable
income by decile for the working-age individuals from 32 Orga-
nization for Economic Cooperation and Development (OECD)
countries (Causa and Hermansen 2018). The light and dark
bars represent the size of the government benefits received
and income taxes paid, respectively, while the black line shows
the net benefits from the welfare state. Holding the distribu-
tion of benefits constant, it is evident that households in the
higher deciles of the income distribution disproportionately
bear the costs of redistributive policies. On average, house-
holds in the lowest decile receive almost 30% of their dispos-
able income as net benefits, while the households in the top
decile give almost 30% of their income as net contributions.
Thus, it is no coincidence that most scholarly work on pref-
erences over redistribution treats personal income as the pri-
mary driver of tax preferences (Meltzer and Richard 1981).
However, empirical evidence shows that, on average, high-
income individuals support progressive taxation as much as
Asli Cansunar ([email protected]) is a postdoctoral research fellow at the Department of Political Science and International Relations and
Nuffield College at the University of Oxford, Oxford, UK, OX1 1NF.
Data and supporting materials necessary to reproduce the numerical results in the article are available in the JOP Dataverse (https://dataverse.harvard.edu
/dataverse/jop). An online appendix with supplementary material is available at https://doi.org/10.1086/711627.
Published online July 21, 2021.
The Journal of Politics, volume 83, number 4, October 2021. q 2021 Southern Political Science Association. All rights reserved. Published by The University
of Chicago Press for the Southern Political Science Association. https://doi.org/10.1086/711627
low-income individuals do. International Social Survey Pro-
gramme’s Social Inequality survey of 2009 reveals that almost
60% of American respondents with yearly household incomes
higher than $110,000 support progressive taxation, whereas
63% of American respondents with annual incomes lower
than $25,000 support progressivity. Similarly, over 75% of the
French respondents with monthly household incomes higher
than €4,500 agree that individuals with higher incomes should
pay a larger share of their incomes in taxes, while around 80%
of those with family incomes less than €800 express support
for progressive tax (ISSP 2009). These data are a representa-
tive example of the findings of international public opinion
surveys in general, implying that many high earners agree to
be the net contributors to the welfare system around the world.
More importantly, in most cases, the poor and the rich—in
other words, both the winners and losers from the welfare
state—agree that the tax system should be progressive.
This article seeks to explain this critical empirical reg-
ularity theoretically. Why is there not much polarization be-
tween the high and the low earners about progressive tax
rates? Why do a significant share of high-income individuals
support progressive taxation? In answering these questions, I
add a perceptual dimension to existing models of preference
formation over tax rates. I argue that preferences for pro-
gressive taxation are shaped by the interplay between own
income, subjective income group identification, and percep-
tions of earnings of the rich. More specifically, I demonstrate
that most people, even the affluent, support progressive tax
rates when they believe it would be someone richer than them
who would disproportionately bear the extra tax burden. This
belief is mostly driven by the difficulty in precisely identifying
high-income individuals and their income. For most citizens
being affluent is a fuzzy concept that is hard to define. Ev-
eryone—high-income and low-income individuals alike—is
confident that Bill Gates or Mark Zuckerberg are among those
with high income. Nobody would oppose the notion that an
individual who lives on the Upper East Side in Manhattan,
drives a Ferrari, and takes vacations on an exotic island would
be considered rich. However, how do people classify the own-
ers of the most beautiful house on their block or the person in
their neighborhood who has a nice car? Who do they think are
the high-income earners? More importantly, how do people
assess their affluence?
Subjective income group identification and perceptions
of other income groups are fundamental in shaping tax pref-
erences for three reasons. First, without a doubt, one’s objective
income group is the primary determinant of her material ben-
efits or losses from the welfare state. However, extensive re-
search in social sciences has established that the connection
between class identification and the actual class location is
weak at best (Kingston 2000). Middle class remains most in-
dividuals’ favored self-designation in survey responses. This
tendency to misperceive objective income class should play a
critical role in determining optimal tax structures. Second,
individual perceptions about the affluence of the high-income
group affect the expected benefits one hopes to gain from re-
distribution. Third, most works in political economy assume
that citizens are correctly informed about statistical facts to
make rational decisions. However, empirical evidence dem-
onstrates that this assumption is surprisingly controversial. In
light of this evidence, this article incorporates subjective in-
come group identification’s effects on the microfoundations
of preferences over progressive taxation.
In exploring the causes of widespread support for pro-
gressive taxation, the paper also theoretically investigates why
very few people who would be classified as high income think
they belong to this group. One of the most enduring findings
in political research is that most people consider themselves
middle class (Evans and Kelley 2004; Evans, Kelley, and Kolosi
1992). Although this has been a significant empirical regularity
recognized by most scholars, much less attention has been
devoted to explaining the mechanisms through which this
regularity occurs. I show that self-comparison to a reference
group that contains disproportionately rich people creates the
tendency to see oneself in the middle of the social hierarchy,
independent of income level.
The rest of the article consists of four sections. First, I in-
troduce the theoretical groundwork. I propose a model of per-
ceptional income group identification through self-comparison
Figure 1. Transfers received and personal income taxes paid across deciles
as a percentage of equivalized household income, OECD average.
Volume 83 Number 4 October 2021 / 1293

to an endogenous reference group. Second, I show that this pro-
cess leads to subjective group identification and beliefs about
the affluence levels of other groups. These subjective per-
ceptions affect the link between an individual’s income and
her attitudes toward progressivity. Finally, I proceed to test
these arguments empirically. Using the 2009 Social Inequality
International Social Survey Programme (ISSP 2009), I find
that individuals who overestimate the income of the rich place
themselves in lower-income groups. Also, I find strong evi-
dence that overestimating the income of the rich and under-
estimating one’s position increase demand for progressive tax
rates.
INFORMATION, SUBJECTIVE PERCEPTIONS,
AND PREFERENCES
Most studies in political science assume that voters are income-
maximizing individuals. This assumption has two significant
empirical implications. First, individuals with similar income
levels should have similar views on redistribution and taxa-
tion. If their income levels are identical, the same policy will
maximize their benefits. Second, the rich and the poor should
have polarized political preferences about the progressivity of
the tax system. To maximize their economic self-interest, the
rich should oppose purely redistributive welfare policies and a
progressive tax code. Instead, they should express support for
a flat or a regressive tax schedule. Conversely, the poor should
support a progressive tax code (Beramendi and Rehm 2016).
Yet this line of theoretical research has encountered many
empirical objections. Surprisingly, the rich and the poor do
not necessarily hold polarized levels of support for the pro-
gressivity of tax rates. Investigating the respondents who agree
with the statement that “people with high incomes should pay
a larger/much larger share of their incomes in taxes than those
with low incomes” in ISSP (2009), the different groups clearly
show little polarization. Over 80% of the respondents in the
first income decile express support for a progressive tax sched-
ule, and about 70% of the respondents in the top decile do so.
What is surprising is the small difference between the number
of individuals who support progressive taxation in the richest
and poorest groups. This finding is contradictory to the results
of the canonical models of political science which posit that
taxation is a constant source of the battle between the rich and
the poor across time and policy domains.
One possible explanation is that people care about things
other than material self-interest. Several influential contri-
butions to the comparative politics literature have taken up
the challenge of amending the utility function of the canonical
model of redistribution. In particular, they incorporate an-
other source of utility other than posttax and transfer income
in the individual’s utility function. These studies posit that
people’s decisions, along with material self-interest, are af-
fected by altruism (Dimick, Rueda, and Stegmueller 2016),
religion (Stegmueller 2013), beliefs about what is fair (Alesina
and Angeletos 2005), group loyalty (Shayo 2009), and distaste
for inequality (Lü and Scheve 2016).
Another explanation is that the rich support redistribu-
tion when the welfare state benefits them. Moene and Wal-
lerstein (2001) argue that the affluent may be willing to pay
higher taxes if the fiscal system is oriented more toward
insurance than redistribution. Beramendi and Rehm (2016, 2)
contribute to this discussion by pointing out that “by deter-
mining who gives and who gains, the design of the tax and
transfer system shapes citizens’ expected net benefits and
mediates the impact of income on preferences for redistribu-
tion.” Similarly, Rehm, Hacker, and Schlesinger (2012) argue
that high-income citizens with high risk support welfare pol-
icies. The central insight from these studies is that the policy
and risk environment in which voters operate has potent ef-
fects in shaping their redistributive preferences.
One thing that both lines of literature have in common
is the assumption of perfect information. Much of the existing
scholarship on preferences over redistribution takes the no-
tion of perfect information for granted. In these models, in-
dividuals are correctly informed about the income distribu-
tion, their position in that distribution, and the particulars of
the fiscal system.
However, a critical insight emerging from empirical re-
search is that voters substantially vary in how much they
know. Gingrich (2014) shows that almost 40% of citizens in
Portugal, Ireland, Italy, and Spain choose the “Don’t know”
option in the Eurobarometer survey when they are asked
how much unemployment benefit they would get if they were
to be laid off. Other recent evidence establishes that citizens
have misperceptions about the level of income inequality
(Gimpelson and Treisman 2018), and individuals also err in
predicting their positions in the income distribution (Cruces,
Perez-Truglia, and Tetaz 2013; Fernández-Albertos and Kuo
2018). In light of these empirical results, it is unrealistic to
assume that all citizens can accurately calculate the expected
benefits and losses.
In this paper, I introduce a different approach than the
utility-function arguments by revisiting the informational as-
sumptions. The disconnect between the informational require-
ments of theoretical models of the political economy of re-
distribution and documented voter ignorance has critical
empirical implications that merit analytic consideration. When
making decisions about tax rates, an individual will draw on
her political knowledge, as well as perceptions, to appraise
the set of possible policies. Her subjective perceptions might
induce behavior that is observationally disparate from the
1294 / Who Is High Income, Anyway? Asli Cansunar

optimal choice that maximizes material payoff. This is true
even if the individual only cares about benefits and losses from
welfare policies. For example, a high-income citizen who wishes
to maximize her material self-interest and who firmly believes
that she belongs to the middle-income class might support
progressive taxation, although in reality, under a progressive
tax scheme, she might be a net contributor to the welfare
system rather than a net beneficiary. Similarly, a high-income
individual who identifies with the high-income group might
agree to progressive taxation if she believes the other members
of that group earn significantly more than she does.
Of course, I am not the first analyst to argue that subjective
perceptions that emerge in the absence of information have
important consequences for political choice. The mismatch
between the informational requirements of democracy and
most people’s ability to meet these requirements has attracted
much attention from political scientists. There has been an
ongoing debate about whether democratic processes are des-
tined to turn into a “tyranny of the experts” (Dahl 1967) or
whether reasoned choice can be made without full informa-
tion, through the ability to predict consequences of actions
(Lupia and McCubbins 1998). In their seminal work, Lupia
and McCubbins (1998) identify the specific conditions under
which people with limited information can make reasoned
democratic choices. Specifically, recent work in political econ-
omy has documented that citizens misperceive inequality
levels (Cruces et al. 2013; Fernández-Albertos and Kuo 2018;
Gimpelson and Treisman 2018; Kuziemko et al. 2015). How-
ever, little theoretical research has been done to identify these
perceptions’ sources. Why do a significant share of high-income
respondents underestimate their rank? Why do the affluent
think they belong to the middle class? Does this “identity crisis”
affect their preferences over taxation? In the next section, I
take on this challenge.
A MODEL OF GROUP IDENTIFICATION
AND TAX PREFERENCES
This paper examines whether a model of social comparison,
endogenous reference groups, and subjective income group
identification, grounded primarily in evidence from social
psychology, can help us understand patterns of support for
progressive taxation in the absence of perfect information. I
now offer a formalization that builds on the canonical Meltzer
and Richard (1981) model. Starting with a model of decision-
making with informed individuals, I extend the model to in-
clude uninformed individuals to highlight the difference be-
tween the two cases.
The basic premise of the model is that individuals only care
about their material payoff from redistributive policies. There
is a finite set of individuals, N, who compose a single nation;
YNp fy
1; y
2; ::: y
Ng is the set of these individuals’ incomes.
For simplicity, I assume that there are two income groups:
high-income individuals, denoted by H, and low-income in-
dividuals, denoted by L. These individuals are referred to as
“low income” and “high income,” but one should keep in
mind that “low income” is a catch-all phrase that includes all
those who are not “high income.” I further assume an exog-
enously determined threshold income, yt, such that individual
i belongs to group L if yi≤ y
t, and otherwise belongs to H.
Let –yH
be the average income of the high-income group and–yL
be that of the low-income group. Additionally aL is the
proportion of low-income individuals and 1 2 aY is the pro-
portion of high-income individuals in the nation.
I begin by supposing that individuals have perfect in-
formation on N, YN, and yt. This implies that individuals are
informed about the income distribution and the threshold
income that separate income groups. Individuals use N, YN,
and yt to calculate the average income of the high-income
group, –yH
, and the average income of the low-income group,–yL. This provides a benchmark against which the results
can be compared when the imperfect information case is
introduced.
Also, there exists a set of possible tax policies T p
TH# TL, such that TH
p ½0; 1� is the set of all possible tax
rates that can be chosen for high-income individuals and,
similarly, TLp ½0; 1� is the set of all tax rates that can be
chosen for low-income individuals. I assume a model of re-
distribution by two different rates of linear taxation to allow
for a progressive system to formulate the individual utility
from taxes and transfers (Lü and Scheve 2016). The maxi-
mization problem of an individual i is given by:
maximizetL;tH
Ui(y
i; tL; tH) p Ti 1 F 2 C; ð1Þ
where T(i) is defined as the posttax income of the individual i,
F is the amount of transfers, and C denotes the costs of tax-
ation. In particular, I assume that the individual i who be-
longs to the low-income group—that is, has pretax income
yi! y
t—has a posttax income of Ti p (1 2 tL)y
i.
By the same token, an individual i who belongs to the high-
income group has a posttax income of Ti p (1 2 tL)yt1
(1 2 tH)(yi2 y
t). According to this formalization, high-
income individuals only pay the tax rate of tH for the part
of their income that exceeds the threshold that separates
the two income groups. Additionally, F is defined as F p
aLtL–yL 1 (1 2 aL)½tLyt 1 tH( –y
H2 y
t)�, and C is defined as
C pojpL;Hgt2j
where g 1 0.
Given this formulation, individual i’s solution to the op-
timization problem has the following properties. First, low-
income individuals always demand progressive taxation.
Volume 83 Number 4 October 2021 / 1295

Additionally, high-income individuals, unless their income is
very low compared to others in the high-income group, op-
pose progressive taxation. In sum, when individuals have per-
fect information about the income distribution, income groups,
and average income levels of different factions, people at the
different ends of the income distribution should have polar-
ized views on progressive taxation.1
Subjective income-group identification
Now consider an informational variation on the above max-
imization problem in which the assumption of perfect infor-
mation about the economic variables in the model is relaxed.
An individual may or may not be fully informed about N,
YN, yt, –yL, and –y
H. If the individual is informed, the decision-
making process is similar to the case discussed above.
However, the individual might not know the true values
of these parameters. After all, there is a great consensus among
political scientists about citizens’ ignorance in economic and
political matters. In the absence of information, an individual
uses cognitive devices, informational shortcuts, and personal
experience to predict the values of the parameters that are
needed to make a decision (Lupia and McCubbins 1998; Tversky
and Kahneman 1974). As Lippman (1922, 18) suggests, “The
world we have to deal with politically is out of reach, out of
sight, out of mind. . . . Gradually he makes for himself a trust-
worthy picture inside his head of the world beyond his reach.”
For most people, this trustworthy picture involves a more
familiar and simplified version of the real world. For example,
when asked about preferences over inequality-reducing poli-
cies, an average person would try to think about a small group
of individuals to generate the needed information instead of
thinking about the national income distribution.
More formally, I posit that if individual i is not informed,
she will think about a nonempty set of individuals, Ni, with
incomes YN i
to estimate the income distribution, the thresh-
old income (yt), and the average income of the income groups
(–yH
and –yL). One can conceptualize N i, as the individual’s ref-
erence group. Here, I do not impose any restrictions on either
the composition of the reference group or the income levels
associated with the individuals in the reference group. More
specifically, the reference group need not be a proper subset of
the population or be a group of people with whom the indi-
vidual has personal ties.
Before specifying the model, it is worthwhile to explain
further the lack of constraints on Ni. Most work in economic
network effects rests on the assumption that the reference
group is exogenous and the same for all individuals in a given
setting. A group of studies assumes that the residents of the
local geographical area of the individual constitute the refer-
ence group (John, Song, and Gunatilika 2009). Another line of
research posits that the reference groups consist of the people
whom an individual personally knows and with whom she has
daily interactions, such as friends, family members (McBride
2001), or coworkers (Brown et al. 2008). While this formu-
lation can be analytically convenient, social scientists have yet
to show why the reference group should consist of only one
prespecified group defined by observable characteristics (such
as age, race, education level), the frequency of interaction, or
geographical proximity. In this paper I do not model, or
specify, the psychological process by which reference groups
evolve. Rather, the focus is on the individual’s process of
generating information and that information’s impact on
social policy preferences given different possible reference
groups.
The question is then, of course, is it possible that indi-
viduals think about a reference group that is not a proper
subset of the national population? Evidence from social psy-
chology shows that the use of heuristics in the absence of per-
fect information could induce differences between the national
population and reference groups. One such example is what
Kahneman and Tversky (1972, 430) called the representative-
ness heuristic, defined as “the action of evaluating the proba-
bility of an uncertain event, or a sample, by the degree to which
it is similar in essential properties to its parent population.”
When individuals are not correctly informed about the econ-
omy, they might be more inclined to think about a prototypical
rich person, instead of judging the probability of the existence of
such an individual objectively. This tendency is amplified with
the increasing prevalence of social media outlets, where people
are systematically subject to information about people they
do not personally know.
Research shows that individuals often use information from
social media or traditional media outlets to construct percep-
tions of social reality, including the perception of widespread
presence of affluence and the affluent. This claim is backed
with evidence from a growing body of research in psy-
chology that concludes that what people see on social net-
work sites or fictional shows affects their reference groups
(Haferkamp and Krämer 2011; Hyll and Schneider 2013;
Wang et al. 2017) Thus, with the use of heuristics and in-
formational shortcuts, the reference group can include people
with whom the individual has close ties or no ties, or even
“prototypes” who do not exist at all. As Kahneman, Siovic, and
Tversky (1982, 86) put it, “people often err by recognizing a
prototypical stimulus that has never been shown.”
Let me give a more intuitive example of what a subjective
reference group, Ni, is, and how the inclusion of a prototypical1. A detailed account of this optimization problem can be found in the
appendix.
1296 / Who Is High Income, Anyway? Asli Cansunar

rich person could affect perceptions of the economy. Imagine
that there exists an individual i whose household’s yearly in-
come is $70,000 from a country with median income $20,000,
with the top 10% earning $70,000 and the lowest 10% earn-
ing $5,000 a year. Moreover, assume that in this country the
highest-earning CEO makes $500,000 a year. If individual i
does not know these economic and political facts, when she is
asked about income groups, she will try to recreate the reality
in her mind. One possibility is that she will successfully think
about a subgroup of the national population that is a repre-
sentative sample: an individual x with a household income of
$5,000, another individual with $10,000, another with $20,000,
another with $50,000, and herself. In this case, she will, more or
less, have a subjective perception of the economy that is very
similar to the objective income distribution.
Let us consider an alternative case. Assume that individual
i watches television shows that consistently portray the life of
the rich or follow famous millionaires from other countries on
social media. These examples are regularly available in her
daily life, and these characters represent “what it means to be
rich” to her. When prompted to think about inequality and
inequality-reducing policies, the subsample of the population
she considers to make a reasoned policy choice might dis-
proportionately involve these stereotypes—even when these
characters might not even live in her own country or exist at
all. As Zaller (1992) argues, the more recently a consideration
has been called to mind or thought about, the more likely it is
to be retrieved from the memory for use whether or not this
choice is rational or not. In this case, let us assume that i’s
reference group consists of a household that earns $20,000 a
year, herself, a national television star who she thinks makes
$100,000 a year, and finally, a prototypical CEO who is born
out of her imagination. This prototypical figure, in her mind,
drives a Ferrari, wears very fancy brands, lives in a big man-
sion, and earns over $100,000,000 a year. When she uses this
reference group to make inferences about the income dis-
tribution, she will significantly overestimate the level of in-
equality. Also, in this case, individual i not only includes ste-
reotypical characters in her reference group but also assigns
them an income that might be an exaggeration, given people’s
inability to deal with large numbers (Guay et al. 2016).
How do people generate predictions on yt, –yL, and –yH using
the subjective reference group? An important line of work in
social sciences has established that humans are hardwired
with the tendency to compare themselves with others to as-
sess their positions (Festinger 1954; Tajfel and Turner 1986;
Turner 1975). Building on this literature, I rely on the concept
of perceived distance to characterize individuals’ income cate-
gorization processes of themselves and other people into in-
come groups (Shayo 2009).
The social comparison involves comparing the distance
an individual feels from each income group. An individual
will evaluate her distance from the lower- and higher-ranked
people in her reference group to gauge her economic position.
She will also, mentally, calculate the social distance of other
individuals in her reference group to categorize them into
different groups. Formally, perceived distances from the high-
income and low-income groups are defined as follows.
Perceived distance from the high-income group. The
perceived income distance function of individual i from
the group of individuals with higher incomes, SH :
½0;∞)N → R, is specified by
SiH
(yi) p o
j∈N ibimax(y
j2 y
i; 0):
Perceived distance from the low-income group. The
perceived income distance function of individual i
from the group of individuals with lower incomes,
SiL: ½0;∞)N → R, is
SiL(y
i) p o
j∈N ibimax(y
i2 y
j; 0):
I further assume that each individual j has the same nor-
malized weight in the social distance function, that is, bi p
1=(jN ij1 1) for all i ∈ N .
Due to this specification, an individual’s perceived dis-
tance from the high (low) income group depends not only
on the cardinality of the set of individuals that she thinks
earn more (less) than her but also on her degree of convic-
tion. To substantively depict this mechanism, let us focus on
the following example. Imagine the following scenarios in
which an individual compares herself to her friends. Let us
assume that in the first scenario, the individual cannot afford
a quick getaway, whereas her friends have the resources to go
to the nearest lake for the weekend. In the second scenario,
the individual can afford to go to the lake, whereas her friends
can take a cruise tour in the Caribbean. In both cases, the
individual should feel poorer than her friends. In a model
where only ordinal comparisons matter, the individual’s as-
sessment of her position in the income distribution is the
same. However, if cardinal considerations matter, the indi-
vidual should feel a lot poorer or a lot further away from the
high-income group in the second scenario.
Let me now begin defining the subjective income-group
identification mechanism:
High-income group identification. Individual i iden-
tifies with the high-income group if SiH! Si
L.
Volume 83 Number 4 October 2021 / 1297

Low-income group identification. Individual i iden-
tifies with the low-income group if her perceived dis-
tance from the individuals with the higher income is
larger than her perceived distance from the individuals
with lower incomes, that is, SiH≥ Si
L.
Perceived threshold income. Let there be jjN ijj in-
dividuals in the reference group of the individual, Ni,
indexed by j ∈ f1; 2; ::: jjN ijjg. Individuals are distin-
guished by their pretax income level, yj where yj≤ yk
for j ! k. The term yti is the income threshold such
that for all yj 1 yti, SH
j≤ S L
j and for all yj ! yti, S L
j≤ SH
j .
Before proceeding to examine the theoretical implications,
it is necessary to comment on an additional issue. A potential
objection to this setup relates to the endogenous formation of
tax brackets. In environments where individuals express pref-
erences over a specific tax policy that will be applied to pre-
determined income brackets, there is no room for confusion
and uncertainty about who belongs to which group. However,
this model tries to identify who supports tax regimes in which
the tax rate increases as the taxable income increases, rather
than measuring support for a specific policy. Also, in most
cases where tax policy is discussed or preferences of pro-
gressive taxes are questioned, whether by politicians, in the
media, or by survey questions, the language usually only in-
volves vague terms such as “taxing the rich” or “taxes the high-
income group should pay.” Thus, in many settings, people do
not observe tax brackets directly to make decisions; instead,
they form opinions about the tax obligations of not-well-
defined income groups, such as “the rich.”
The magnitude and the direction of misperceptions
How does the difference between the population and the
individual’s reference group generate subjective perceptions
of the economy? I formulate the difference by introducing
the following distance function between the population and
the reference group based on an average of distances be-
tween the income of their elements. The distance function
formalizes the intuition that the content of the reference group
matters for the magnitude of distributional misperceptions.
Magnitude of misperceptions. Let (R, d) be a metric
space, where d(a, b) denotes the Euclidean distance
between a and b. Let P(R) denote the collection of all
nonempty finite subsets of R. For each YN∈ P(R)
and YN i
∈ P(R), define M(YN ;YN i
) on P(R)# P(R)
to be the function
M(YN ;YN i
) p1
jYN∪YN i
j
1
jYN jo
x∈YNo
y∈YN i∖YN
d(x; y)
11
jYN∪YN i
j
1
jYN i
jo
x∈YN∖YN i
oy∈YN i
d(x; y): ð2Þ
Mathematically, the magnitude of the misperception func-
tion accounts for both ordinal and cardinal differences between
the elements of YN and YN i
. An individual’s misperceptions will
not only depend on how different YN i
is from YN, that is, the
dissimilarity of sets, but also on the distance between the dif-
ferent elements of both sets.
Given this formulation, the following proposition summa-
rizes the main findings:
Proposition 1. The misperception function of an
individual who lives in a country with the finite set
of individuals N and has a reference group Ni,
M(YN ;YN i
), has the following properties:
1. If N p N i then M(YN ;YN i
) p 0.
2. For a given jYN∪YN i
j p A ∈ N , M(YN ;YN i
) is
increasing in jYN i
∖YN j.
3. M(YN ;YN i
)increases as supa∈YN i inf b∈YN d(a; b) in-
creases. (The proof is in the appendix, available
online.)
Part 1 of proposition 1 demonstrates that when the pop-
ulation and the reference group are the same, there are no
misperceptions. It seems plausible that the cases in which the
difference between N and Ni are minimal, the level of mis-
perception is also minimal.
As the dissimilarity between N and Ni increases, the dis-
parity between the state of the world and the perceptions in-
tensifies. There are two types of possible deviations of the set
of the incomes of the reference group from those of the pop-
ulation. First, as stated in part 2 of proposition 1, the number
of elements that belong to YN i
∖YN account for one kind of
dissimilarity. As an individual has more individuals in her
reference group with different incomes than the ones in the
population, the magnitude of misperceptions increases sub-
stantially. On the other hand, as formulated in part 3 of prop-
osition 1, the magnitude of misperception also depends on
the distance between the different elements of YN and YN i
. As
the greatest of all the distances from a point in YN i
to the closest
point in YN increases, the divergence between the perceived
state of the economy and the actual income distribution be-
comes more salient.
Proposition 1 shows that the lack of factual information
and social comparison do not always lead to substantial
misperceptions. This result seems to be consistent with earlier
(2)
1298 / Who Is High Income, Anyway? Asli Cansunar

research, which concluded that people use simpler substitutes
for statistical information to arrive at the same conclusions as
had they had full information (Lupia and McCubbins 1998).
Gigerenzer (2007) calls this ability “the intelligence of the gut
feelings,” positing that “trusting your gut” can get you out of
trouble. However, as parts 2 and 3 of proposition 1 illustrate,
the sampling process can also lead to significant mispercep-
tions. As Tversky and Kahneman (1974) argue, although some-
times useful, heuristics and shortcuts can also lead to sys-
tematic errors in perceptions and judgments.
Now that the conditions under which self-comparison to
an endogenous reference group creates misperceptions are
established, let me turn to practical implications of misper-
ceiving. How do misperceptions affect self-placement into
subjective income groups?
Proposition 2 For a given Ni and N, let x ∈ N i be the
element that satisfies supa∈YN i inf b∈YN d(a; b). Then, for
all N and Ni, there exists q ∈ R such that if x 1 q,
then SiH1 Si
L. (The proof is in the appendix.)
Proposition 2 establishes that even just one high-income
outlier has the potential to render it impossible for an in-
dividual to identify with the high-income group. This is a
result of the unboundedness of high incomes in the refer-
ence group. In comparison with members of the reference
group, an individual’s income acts as a limit for her distance
from those with lower incomes—the most substantial dif-
ference could only be in the magnitude of the individual’s
income. However, comparisons with higher-income indi-
viduals do not have any constraints in the same nature.
An important issue to note is that the implausibility of
identifying with the high-income group emerges even though
the model assigns the same weights, bi p 1=(jN ij1 1), for
self-comparison with those with higher incomes and lower
incomes. A considerable body of research has established that
individuals suffer more from comparing themselves to those
who have more resources (Fehr and Schmidt 1999; Loewen-
stein, Thompson, and Bazerman 1989). If the model is ex-
tended to capture dislike for disadvantageous inequality, an
individual is even less likely to identify herself with the high-
income group.
Preferences over progressive taxation
Now, let me turn to the policy implications of these misper-
ceptions. Recall that the theory suggests that in the case of
imperfect information, the individual relies on the subjective
levels of the variables in equation (1) to calculate the optimal
levels of tL and tH: the income threshold (yti), average income
of the high-income group (–yH
i), average income of the low-
income group (–yL
i). Also, individual i’s expected posttax in-
come also depends on her subjective group identification: if
i identifies with the low-income group, she thinks her post-
tax income is T(i) p (1 2 tL)yi. However, if i identifies with
the high-income group, she assumes her posttax income is
T(i) p (1 2 tL)yit1 (1 2 tH)(yi 2 yi
t).
Solving the maximization problem based on the per-
ceived income distribution, the following summarizes the
main results:
Proposition 3
1. The optimal progressive tax for an individual
who identifies with either income group is in-
creasing in –yH
i .
2. An individual who identifies with the low-income
group demands progressive taxation independent
of her income level.
3. An individual who identifies with the high-
income group demands a positive, progressive
tax if the perceived average income of the high-
income group is sufficiently high. (The proof is
in the appendix.)
This final proposition raises the issue of whether sub-
jective income group identification, as well as nonfactual be-
liefs about the income levels of certain groups, maps to re-
distributive preferences. It might be the case that, although
people compare themselves with the superrich, and that com-
parison affects their self-esteem or subjective well-being neg-
atively, it does not impact fiscal policy demands. Experimental
evidence available from multiple studies shows that, indeed,
self-comparison and reference groups affect policy demands:
when individuals are induced to feel a greater distance from
the rich, they increase their support for redistributive policies.
Sands and de Kadt (2019) show that randomized exposure to a
BMW in South Africa increases an individual’s likelihood of
signing a petition to demand a wealth tax. Similarly, Condon
and Wichowsky (2020) show that experimentally provoking
self-comparisons with the wealthy generates concern about
inequality and an increase in demand for social policies.
Taken together, propositions 1, 2, and 3 generate three
empirical hypotheses:
H1. Individuals are less likely to identify with the high-
income group as the perceived income of the high-
income group increases.
Volume 83 Number 4 October 2021 / 1299

H2. Subjective income-group rank is negatively cor-
related with demand for progressive taxation.
H3. The probability of supporting progressive tax
policies is increasing in the perceived income of the
high-income group.
EMPIRICAL EVIDENCE
Data and methods
The following analysis relies on the 2009 Social Inequality
International Social Survey Programme (ISSP 2009), which
asks a variety of questions about perceptions of economic in-
equality, self-placement, and preferences on redistributive pol-
icies. The analysis was restricted to countries where infor-
mation on income allowed the generation of 10 deciles and
where the respondents were asked to report gross household
income before taxes and other deductions. The sample covers
22 countries and around 8,000 respondents.2 It thus provides
rich individual-level data on perceptions and preferences over
welfare policies, as well as all the important control variables.
First, I examine the determinants of subjective self-placement.
Then I proceed to explore how subjective self-placement and
assessments of high-income group’s affluence levels affect
preferences over progressive taxation.
Testing the impact of subjective-income identification and
objective income on redistributive preferences calls for mea-
suring these variables with precision. The measure of income
is equivalized gross household income before taxes. I equiv-
alize incomes by dividing household income by the square
root of the number of household members. I also restrict the
sample to those aged 22–60. Finally, I convert the income
variable into 10 deciles to facilitate the comparison of different
levels of income across countries.
While there are many ways to model subjective self-
identification, I rely on the following “scalometer” question
from the ISSP (2009) extensively used by scholars to measure
subjective group identification in cross-national settings
(Evans and Kelley 2004; Smith 1992): “In our society, there
are groups which tend to be towards the top and groups which
tend to be towards the bottom. Where would you put yourself
now on this scale?” The respondents were asked to choose a
rank between 1 and 10. I take the respondents’ answers as a
proxy for where they think they are located at the income
distribution to operationalize a respondent’s subjective group
identification, self-placement.
To measure an individual’s perceived income distance
from the high-income group and low-income group, as well
as to measure the perceived average income of the high- and
low-income groups, I rely on the following two questions from
the ISSP (2009). Respondents are asked to estimate how much a
chairman of a large national company and an unskilled fac-
tory worker earn. These responses are recorded open-endedly.
To generate internationally comparable distance measures, I
use the following formulation to operationalize Income Dis-
tance to a CEO and Income Distance to a Worker variables.
Income distance to a CEO p logEstimated CEO pay
Respondent’s household income
� �
;
Income distance to a worker p logEstimated worker pay
Respondent’s household income
� �
:
I take the log transformation of the CEO pay to household
income ratio and worker pay to household income ratio to
reduce the influence of outliers and facilitate easier interpre-
tation. This formulation allows me to use this variable for two
of the parameters in the theoretical model: (i) an individual’s
perceived income distance from the high-income group and
(ii) the perceived average income of the high-income group.
Observe that an increase in the estimated CEO pay will in-
crease both of these measures. In the text, I use these two in-
terpretations of this variable interchangeably.
I capture demand for progressive taxation using the ques-
tion, “Do you think people with high incomes should pay a
larger share of their income in taxes than those with low in-
comes, the same share, or a smaller share?” Answers are re-
corded on a 5-point scale, with endpoints “much larger share”
and “much smaller share.” I create a binary variable, Progressive
Tax, that equals one if a respondent agrees that those with
high incomes should pay a much larger share or a larger share
of their income in taxes.
To control for the variation in individual-level charac-
teristics, I include respondents’ Age, Gender (1 p female),
Marital Status (1 p married), Conservative (1 p supports a
right wing party), as well as whether the respondent is a
college graduate, College (1 p has a college degree). Res-
pondents’ employment status is captured by the binary var-
iables for currently being Unemployed (1 p unemployed), or
Part-Time Employed (1 p part-time employed). I use a bi-
nary variable Union Member that takes the value one if the
respondent indicates past or present membership to a union.
Following Scheve and Stasavage (2006) and Stegmueller et al.
(2011), I also control for Church Attendance (5-point measure,
with endpoints 0 p never and 5 p daily). Finally, following
Cusack, Iversen, and Rehm (2006) and Iversen and Soskice
(2001), I control for skill specificity of respondents to account
2. Countries included in this sample are Australia, Bulgaria, Cyprus,
Denmark, China, Finland, Great Britain, Hungary, Iceland, Israel, Japan,
South Korea, New Zealand, Norway, Philippines, Russia, Sweden, Turkey,
Taiwan, United States, Venezuela, and South Africa.
1300 / Who Is High Income, Anyway? Asli Cansunar

for differences in policy demands of those with different labor
market risks.
To examine the empirical implications of the formal model
presented in the theory section, I employ a series of semi-
parametric generalized additive models (GAMs). GAMs pos-
sess important advantages over more traditional estimation
methods. The most important advantage is that they allow the
researchers to examine the effects of independent variables
free of any functional assumptions. This is especially crucial
where the theoretical claims warrant nonlinear effects that
could not be easily captured by polynomials.3 In such cases, it
is more appropriate to refrain from imposing any linear func-
tional form in the empirical analysis of that theoretical claim.4
Following Beck and Jackman (1998) and Keele (2008), I
use a semi-parametric GAM:
gi p a1 ok
jp1Sj(xi; j) 1 o
m
lp1bl(Zi;l) 1 Sc(countryi) 1 ∈i;
where gi is the value of the dependent variable, ai is the in-
tercept, k stands for the number of nonparametrically mod-
eled main independent variables, x, that are smoothed by the
smoothing function Sj. I assume that control variables have
linear effects, as in the standard regression setup. Following
this assumption, m number of control variables is estimated
parametrically. The term Sc(countryi) is the country random
effect to account for differences in respondents’ political and
economic environments. The term ϵi is the error term, where
E(∈i) p 0 and var(∈i) p j2. Following Keele (2008), the
preferred parameter selection criterion is generalized cross-
validation that automatically selects smoothing parameters.
One major difference between GAMs and more traditional
estimation methods is the lack of numerical output. Since the
coefficients are not fixed, there is no single point estimate to
represent the relationships of interest. Instead, the nonpara-
metric relationships are visualized using graphs.
Results
Before presenting the empirical results, it is interesting to look
at Self-Placement and Income Distance to a CEO descriptively.
The aim is to establish whether most high-income individuals
place themselves in the middle, as well as to investigate the
nature of perceptions pertaining to the income distance to a
CEO. Figure 2 shows the distribution of Self-Placement and
Income Distance to a CEO by objective income deciles of the
respondents. Although the analytical scope of figure 2 is lim-
ited, it is immediately clear that when asked to place them-
selves on a 10-point scale, most respondents place themselves
between the fourth and the sixth groups. Although self-
placement increases with the objective income decile, the
magnitude of this increase is not very substantial. The median
Figure 2. Self-Placement (A) and Income Distance to a CEO (B) by income decile. The black line shows the logarithmic transformation of highest average CEO-
employee compensation ratio in the sample (the USA).
3. For example, proposition 2 posits a nonlinear relationship between
the income of the rich and self-identification.
4. All analysis in the paper is replicated in the appendix using OLS
and logistic regressions. The choice of the estimation technique does not
change the main results.
Volume 83 Number 4 October 2021 / 1301

value of Self-Placement of the respondents below the median
household earnings averages around 5, whereas it is 6 for
those above the median.
Figure 2 also reveals valuable insights about the subjec-
tive perceptions of respondents on the income distance from
a CEO. The range of perceived distance ranges from negative
five to positive 20. The horizontal line shows the logarithmic
transformation of the highest CEO to average worker pay
ratio of a company in the United States, the country with the
highest overall proportion in the sample. The logarithmic
transformation of the highest CEO-employer compensation
ratio in the United States is 4.06 (Melin, Zhao, and Perry
2019), whereas the logarithmic transformation of the average
CEO-employer compensation ratio is only 2.42 (Duarte 2019).
Looking at the distribution of the perceived distances and the
actual numbers, it is clear that many people overestimate the
distance by a considerable margin. This figure thus shows that
some respondents’ best guess about the yearly earnings of a
CEO is significantly larger than the highest earner’s salary in
their country. These numbers reveal that some people think
about prototypes that do not exist when they are prompted to
think about the income levels of the rich.5
I begin the empirical analyses by examining the role of per-
ceived income distance to the high-income group in shaping
subjective group identification before turning to the role of
these perceptions in shaping policy preferences. Recall that
hypothesis 1 posits that individuals are less likely to identify
with the higher income groups as their perceived income of
the top earner’s increases. GraphA infigure 3 plots the smoothed
effect of Income Distance to a CEO on Self-Placement based
on estimates from a linear GAM with country random effects.
The model includes income, female, church attendance, col-
lege, union member, unemployed, part-time employed, mar-
ried, conservative, skill specificity, and age as parametric con-
trols. It also includes the Income Distance to a Worker variable
nonparametrically as an additional control. The figure dem-
onstrates the predicted self-placement of a respondent belong-
ing to the top decile, holding other variables at their median
values.
The first finding to note is the nonlinear nature of the
curve, making the use of GAMs an appropriate choice for
estimation. The curve slopes down steeply when the Income
Distance to a CEOp 0, which is the point where a respondent
thinks she earns as much as a CEO. After that steep decrease,
the increases in the Income Distance to a CEO produce a little
change in the self-placement. A respondent who belongs to
the top income decile, holding other variables at their me-
dian values, places herself higher than the seventh group
when she thinks she earns a lot more than a CEO. However,
self-placement falls to lower than 6 when she feels that she is
making much less. This empirical finding is consistent with
hypothesis 1: an individual is less likely to identify with the
high-income group if the perception of the earnings of the
rich is very high.
Graph B in figure 3 displays the contour plot of the joint
effect of objective Income and Income Distance to a CEO on
Self-Placement based on the same model. The x-axis shows
the objective income decile of a respondent, whereas the y-
axis shows the Income Distance to a CEO, and the contour
lines quantify the predicted values of Self-Placement. Dark
areas denote the smallest predicted values, and light areas
show the higher predicted values. In line with hypothesis 1,
an individual’s subjective self-placement is the highest when
the perceived income of the high-income group is low. Looking
at the right side of the figure, respondents who belong to the top
decile place themselves in the higher groups, around 7, only
when they think they earn more than a typical CEO in their
country. As their impression of the income of an average CEO
increases, they start underestimating their position significantly.
Moving onto the effects of these perceptions on policy
preferences, I turn to logistic GAMs examining hypothesis 2
and hypothesis 3. Figure 4 illustrates smooth functions of
Figure 3. Determinants of self-placement based on estimates from a linear
GAM with country random effects. The 95% confidence interval is shown as
gray band in graph A. N p 8; 028. Color version available as an online
enhancement.
5. The appendix contains more detailed information.
1302 / Who Is High Income, Anyway? Asli Cansunar

Self-Placement’s and Income Distance to a CEO’s effect on
the probability of supporting progressive taxation based on
estimates from a logistic GAM with country random effects.
The model includes income, female, church attendance, col-
lege, union member, unemployed, part-time employed, mar-
ried, skill specificity, conservative, and age as parametric con-
trols. The figure demonstrates that the probability of supporting
progressive taxation decreases as Self-Placement increases
and increases as Income Distance to a CEO increases.
Figure 5 shows further evidence supporting hypothesis 2
and hypothesis 3. The contour lines quantify the predicted
values of probability of supporting progressive taxation. Darker
areas denote the smaller predicted probabilities, while lighter
areas denote higher predicted probabilities. The patterns are
striking and consistent. Graph A in figure 5 plots the effects of
income and self-placement on the probability of support-
ing progressive taxation. The contour plot reveals that Self-
Placement is a stronger predictor of supporting progressive
taxation than Income. The probability of supporting progres-
sive taxation of a top-decile respondent and a first-decile re-
spondent is very similar if they place themselves in the same
subjective income rank. A respondent who is objectively in the
tenth income group supports progressive taxation with proba-
bility 0.64 if she subjectively places herself in the tenth group on
the scale of subjective perception. The probability of supporting
progressivity increases to 0.8 if she subjectively places herself in
the fifth group. Similarly, a first-decile respondent who places
herself in the fifth group supports progressive taxes on those
with high incomes with probability 0.82. However, first-decile
respondents who place themselves in the first subjective group
support progressivity with probability 0.9. Given that most
respondents, high and low objective deciles alike, place them-
selves in the middle groups, this graph explains why the poor
and the rich are not significantly polarized in their support of
progressive policies.
Graph B in figure 5 quantifies a similar dynamic, this time
using the perceived Income Distance to a CEO. Similarly, the
perceived distance to the high-income group significantly
impacts demand for progressive taxation. When individuals
believe that a typical CEO earns significantly more than them,
they fully support progressive taxation, independent of their
own income levels. Recall that the average CEO-employee dis-
tance for the countries in the sample was 2.42, so the increase in
the probability of support for progressive taxation mainly
comes from respondents who unrealistically overestimate the
earnings of a typical CEO.
Graph C in figure 5 summarizes these two results. As
expected, the level of support for progressive taxation is the
Figure 4. Relationship between subjective self-placement, subjective dis-
tance to a CEO, and the probability of supporting progressive taxation
based on estimates from a logistic GAM with country random effects. The
95% confidence interval is shown as a gray band. N p 8; 028.
Figure 5. The effects of objective and subjective self-placement (A), objective
self-placement and subjective distance to a CEO (B), and subjective self place-
ment and distance to a CEO (C) on the predicted probability of supporting pro-
gressive taxation, based on estimates from a logistic GAM with country random
effects. N p 8; 028. Color version available as an online enhancement.
Volume 83 Number 4 October 2021 / 1303

highest, 0.95, in the upper left corner where subjective in-
come distance from a CEO is the highest, and the self-
placement is the lowest. Respondents who identify with the
lower groups and overestimate the earnings of a CEO de-
mand progressive taxation. As we move to the lower right
corner, that is, as the respondent’s self-placement is high,
but the perceived income distance to a CEO is small, the prob-
ability of agreeing to progressive tax is the lowest: around 0.6.
When respondents place themselves in high-income groups
and think that they are earning as much as a typical CEO, they
are less likely to support progressivity. The most striking result
perhaps relates to the individuals who place themselves in high
groups but still believe they earn significantly less than a CEO.
In line with the prediction of proposition 3.3 which posits that
an individual who identifies with the higher-income group still
prefers a progressive tax rate if she believes that the other mem-
bers of the high-income group are substantially richer than her,
this figure shows that the predicted probability of supporting
progressive taxation of an individual who places herself in the
top income group is substantially high, 0.95, when that indi-
vidual unrealistically overestimates a typical CEO’s earnings.
Overall, these results indicate strong support for hypoth-
esis 1, hypothesis 2, and hypothesis 3. Individuals are less
likely to identify with the high-income group as the perceived
income of the high-income earners’ increases. The analysis
also shows that subjective income-group identification is neg-
atively correlated with the demand for progressive taxation,
and the demand for a progressive tax schedule is increasing in
the perceived income of the high-income group. The results
are mainly driven by those who significantly overestimate the
affluence levels of the rich. Given that many individuals place
themselves in the middle-income groups, these results explain
why only a few people, low and high income alike, oppose
progressive taxation.
CONCLUSION
I began this article by showing that the rich and the poor do
not hold significantly different views on progressive taxa-
tion: a high proportion of individuals from each income class
agree that the tax schedules should be progressive. To explain
this similarity, I have argued that subjective income group
identification and perceptions about the high-income class’s
earnings are key ingredients for understanding the micro-
foundations of preferences over progressivity, because they
shape what people believe they will pay for and get from the
welfare state.
This article challenged the core assumption of standard
models of redistributive preferences by bridging two dis-
connected literatures: one on political behavior under con-
ditions of imperfect information and another on preferences
for redistribution. Inconsistent empirical accounts of the re-
lationship between income and the demand for redistribution
can be explained, I showed, by a cognitive framework in which
individuals make subjective predictions about benefits and
losses from redistributive policies. An individual’s own in-
come contributes to her level of demand for redistribution.
However, her perceptions of how she ranks economically
within the population also matter significantly for redistrib-
utive preferences. To understand how subjective rank is gen-
erated, I developed an argument about how people use heu-
ristics and social comparison to estimate these in the absence
of factual information. The use of social comparison with an en-
dogenous reference group causes misperceptions that weaken
the link between income and redistributive demands.
Perhaps one of the most interesting findings of this paper
is that the well-known “middle-income bias” found in public
opinion surveys can be systematically explained. When in-
dividuals compare themselves either to the superrich or the
superpoor, they tend to infer that they are situated around
the middle of the income ladder. This, of course, has severe
effects on their political preferences.
Another important finding is that the design of widely
used survey questions might induce measurement error. In
the literature on redistribution, most of the questions used
in constructing dependent variables contain concepts such
as “high-income” individuals. If respondents have a different
understanding of the high-income group’s composition, such
questions will fail to measure attitudes toward redistribution
uniformly across individuals. Hence, incorporating informa-
tional assumptions into research on redistributive politics is
not only relevant and important theoretically. It also has
critical empirical implications that call for revising currently
popular survey methodologies and measurement tools.
The theory developed in this article has important impli-
cations not only for the rich’s preferences over the structure of
taxation but also on its level. My findings suggest that a vast
majority of individuals identify as “low-” or “middle-income”
even if they are not. In addition, subjective identification
matters in shaping tax preferences. Taken together, these
analyses point to a discussion about how people assess tax
rates that are imposed on their household’s income. The
results in this paper suggest that those who identify with the
lower groups should find the tax burden on themselves
extremely “high,” given that they believe they are not “rich”
at all. This implication is consistent with significant and
unintuitive empirical findings in the political economy of
redistribution literature. First, Roosma, Van Oorschot, and
Gelissen (2016) show that high-income individuals think
that the middle-income class is overburdened with taxation.
Second, scholars have consistently found that individuals
1304 / Who Is High Income, Anyway? Asli Cansunar

prefer high progressivity—that is, want more redistribution—
while opposing high tax rates—that is, oppose redistribution
(Barnes 2015; Roosma et al. 2016). These accounts argue that
the mismatch between the preferences over the size and the
structure of tax policies might be shaped by distrust in gov-
ernments’ ability to use taxpayer dollars efficiently. This article’s
findings offer an alternative and informational explanation.
Future research should take additional steps in investigating
whether the provision of information corrects conflicting
asymmetries in preferences over tax policies, as well as exam-
ining whether information changes the high-income group’s
assessment of the tax burden on middle-income citizens.
ACKNOWLEDGMENTS
Previous versions of this article were presented at the Harvard
Experimental Political Science Graduate Student Conference,
Duke University, the annual meeting of the European Polit-
ical Science Association in 2019, and Empirical Implications of
Theoretical Models conference in 2016. I thank participants in
all these events as well as Ben Ansell, Michael Bechtel, Pablo
Beramendi, Laure Bokobza, Spyros Kosmidis, Timur Kuran, Bahar
Leventoglu, Edmund Malesky, Jacob Nyrup, Jonas Markgraf,
Juan Palomino, Julia du Pont de Romemont, Daniel Stegmueller,
David Siegel, David Weisstanner, and Andreas Wiedemann for
their comments on the previous versions of this manuscript.
REFERENCESAlesina, Alberto, and George-Marios Angeletos. 2005. “Fairness and Re-
distribution.” American Economic Review 95 (4): 960–80.
Barnes, Lucy. 2015. “The Size and Shape of Government: Preferences over
Redistributive Tax Policy.” Socio-Economic Review 13 (1): 55–78.
Beck, Nathaniel, and Simon Jackman. 1998. “Beyond Linearity by Default:
Generalized Additive Models.” American Journal of Political Science
42 (2): 596–627.
Beramendi, Pablo, and Philipp Rehm. 2016. “Who Gives, Who Gains?
Progressivity and Preferences.” Comparative Political Studies 49 (4):
529–63.
Brown, Gordon D. A., Jonathan Gardner, Andrew J. Oswald, and Jing Qian.
2008. “Does Wage Rank Affect Employees’ Well-Being?” Industrial Re-
lations 47 (3): 355–89.
Causa, Orsetta, and Mikkel Nørlem Hermansen. 2018. “Income Redis-
tribution through Taxes and Transfers across OECD Countries.” LIS
Working paper series 729, Luxembourg.
Condon, Meghan, and Amber Wichowsky. 2020. “Inequality in the Social
Mind: Social Comparison and Support for Redistribution.” Journal of
Politics 82 (1): 149–61.
Cruces, Guillermo, Ricardo Perez-Truglia, and Martin Tetaz. 2013. “Biased
Perceptions of Income Distribution and Preferences for Redistribution:
Evidence from a Survey Experiment.” Journal of Public Economics
98:100–112.
Cusack, Thomas, Torben Iversen, and Philipp Rehm. 2006. “Risks at Work:
The Demand and Supply Sides of Government Redistribution.” Oxford
Review of Economic Policy 22 (3): 365–89.
Dahl, Robert A. 1967. Pluralist Democracy in the United States: Conflict
and Consent. Chicago: Rand McNally.
Dimick, Matthew, David Rueda, and Daniel Stegmueller. 2016. “The Al-
truistic Rich? Inequality and Other-Regarding Preferences for Redis-
tribution.” Quarterly Journal of Political Science 11:385–439.
Duarte, Fernando. 2019. “It Takes a CEO Just Days to Earn Your Annual
Wage.” https://www.bloomberg.com/graphics/ceo-pay-ratio/.
Evans, Mariah D. R., and Jonathan Kelley. 2004. “Subjective Social Lo-
cation: Data from 21 Nations.” International Journal of Public Opinion
Research 16 (1): 3–38.
Evans, Mariah D. R., Jonathan Kelley, and Tamas Kolosi. 1992. “Images of
Class: Public Perceptions in Hungary and Australia.” American Socio-
logical Review 57 (4): 461–82.
Fehr, Ernst, and Klaus M. Schmidt. 1999. “A Theory of Fairness, Compe-
tition, and Cooperation.” Quarterly Journal of Economics 114 (3): 817–68.
Fernández-Albertos, José, and Alexander Kuo. 2018. “Income Perception,
Information, and Progressive Taxation: Evidence from a Survey Ex-
periment.” Political Science Research and Methods 6 (1): 83–110.
Festinger, Leon. 1954. “A Theory of Social Comparison Processes.” Hu-
man Relations 7 (2): 117–40.
Gigerenzer, Gerd. 2007. Gut Feelings: The Intelligence of the Unconscious.
New York: Viking.
Gimpelson, Vladimir, and Daniel Treisman. 2018. “Misperceiving In-
equality.” Economics and Politics 30 (1): 27–54.
Gingrich, Jane. 2014. “Visibility, Values, and Voters: The Informational Role
of the Welfare State.” Journal of Politics 76 (2): 565–80.
Guay, Brian, Caroline Chandler, Jennifer Erkulwater, and David Landy.
2016. “Testing the Effectiveness of a Number-Based Classroom Exer-
cise.” PS: Political Science and Politics 49 (2): 327–32.
Haferkamp, Nina, and Nicole C. Krämer. 2011. “Social Comparison 2.0:
Examining the Effects of Online Profiles on Social-Networking Sites.”
Cyberpsychology, Behavior, and Social Networking 14 (5): 309–14.
Hyll, Walter, and Lutz Schneider. 2013. “The Causal Effect of Watching TV
on Material Aspirations: Evidence from the ‘Valley of the Innocent.’ ”
Journal of Economic Behavior and Organization 86:37–51.
ISSP (International Social Survey Programme). 2009. “International Social
Survey Programme 2009: Social Inequality IV.”
Iversen, Torben, and David Soskice. 2001. “An Asset Theory of Social
Policy Preferences.” American Political Science Review 95 (4): 875–93.
John, Knight, Lina Song, and Ramani Gunatilika. 2009. “Subjective Well-
Being and Its Determinants in Rural China.”China Economic Review20 (4):
635–49.
Kahneman, Daniel, and Amos Tversky. 1972. “Subjective Probability: A
Judgment of Representativeness.” Cognitive Psychology 3 (3): 430–54.
Kahneman, Daniel, P. Siovic, and Amos Tversky, eds. 1982. Judgment under
Uncertainty: Heuristics and Biases. Cambridge: Cambridge University Press.
Keele, Luke. 2008. Semiparametric Regression for the Social Sciences. Chich-
ester: Wiley & Sons.
Kingston, Paul W. 2000. The Classless Society. Stanford, CA: Stanford Uni-
versity Press.
Kuziemko, Ilyana, Michael I. Norton, Emmanuel Saez, and Stefanie
Stantcheva. 2015. “How Elastic Are Preferences for Redistribution? Evi-
dence from Randomized Survey Experiments.” American Economic Re-
view 105 (4): 1478–508.
Laswell, Harold D. 1936. Politics: Who Gets What, When, How. Cleveland:
Meridian.
Lippman, Walter. 1922. Public Opinion. New York: Free Press.
Loewenstein, George F., Leigh Thompson, and Max H. Bazerman. 1989.
“Social Utility and Decision Making in Interpersonal Contexts.” Journal
of Personality and Social Psychology 57 (3): 426–41.
Lü, Xiaobo, and Kenneth Scheve. 2016. “Self-Centered Inequity Aversion and
the Mass Politics of Taxation.” Comparative Political Studies 49 (14):
1965–97.
Volume 83 Number 4 October 2021 / 1305

Lupia, Arthur, and Mathew D. McCubbins. 1998. The Democratic Dilemma:
Can Citizens Learn What They Need to Know? Cambridge: Cambridge
University Press.
McBride, Michael. 2001. “Relative-Income Effects on Subjective Well-Being
in the Cross-Section.” Journal of Economic Behavior and Organization
45 (3): 251–78.
Melin, Anders, Jenn Zhao, and Jason Perry. 2019. “Disney Faces Fresh
Criticism after Heir Calls Iger’s Pay ‘Insane.’ ” https://www.bloomberg
.com/graphics/ceo-pay-ratio/.
Meltzer, Allan H., and Scott F. Richard. 1981. “A Rational Theory of the
Size of Government.” Journal of Political Economy 89 (5): 914–27.
Moene, Karle Ove, and Michael Wallerstein. 2001. “Inequality, Social Insurance,
and Redistribution.” American Political Science Review 95 (4): 859–74.
Rehm, Philipp, Jacob S. Hacker, and Mark Schlesinger. 2012. “Insecure
Alliances: Risk, Inequality, and Support for the Welfare State.” Ameri-
can Political Science Review 106 (2): 386–406.
Roosma, Femke, Wim Van Oorschot, and John Gelissen. 2016. “A Just
Distribution of Burdens? Attitudes toward the Social Distribution of
Taxes in 26 Welfare States.” International Journal of Public Opinion Re-
search 28 (3): 376–400.
Sands, Melissa L., and Daniel de Kadt. 2019. “Local Exposure to Inequality
Raises Support of People of Low Wealth for Taxing the Wealthy.” Nature
586:257–61.
Scheve, Kenneth, and David Stasavage. 2006. “Religion and Preferences
for Social Insurance.” Quarterly Journal of Political Science 1 (3): 255–
86.
Shayo, Moses. 2009. “A Model of Social Identity with an Application to
Political Economy: Nation, Class, and Redistribution.”American Political
Science Review 103 (2): 147–74.
Smith, Tom. 1992. “An Analysis of Response Patterns to the Ten-Point
Scalometer.” GSS Methodological report no. 76, National Opinion Re-
search Center, University of Chicago.
Stegmueller, Daniel. 2013. “Religion and Redistributive Voting in Western
Europe.” Journal of Politics 75 (4): 1064–76.
Stegmueller, Daniel, Peer Scheepers, Sigrid Rossteutscher, and Eelke De
Jong. 2011. “Support for Redistribution in Western Europe: Assessing the
Role of Religion.” European Sociological Review 28 (4): 482–97.
Tajfel, Henri, and John C. Turner. 1986. “The Social Identity Theory of In-
tergroup Behavior.” In S. Worchel and W. Austin, eds., Psychology of
Intergroup Relations. Chicago: Nelson-Hall, 7–24.
Turner, John C. 1975. “Social Comparison and Social Identity: Some
Prospects for Intergroup Behaviour.” European Journal of Social Psy-
chology 5 (1): 1–34.
Tversky, Amos, and Daniel Kahneman. 1974. “Judgment under Uncertainty:
Heuristics and Biases.” Science 185 (4157): 1124–31.
Wang, Jin-Liang, Hai-Zhen Wang, James Gaskin, and Skyler Hawk. 2017.
“The Mediating Roles of Upward Social Comparison and Self-Esteem
and the Moderating Role of Social Comparison Orientation in the As-
sociation between Social Networking Site Usage and Subjective Well-
Being.” Frontiers in Psychology 8 (771): 1–9.
Zaller, John R. 1992. The Nature and Origins of Mass Opinion. New York:
Cambridge University Press.
1306 / Who Is High Income, Anyway? Asli Cansunar