who creates waste? different perspectives on waste attribution...
TRANSCRIPT

1
Who creates waste? Different perspectives on waste attribution in a regional economy
Christa D. Jensen1, Stuart McIntyre2, Max Munday3 and Karen Turner4
Abstract. We use a regional input output (IO) framework and data derived on waste generation by industry to examine regional accountability. In addition to estimating a series of industry waste-output coefficients, the paper considers a series of methods for waste attribution, and practical use for policymakers. The paper first considers perspectives on attribution of domestic waste generation using basic Type I and Type II industry multipliers, and also compares these with multipliers derived from a trade endogenised linear attribution system (TELAS) which permits a greater focus on private and public final consumption as the main exogenous driver of waste generation in the domestic economy. Second, it uses a domestic technology assumption (DTA) to consider what Wales’s ‘waste footprint’ would be if it had to meet all its consumption requirements through domestic production. Acknowledgements: The research reported in this paper has been carried out with the support of the ESRC Climate Change Leadership Fellow project “Investigating the pollution content of trade flows and the importance of environmental trade balances” (ESRC ref. RES-066-27-0029), based at the University of Strathclyde; the Welsh Economy Research Unit and ESRC Centre for Business Relationships, Accountability, Sustainability and Society (BRASS), Cardiff University; and the Regional Research Institute at West Virginia University. We are grateful to Randall Jackson, Regional Research Institute, West Virginia University, and Kim Swales, Department of Economics, University of Strathclyde, for their comments and advice on the accounting methods employed here. We are also grateful to Annette Roberts and Calvin Jones of the Welsh Economy Research Unit of Cardiff Business School, and Jeroen Dijkshoorn of the ESRC BRASS Centre at Cardiff University, for their invaluable assistance in constructing the waste IO database used in this paper, and to Janine De Fence for research assistance. Key words: waste attribution; regional economy; input-output analysis; Wales JEL Category: C67, Q01, Q53, R15
1 Christa D. Jensen, Graduate Research Fellow, Regional Research Institute, Department of Economics, West Virginia University, PO Box 6825, Morgantown, WV 26506. Phone: (304) 293-8545; Fax: (304) 293-6699; [email protected]
2 Stuart McIntyre, Doctoral Student, Fraser of Allander Institute, Department of Economics, University of Strathclyde, Sir William Duncan Building, 130 Rottenrow, Glasgow G4 0GE, Scotland, UK; Phone: +44 (0)141 548 3858 (Ext. 3858), [email protected] 3 Max Munday, Director, Welsh Economy Research Unit, Member of ESRC Centre for Business Relationships, Accountability, Sustainability and Society (BRASS), Cardiff University, Colum Drive Office T02, Cardiff, CF10 3EU, UK; Phone: +44(0)29 2087 6013; Fax: +44(0)29 2087 4419; [email protected] 4Karen Turner, Senior Lecturer and ESRC Climate Change Leadership Fellow, Fraser of Allander Institute, Department of Economics, University of Strathclyde, Sir William Duncan Building, 130 Rottenrow, Glasgow G4 0GE, Scotland, UK; Phone: +44 (0)141 548 3864 (Ext. 3864); [email protected]

2
Who creates waste? Different perspectives on waste attribution in a regional economy
1. Introduction
This paper uses a regional input-output framework together with survey data on waste
generation by industry to examine waste attribution in a regional economy. In addition to
estimating a series of industry direct waste-output coefficients, the paper considers a series of
methods for waste attribution and the usefulness of these different methods for policymakers.
Specifically, the paper considers waste attribution from basic Type I and Type II multiplier
analysis, and also compares these with multipliers developed through a trade endogenised
linear attribution system (TELAS), originally proposed by McGregor et al (2008). The
TELAS approach permits a greater focus on regional private and public final consumption as
the main exogenous driver of domestic waste creation. We argue that the latter system
provides a useful tool for the domestic waste attribution problem and an additional
perspective for regional policymakers.
However, since interest may lie in assessing the total waste burden implied by local
consumption, as well as waste actually produced in the region, another accounting technique
is considered in this paper. This technique estimates the waste burden imposed by total use of
commodities in the region under what is termed a domestic technology assumption. This
gives a hypothetical ‘waste footprint’, measuring what domestic waste generation would be if
the region had to meet all of its consumption demands through domestic production (i.e. in
the absence of trade).
As a case study, this paper focuses on Wales. The devolved Welsh Assembly Government
(WAG) seeks to actively promote sustainable development. Duties under the Government of
Wales Act (1998) act include setting sustainable development objectives and the provision of
a series of indicators to support the evaluation of activities and policy (see Munday and
Roberts 2006).
A concern with the waste generated in the regional economy has been one focus of regional
strategy and resulting policies. For example, adopted headline indicators of sustainability
include indicators of household waste and the amounts of waste recycled. Moreover, waste
indicators link closely to other headline indicators that focus on air and water quality and
climate change. In a series of economic, environmental, and social strategic documents
produced in the region, the increasing burden that waste places on environmental assets, and
3
the future services from those same assets has been acknowledged (see Welsh Assembly
Government, 2002).
The 2007 World Wildlife Fund (WWF) One Planet Wales report revealed measures that
could be used to reduced Wales’ ecological footprint by 75% in 2050, and the linked
consultation in November 2008 for a new Sustainable Development Scheme for Wales was
contextualised on a movement towards year on year reductions in carbon emissions and ‘zero
waste’. The general projection for the region is now understood in terms of decreasing
amounts of household waste, increasing amounts of waste recycled and composted, and
increasing commercial, industrial, and construction waste recycling. The region also faces the
challenge of having just under 8 years of landfill capacity remaining at non-hazardous sites,
and with ARUP (2008) reporting that “waste generation from consumption based activities
(manifested primarily as household waste) contributes 15% of Wales’ ecological footprint”.
There has been limited progress in the region towards waste reduction. For example, total
amounts of household waste per person fell by nearly 4% between 2004 and 2007 along with
increases in reported recycling. However, this is not prima facie evidence of any decoupling
of growth and waste generation as economic growth faltered in this period. Furthermore,
there is evidence of reductions in commercial and industrial waste generation (see Frater and
Hines, 2004; Urban Mines, 2008).
Wales is currently moving towards a new waste strategy in 2010 (Welsh Assembly
Government, 2009). The processes of reflection and extensive consultation undertaken in the
region in 2008-09 represented a time to reflect on the issue of who creates waste in Wales,
and how one understands where the ultimate responsibility for this waste generation lies.
The explicit policy concern in Wales appears to be in terms of a production principle
(Munksgaard and Pedersen, 2001), which would make sense in terms of the Welsh Assembly
Government’s direct jurisdiction. This is evidenced in part through the indicator set used to
monitor progress towards targets on the Welsh Assembly Government’s Environment
Strategy. Here the emphasis is in terms of waste generated in Wales with indicators speaking
to quantities of municipal, industrial and commercial wastes and proportions recycled and
landfilled in the region (see Welsh Assembly Government, 2009a, 2009b). However, the
wider sustainable development duty speaks to more global responsibilities with a vision that
“Wales demonstrates the contribution a small, developed nation can make to global
sustainable development and environmental improvement” (Welsh Assembly Government,
2009b, pp.2-3). This wider duty is connected with uptake of the ecological footprint measure
as one headline overarching sustainable development indicator (Munday and Roberts, 2006).

4
Thus, as well as accounting under production accounting principles (waste generated within
the region) there is a need for the region to consider how consumption activity within its
borders creates impacts outside the regional boundary. Generally, in the case of any open
economy, there is a need to examine the impacts of trade on waste generation (we may also
want to consider how external consumption demands impact on domestic waste generation).
However, this raises the issue of how such analyses may be carried out, where currently
available data and analytical tools may only provide an indication of the region’s waste
footprint.
More generally, this paper addresses issues raised by Munday and Roberts (2006) who
argued that the strategic drive towards implementation of sustainable development objectives
in UK regions have in some cases not been matched by the development of approaches to
monitor and evaluate progress under the legal sustainable development duty and the need for
empirical frameworks that link policies and actions to environmental outcomes, and vice
versa. Thus, and in the specific context of devolved regional government in the UK, it would
seem that there is real scope for an economic-environmental accounting and modelling
framework that can fill this analytical gap (see also McGregor et al., 2001, 2008). This is
particularly relevant in the case of waste, where at the regional level there are challenges in
linking waste creation to different types of industry activity and linking waste generation to
local consumption.
The remainder of this paper is structured as follows: Section 2 revisits how industry
externalities such as pollution and waste are dealt with in an input-output framework. The
section then describes different attribution approaches formally, but also highlights the
strengths and weaknesses of each approach from the policy and strategic perspective. In
particular, the section demonstrates the dangers of focusing on simplistic industry/waste
output coefficients when exploring key sectors in terms of waste generation, and introduces
waste attribution measures that permit a focus on private and public final consumption as a
driver of waste generation (i.e. approaches featuring TELAS and the domestic technology
assumption). Section 3 describes the regional input-output framework constructed for Wales,
its current application, and the nature of the waste data used in conjunction with this
framework. The focus is on how the waste data was incorporated into the Welsh input-output
framework, and the issues of missing data. The fourth section reports the results of the
analysis, showing the industry and consumption categories that are highlighted under the
selected attribution approaches. Different perspectives offered particularly by the TELAS and
DTA attribution technique are illustrated through the examples of four industries (Wood

5
Products, Dairy Products, Electricity Generation, and Education). The final section
concludes and discusses how the analysis provides useful information for regional policy
development on waste, its abatement, and how data might be improved to develop the
research theme.
2. Alternative ‘treatments’ of waste in input-output frameworks
2.1 ‘Conventional’ approaches
Leontief’s (1970) basic demand driven input-output framework is extended for waste
generation as follows1:
(1) -1= [ - ] YPW I Aω
Where there are i=j=1,…,N industries and commodities (here, N=74) and z=1,...Z final
consumption groups (here, in the Type I case, Z=4). ωP is a 1xN vector of direct output-waste
coefficients with elements ωi=wi/Xi, where wi is the physical amount of waste generated by
each production sector i in producing its output, Xi. ωP[I-A]-1, then, is a 1xN vector of waste
output multipliers, which, for each industry output j, gives us the total amount of waste
generated in production (across all N production sectors) to meet one unit of final demand for
sectoral output j.
Where waste is directly generated by final consumers (e.g. households), one defines ωC as a
1xZ vector of direct waste-final expenditure coefficients with elements ωz=wz/Yz, where wz
is the physical amount of waste generated by each final consumption group z in consuming
goods and services in the process of its total final expenditure, Yz (column totals for each
final consumption group from the input-output tables). Thus the total amount of waste
generated in the region to meet final consumption demand, WR, is calculated by extending
equation (1) as follows:
(4)
R P -1 CW = ω [ - ] +ω YY(1x1) (1xN) (NxN) (NxZ) (1xZ) (Zx1)
(1x1) (1x74) (74x74) (74x4) (1x4) (4x1)
I A
1 In this paper the concern is with a single pollutant, physical waste. However, it is straightforward to extend the input-output system for multiple pollutants/types of waste (by extending the 1xN and 1xZ vectors ωP and ωC to KxN and KxZ matrices for 1=1,…,K pollutants/types of waste).

6
For a standard Type I input-output analysis, the dimensions of each of the matrices and
vectors are as given in the calculation of WR in (2). That is, industries and final consumers
are defined as in the input-output accounts. This allows an analysis to capture the direct and
also indirect output and waste effects of backward supply linkages between local production
sectors.
With no changes in final demand, the system in (2) provides the same figure for WR as one
would get from an analysis using the direct waste intensities of each activity:
(3) R P CW = ω X +ω Y
(1x1) (1xN)(Nx1) (1xZ)(Zx1)
Consequently, (2) simply attributes waste generated in the regional economy (during a single
time period) to demand for regional outputs, rather than the production of those outputs, as in
equation (3). The approach in (2) is analogous to the attribution of total regional output, X, to
final consumption demand for this output, Y, in the basic demand-driven input-output
system. This is an important distinction. The approach in (3) is entirely focussed on what
Munksgaard and Pedersen (2001) term the ‘production accounting perspective’. However, the
approach in (2) takes account of what consumption behaviour is driving waste generation
activity in the local economy. In a closed economy (2) would equate to an analysis under the
consumption accounting perspective, or a ‘waste footprint’. The issue of economic openness
and trade is considered below.
It is also common to extend to a ‘Type II’ input-output analysis, where households are
shifted from the final demand matrix, Y, into the production matrix, A. This is done to
examine induced (income and consumption) effects of employing household services as labor
inputs to production. Household consumption is endogenised by subtracting household final
consumption expenditure from the matrix Y (consumption of local outputs) and vector Y
(total final consumption) in (2) and adding an additional column and row of input-output
coefficients to the A-matrix. In the additional row, the new aij entries record the value of use
of household production (additional production sector, i) as inputs to production of sectoral
output Xj. In an input-output account, household production is solely composed of the
provision of labour services, so the additional row entries are payments to labour services, or
‘income from employment’, divided by total input/output for each sector. In the case of
households, where no labour is directly employed the coefficient collapses to zero. In the
7
additional column, the new aij entries record use of local inputs from each production sector,
i, by the household sector, j (formerly recorded as final consumption) and Xj as the total
input/output of households, which is given by total payments to labour/income from
employment.2
The key features of the standard Type I and Type II environmental input-output approaches
(which we have applied to the chase of physical waste generation) are identified in Table 1.
The conventional Type I and Type II attribution techniques are useful in considering the
structure of pollution/waste problems in the local economy and allow (from a
demand/consumption driven perspective) a consideration of the types of activity that drive
waste generation. However, there are two main problems with these approaches. First, with
an attribution based around Type I or Type II multipliers, responsibility for pollution or waste
generation is partly attributed to external sources of final demand (exports). This is especially
the case in an open, regional economy, such as Wales. Moreover, in a Type II analysis, local
private consumption (i.e. household demand) almost entirely disappears as a driver of local
waste generation. The second problem concerns imports, the waste implications of which do
not enter into the calculation in equation (2) (or the direct calculation in equation (3)).
2 Note that, in contrast to the conventional production sectors reported in the input-output accounts, it is rarely the case (if ever) that household input and output balance, as income from employment is unlikely to be the only source of household income that funds consumption expenditure. Strictly speaking, it would be appropriate to retain some household consumption expenditure as exogenously determined within the final consumption matrix Y. Only in a social accounting matrix (SAM), where a complete set of income and expenditure flows are reported, do household ‘inputs’ and ‘outputs’ balance.

8
Table 1. Key aspects of different IO approaches for regional environmental/waste analysis
Factors included in analysis Issues for environmental analysisDirect * Domestic waste generation in target region (Wales) * Analysis entirely from a production perspective
Type I * Domestic waste generation in target region (Wales) * Attribution of some waste generation to external (export) demand but no account of impacts of imports
* Direct and indirect (backward linkage/inter-industry) effects * No induced (consumption and income) effects from household provision of labour services
Type II * Domestic waste generation in target region (Wales) * Attribution of some waste generation to external (export) demand but no account of impacts of imports
* Direct and indirect (backward linkage/inter-industry) and induced (consumption and income) effects
* No responsibility attribution to local households for waste generation in the target region (Wales)
TELAS* Domestic waste generation in target region (Wales) attributed entirely to local (private and public) consumption demands * Treatment of trade issues (also endogenise capital formation)
* Focus on local waste generation retained with focus on trade but no account taken of actual/estimated waste content of imports (i.e. external/rest of world waste generation)
* Direct and indirect (backward linkage/inter-industry) effects * No induced (consumption and income) effects from household provision of labour services
Domestic Techology Assumption
* Hypothetical domestic waste generation in target region (Wales), in absence of trade, attributed entirely to Welsh consumption demands (households, government and capital)
* Capacity and capability issues - could the target region (Wales) meet all of its local consumption demand in this way?
* Can apply T1 and/or T2 focus (T1 may be preferable in environmental analysis)
* Assumes 'in spirit' that imported goods create the same amounts and types of waste as domestic production
Interregional 'footprint' analysis
* Actual (estimated) waste generation within and outwith target region (Wales) to support Welsh consumption demands
* Focus on global rather than local waste generation issues, raising issues of jurisdictional responsibility and authority
* Potential full application of Consumption Accounting Principle
* Extensive data requirements (depending on focus, may involve world interregional IO tables, with economic and environmental data in IO format for all direct and indirect trade partners, and interregional trade matrices)
2.2 The TELAS approach to addressing trade issues
McGregor et al. (2008) propose a method to address trade issues in a single region input-
output framework. They call this a Trade Endogenised Linear Attribution System (TELAS).
The TELAS approach involves endogenising trade in much the same way as household final
consumption is endogenised in the Type II approach outline above. Instead of counting
export (including tourist) demands from the rest of the UK (RUK) and rest of the world
(ROW) for Welsh output as vectors of final consumption demand within matrix Y in (2), the
approach creates an additional regional production sector in the A matrix, a Trade sector, t,
which produces the imports required in the economy as a whole. The row entries for each
(consuming) sector j are that sector’s total imports from RUK and ROW3, mtj, as a share of
the total input/output of the (consuming) Welsh sector j, Xj:
(4) tj tj ja = m /X
The additional column entries are the outputs that must be produced for export to RUK,
ROW via the trade sector, t, by each (producing) sector i in Wales, xit, per unit of total
3 Note that it would be possible to treat trade with RUK and ROW separately, though the creation of two trade sectors.
9
imports required in the Welsh economy as a whole (intermediate and final consumption), M,
as the output of the trade sector:
(5) it ita = x /M
The direct waste intensity of the output of the new Welsh trade sector, ωt, is equal to zero,
as generally no emissions are directly generated here. Waste directly generated in producing
output for export demand is generated in the producing sectors and is, therefore, embodied
indirectly in intermediate sales to the new trade sector, just as waste generated in producing
output for household consumption is embodied in intermediate sales to the household
production sector in a Type II analysis.
Note that when we calculate (2) with trade endogenised, each individual (production or
consumption) sector that imports from RUK and/or ROW is attributed the waste embodied in
the share of total Welsh domestic export production required to finance these imports, which
is measured using ωP. This is analogous to the Type II case, where each production sector
that employs labor is attributed the waste embodied in the share of total household
consumption that becomes an ‘input’ to labor supply in a Type II analysis. Under TELAS,
there is no attempt to estimate the waste generated in other regions/countries in producing the
commodities that are imported (i.e. the waste embodied in imports). In other words, TELAS
does not address the waste generated outside Wales to support Welsh consumption; rather it
focuses on waste generated within Wales to support Welsh consumption.
Note also that imports and exports are unlikely to be equal in an open economy (there is
likely to be a trade surplus or deficit). This is similar to the point made above with regard to
endogenising households in a Type II analysis, inputs to and outputs from the Trade sector
will also not balance.4 In order to focus attention on local (private and public) final
consumption (i.e. Welsh households and government consumption), under TELAS capital
formation/investment is also endogenised as covering depreciation/payments to capital. See
McGregor et al (2008) for full details. This is done by adding another row and column to the
A matrix, where the row coefficients are given by payments to other value added divided by 4 This problem may be overcome with extension to a social accounting matrix (SAM) analysis, where a full balance of payments is accounted such that income and expenditure in the trade sector balance (see the SAM TELAS analyses carried out by McGregor et al, 2004, 2008).

10
total inputs for each sector. The new column coefficients are given by local sectoral outputs
produced to meet final consumption in the form of gross regional capital formation, divided
by the total output of the (consuming) Welsh capital sector, given by total regional payments
to capital or other value-added. Again, as with the trade sector, the direct waste intensity of
the output of the Welsh regional capital formation sector is equal to zero.
Formally, under TELAS for Wales, equation (2) is estimated where the A matrix becomes a
76x76 (N production sectors as in Type I analysis plus the new trade and capital formation
sectors) matrix. The export terms that are included in the Y matrix in a standard Type I
analysis and capital formation drop out so that the only exogenous demands are Welsh
regional private (household) and public (government) final consumption. Thus, Y becomes a
76x2 matrix (in contrast to the Type II analysis, where there is no final demand for labor
services in the additional row of the adjusted Y matrix, there is final (import) demand for the
outputs of the trade sector).
McGregor et al (2008) explain that the philosophy underlying the TELAS approach is
basically to adopt a neo-classical, resource-constrained, view of the operation of the open
economy, where exports essentially finance imports (Dixit and Norman, 1980). Thus, the
TELAS approach can be used to retain local consumption as the driving force behind
environmental attribution (applied here to the case of physical waste generation) while
allowing a focus on (in the present study) the waste generation within the spatial jurisdiction
of Welsh agencies. Under TELAS, each individual importing sector is attributed the pollution
embodied in the share of total domestic export production required to finance those imports.
In terms of the Welsh responsibility for sustainability, it is argued that this places the
responsibility for waste generation at the appropriate spatial level. It also has the advantage of
only requiring data for the Welsh economy and not the detailed economic, trade and waste
generation of trading partners. As with Type I and II, Table 1 highlights the key features of
and potential issues with the TELAS approach.
2.3 The domestic technology assumption – an alternative approach?
The basic issue that may be considered problematic by some is that under TELAS there is no
attempt to account for the actual waste involved (directly or indirectly) in producing all
goods and services consumed in Wales (including imports). It is important to note that
adopting a perspective that did account for waste in this way implies a shift in focus away
from the waste generated within Wales (over which the Welsh Assembly Government and its
11
agencies have control) to waste generated in other regions and countries (where there is no
jurisdiction). However, input-output methods can also be (and increasingly are being)
employed to calculate ‘footprint’ type indicators (see Turner et al, 2007, and Wiedmann et al,
2007).
Two potential alternative methods are identified in Table 1. Taking the last, and perhaps
most obvious, one first, if one is concerned with total waste generated around the world to
support Welsh consumption, one ideally requires estimation of a Welsh ‘waste footprint’.
Turner et al (2007) explain how this can be done using an interregional input-output
framework (as opposed to the single region framework currently available for Wales).
However, they also discuss the considerable data requirements of a full footprint calculation
(see Table 1 – basically a world interregional input-output framework, or at least one that
incorporates appropriate economic and waste input-output data on all Wales’s direct and
indirect trade partners, and corresponding interregional trade data in input-output format,
would be required). McGregor et al (2008) attempt a partial application of the approach
explained by Turner et al (2007), where they focus on applying the ‘consumption accounting
principle’ (Munksgaard and Pedersen, 2001) in the case of interregional trade between
Scotland and the rest of the UK, but close the system at the national (UK) level under the
production accounting principle (using the TELAS method).
However, as noted above, there are also issues relating to jurisdiction in using such
‘footprint’ analyses for policy analysis. Wales does not have any authority over technology
used in production in other countries. However, there may be a desire to attempt to take
responsibility for the full waste implications of consumption decisions within Wales.
Therefore, an alternative approach may be to consider the question of what if Wales had to
produce all of the goods and services that it consumes for itself. That is, what would Wales’s
‘waste footprint’ be in the absence of trade? This would seem to be a relevant question, given
the commonly argued position that one ought to try and consume locally produced goods and
services where possible.
This question can be approached using what is referred to as the ‘domestic technology
assumption’ (see also, Druckman et al., 2008, 2009). This involves assessing the waste (or
other pollution) content of total use of commodities (local and imported) according to the
domestic production and polluting technology in Wales (i.e. what regional agencies have
some jurisdiction over). That is, the vectors ωP and ωC of direct waste-output coefficients
(direct waste intensities) identified for Wales in Section 2.1 and a variant of the A matrix that
records total (combined domestic and imported) use of intermediate inputs to production (and
12
thus a revised [1-A]-1 matrix showing the, hypothetical, global multiplier effects if all
production were carried out in Wales).
The Welsh Economy Research Unit at Cardiff Business School provided experimental data
in the form of an imports matrix showing imports (summed across RUK and ROW) to each
of the N=74 Welsh regional production sectors and Z=4 final consumption groups (returning
to the standard Type I classification of activities). This permits an analysis based on domestic
technology assumption. The data comprises an NxN (74x74) intermediate imports matrix5,
labelled M, which corresponds to the existing A matrix, which is re-labelled matrix R (to
distinguish it as the local regional intermediate use matrix), in that it contains entries mij
showing the use of the output of external sector i used in the production of one unit of output
in Welsh sector j, Xj (i.e. corresponding to the domestic aij coefficients, which we re-label rij
in this section). In terms of final consumption, there is an additional 74x4 final consumption
matrix, which is labelled YM to distinguish imports to final consumption from the existing Y
matrix from Section 2.1, and which is re-labelled YR (to distinguish final consumption of
local, or Welsh regional, outputs). However, in order to focus on the impacts of Welsh
consumption, the vector of export demands from both these matrices is removed so that YR
and YM become 74x3 matrices (where we have Z=3 for Welsh household and government
consumption, and capital formation).
In consequence, an analysis of what the total waste implications of Welsh final
consumption (labelled WT below) would be if these had to be met entirely from Welsh
production (in the absence of trade) can be undertaken by restating and calculating equation
(2) as follows:
(6)
T P -1 CW = ω [ - ( + ] + ) +ω YR(Y M
(1x1) (1xN) (NxN) (NxZ) (1xZ) (Zx1)
(1x1) (1x74) (74x74) (74x3) (1x3) (3x1)
I R M) Y
Note that the entries in the (now) 1x3 vector Y used to estimate direct waste generated in
final consumption (which, in fact, only applies in the case of households) remains as before:
total final consumption expenditure by each type of consumer is unchanged (previously it
included aggregate imports; here we have simply disaggregated imports in terms of
commodity/type of output in the YM matrix).
5 Note that, as with the TELAS analysis, it is possible to work with two matrices identifying imports from rest of the UK and rest of the world separately. The same is true for final consumption.

13
In this paper the focus is on the Type I case (given the issue of alleviating households from
responsibility for waste generation in a Type II analysis, which would seem to contradict the
philosophy underlying consumption-oriented measures, which is that human consumption
decisions are the ultimate drivers of environmental problems). However, the method in (6) is
not consistent with TELAS, as there is no consideration of trade issues in this new method –
here we ask what would happen if Wales had to meet all of its own consumption needs (i.e. a
hypothetical autarkic situation).
The system in (6) incorporates feedback effects so that [I-(R+M)]-1 can be interpreted as a
Leontief multiplier matrix for the portion of the global economy that serves Welsh
consumption demand only under the assumption that the portion of the global economy that
serves Wales shares its production structure. Note that working under this assumption does
not mean we are taking it to be fact; rather we are using the system to consider what would
happen if Wales had to meet its own consumption demands without trade and, crucially,
using technologies over which Welsh government and agencies have some
control/jurisdictional authority).
It is important to note that the system in (6), unlike the Type I, Type II, or TELAS
accounting frameworks above, will not replicate the amount of waste generated in Wales as
accounted under the direct method, or, more importantly, to our base year survey-based data
set. Nor would the standard economic variant of (6) replicate the base year output vector of
the Welsh 2003 input-output table, or Welsh employment in 2003, and so on. This is because,
while the Type I, Type II and TELAS analyses are basically accounting frameworks (which
must balance to the actual base year input-output data), the system in (6) is a modelling
framework: it is being used to arrive at a hypothetical waste account for Wales.
This brings us to the main difficulty in working under the domestic technology assumption,
and, perhaps more importantly, with the notion of Wales attempting to meet all its
consumption demands domestically/without trade. In a hypothetical measure, such as that
produced by (6) – rather than actual accounting where one balances to real data as in equation
(2) and the Type I, Type II and TELAS analysis – one is not giving any consideration to
whether Wales has (a) the capacity or (b) the capability of meeting its own consumption
demands. In terms of (a) the domestic technology assumption method in (6) shares the
limitations of using the conventional demand driven input-output model for impact analysis:
it implicitly assumes infinitely elastic supply (and is silent on any price response to the
existence of short or long run supply constraints). However, issue (b), whether Wales has the
capability of meeting all of its own consumption demands is perhaps the more basic of the

14
two. For example, the imports in matrix M include commodities such as bananas, which
cannot be produced in Wales, or at least not by any cost-effective method that is not, e.g.
hugely energy-intensive. This is why we need to trade, and why, it would seem, any analysis
of domestic6 waste generation requirements in an open regional economy like Wales, requires
the use of an accounting framework, such as TELAS, that takes account of both imports and
exports, and associated balance of trade issues.
3. Data
We now turn our attention to the data available to allow us to apply the methods outlined in
Section 3 to the case of Wales. Wales is one of few regions in the UK which produces
survey-based input-output tables which are the bedrock of the analysis undertaken here. The
development profile of the Welsh input-output tables is provided in Bryan et al. (2004) which
also describes the developing survey base of the tables. The analytical tables used here are for
2003 (WERU, 2007).
The latest iteration of the input-output tables for 2003 provides information on the sales and
purchases of 74 defined sectors, and describe different components of final demand including
a series of tourism final demands. Also available are a symmetrical domestic use matrix and
an imports matrix, the latter providing information on the make-up of imports going to these
same sectors. The Welsh input-output framework has had limited application for econ-
environmental modelling. For example, regionally derived emissions data has been combined
with information from the earlier 2000 Welsh input-output tables to generate the direct and
indirect volumes of selected pollutants generated by changes in final demands in each
industry (see Munday and Roberts, 2006, and Bryan et al., 2004). This type of framework has
also been used to assess the environmental consequences of tourism spending in the region,
particularly connected to major events (see Jones and Munday, 2007; Collins et al., 2005).
However, to date, there has been no detailed analysis of waste or a detailed consideration of
waste attribution.
Here, information from detailed industry responses to the Commercial and Industrial Waste
Survey Wales 2003 gives us an opportunity to undertake a more careful analysis of waste
attribution results from. This survey was carried out by the ESRC funded Centre for Business
Relationships Accountability Sustainability and Society (BRASS) at Cardiff University (see 6 It is important to emphasise that our focus here and argument in favour of the use of the TELAS approach over alternatives is based on the assumption that we are interested in the issue of domestic waste generation in the regional economy. As noted earlier, if our interest is in the global waste requirements of Welsh consumption, we require a footprint measure. However, as highlighted in Table 1, the main limitation of footprint measures is their lack of focus on domestic waste generation.

15
Frater and Hines, 2004). The results from this survey were primarily used to provide waste
arisings (i.e. waste occurring at production sites) and disposal data for Welsh policymakers.
The dataset compiled information from 2,122 firms comprised of around 11,000 defined
individual waste streams and 2,200 mixed waste streams. The dataset also provided 5 digit
standard industrial classification (SIC) codes for the reference firm, values for employment, a
coding of waste stream according to European waste codes (ewc) and tonnage, substance
form, information on initial and final destination, a hazardous waste marker, and summary
details of the waste management options being employed in the case of each stream.
The 2003 survey revealed that Welsh businesses produced an estimated 5.3 million tonnes
of waste in 2002-3, a 14% decrease from the 6.1 million tonnes produced at the time of the
prior survey in 1998-9. It is expected that the shrinkage of the regional manufacturing sector
over this period may have contributed to the fall. The survey also estimated that 4.2 million
tonnes of waste came from industry, and 1 million tonnes were generated by the commercial
sector. Some 28% of commercial and industrial waste went to landfill compared to 40% in
1998-9 and recycling or re-use had increased from 53% in 1998-9 to 62% in 2003. The 2003
survey has recently been superceded by the 2007 Commercial and Industrial Waste Arisings
in Wales which has revealed further reductions in waste. We use the findings from the 2003
survey as they are more consistent with the data in the 2003 Welsh input-output tables.
For the analysis in this paper we use total waste tonnages rather than focusing on different
types of waste and their resulting managerial options. The paper then highlights the multiple
perspectives of waste attribution using Welsh data. As discussed in the conclusions in Section
5, future work using more disaggregated waste data would also permit us to examine the
generation and flows of different waste types and management options in Wales.
Data on total tonnages of waste is provided at the 3 digit SIC code level. There were some
gaps in the coverage. For example, the Commercial and Industrial Waste Survey did not
collect data from sectors producing waste that was ‘not controlled’. This included waste from
agriculture, fishing, and mining and quarrying waste. There were also some details of waste
by sector where data was estimated from parallel surveys undertaken in England (i.e. data for
pulp and paper, coke and refined petroleum, recycling, wholesale, retail and utilities).
Additional data on waste from construction and mining and quarrying sectors was
subsequently collected from the Pilot Environmental Satellite Accounts for Wales (DTZ &
WERU, 2006). Moreover household waste data for the 2003-04 financial year was collected
from the Municipal Waste Management Report for Wales 2007-08.
16
This body of data on sectoral waste generation, together with additional information, is then
used to gain an estimate of tonnes of waste per full time equivalent (FTE) employee in each 3
digit SIC sector. These data provide the basis for grossing-up to an estimate of tonnes of
waste generated by each SIC industry in Wales. These data are then aggregated into the 74
industry sectors within the Welsh input-output tables permitting the initial estimation of
waste output coefficients (sectoral direct waste intensities), which are shown in the first
column of Appendix 2. These direct waste intensities give us the 1x74 vector ωP and sole
entry ωz (where z=household consumption) of the ωC vector introduced in Section 2.1. They
are derived by dividing the total tonnage of waste estimated as being generated in each
production sector and by households (as outlined above and reported in the first column of
Appendix 3) by total sectoral output, Xi, and, in the case of households, total final
expenditure, Yz (these are given by the column totals of the 2003 input-output tables). Note
that this gives us the reverse calculation to that shown in equation (3) (Section 2) for a direct
allocation of waste under the production accounting principle. Summing down the first
column of Appendix 4 gives us WR, the total waste generated within the Welsh economy in
2003 (also including uncontrolled waste not accounted for in the survey discussed above),
which is 18.6m tonnes. Thus, as explained in Section 2, and shown below in Section 4, with
no changes in final demand, any attribution exercise using equation (2) will return the same
numerical result for WR.
4. Waste attribution for Wales 2003
In this section we report the results of applying the various attribution techniques outlined in
Section 2 to the case of Wales in 2003 (the year that our data relate to). Thus, waste, as
measured above under the production accounting principle, is attributed to final consumption
in four different ways:
(1) Type I Analysis: attributes direct and indirect waste generation to private and public
consumption, capital formation, and exports.
(2) Type II Analysis: attributes direct, indirect, and income induced waste generation to
public consumption, capital formation, and exports.
(3) TELAS Analysis: attributes direct, indirect, and import-induced waste generation to
private and public consumption.
(4) Type I Analysis incorporating consideration of the waste content of imports under the
Domestic Technology Assumption. As noted above, this means that exports are
removed from the attribution exercise and the attribution is based on equation (6),

17
where total waste implied by Welsh final consumption demands, WT, need not equal
WR from equation (3).
In section 4.1 we report the results of attribution methods 1-3, all of which are derived by
calculating equation (2) under the different assumptions as explained for each method in
Section 2. In order to focus on the importance of the production structure of the economy we
focus mainly on the amount of waste attributable to the final demand for the output of each
production sector i, by breaking down the estimation of (2) so that we take each element of
the (1xN) vector of output-waste multipliers, [ ]-1Piω I - A in turn and multiply it by total final
demand for that sector’s output, Yi. We also consider the amount of waste attributable to each
type of final consumer by estimating (2) for each vector Yz in the (NxZ) matrix of final
consumption, Y (direct waste generation given by the second element on the right-hand side
of (2) is only relevant for households). This highlights the differences between the three
approaches in terms of where responsibility for waste generation is ultimately attributed.
In Section 4.2, we estimate equation (6) for the Type I case with waste embodied in imports
given by the domestic technology assumption and focus on the difference in activity levels
(production of output and waste generation) implied if Wales had to meet all of its own final
consumption demands.
4.1 Type I, Type II and TELAS attribution of waste to total final demand for sectoral
outputs
The full results of estimating equation (2) under Type I, Type II, and TELAS assumptions
respectively are given in the last three columns of Appendix 3. The vector of output-waste
multipliers underlying these results is given for each case in the last three columns of
Appendix 2.
In each type of analysis, we are particularly interested in identifying sectoral outputs
(commodities) whose production to meet final consumption demands involves high waste
generation in the Welsh economy. Four sectors are then selected for a more detailed analysis
that allows us to consider the results of the less conventional TELAS approach more
carefully. In Section 4.2, we also determine the contribution of the different types of final
consumers in driving activity in these key sectors (as well as total waste generation).
18
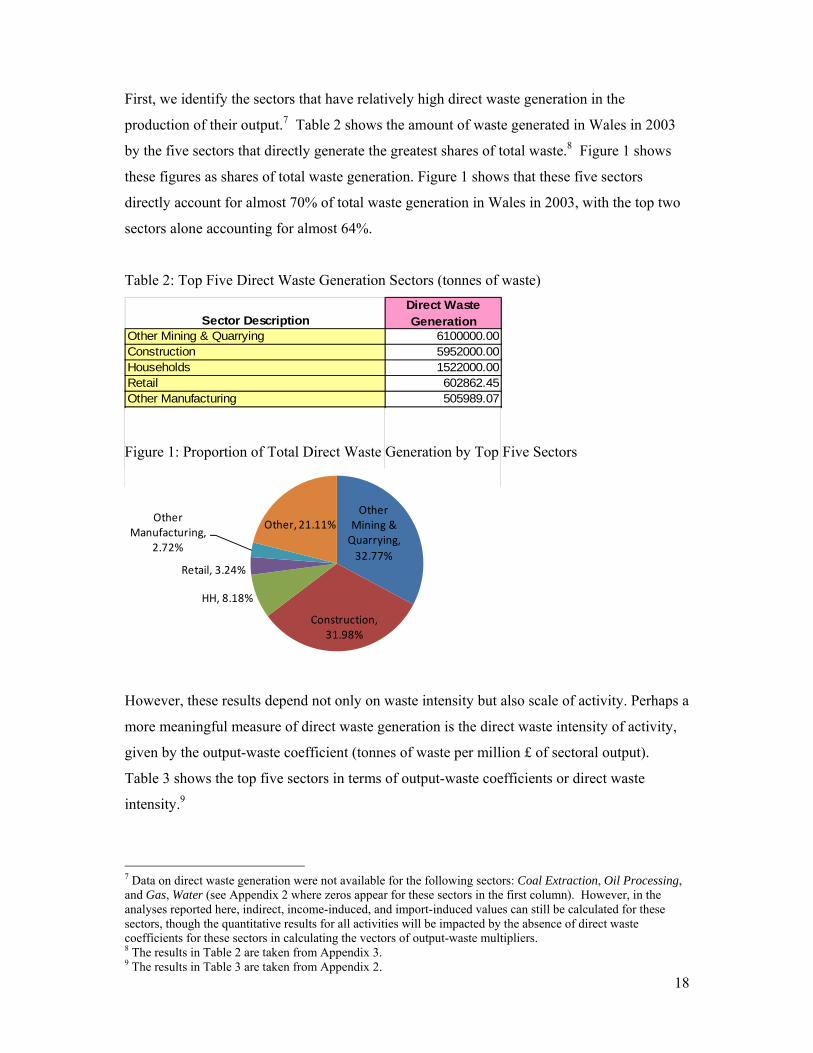
First, we identify the sectors that have relatively high direct waste generation in the
production of their output.7 Table 2 shows the amount of waste generated in Wales in 2003
by the five sectors that directly generate the greatest shares of total waste.8 Figure 1 shows
these figures as shares of total waste generation. Figure 1 shows that these five sectors
directly account for almost 70% of total waste generation in Wales in 2003, with the top two
sectors alone accounting for almost 64%.
Table 2: Top Five Direct Waste Generation Sectors (tonnes of waste)
Sector DescriptionDirect Waste Generation
Other Mining & Quarrying 6100000.00Construction 5952000.00Households 1522000.00Retail 602862.45Other Manufacturing 505989.07
Figure 1: Proportion of Total Direct Waste Generation by Top Five Sectors
Other Mining & Quarrying, 32.77%
Construction, 31.98%
HH, 8.18%
Retail, 3.24%
Other Manufacturing,
2.72%
Other, 21.11%
However, these results depend not only on waste intensity but also scale of activity. Perhaps a
more meaningful measure of direct waste generation is the direct waste intensity of activity,
given by the output-waste coefficient (tonnes of waste per million £ of sectoral output).
Table 3 shows the top five sectors in terms of output-waste coefficients or direct waste
intensity.9
7 Data on direct waste generation were not available for the following sectors: Coal Extraction, Oil Processing, and Gas, Water (see Appendix 2 where zeros appear for these sectors in the first column). However, in the analyses reported here, indirect, income-induced, and import-induced values can still be calculated for these sectors, though the quantitative results for all activities will be impacted by the absence of direct waste coefficients for these sectors in calculating the vectors of output-waste multipliers. 8 The results in Table 2 are taken from Appendix 3. 9 The results in Table 3 are taken from Appendix 2.

19
Table 3: Top Five Waste-Output Coefficients
Sector DescriptionWaste Output Coefficients
Other Mining & Quarrying 28438.14Construction 1765.37Other Manufacturing 983.43Wood Products 533.29Furniture 494.51
Table 3 shows that three of the largest direct waste generators are also the most waste
intensive. However, Households (in terms of direct waste generation in final consumption)
and Retail drop out of the top five, suggesting that scale of activity is also a key issue with
these activities (Appendix 2 shows that households produce 68 tonnes of waste per £1m
expenditure; Retail is higher at 155.5 tonnes per £1m output).
Type I Attribution Results
However, the results discussed so far only tell us about direct production of waste in different
activities. This gives an accounting record under the production accounting principle.
However, if we want to understand the structure of the regional waste problem with attention
to a more consumption-orientated approach, we can use the input-output framework to
consider the implications of interdependencies between different sectors of the economy. To
this end, we employ the methods outlined in Section 2 above.
First, within the conventional Type I system, all final demand categories identified in the
input-output accounts are treated as being exogenous. Therefore, private (household)
consumption, public (government) consumption, capital formation (private investment) and
exports (tourist expenditure as well as goods and services) are included in the matrix, Y, of
final demand in equation (2). That is, these final demands are considered as driving all
production activity in the economy. Considering final demand for each sector’s output in
turn, direct and indirect waste generation can be attributed to the final consumption of each
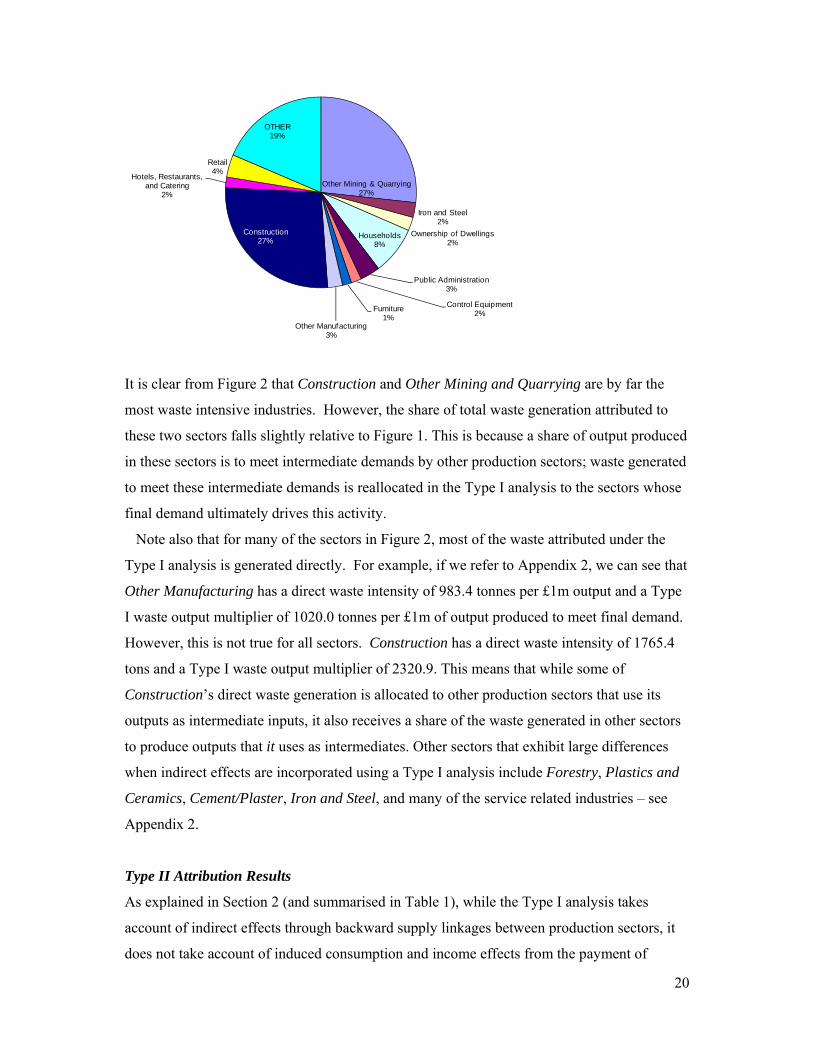
sector’s output. Figure 2 highlights the sectoral outputs whose consumption involves the
highest waste generation under the Type I analysis.
Figure 2: Type I Final Demand Attribution by Sectoral Output/Commodity
20
Other Mining & Quarrying27%
Iron and Steel2%
Ownership of Dwellings2%
Households8%
Public Administration3%
Control Equipment2%Furniture
1%Other Manufacturing
3%
Construction27%
Hotels, Restaurants, and Catering
2%
Retail4%
OTHER19%
It is clear from Figure 2 that Construction and Other Mining and Quarrying are by far the
most waste intensive industries. However, the share of total waste generation attributed to
these two sectors falls slightly relative to Figure 1. This is because a share of output produced
in these sectors is to meet intermediate demands by other production sectors; waste generated
to meet these intermediate demands is reallocated in the Type I analysis to the sectors whose
final demand ultimately drives this activity.
Note also that for many of the sectors in Figure 2, most of the waste attributed under the
Type I analysis is generated directly. For example, if we refer to Appendix 2, we can see that
Other Manufacturing has a direct waste intensity of 983.4 tonnes per £1m output and a Type
I waste output multiplier of 1020.0 tonnes per £1m of output produced to meet final demand.
However, this is not true for all sectors. Construction has a direct waste intensity of 1765.4
tons and a Type I waste output multiplier of 2320.9. This means that while some of
Construction’s direct waste generation is allocated to other production sectors that use its
outputs as intermediate inputs, it also receives a share of the waste generated in other sectors
to produce outputs that it uses as intermediates. Other sectors that exhibit large differences
when indirect effects are incorporated using a Type I analysis include Forestry, Plastics and
Ceramics, Cement/Plaster, Iron and Steel, and many of the service related industries – see
Appendix 2.
Type II Attribution Results
As explained in Section 2 (and summarised in Table 1), while the Type I analysis takes
account of indirect effects through backward supply linkages between production sectors, it
does not take account of induced consumption and income effects from the payment of
21
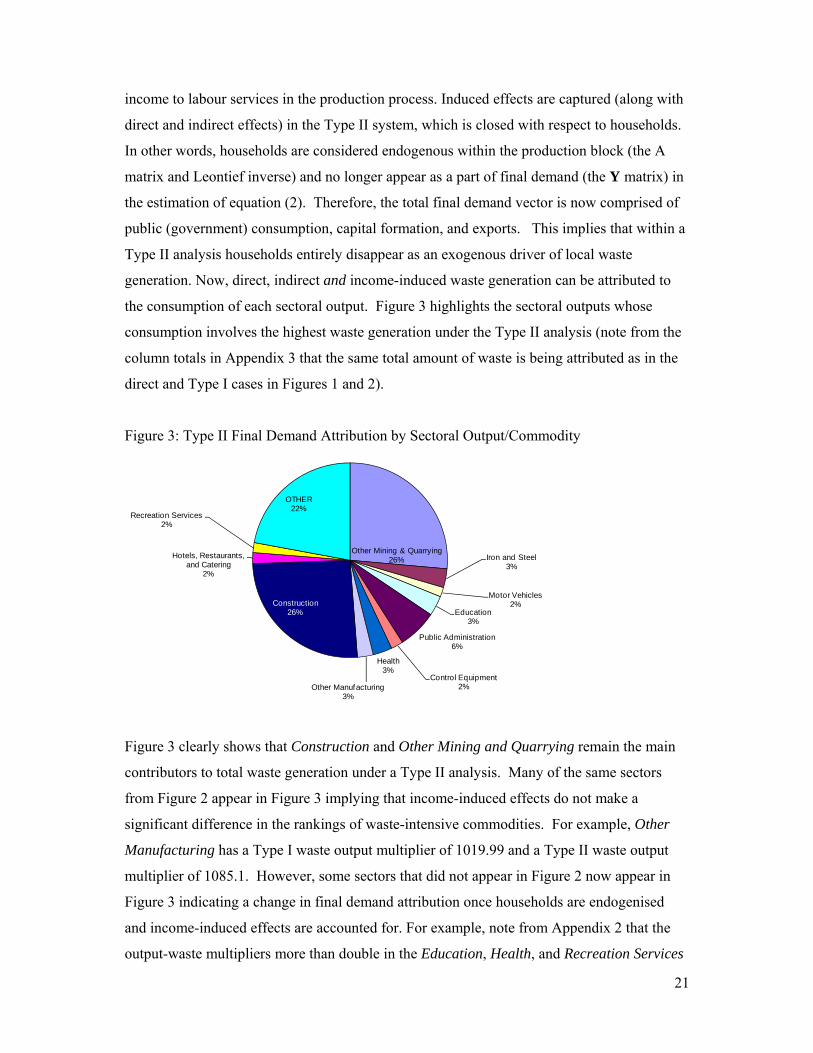
income to labour services in the production process. Induced effects are captured (along with
direct and indirect effects) in the Type II system, which is closed with respect to households.
In other words, households are considered endogenous within the production block (the A
matrix and Leontief inverse) and no longer appear as a part of final demand (the Y matrix) in
the estimation of equation (2). Therefore, the total final demand vector is now comprised of
public (government) consumption, capital formation, and exports. This implies that within a
Type II analysis households entirely disappear as an exogenous driver of local waste
generation. Now, direct, indirect and income-induced waste generation can be attributed to
the consumption of each sectoral output. Figure 3 highlights the sectoral outputs whose
consumption involves the highest waste generation under the Type II analysis (note from the
column totals in Appendix 3 that the same total amount of waste is being attributed as in the
direct and Type I cases in Figures 1 and 2).
Figure 3: Type II Final Demand Attribution by Sectoral Output/Commodity
Other Mining & Quarrying26% Iron and Steel
3%
Motor Vehicles2%
Education3%
Public Administration6%
Control Equipment2%
Health3%
Other Manufacturing3%
Construction26%
Hotels, Restaurants, and Catering
2%
Recreation Services2%
OTHER22%
Figure 3 clearly shows that Construction and Other Mining and Quarrying remain the main
contributors to total waste generation under a Type II analysis. Many of the same sectors
from Figure 2 appear in Figure 3 implying that income-induced effects do not make a
significant difference in the rankings of waste-intensive commodities. For example, Other
Manufacturing has a Type I waste output multiplier of 1019.99 and a Type II waste output
multiplier of 1085.1. However, some sectors that did not appear in Figure 2 now appear in
Figure 3 indicating a change in final demand attribution once households are endogenised
and income-induced effects are accounted for. For example, note from Appendix 2 that the
output-waste multipliers more than double in the Education, Health, and Recreation Services
22
when induced effects are taken into account. This happens in cases where payments to labour
services account for a large share of inputs, either because the sector is labour-intensive or
wage rates are high. In the case of Education where the Type II output-waste multiplier is
199.91 tonnes per £1million final demand for output, compared to only 44.13 in the Type I
case, payments to labour services account for 66% of the total input requirement.
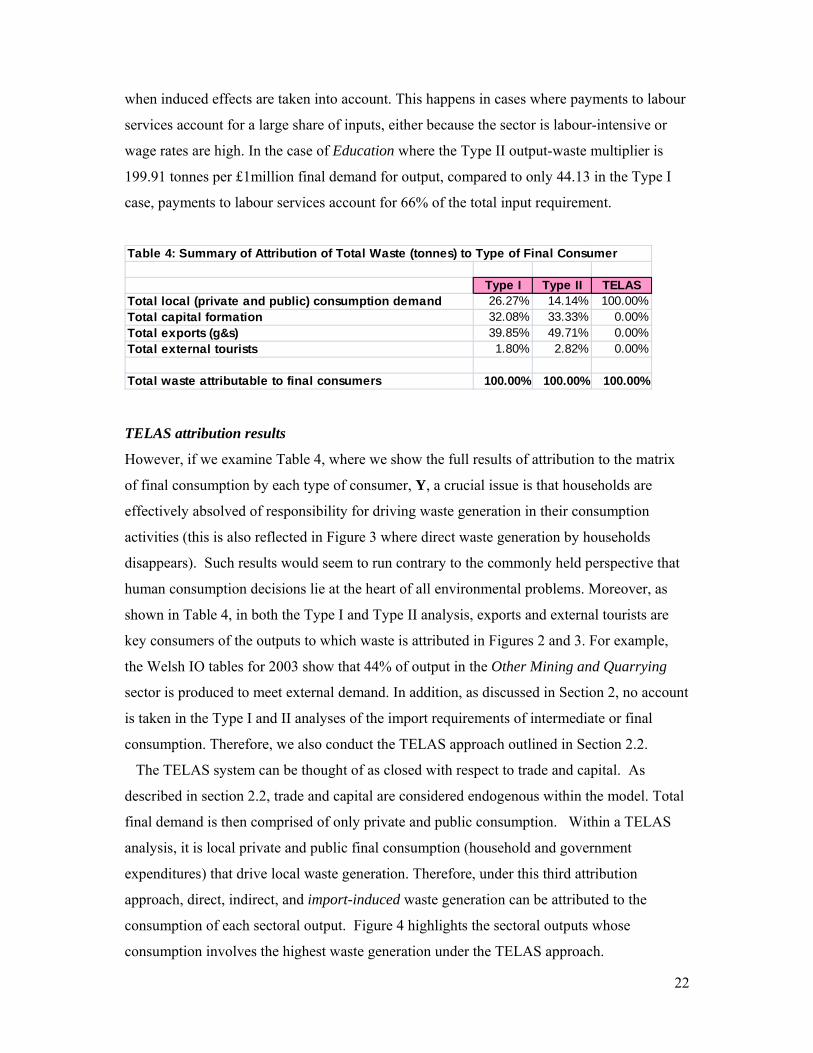
Table 4: Summary of Attribution of Total Waste (tonnes) to Type of Final Consumer
Type I Type II TELASTotal local (private and public) consumption demand 26.27% 14.14% 100.00%Total capital formation 32.08% 33.33% 0.00%Total exports (g&s) 39.85% 49.71% 0.00%Total external tourists 1.80% 2.82% 0.00%
Total waste attributable to final consumers 100.00% 100.00% 100.00%
TELAS attribution results
However, if we examine Table 4, where we show the full results of attribution to the matrix
of final consumption by each type of consumer, Y, a crucial issue is that households are
effectively absolved of responsibility for driving waste generation in their consumption
activities (this is also reflected in Figure 3 where direct waste generation by households
disappears). Such results would seem to run contrary to the commonly held perspective that
human consumption decisions lie at the heart of all environmental problems. Moreover, as
shown in Table 4, in both the Type I and Type II analysis, exports and external tourists are
key consumers of the outputs to which waste is attributed in Figures 2 and 3. For example,
the Welsh IO tables for 2003 show that 44% of output in the Other Mining and Quarrying
sector is produced to meet external demand. In addition, as discussed in Section 2, no account
is taken in the Type I and II analyses of the import requirements of intermediate or final
consumption. Therefore, we also conduct the TELAS approach outlined in Section 2.2.
The TELAS system can be thought of as closed with respect to trade and capital. As
described in section 2.2, trade and capital are considered endogenous within the model. Total
final demand is then comprised of only private and public consumption. Within a TELAS
analysis, it is local private and public final consumption (household and government
expenditures) that drive local waste generation. Therefore, under this third attribution
approach, direct, indirect, and import-induced waste generation can be attributed to the
consumption of each sectoral output. Figure 4 highlights the sectoral outputs whose
consumption involves the highest waste generation under the TELAS approach.
23
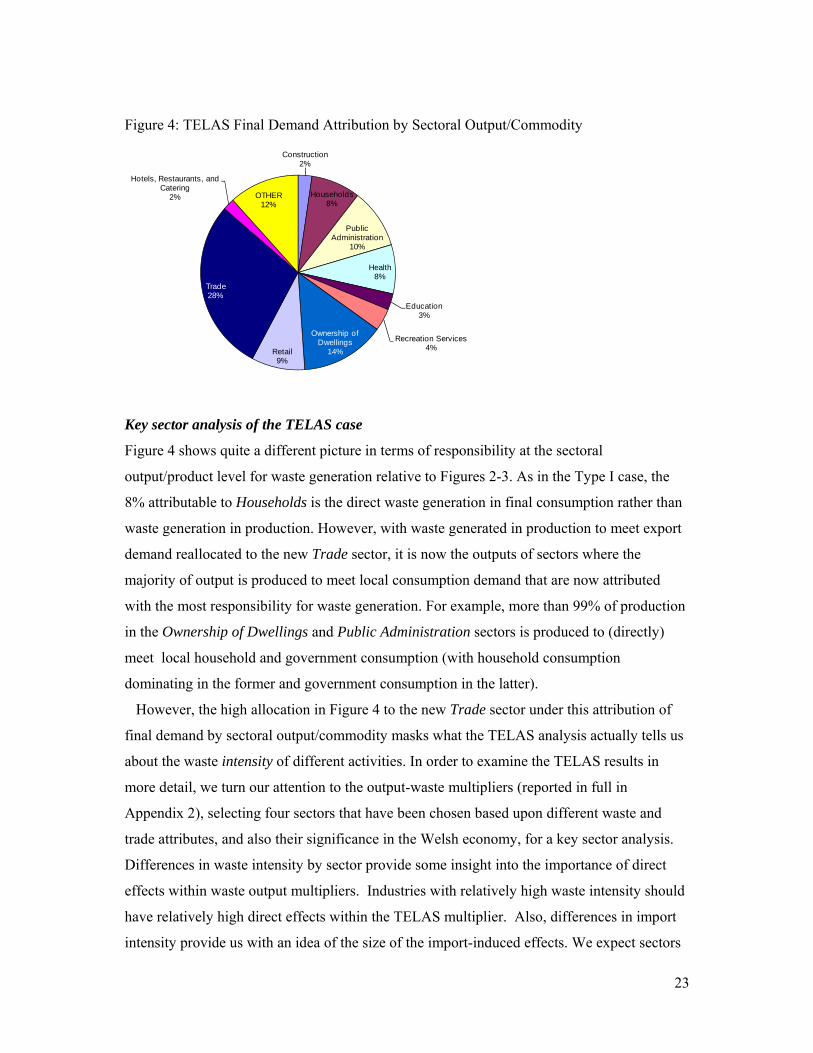
Figure 4: TELAS Final Demand Attribution by Sectoral Output/Commodity
Construction2%
Households8%
Public Administration
10%
Health8%
Education3%
Recreation Services4%
Ownership of Dwellings
14%Retail9%
Trade28%
Hotels, Restaurants, and Catering
2% OTHER12%
Key sector analysis of the TELAS case
Figure 4 shows quite a different picture in terms of responsibility at the sectoral
output/product level for waste generation relative to Figures 2-3. As in the Type I case, the
8% attributable to Households is the direct waste generation in final consumption rather than
waste generation in production. However, with waste generated in production to meet export
demand reallocated to the new Trade sector, it is now the outputs of sectors where the
majority of output is produced to meet local consumption demand that are now attributed
with the most responsibility for waste generation. For example, more than 99% of production
in the Ownership of Dwellings and Public Administration sectors is produced to (directly)
meet local household and government consumption (with household consumption
dominating in the former and government consumption in the latter).
However, the high allocation in Figure 4 to the new Trade sector under this attribution of
final demand by sectoral output/commodity masks what the TELAS analysis actually tells us
about the waste intensity of different activities. In order to examine the TELAS results in
more detail, we turn our attention to the output-waste multipliers (reported in full in
Appendix 2), selecting four sectors that have been chosen based upon different waste and
trade attributes, and also their significance in the Welsh economy, for a key sector analysis.
Differences in waste intensity by sector provide some insight into the importance of direct
effects within waste output multipliers. Industries with relatively high waste intensity should
have relatively high direct effects within the TELAS multiplier. Also, differences in import
intensity provide us with an idea of the size of the import-induced effects. We expect sectors

24
with relatively high import shares to have relatively high import-induced effects within the
TELAS analysis. The following four sectors are examined (see Figure 5):
1. Wood Products - relatively high (direct) waste intensity, relatively high (direct)
import share
2. Dairy - relatively high (direct) waste intensity, relatively low (direct) import share
3. Electricity - relatively low (direct) waste intensity, relatively (direct) high import
share
4. Education - relatively low (direct) waste intensity, relatively low (direct) import share
Wood Products
Wood Products is a sector that represents a relatively high waste intensity and also a
relatively high import share. While the region produces large amounts of softwood, it is unfit
for use for many wood products meaning that the producers of wood products tend to import
a large percentage of their inputs through ports in South Wales or from the wider UK. This is
also a sector where there has been a great deal of policy interest at the regional level,
particularly in terms of increasing local wood product use in local industry supply chains.
This industry has also been linked to the waste reduction initiative, biomass energy and is a
major recycler of products.
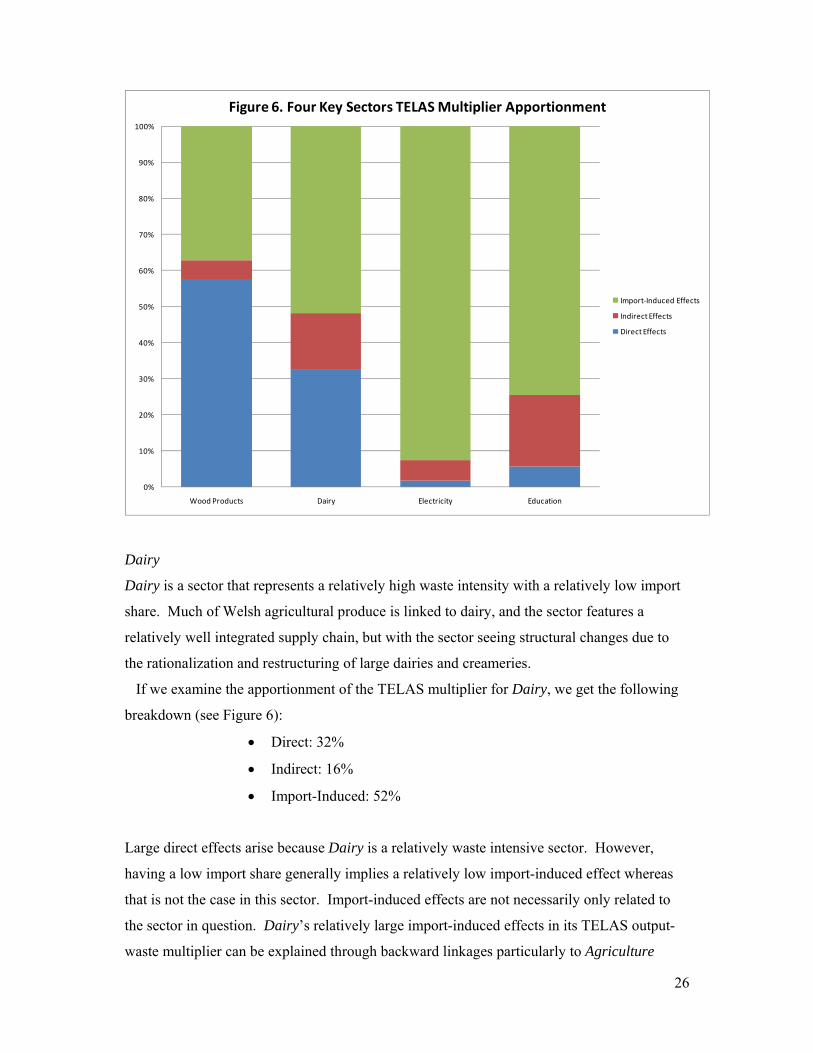
If we examine the apportionment of the output-waste TELAS multiplier for Wood
Products, we get the following breakdown (see Figure 6):
• Direct Effects: 58%
• Indirect Effects: 5%
• Import-Induced Effects: 37%
25
0
100
200
300
400
500
600
700
800
900
1000
Wood Products Dairy Electricity Education
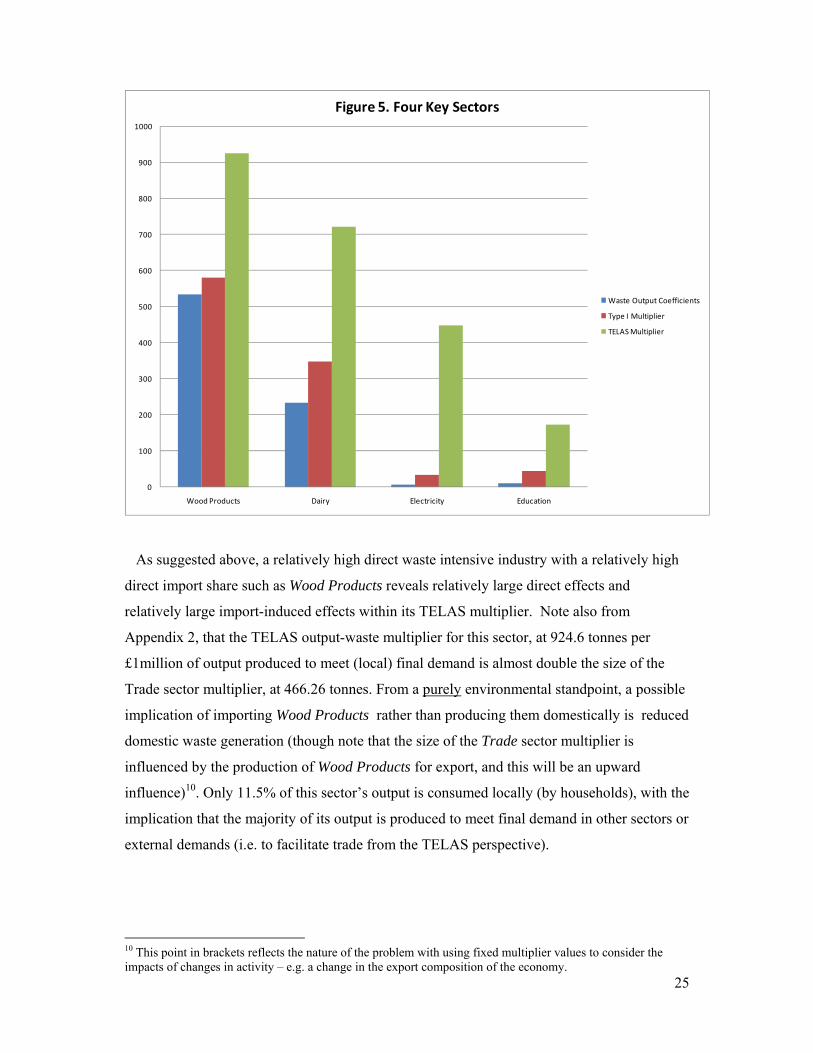
Figure 5. Four Key Sectors
Waste Output Coefficients
Type I Multiplier
TELAS Multiplier
As suggested above, a relatively high direct waste intensive industry with a relatively high
direct import share such as Wood Products reveals relatively large direct effects and
relatively large import-induced effects within its TELAS multiplier. Note also from
Appendix 2, that the TELAS output-waste multiplier for this sector, at 924.6 tonnes per
£1million of output produced to meet (local) final demand is almost double the size of the
Trade sector multiplier, at 466.26 tonnes. From a purely environmental standpoint, a possible
implication of importing Wood Products rather than producing them domestically is reduced
domestic waste generation (though note that the size of the Trade sector multiplier is
influenced by the production of Wood Products for export, and this will be an upward
influence)10. Only 11.5% of this sector’s output is consumed locally (by households), with the
implication that the majority of its output is produced to meet final demand in other sectors or
external demands (i.e. to facilitate trade from the TELAS perspective).
10 This point in brackets reflects the nature of the problem with using fixed multiplier values to consider the impacts of changes in activity – e.g. a change in the export composition of the economy.
26
0%
10%
20%
30%
40%
50%
60%
70%
80%
90%
100%
Wood Products Dairy Electricity Education
Figure 6. Four Key Sectors TELAS Multiplier Apportionment
Import‐Induced Effects
Indirect Effects
Direct Effects
Dairy
Dairy is a sector that represents a relatively high waste intensity with a relatively low import
share. Much of Welsh agricultural produce is linked to dairy, and the sector features a
relatively well integrated supply chain, but with the sector seeing structural changes due to
the rationalization and restructuring of large dairies and creameries.
If we examine the apportionment of the TELAS multiplier for Dairy, we get the following
breakdown (see Figure 6):
• Direct: 32%
• Indirect: 16%
• Import-Induced: 52%
Large direct effects arise because Dairy is a relatively waste intensive sector. However,
having a low import share generally implies a relatively low import-induced effect whereas
that is not the case in this sector. Import-induced effects are not necessarily only related to
the sector in question. Dairy’s relatively large import-induced effects in its TELAS output-
waste multiplier can be explained through backward linkages particularly to Agriculture
27
(where 31% of Dairy’s input requirement is purchased from, and which itself imports 24% of
its own input requirement). Again, with a TELAS output-waste multiplier of 720.78 tonnes
per £1m of production to meet local final demand (24% of its output), 255 tonnes more than
the Trade sector, it could be argued that, from a production accounting perspective at least, it
would be better if Wales imported its Dairy product requirements.
Electricity
Electricity is a sector that represents a relatively low waste intensity with a relatively high
import share. It is an interesting sector in terms of waste attribution as it generates relatively
low Type I and Type II multipliers and then produces a much larger TELAS multiplier. The
technological base for power generation in Wales is changing as the industry moves towards
renewable energy sources and away from conventional coal generation.
If we examine the apportionment of the TELAS multiplier for Electricity, we get the
following breakdown (see Figure 6):
• Direct: 2%
• Indirect: 6%
• Import-Induced: 92%
These are the results that we would expect for a low waste intensive, high imports intensive
sector such as Electricity. Due to its low waste intensity, direct and indirect waste generation
in this sector account for less than 10% of the TELAS multiplier. Electricity’s high import
intensity drives the high import-induced effects. Even with this, the TELAS output-waste
multiplier, at 447.38 tonnes per £1million of output to meet local final demand is lower than
the Trade sector output-waste multiplier (466.26 tonnes), suggesting that, in terms of waste
concerns, Wales could gain in terms of waste reduction be producing more of its own
electricity. Moreover, if the structure of the sector were to change, making it less waste and
import intensive, the input-output multiplier analysis suggests that the situation would be
more positive.
Education
Education is a sector that represents both a relatively low waste intensity and a relatively low
import share. In Wales, this sector has recently seen consistent growth in line with
government spending patterns.

28
If we examine the apportionment of the TELAS multiplier for Education, we get the
following breakdown (see Figure 6):
• Direct: 6%
• Indirect: 20%
• Import-Induced: 74%
We observe relatively low direct effects due to the low waste intensity of the education
sector. However, similar to Dairy, we see large import-induced effects in a sector with low
import intensity. Once again, effects can be attributed to backward linkages to import
intensive industries. In this case, Education has strong linkages to Electricity, Computers and
Related Services, Motor Vehicles, and Other Business Services, all of which all have import
shares above 60%. However, Education is also one of the simplest sectors to analyse from a
TELAS perspective. Almost 78% of its output is produced to meet local consumption
demands, which is why, even with a relatively low TELAS output-waste multiplier (172.7
tonnes per £1million output to meet local final demand relative to the Trade sector
benchmark of 466.26 tonnes), it sees a much higher share of responsibility attributed to its
production 2.7% than in the direct (0.2%) and Type I (0.8%) analyses. The discussion above
shows that this is due not so much to its own import intensity (though at 25% of its input
requirements this could possibly be lowered), but that of the sectors that supply it. It is only
through an input-output analysis, where we can carry out a detailed examination of
interdependencies between sectors, and of dependence on trade, that such issues can be
examined.
4.2 Waste generation under the consumption accounting principle using a domestic
technology assumption
Here, we estimate equation (6) from Section 2.3 in a modelling exercise to consider the waste
implications if Wales were to cease trade and produce all its consumption requirements
domestically. That is, as explained in Section 2.3, using (6) we conduct a Type I attribution
analysis where imports are incorporated into domestic production and exports are removed
from final demand. Detailed results of this analysis are shown in Appendix 5. Here, we
examine some key results. We reiterate that the crucial point to bear in mind is the system in
(6) is a modelling rather than accounting framework (as in the Type I, Type II and TELAS
analyses above) and, as such, produces hypothetical simulation results for all economic
variables and for the waste account assuming that the region meets all of its own
29
consumption requirements. This means that the total waste generated, WT, need not be the
same as actual waste in the accounting framework, WR. Indeed, given that in 2003 Wales ran
a trade deficit (with imports of goods and services exceeding exports) we would expect that
estimation of (6) will give us increased output and waste requirements.
In terms of the change in production output required to satisfy Welsh consumption demands
in the absence of trade (that is, what would the output of the Welsh economy have to be were
it to become autarkic), we calculate the overall implied increase in output to be 23.6%.
Within this, the results in the second column of Appendix 5 show that the required change in
output at the sectoral level varies considerably. For example, Clothing would need to expand
its output by nearly 418% to meet the demands of an autarkic Wales. Similarly Office
Machinery would require output to increase by 428.69% to meet the Welsh domestic demand
in the absence of trade. At the other end of the spectrum, Cement & Plaster and Iron & Steel
would see their output shrink by 56.65% and 28.49% respectively in the absence of trade.
This demonstrates the reliance of these industries on non-Welsh demands for their output, i.e.
export demand.
Turning to the specific issue of waste generation, the first two columns of Appendix 5 show
the impact of the modelled change in the scale and composition of production activity on
direct waste generation. The column totals show that the aggregate change in the waste
required in support of Welsh production would be an increase of 46%. Given that the
proportionate increase in waste (at the aggregate level) is almost double the required increase
in aggregate output from production, this implies that, as well as increasing the size of the
economy, Wales would have to move towards more waste intensive production if it were to
cease trade and meet all of its own consumption demands (i.e. this implies that Wales is
currently ‘importing sustainability’ in terms of waste generation).11
However, note that above we are considering the results of the hypothetical analysis
under the domestic technology assumption from the perspective of an autarkic situation – i.e.
what if Wales were a closed economy meeting all of its own consumption demands. The
domestic technology assumption is also commonly employed in full footprint analyses (the
fifth option in Table 1 in Section 2) where data are not available on the production and waste
generation technology employed in exporting countries. From a footprint perspective, it is
worth bearing in mind that if (as seems a reasonable speculation) the waste embodied in the
11 Note that at the sectoral level, the proportionate change in waste and output is the same. This is due to the assumption of fixed proportional Leontief technology in the relationship between the two variables (and all others) at the sectoral level. What gives us the difference at the aggregate level is a change in the composition of activity in the Welsh economy.

30
production of the output of, for example, Clothing from other countries is greater than the
waste that would be generated in the Welsh production of Clothing, then the actual waste
supported by Welsh consumption may be higher still.
The third column of Appendix 5 show the Type I output-waste multipliers that form the P -1ω [ - ( + ]I R M) element in the calculation of equation (6) – i.e. tonnes of waste per £1m
final demand for sectoral output and comparable to the results of the standard Type I IO
accounting exercise in the second column of Table 2 (though these now incorporate direct
and indirect effects associated with imports, which were previously not considered in the
Type I analysis). The fourth column of Appendix 5 shows the resulting attribution of waste
generation to final demand for sectoral outputs/commodities (comparable to the results in the
second column of Appendix 3) and the fifth shows the results of this attribution in percentage
terms (comparable to Figures 2, 3 and 4 in Section 4.1).
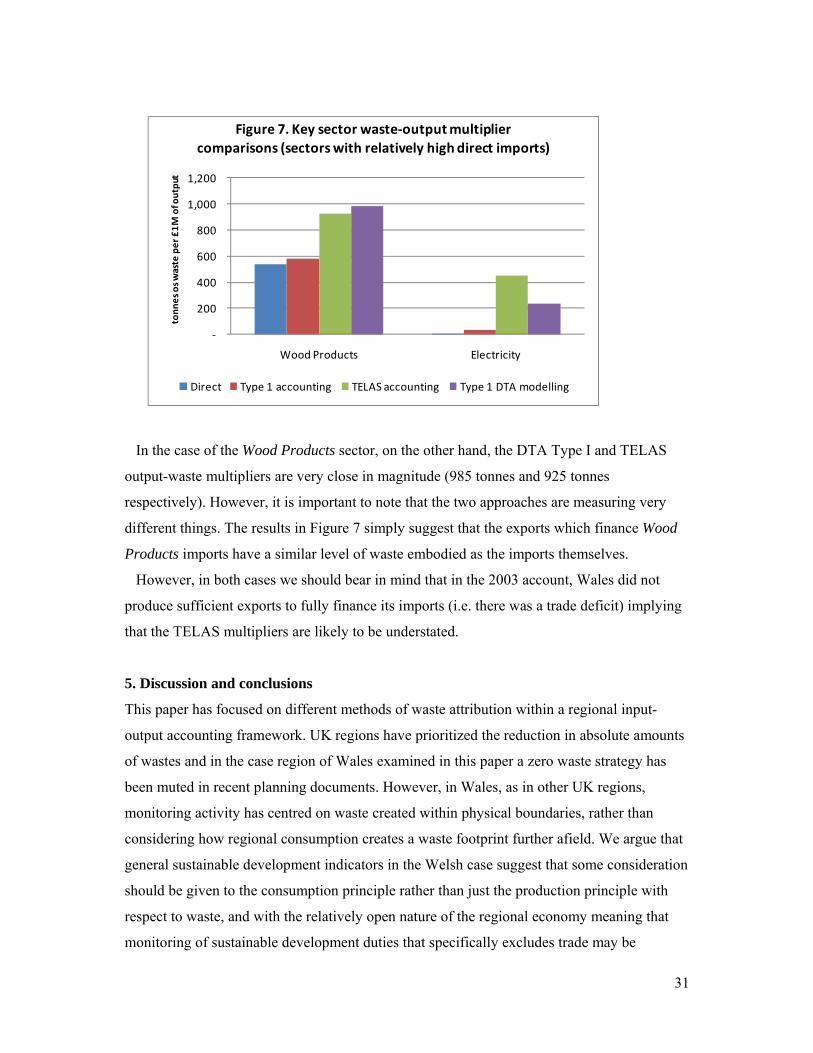
Using the output-waste multipliers, Figure 7 gives us a useful comparison between the
TELAS accounting results and the modelling exercise under the domestic technology
assumption (DTA). Here we take the two sectors identified in Figures 5 and 6 in the TELAS
analysis in Section 4.1 as having high direct import intensities, and, therefore, relatively high
import-induced effects in the TELAS output-waste multipliers. These were Wood Products
and Electricity. Figure 7 shows the TELAS multipliers for these two sectors again (alongside
the direct waste intensities and conventional Type I output-waste multipliers from the
accounting analysis in Section 4.1) and compares them with the Type I output-waste
multipliers from the DTA modelling exercise. The more interesting of the two is Electricity.
Here we see that the TELAS multiplier, at just over 447 tonnes of waste per £1million output
to meet final demand is much larger than the Type I DTA multiplier at just under 233 tonnes.
In understanding the result, it is important to remember that the TELAS analysis involves
allocating waste generation embodied in export production to the sectors whose imports these
exports are financing. In the DTA analysis, we are estimating the actual waste generation
involved in producing imports under the domestic technology assumption. Therefore,
comparing the DTA Type I multipliers to the TELAS ones (and conventional Type 1 to focus
on the additional impact of imports to production) for Electricity implies that the exports that
are taken to finance imports to the Electricity sector in the TELAS analysis are more (directly
and indirectly) waste intensive than the actual imports themselves (as estimated here using
the DTA).
31
‐
200
400
600
800
1,000
1,200
Wood Products Electricity
tonn
es os w
aste per £1M
of output
Figure 7. Key sector waste‐output multiplier comparisons (sectors with relatively high direct imports)
Direct Type 1 accounting TELAS accounting Type 1 DTA modelling
In the case of the Wood Products sector, on the other hand, the DTA Type I and TELAS
output-waste multipliers are very close in magnitude (985 tonnes and 925 tonnes
respectively). However, it is important to note that the two approaches are measuring very
different things. The results in Figure 7 simply suggest that the exports which finance Wood
Products imports have a similar level of waste embodied as the imports themselves.
However, in both cases we should bear in mind that in the 2003 account, Wales did not
produce sufficient exports to fully finance its imports (i.e. there was a trade deficit) implying
that the TELAS multipliers are likely to be understated.
5. Discussion and conclusions
This paper has focused on different methods of waste attribution within a regional input-
output accounting framework. UK regions have prioritized the reduction in absolute amounts
of wastes and in the case region of Wales examined in this paper a zero waste strategy has
been muted in recent planning documents. However, in Wales, as in other UK regions,
monitoring activity has centred on waste created within physical boundaries, rather than
considering how regional consumption creates a waste footprint further afield. We argue that
general sustainable development indicators in the Welsh case suggest that some consideration
should be given to the consumption principle rather than just the production principle with
respect to waste, and with the relatively open nature of the regional economy meaning that
monitoring of sustainable development duties that specifically excludes trade may be

32
problematic. Indeed a broad footprint principle is advocated in environmental strategy
documents in the Welsh case. Moreover, similar conclusions have been made with respect to
climate change indicators (greenhouse gas indicators) where monitoring under the production
principle provides a very partial understanding of regional ‘responsibilities’.
While a consumption principle for regional monitoring may be desirable, there are
problems in deriving appropriate information. In this paper we have explored a series of
approaches to understanding the issue of who creates waste in Wales, considering production
and consumption principles using the single-region data that are currently available. It is
suggested that the single region input-output framework is a useful starting point for a
detailed attribution analysis, and an important adjunct for regional policy makers exploring
industries and consumptive behaviors that create waste both directly and indirectly.
The paper presents a menu of options for waste attribution analysis in the regional
economy. Importantly, the paper has revealed that the approaches vary in their ability to
encompass trade, and vary considerably in terms of underlying assumptions. The analysis for
selected industries reveals that each approach has some value. However, we believe that the
TELAS and Domestic Technology Assumption methods may provide particularly useful
insights for policymakers in that both explicitly deal with issues of trade: the former is a
means of linking all domestic waste generation to domestic private and public consumption
categories, and with the latter providing an insight into the nature of the regional waste
footprint. There are issues involved in the use of these measures. However, provided that the
underlying assumptions, and their implications, are understood, these measures are a cost
effective and transparent means of gaining waste attribution insights. We accept that in the
case of the approach focusing on domestic technology assumptions this is something of a half
way house towards a full consumption accounting principle. However, it allows us to
consider what the waste implications of Welsh consumption would be in the absence of trade,
thereby highlighting the importance of trade to the Welsh economy. Moreover, it is expected
that few regions have the resources to produce the extensive data that a complete inter-
regional footprint analysis would require. For example, the approaches discussed in this paper
only require data on the regional economy and not the large amounts of economic, trade, and
waste generation data from regional and national economies that are linked to Wales through
trade.
Care is obviously required in drawing too much inference from modelled results from an
input-output framework. The general limitations of the input-output approach are well known
and are not repeated here (see Miller and Blair, 1985, for a review). Moreover, at the time of
33
writing, not all UK regions have published input-output tables available, but with many
having access to tables which have been mechanically derived from the UK input-output
framework, the type of analysis undertaken here could be repeated for other UK regions.
Going forward, there is a series of possibilities. The paper has concentrated on total waste
generated. However, in terms of policy development and monitoring there is particular
interest in different types of waste. We have shown that the approaches explored can be
adapted for different waste streams fairly easily (and could be used for examining other
externalities, such as generation of greenhouse gases). As shown by Leontief (1970), the
input-output approach can also be extended to consider the resource implications of disposing
of waste generated in the economy (see Allan et al, 2007, for an application to waste
generation and disposal in Scotland). Furthermore, there is the possibility within the
underlying regional input-output framework of deriving scenarios based on changes in
consumer behavior and industry structure. This is of interest at the moment with the structure
of the regional economy changing through the recession and with a need for planning
purposes to understand what this means for waste generation. The framework also allows
policy makers to investigate changing demands for different waste management options, and
expected changes in the regulatory pressures placed on regional industries and consumers.
However, we would qualify this last point by noting the particular limitations of input-output
techniques in analyzing the impacts of changes in activity, which centre on the conventional
input-output model’s silence on prices and assumption of inelastic supply. For this reason,
another priority for future research may be to relax these assumptions in a more flexible
computable general equilibrium framework (where the waste input-output framework
constructed here would serve as the core database).
References
Allan, G., Hanley, N.D., McGregor, P.G., Swales, J.K. and Turner, K.R. (2007) Augmenting the Input-Output Framework for “Common Pool” Resources: Operationalising the Full Leontief Environmental Model, Economic Systems Research, 19, pp. 1-22. ARUP (2009) Ecological footprint impact of the Welsh Waste Strategy. Study report for the Welsh Assembly Government, by Ove Arup and Partners Limited, Admiral House, 78 East Street, Leeds. Bryan, J., Jones, C., Munday, M. and Roberts, A. (2004) input-output tables for Wales 2000. Cardiff: Cardiff Business School.

34
Collins, A., Jones, C. and Munday, M. (2009) Assessing the environmental impacts of mega sporting events: Two options? Tourism Management, forthcoming. Dixit, A.K. and Norman, V., (1980). Theory of International Trade. Cambridge University Press, Cambridge. Druckman, A., Bradley, P., Papathanasopoulou, E. and Jackson, T. (2008) Measuring progress towards carbon reduction in the UK, Ecological Economics, 66.4: 594-604 Druckman, A and Jackson, T. (2009) The carbon footprint of UK households 1990–2004: A socio-economically disaggregated, quasi-multi-regional input–output model, Ecological Economics, 68.7: 2066-2077. DTZ and WERU (Welsh Economy Research Unit), (2007). Experimental Environmental Satellite Accounts for Wales. Report for Economic Research Advisory Panel. Cardiff: Welsh Assembly Government. See http://wales.gov.uk/firstminister/research/economic/completed/satelliteaccounts/environmentalsatelliteng.pdf?lang=en accessed 13th August 2009. Environment Agency Wales (2008) An assessment of waste data for the Waste Strategy Review. A report for the Welsh Assembly Government by Environment Agency Wales, Cambria House, Newport Road, Cardiff. Frater L. and Hines, F. (2004) Commercial and Industrial Waste Survey Wales 2003. Report for Environment Agency Wales and Biffaward. Hogg, D. and Elliott, T. (2009) Future recycling and landfill diversion targets for Wales. Report for Welsh Assembly Government by Eunomia Research and Consulting, 62 Queen Square, Bristol. Jones, C and Munday, M. (2007) Exploring the environmental consequences of tourism: A satellite account approach, Journal of Travel Research, 46, 2: 164-172. Leontief, W. (1970) Environmental repercussions and the economic structure: an input-output approach. Review of Economic Statistics, 52: 262-277. McGregor, P., McNicoll, I., Swales, J. Kim., and Turner K (2001) Who Pollutes in Scotland, FAI Quarterly Economic Commentary, 26, 23-32. McGregor, P.G., McLellan, D., Swales, J.K., Turner, K.R. (2004) Attribution of Pollution Generation to Local Private and Public Demands in a Small Open Economy: Results from a SAM-Based Neo-Classical Linear Attribution System. Mimeo, Strathclyde Discussion Papers in Economics, 04–08. McGregor, P.G., Swales, J.K. and Turner, K. (2008). The CO2 trade balance between Scotland and the rest of the UK: performing a multi-regional environmental input-output analysis with limited data. Ecological Economics, 66; 662-673. Munday, M. and Roberts, A. (2006) Developing approaches to measuring and monitoring sustainable development in Wales: A review, Regional Studies, 40: 535-544.

35
Munksgaard, J. and Pedersen, K.A., (2001). CO2 accounts for open economies: producer or consumer responsibility? Energy Policy, 29:327-334 National Statistics (2002) ‘Methodologies for estimating the levels of atmospheric emissions arising from the production of goods imported into the UK’. Report of a project undertaken by the Office of National Statistics, United Kingdom Turner, K., Lenzen, M., Wiedmann, T. and Barrett, J., (2007). Examining the Global Environmental Impact of Regional Consumption Activities – Part 1: A Technical Note on Combining Input-Output and Ecological Footprint Analysis, Ecological Economics, 62(1): 37-44. Urban Mines (2009) Survey of Commercial and Industrial Waste Arisings in Wales. Report for Environment Agency Wales, Cambria House, Cardiff and see http://www.environment-agency.gov.uk/static/documents/Research/Survey_of_Industrial_and_Commercial_Waste_Arisings_in_Wales_2007.pdf accessed 13th August 2009 Welsh Assembly Government (2008) One Wales: One Planet – Consultation on a new Sustainable Development Scheme for Wales Welsh Assembly Government (2008) Sustainability Appraisal of the Draft Wales Waste Strategy: Annex A: Review of Policy Plans and Programmes & Annex B Environmental, Economic and Social Baseline. Welsh Assembly Government (2009a) Towards Zero Waste – A Consultation on a New Waste Strategy for Wales. Waste Strategy Branch, Department for Environment, Sustainability and Housing, Welsh Assembly Government see http://wales.gov.uk/docs/desh/consultation/090429wasteconsultationen.pdf accessed 13th August 2009. Welsh Assembly Government (2009b) State of the Environment. 23rd July 2009. Available for http://www.statswales.wales.gov.uk, accessed 16th September 2009. WERU (Welsh Economy Research Unit) (2007) Welsh Input-Output Tables for 2003, Report for Welsh Assembly Government, and available on request from WERU, Cardiff Business School, Colum Drive, Cardiff, CF10 3EU. Wiedmann, T., Lenzen, M., Barrett, J. and Turner, K., (2007). Examining the Global Environmental Impact of Regional Consumption Activities – Part 2: Review of input-output models for the assessment of environmental impacts embodied in trade, Ecological Economics, 61(1): 15-26. World Wildlife Fund (2007) One Planet Wales: Transforming Wales for a prosperous future within our fair share of earths resources.
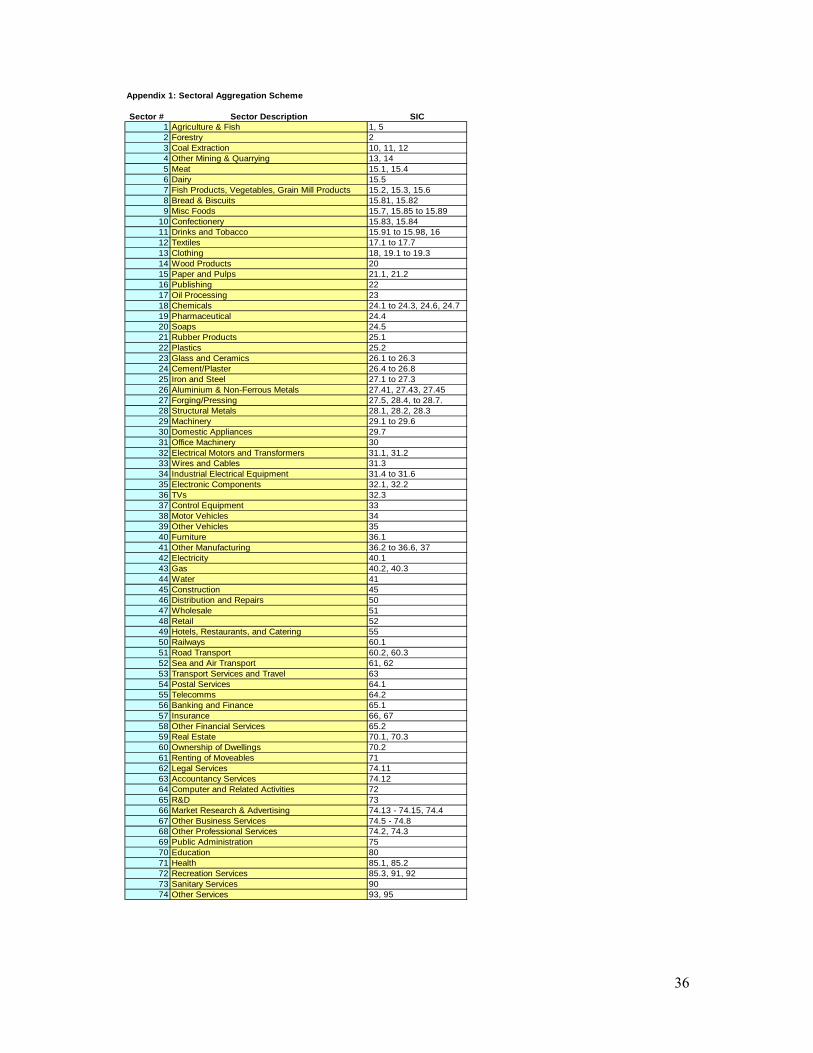
36
Appendix 1: Sectoral Aggregation Scheme
Sector # Sector Description SIC1 Agriculture & Fish 1, 52 Forestry 23 Coal Extraction 10, 11, 124 Other Mining & Quarrying 13, 145 Meat 15.1, 15.46 Dairy 15.57 Fish Products, Vegetables, Grain Mill Products 15.2, 15.3, 15.68 Bread & Biscuits 15.81, 15.829 Misc Foods 15.7, 15.85 to 15.89
10 Confectionery 15.83, 15.8411 Drinks and Tobacco 15.91 to 15.98, 1612 Textiles 17.1 to 17.713 Clothing 18, 19.1 to 19.314 Wood Products 2015 Paper and Pulps 21.1, 21.216 Publishing 2217 Oil Processing 2318 Chemicals 24.1 to 24.3, 24.6, 24.719 Pharmaceutical 24.420 Soaps 24.521 Rubber Products 25.122 Plastics 25.223 Glass and Ceramics 26.1 to 26.324 Cement/Plaster 26.4 to 26.825 Iron and Steel 27.1 to 27.326 Aluminium & Non-Ferrous Metals 27.41, 27.43, 27.4527 Forging/Pressing 27.5, 28.4, to 28.7.28 Structural Metals 28.1, 28.2, 28.329 Machinery 29.1 to 29.630 Domestic Appliances 29.731 Office Machinery 3032 Electrical Motors and Transformers 31.1, 31.233 Wires and Cables 31.334 Industrial Electrical Equipment 31.4 to 31.635 Electronic Components 32.1, 32.236 TVs 32.337 Control Equipment 3338 Motor Vehicles 3439 Other Vehicles 3540 Furniture 36.141 Other Manufacturing 36.2 to 36.6, 3742 Electricity 40.143 Gas 40.2, 40.344 Water 4145 Construction 4546 Distribution and Repairs 5047 Wholesale 5148 Retail 5249 Hotels, Restaurants, and Catering 5550 Railways 60.151 Road Transport 60.2, 60.352 Sea and Air Transport 61, 6253 Transport Services and Travel 6354 Postal Services 64.155 Telecomms 64.256 Banking and Finance 65.157 Insurance 66, 6758 Other Financial Services 65.259 Real Estate 70.1, 70.360 Ownership of Dwellings 70.261 Renting of Moveables 7162 Legal Services 74.1163 Accountancy Services 74.1264 Computer and Related Activities 7265 R&D 7366 Market Research & Advertising 74.13 - 74.15, 74.467 Other Business Services 74.5 - 74.868 Other Professional Services 74.2, 74.369 Public Administration 7570 Education 8071 Health 85.1, 85.272 Recreation Services 85.3, 91, 9273 Sanitary Services 9074 Other Services 93, 95
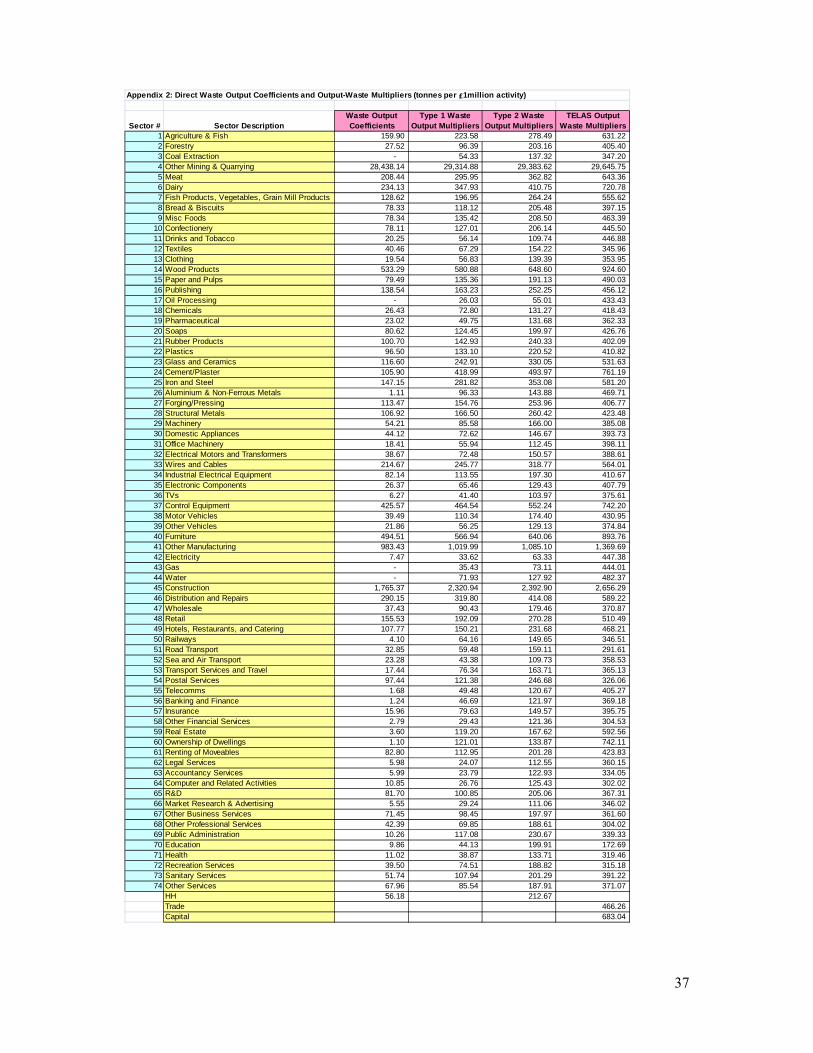
37
Sector # Sector DescriptionWaste Output Coefficients
Type 1 Waste Output Multipliers
Type 2 Waste Output Multipliers
TELAS Output Waste Multipliers
1 Agriculture & Fish 159.90 223.58 278.49 631.22 2 Forestry 27.52 96.39 203.16 405.40 3 Coal Extraction - 54.33 137.32 347.20 4 Other Mining & Quarrying 28,438.14 29,314.88 29,383.62 29,645.75 5 Meat 208.44 295.95 362.82 643.36 6 Dairy 234.13 347.93 410.75 720.78 7 Fish Products, Vegetables, Grain Mill Products 128.62 196.95 264.24 555.62 8 Bread & Biscuits 78.33 118.12 205.48 397.15 9 Misc Foods 78.34 135.42 208.50 463.39
10 Confectionery 78.11 127.01 206.14 445.50 11 Drinks and Tobacco 20.25 56.14 109.74 446.88 12 Textiles 40.46 67.29 154.22 345.96 13 Clothing 19.54 56.83 139.39 353.95 14 Wood Products 533.29 580.88 648.60 924.60 15 Paper and Pulps 79.49 135.36 191.13 490.03 16 Publishing 138.54 163.23 252.25 456.12 17 Oil Processing - 26.03 55.01 433.43 18 Chemicals 26.43 72.80 131.27 418.43 19 Pharmaceutical 23.02 49.75 131.68 362.33 20 Soaps 80.62 124.45 199.97 426.76 21 Rubber Products 100.70 142.93 240.33 402.09 22 Plastics 96.50 133.10 220.52 410.82 23 Glass and Ceramics 116.60 242.91 330.05 531.63 24 Cement/Plaster 105.90 418.99 493.97 761.19 25 Iron and Steel 147.15 281.82 353.08 581.20 26 Aluminium & Non-Ferrous Metals 1.11 96.33 143.88 469.71 27 Forging/Pressing 113.47 154.76 253.96 406.77 28 Structural Metals 106.92 166.50 260.42 423.48 29 Machinery 54.21 85.58 166.00 385.08 30 Domestic Appliances 44.12 72.62 146.67 393.73 31 Office Machinery 18.41 55.94 112.45 398.11 32 Electrical Motors and Transformers 38.67 72.48 150.57 388.61 33 Wires and Cables 214.67 245.77 318.77 564.01 34 Industrial Electrical Equipment 82.14 113.55 197.30 410.67 35 Electronic Components 26.37 65.46 129.43 407.79 36 TVs 6.27 41.40 103.97 375.61 37 Control Equipment 425.57 464.54 552.24 742.20 38 Motor Vehicles 39.49 110.34 174.40 430.95 39 Other Vehicles 21.86 56.25 129.13 374.84 40 Furniture 494.51 566.94 640.06 893.76 41 Other Manufacturing 983.43 1,019.99 1,085.10 1,369.69 42 Electricity 7.47 33.62 63.33 447.38 43 Gas - 35.43 73.11 444.01 44 Water - 71.93 127.92 482.37 45 Construction 1,765.37 2,320.94 2,392.90 2,656.29 46 Distribution and Repairs 290.15 319.80 414.08 589.22 47 Wholesale 37.43 90.43 179.46 370.87 48 Retail 155.53 192.09 270.28 510.49 49 Hotels, Restaurants, and Catering 107.77 150.21 231.68 468.21 50 Railways 4.10 64.16 149.65 346.51 51 Road Transport 32.85 59.48 159.11 291.61 52 Sea and Air Transport 23.28 43.38 109.73 358.53 53 Transport Services and Travel 17.44 76.34 163.71 365.13 54 Postal Services 97.44 121.38 246.68 326.06 55 Telecomms 1.68 49.48 120.67 405.27 56 Banking and Finance 1.24 46.69 121.97 369.18 57 Insurance 15.96 79.63 149.57 395.75 58 Other Financial Services 2.79 29.43 121.36 304.53 59 Real Estate 3.60 119.20 167.62 592.56 60 Ownership of Dwellings 1.10 121.01 133.87 742.11 61 Renting of Moveables 82.80 112.95 201.28 423.83 62 Legal Services 5.98 24.07 112.55 360.15 63 Accountancy Services 5.99 23.79 122.93 334.05 64 Computer and Related Activities 10.85 26.76 125.43 302.02 65 R&D 81.70 100.85 205.06 367.31 66 Market Research & Advertising 5.55 29.24 111.06 346.02 67 Other Business Services 71.45 98.45 197.97 361.60 68 Other Professional Services 42.39 69.85 188.61 304.02 69 Public Administration 10.26 117.08 230.67 339.33 70 Education 9.86 44.13 199.91 172.69 71 Health 11.02 38.87 133.71 319.46 72 Recreation Services 39.50 74.51 188.82 315.18 73 Sanitary Services 51.74 107.94 201.29 391.22 74 Other Services 67.96 85.54 187.91 371.07
HH 56.18 212.67 Trade 466.26 Capital 683.04
Appendix 2: Direct Waste Output Coefficients and Output-Waste Multipliers (tonnes per £1million activity)
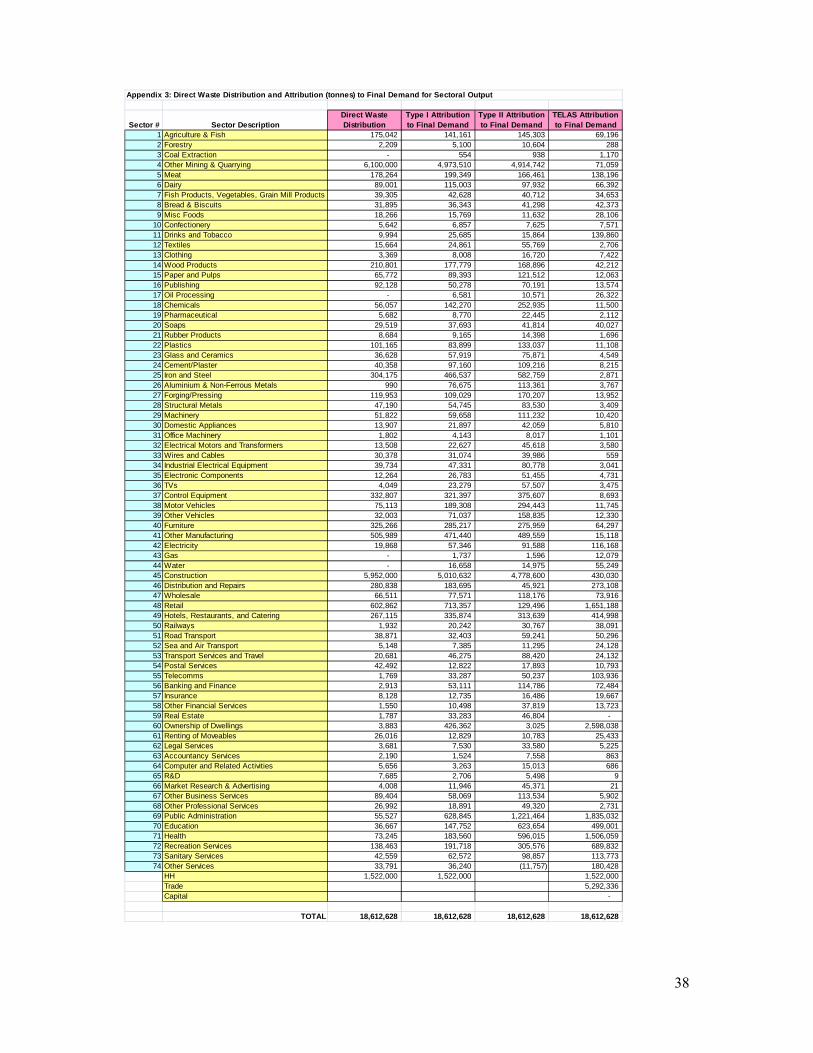
38
Sector # Sector DescriptionDirect Waste Distribution
Type I Attribution to Final Demand
Type II Attribution to Final Demand
TELAS Attribution to Final Demand
1 Agriculture & Fish 175,042 141,161 145,303 69,196 2 Forestry 2,209 5,100 10,604 288 3 Coal Extraction - 554 938 1,170 4 Other Mining & Quarrying 6,100,000 4,973,510 4,914,742 71,059 5 Meat 178,264 199,349 166,461 138,196 6 Dairy 89,001 115,003 97,932 66,392 7 Fish Products, Vegetables, Grain Mill Products 39,305 42,628 40,712 34,653 8 Bread & Biscuits 31,895 36,343 41,298 42,373 9 Misc Foods 18,266 15,769 11,632 28,106
10 Confectionery 5,642 6,857 7,625 7,571 11 Drinks and Tobacco 9,994 25,685 15,864 139,860 12 Textiles 15,664 24,861 55,769 2,706 13 Clothing 3,369 8,008 16,720 7,422 14 Wood Products 210,801 177,779 168,896 42,212 15 Paper and Pulps 65,772 89,393 121,512 12,063 16 Publishing 92,128 50,278 70,191 13,574 17 Oil Processing - 6,581 10,571 26,322 18 Chemicals 56,057 142,270 252,935 11,500 19 Pharmaceutical 5,682 8,770 22,445 2,112 20 Soaps 29,519 37,693 41,814 40,027 21 Rubber Products 8,684 9,165 14,398 1,696 22 Plastics 101,165 83,899 133,037 11,108 23 Glass and Ceramics 36,628 57,919 75,871 4,549 24 Cement/Plaster 40,358 97,160 109,216 8,215 25 Iron and Steel 304,175 466,537 582,759 2,871 26 Aluminium & Non-Ferrous Metals 990 76,675 113,361 3,767 27 Forging/Pressing 119,953 109,029 170,207 13,952 28 Structural Metals 47,190 54,745 83,530 3,409 29 Machinery 51,822 59,658 111,232 10,420 30 Domestic Appliances 13,907 21,897 42,059 5,810 31 Office Machinery 1,802 4,143 8,017 1,101 32 Electrical Motors and Transformers 13,508 22,627 45,618 3,580 33 Wires and Cables 30,378 31,074 39,986 559 34 Industrial Electrical Equipment 39,734 47,331 80,778 3,041 35 Electronic Components 12,264 26,783 51,455 4,731 36 TVs 4,049 23,279 57,507 3,475 37 Control Equipment 332,807 321,397 375,607 8,693 38 Motor Vehicles 75,113 189,308 294,443 11,745 39 Other Vehicles 32,003 71,037 158,835 12,330 40 Furniture 325,266 285,217 275,959 64,297 41 Other Manufacturing 505,989 471,440 489,559 15,118 42 Electricity 19,868 57,346 91,588 116,168 43 Gas - 1,737 1,596 12,079 44 Water - 16,658 14,975 55,249 45 Construction 5,952,000 5,010,632 4,778,600 430,030 46 Distribution and Repairs 280,838 183,695 45,921 273,108 47 Wholesale 66,511 77,571 118,176 73,916 48 Retail 602,862 713,357 129,496 1,651,188 49 Hotels, Restaurants, and Catering 267,115 335,874 313,639 414,998 50 Railways 1,932 20,242 30,767 38,091 51 Road Transport 38,871 32,403 59,241 50,296 52 Sea and Air Transport 5,148 7,385 11,295 24,128 53 Transport Services and Travel 20,681 46,275 88,420 24,132 54 Postal Services 42,492 12,822 17,893 10,793 55 Telecomms 1,769 33,287 50,237 103,936 56 Banking and Finance 2,913 53,111 114,786 72,484 57 Insurance 8,128 12,735 16,486 19,667 58 Other Financial Services 1,550 10,498 37,819 13,723 59 Real Estate 1,787 33,283 46,804 - 60 Ownership of Dwellings 3,883 426,362 3,025 2,598,038 61 Renting of Moveables 26,016 12,829 10,783 25,433 62 Legal Services 3,681 7,530 33,580 5,225 63 Accountancy Services 2,190 1,524 7,558 863 64 Computer and Related Activities 5,656 3,263 15,013 686 65 R&D 7,685 2,706 5,498 9 66 Market Research & Advertising 4,008 11,946 45,371 21 67 Other Business Services 89,404 58,069 113,534 5,902 68 Other Professional Services 26,992 18,891 49,320 2,731 69 Public Administration 55,527 628,845 1,221,464 1,835,032 70 Education 36,667 147,752 623,654 499,001 71 Health 73,245 183,560 596,015 1,506,059 72 Recreation Services 138,463 191,718 305,576 689,832 73 Sanitary Services 42,559 62,572 98,857 113,773 74 Other Services 33,791 36,240 (11,757) 180,428
HH 1,522,000 1,522,000 1,522,000 Trade 5,292,336 Capital -
TOTAL 18,612,628 18,612,628 18,612,628 18,612,628
Appendix 3: Direct Waste Distribution and Attribution (tonnes) to Final Demand for Sectoral Output

39
Appendix 4: Summary of Attribution of Total Waste (tonnes) to Type of Final Consumer
Type I Type II TELASLocal households 3,860,721 - 14,452,431 Local government and non-profit institutions serving households 1,028,998 2,631,475 4,160,197
Total local (private and public) consumption demand 4,889,719 2,631,475 18,612,628
Capital Formation 3,763,842 3,948,650 - Stocks 2,207,451 2,254,861 -
Total capital formation 5,971,294 6,203,511 -
RUK exports (g&s) 5,457,260 6,743,425 - ROW exports (g&s) 1,959,078 2,508,818 -
Total exports (g&s) 7,416,338 9,252,244 -
Total external tourists 335,278 525,399 -
Total waste attributable to final consumers 18,612,628 18,612,628 18,612,628
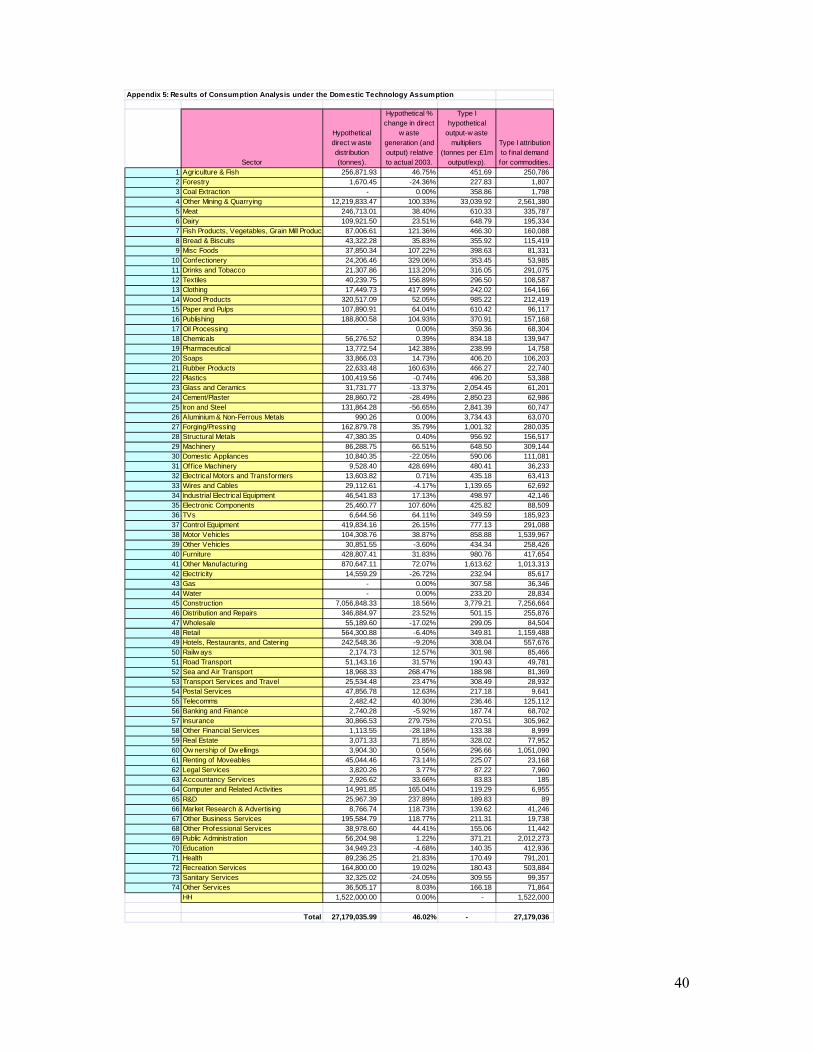
40
Appendix 5: Results of Consumption Analysis under the Domestic Technology Assumption
Sector
Hypothetical direct w aste distribution (tonnes).
Hypothetical % change in direct
w aste generation (and output) relative to actual 2003.
Type I hypothetical
output-w aste multipliers
(tonnes per £1m output/exp).
Type I attribution to f inal demand for commodities.
1 Agriculture & Fish 256,871.93 46.75% 451.69 250,786 2 Forestry 1,670.45 -24.36% 227.83 1,807 3 Coal Extraction - 0.00% 358.86 1,798 4 Other Mining & Quarrying 12,219,833.47 100.33% 33,039.92 2,561,380 5 Meat 246,713.01 38.40% 610.33 335,787 6 Dairy 109,921.50 23.51% 648.79 195,334 7 Fish Products, Vegetables, Grain Mill Product 87,006.61 121.36% 466.30 160,088 8 Bread & Biscuits 43,322.28 35.83% 355.92 115,419 9 Misc Foods 37,850.34 107.22% 398.63 81,331
10 Confectionery 24,206.46 329.06% 353.45 53,985 11 Drinks and Tobacco 21,307.86 113.20% 316.05 291,075 12 Textiles 40,239.75 156.89% 296.50 108,587 13 Clothing 17,449.73 417.99% 242.02 164,166 14 Wood Products 320,517.09 52.05% 985.22 212,419 15 Paper and Pulps 107,890.91 64.04% 610.42 96,117 16 Publishing 188,800.58 104.93% 370.91 157,168 17 Oil Processing - 0.00% 359.36 68,304 18 Chemicals 56,276.52 0.39% 834.18 139,947 19 Pharmaceutical 13,772.54 142.38% 238.99 14,758 20 Soaps 33,866.03 14.73% 406.20 106,203 21 Rubber Products 22,633.48 160.63% 466.27 22,740 22 Plastics 100,419.56 -0.74% 496.20 53,388 23 Glass and Ceramics 31,731.77 -13.37% 2,054.45 61,201 24 Cement/Plaster 28,860.72 -28.49% 2,850.23 62,986 25 Iron and Steel 131,864.28 -56.65% 2,841.39 60,747 26 Aluminium & Non-Ferrous Metals 990.26 0.00% 3,734.43 63,070 27 Forging/Pressing 162,879.78 35.79% 1,001.32 280,035 28 Structural Metals 47,380.35 0.40% 956.92 156,517 29 Machinery 86,288.75 66.51% 648.50 309,144 30 Domestic Appliances 10,840.35 -22.05% 590.06 111,081 31 Office Machinery 9,528.40 428.69% 480.41 36,233 32 Electrical Motors and Transformers 13,603.82 0.71% 435.18 63,413 33 Wires and Cables 29,112.61 -4.17% 1,139.65 62,692 34 Industrial Electrical Equipment 46,541.83 17.13% 498.97 42,146 35 Electronic Components 25,460.77 107.60% 425.82 88,509 36 TVs 6,644.56 64.11% 349.59 185,923 37 Control Equipment 419,834.16 26.15% 777.13 291,088 38 Motor Vehicles 104,308.76 38.87% 858.88 1,539,967 39 Other Vehicles 30,851.55 -3.60% 434.34 258,426 40 Furniture 428,807.41 31.83% 980.76 417,654 41 Other Manufacturing 870,647.11 72.07% 1,613.62 1,013,313 42 Electricity 14,559.29 -26.72% 232.94 85,617 43 Gas - 0.00% 307.58 36,346 44 Water - 0.00% 233.20 28,834 45 Construction 7,056,848.33 18.56% 3,779.21 7,256,664 46 Distribution and Repairs 346,884.97 23.52% 501.15 255,876 47 Wholesale 55,189.60 -17.02% 299.05 84,504 48 Retail 564,300.88 -6.40% 349.81 1,159,488 49 Hotels, Restaurants, and Catering 242,548.36 -9.20% 308.04 557,676 50 Railw ays 2,174.73 12.57% 301.98 85,466 51 Road Transport 51,143.16 31.57% 190.43 49,781 52 Sea and Air Transport 18,968.33 268.47% 188.98 81,369 53 Transport Services and Travel 25,534.48 23.47% 308.49 28,932 54 Postal Services 47,856.78 12.63% 217.18 9,641 55 Telecomms 2,482.42 40.30% 236.46 125,112 56 Banking and Finance 2,740.28 -5.92% 187.74 68,702 57 Insurance 30,866.53 279.75% 270.51 305,962 58 Other Financial Services 1,113.55 -28.18% 133.38 8,999 59 Real Estate 3,071.33 71.85% 328.02 77,952 60 Ow nership of Dw ellings 3,904.30 0.56% 296.66 1,051,090 61 Renting of Moveables 45,044.46 73.14% 225.07 23,168 62 Legal Services 3,820.26 3.77% 87.22 7,960 63 Accountancy Services 2,926.62 33.66% 83.83 185 64 Computer and Related Activities 14,991.85 165.04% 119.29 6,955 65 R&D 25,967.39 237.89% 189.83 89 66 Market Research & Advertising 8,766.74 118.73% 139.62 41,246 67 Other Business Services 195,584.79 118.77% 211.31 19,738 68 Other Professional Services 38,978.60 44.41% 155.06 11,442 69 Public Administration 56,204.98 1.22% 371.21 2,012,273 70 Education 34,949.23 -4.68% 140.35 412,936 71 Health 89,236.25 21.83% 170.49 791,201 72 Recreation Services 164,800.00 19.02% 180.43 503,884 73 Sanitary Services 32,325.02 -24.05% 309.55 99,357 74 Other Services 36,505.17 8.03% 166.18 71,864
HH 1,522,000.00 0.00% - 1,522,000
Total 27,179,035.99 46.02% - 27,179,036