who attends a women's college: identifying
TRANSCRIPT

Who Attends A Women’s College?
Identifying Unique Characteristics and Patterns of Change, 1971-2011
Linda J. Sax, Ph.D., Principal Investigator with Jennifer Berdan Lozano and Colleen Quinn Vandenboom
University of California, Los AngelesSeptember 2014
Updated April 2015

i
TABLEOFCONTENTSLISTOFTABLES............................................................................................................................................... ii LISTOFFIGURES ............................................................................................................................................ iii FOREWORD .................................................................................................................................................... iv EXECUTIVESUMMARY ................................................................................................................................... vii ACKNOWLEDGMENTS.....................................................................................................................................xiii PARTI:INTRODUCTION ................................................................................................................................... 1
AnEvolvingPopulationatWomen’sColleges...............................................................................................2
PARTII:RESEARCHMETHODS ......................................................................................................................... 4
ComparisonGroups..................................................................................................................................................5
CategoriesforAnalysis............................................................................................................................................6
Analysis..........................................................................................................................................................................7
PARTIII:COMPARINGCURRENTWOMEN’SCOLLEGESWITHHISTORICALLYCOEDUCATIONALINSTITUTIONS ...... 9 Demographics............................................................................................................................................................10
AcademicSelf‐ConfidenceandEngagement................................................................................................13
CollegeChoice............................................................................................................................................................14
FinancialAttitudesandExpectations..............................................................................................................16
Educational,Career,andFamilyAspirations...............................................................................................17
LeadershipOrientation.........................................................................................................................................18
CommunityOrientation........................................................................................................................................19
ArtisticInclination...................................................................................................................................................19
PsychologicalandPhysicalWell‐Being..........................................................................................................20
Spirituality...................................................................................................................................................................20
ExtracurricularActivities.....................................................................................................................................21
PoliticalandSocialViews.....................................................................................................................................22
SUMMARYOFKEYFINDINGSANDQUESTIONSFORCONSIDERATION ................................................................ 24 CONCLUSION ................................................................................................................................................. 27 REFERENCES ................................................................................................................................................. 28 TABLESANDFIGURES .................................................................................................................................... 30 APPENDICESA‐D .......................................................................................................................................... 85
ii
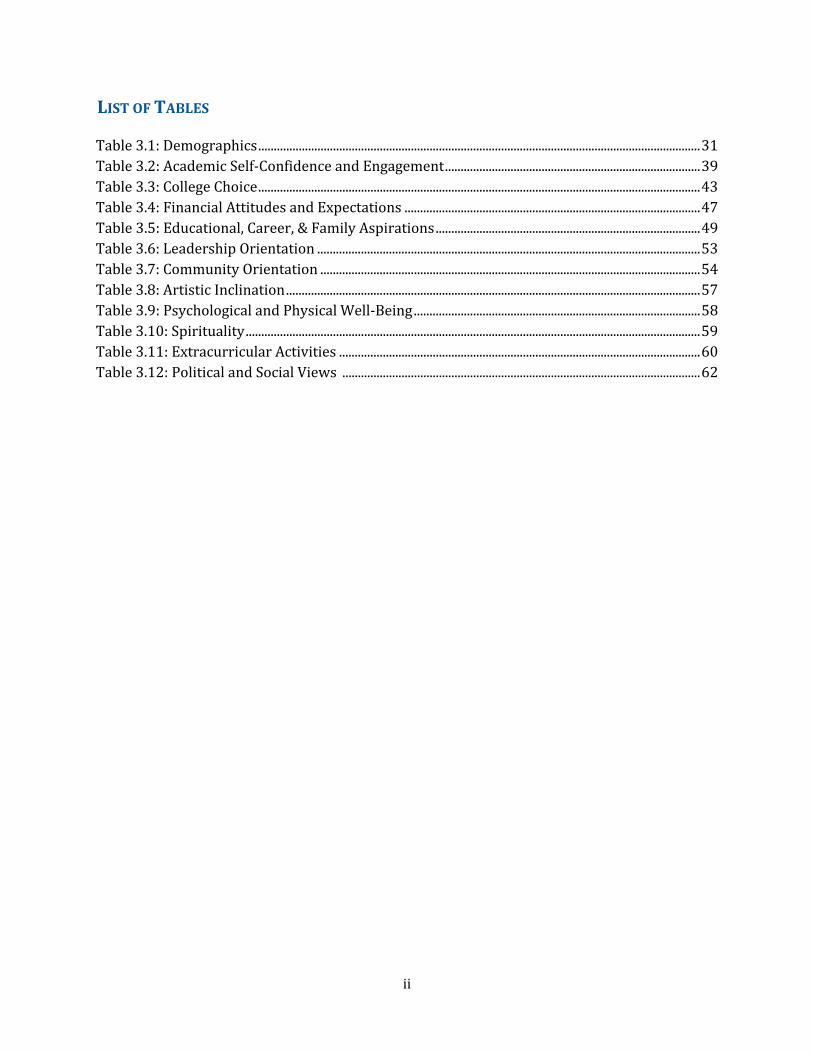
LISTOFTABLESTable3.1:Demographics..............................................................................................................................................31Table3.2:AcademicSelf‐ConfidenceandEngagement..................................................................................39Table3.3:CollegeChoice..............................................................................................................................................43Table3.4:FinancialAttitudesandExpectations...............................................................................................47Table3.5:Educational,Career,&FamilyAspirations.....................................................................................49Table3.6:LeadershipOrientation...........................................................................................................................53Table3.7:CommunityOrientation..........................................................................................................................54Table3.8:ArtisticInclination.....................................................................................................................................57Table3.9:PsychologicalandPhysicalWell‐Being............................................................................................58Table3.10:Spirituality..................................................................................................................................................59Table3.11:ExtracurricularActivities....................................................................................................................60Table3.12:PoliticalandSocialViews...................................................................................................................62

iii
LISTOFFIGURESFigure3.1:White/CaucasianStudentEnrollment............................................................................................67Figure3.2:AfricanAmerican/BlackEnrollment...............................................................................................67Figure3.3:AsianAmerican/AsianStudentEnrollment.................................................................................68Figure3.4:MedianParentalIncome.......................................................................................................................68Figure3.5:Collegeis500+MilesfromHome.....................................................................................................69Figure3.6:FatherHasaFour‐YearorGraduateDegree...............................................................................69Figure3.7:MotherHasaFour‐YearorGraduateDegree..............................................................................70Figure3.8:Father’sOccupation:Doctor(MDorDDS)....................................................................................70Figure3.9:Father’sOccupation:Lawyer..............................................................................................................71Figure3.10:Father’sOccupation:Business.........................................................................................................71Figure3.11:Father’sOccupation:Laborer..........................................................................................................72Figure3.12:Father’sOccupation:Unemployed.................................................................................................72Figure3.13:Father’sOccupation:Military...........................................................................................................73Figure3.14:ParentsDivorcedorLivingApart...................................................................................................73Figure3.15:AverageGradeinHighSchool:A+,A,orA‐................................................................................74Figure3.16:MedianHoursPerWeekinHighSchool:Studying/Homework.......................................74Figure3.17:Self‐RatedMathematicalAbility.....................................................................................................75Figure3.18:Self‐RatedAcademicAbility..............................................................................................................75Figure3.19:CollegeApplicationsOtherThanCurrentCollege:SixorMore........................................76Figure3.20:AttendingFirstChoiceCollege........................................................................................................76Figure3.21:ReasonForAttendingThisCollege:MyTeacherAdvisedMe...........................................77Figure3.22:ReasonForAttendingThisCollege:IWantedtoLiveNearHome..................................77Figure3.23:ExpecttoWorkFull‐TimeWhileAttendingCollege..............................................................78Figure3.24:PercentIndicatingMajorConcernsAboutFinancingCollege...........................................78Figure3.25:YourProbableFieldofStudy:Engineering................................................................................79Figure3.26:YourProbableFieldofStudy:Psychology.................................................................................79Figure3.27:YourProbablyCareer/Occupation:Nurse.................................................................................80Figure3.28:Goal:HelpingtoPromoteRacialUnderstanding.....................................................................80Figure3.29:Goal:InfluencingSocialValues........................................................................................................81Figure3.30:MedianHoursPerWeekinHighSchool:VolunteerWork..................................................81Figure3.31:Goal:WritingOriginalWorks...........................................................................................................82Figure3.32:Goal:BecomingAccomplishedinthePerformingArts........................................................82Figure3.33:FrequentlyFeltDepressedinHighSchool.................................................................................83Figure3.34:ExpecttoSeekPersonalCounseling.............................................................................................83Figure3.35:MedianHoursPerWeekinHighSchoolExerciseorSports..............................................84Figure3.36:BeliefthatWealthyPeopleShouldPayaLargerShareofTaxes......................................84

iv
FOREWORD
nits2010StrategicPlan,theWomen’sCollegeCoalitionsetoutto“enhance
thepowerandinfluenceofwomen’scollegesasthoughtleadersand
educationalinnovatorsbyadvancingitsmembers’sharedmissiontopromote
thewell‐beingandsuccessofwomenandgirls.”
CentraltothisstrategicplanistheCoalition’sresearchagenda,whichseeksto
provide“compellingdataandanalysisoftheeffectivenessofawomen’scollegeeducation
thatilluminatesthefactorsthatcanimpedeorenhancethewell‐beingandsuccessof
womenandgirlsbefore,during,andaftercollege.”Atatimeofrapidanddisruptivechange
inhighereducation,thisresearchagendaisdesignedtoprovideCoalitionmemberswitha
well‐groundedandmulti‐dimensionalanswertothequestion“WhyDoestheWorldNeed
Women’sColleges?”
TheCoalition’sresearchagendaismulti‐facetedandhierarchical.Asafirststep,the
CoalitionengagedUCLAProfessorLindaSax,authorofthegroundbreaking2008bookThe
GenderGapinCollege:MaximizingtheDevelopmentalPotentialofWomenandMen,to
conductatwo‐phasestudyofstudentsandfacultyatwomen’scolleges.
PhaseOne,whichisthesubjectofWhoAttendsaWomen’sCollege?Identifying
UniqueCharacteristicsandPatternsofChange,1971‐2011,isaself‐assessmentthat
describesforty‐yeartrendsinthewomen’scollegepopulationbyexamininghowthe
backgrounds,characteristics,andpredispositionsofwomen’scollegeattendeeshave
shiftedoverthepastfourdecadesandhowtheseshiftscomparetowomenat
coeducationalinstitutions.

v
PhaseTwo,whichwascompletedinsummer2013,identifiesdifferencesbetween
women’sandcoeducationalcollegesinprofessors’approachestoteachingandstudent
engagement.
Whilewomenhaveoutnumberedandinsomecasesoutperformedmenon
coeducationalcollegecampusesformorethantwodecades,therearelargegapsinwhat
weknowaboutstudentsuccessbygender.ThekindofresearchtheCoalitionhas
commissionedinPhaseOnehasneverbeenundertakenbefore.
Therearemanysimilaritiesinthetrendsamongwomenatwomen’scollegesand
womenatcoeducationalinstitutions.WhoAttendsaWomen’sCollege?IdentifyingUnique
CharacteristicsandPatternsofChange,1971‐2011focusesonthosetrendsthatshow
significantdifferences.Thisreportnotonlyprovidesdatatohelpusbetterunderstand
whostudentsatwomen’scollegesareandhowtheyhavechangedovertime,butitalso
servesasafoundationandheuristicforfurtherresearchthatwillyielddatatoilluminate
thefactorsthatinfluencewomen’ssuccessincollege,helpwomen’scollegesservestudents
better,andpositionwomen’scollegesasthoughtleadersinpreparingwomenforsuccess.
WhoAttendsaWomen’sCollegerevealssomestrikingtrendsinthebackgroundsand
attitudesofwomen’scollegestudentsinsuchareasas:
Demographics
AcademicSelf‐confidenceandEngagement
CollegeChoice
FinancialAttitudesandExpectations
Educational,CareerandFamilyAspirations
LeadershipandCommunityOrientation
vi
ArtisticInclination
PsychologicalandPhysicalWell‐Being
Spirituality
ExtracurricularActivities
PoliticalandSocialViews
Itisimportanttonotethatthisreportdescribesinaggregatethepopulationof
womenwhonowattendwomen’scollegesandwhohaveattendedwomen’scollegesinthe
past.Itdoesnotreflectthevariationbetweenwomen’scollegesinthecharacteristicsof
theirstudentstoday.Thedemographicprofileofanyparticularwomen’scollegemaylook
verydifferentfromtheaggregateprofiledescribedintheresearch.
However,whiletherearesignificantinstitutionalvariationsamongwomen’s
colleges,studentsinthewomen’scollegesectoroverallareinmanywaysabellwetherfor
womeninhighereducation.ThefindingsoftheCoalition’sresearchagendawillprovidea
basisforunderstandingandultimatelyimprovingtheexperiencesofallwomenatalltypes
ofinstitutionsofhighereducation.
TheWomen’sCollegeCoalition
September,2014

vii
EXECUTIVESUMMARY
cholarshiponwomen’scollegesoftenreferencesthefactthatthese
institutionshavediminishedinnumberovertheyears.However,an
understandingofthissectorinvolvesmorethancountingthesheer
numberofinstitutions;itrequiresunderstandingwhoattendstheseinstitutionsand
whethersuchpopulationshavechangedovertime.Suchknowledgewouldenable
scholars,administratorsandotherinterestedpartiestoconsidertheroleofwomen’s
collegesinthecontemporaryhighereducationlandscape,andwouldassistthese
institutionsintheireffortstobetterservetheirstudents.Assuch,thisstudyusesnational
dataonenteringcollegestudentstoaddressthefollowingmajorquestions:
1. Howdothecharacteristicsandpredispositionsofcurrentwomen’scollege
attendeescomparewiththoseobservedamongwomenenteringcoeducational
institutions?
2. Howhavethesetraitsshiftedoverthepastfourdecadesrelativetotrends
observedforwomenatcoeducationalinstitutions?
Thisstudyrelieson“FreshmanSurvey”datacollectedoverthepastfourdecadesby
theCooperativeInstitutionalResearchProgram(CIRP),thenation’slargestandlongest‐
runningempiricalstudyofAmericanhighereducation.TheCIRP,housedatUCLA’sHigher
EducationResearchInstitute,collectsawiderangeofinformationonincomingcollege
students,includingdemographicbackgrounds;self‐confidence;collegechoice;career
aspirations;leadershipandcommunityorientation;andpsychologicalwell‐being.Since
1966,theCIRPhascollecteddataonmorethan10millionstudentsatmorethan1,600

viii
collegesanduniversities,including49thatwerewomen’scollegesin2011(theend‐point
forthisstudy).Forthisreport,weanalyzedtheresponsesof262,722femalestudentswho
enteredthese49women’scollegesbetween1971and2011.Theirresponseswere
comparedtothoseofover4.4millionwomenenteringnearly1,000historically
coeducationalinstitutionsduringthesametimeperiod.Thereportdocumentsthe
trajectoryofwomen’scollegestudentsovertimerelativetostudentsattendingpublicand
privatefour‐yearcollegesanduniversities.
KeyFindings
Demographics
o Women’scollegescurrentlyenrollamoreraciallyandethnicallydiverse
populationofstudentsthananyofthecomparisoninstitutions.Justoverhalf
ofthestudentsattendingwomen’scollegesinoursampleidentify
themselvesasWhite,followedbyoveroneinfourwhoisAfricanAmerican,
almostoneinsixwhoisChicana/Latina,andoneinninewhoisAsian
American.
o Trendsshowthatstudentsattendingwomen’scollegesintheearly1970s
camefromfamilieswiththehighestmedianincomerelativetothe
comparisongroups,butthetrendhassinceshiftedtothepointtowherenow
studentsenteringwomen’scollegeshailfromfamilieswiththelowest
incomes(about$84,000comparedtoabout$100,000ormoreatthe
coeducationalcomparisongroups).
ix
AcademicSelf‐Confidence&Engagement
o Studentsenteringwomen’scollegesareamongthemostlikelytorate
themselves“aboveaverage”or“highest10%”comparedtotheaverage
persontheirageincomputerskills(33.8%)andinintellectualself‐
confidence(55.4%).However,self‐ratingsofmathematicalandacademic
abilityarelowestamongwomenenteringwomen’scolleges,withonly33.9%
ofstudentsratingthemselvesinthesetoptwocategories.
o Womenenteringwomen’scollegesaremorelikelythanthoseatthe
coeducationalcomparisoninstitutionstoexpecttocommunicateregularly
withtheirprofessors(60.3%)ortoworkonaprofessor’sresearchproject
(41.1%).
CollegeChoice
o Whenaskedtoindicatewhytheychosetoattendtheircurrentinstitution,
thetopfivereasonsnotedas“veryimportant”forwomen’scollegeattendees
arethatthecollegehasaverygoodacademicreputation(78.4%),the
graduatesgetgoodjobs(66.8%),theywereofferedfinancialassistance
(64.2%),theywantedtoattendaschoolofthissize(58.9%),andhaving
visitedthecampus(56.8%).Thesereasonsarealsoamongthemost
frequentlycitedbystudentsfromcoeducationalinstitutions.
o Women’scollegestudentsaresignificantlymorelikelythanstudentsfrom
coeducationalcollegestochoosetheircollegebecauseofencouragement
fromhighschoolcounselors(13.2%),privatecollegecounselors(7.8%),
teachers(8.5%),andrelatives(7.4%).
x
FinancialAttitudes&Expectations
o Morethanhalf(56.4%)ofthestudentsenteringwomen’scollegesplanon
gettingajobtohelppayforcollegeexpensesandtwo‐thirds(66%)have
takenoutloans(bothfiguresaresignificantlyhigherthanatthecomparison
institutions).
Educational,CareerandFamilyAspirations
o Nearlytwo‐thirds(64.5%)ofentrantstowomen’scollegesplantoearnpost‐
baccalaureatedegrees;women’scollegeattendeesarethemostlikelyofall
groupstoplantoearnaPh.D.(27.3%).
o Themostpopularcareeraspirationsforstudentsenteringwomen’scolleges
areinmedical/healthfieldssuchasnursing(11.7%),medicine(10.2%),and
thehealthprofessions(9.5%).
CommunityOrientation
o Studentsenteringwomen’scollegesaremorelikelythanwomenattending
coeducationalcollegestovaluehelpingotherswhoareindifficulty(81.7%),
influencingsocialvalues(53.8%),helpingtopromoteracialunderstanding
(50.7%),becomingacommunityleader(45.5%),participatingina
communityactionplan(43.9%),andbecominginvolvedinprogramstoclean
uptheenvironment(33.8%).
o Theyalsoreportthehighestlevelofengaginginvolunteerworkbythetime
theyentercollege,anaverageof3.7hoursperweek.Thistrendhas
increasedfasterforstudentsenteringwomen’scollegesrelativetothe
coeducationalcomparisongroups.

xi
ArtisticInclination
o Studentsatwomen’scollegesaremorelikelythanstudentsentering
coeducationalcollegestovalueartisticgoalssuchaswritingoriginalworks
(20.6%),becomingaccomplishedinoneoftheperformingarts(20.4%),and
creatingartisticworks(19.7%).
Psychological&PhysicalWellbeing
o Comparedwithwomenattendingcoeducationalinstitutions,thosewho
enrollinwomen’scollegesaretheleastlikelytoindicatehighself‐ratingsof
theiremotionalhealth(43.0%)andphysicalhealth(40.7%),andarethe
mostlikelytoreportthattheyfrequentlyfeltoverwhelmed(42.4%)or
depressed(11.4%)intheyearpriortocollege.
o Women’scollegeattendeesarealsothemostlikelytoexpecttoseekpersonal
counselingincollege(16.3%),atrendthathasrisenovertime.
Political&SocialViews
o Women’scollegeattendeesaresignificantlymorelikelytoexpressthegoalof
wantingtoinfluencethepoliticalstructure(23.7%)andarethemostlikelyto
haveworkedinalocal,state,ornationalpoliticalcampaign(12.1%).
o Studentsenteringwomen’scollegesarealsomorelikelytosupportgun
controllaws(81.5%),taxingthewealthy(73.7%),anationalhealthcareplan
(73.8%),andgivingstudentsfromdisadvantagedsocialbackgrounds
preferentialtreatmentincollegeadmissions(46.7%).
Whilethereportshowsthatwomen’scollegesare,asagroup,onauniquetrajectory
intermsofthestudentstheyadmit,sometrendsforwomenareuniversalregardlessof

xii
whattypeofcollegetheyattend(e.g.,growingfinancialconcerns,increasingstress,and
declininglevelsofself‐reportedemotionalhealth).Nevertheless,women’scollegesmaybe
seenashavingauniqueopportunitytodemonstratehowbesttoeducateanincreasingly
diversecollegestudentpopulation. Further,theeducationalclimateatwomen’scolleges
maybenefitfromthefactthattheseinstitutionstendtoattractstudentswhoareespecially
ambitious,intellectuallycurious,creative,andsocialchange‐oriented.

xiii
ACKNOWLEDGMENTS
Thisreportwasmadepossiblebytheeffortsofseveralindividualsand
organizations.TheHigherEducationResearchInstituteatUCLAwasinstrumentalin
providingthestudentdatathatwereessentialinconductingthisresearch.Wearealso
gratefultotheWomen’sCollegeCoalition(WCC)fortheirsupportforthisstudyandthe
valuetheyplaceinunderstandingtheirstudentpopulations.Earlyleadershipfrom
MaryAnnBaenninger(formerpresidentoftheCollegeofSaintBenedict)andSusanLennon
(formerpresidentoftheWCC)helpedtogarnersupportforthisprojectandalsototackle
someoftheearlymethodologicaldecisionsthatneededtobemade.ManythankstoWCC
InterimPresidentMarilynHammond,WCCBoardChairElizabethKiss,andotherboard
members,whohaveprovideduswithongoinginsightsleadingtotheproductionofthis
report.Finally,asalways,wearegratefultothecollegesthatparticipatedinthestudyand
totheirstudents,withoutwhomsuchresearchwouldnotbepossible.

1
PARTI:INTRODUCTION
omen’scollegesholdauniqueplaceinthehistoryofwomeninthe
UnitedStates,withapurposeandpopularitythathasevolvedin
responsetochangesinwomen’ssocietalpositionandeducational
opportunities.Whatbeganinthemid‐19thcenturyasoneoftheonlyoptionsforwomen
seekingacollegeeducation,women’scollegescurrentlyenrolllessthanonepercentof
college‐goingwomen(Snyder&Dillow,2012).Injustthelastfiftyyears,thenumberof
women’scollegeshasdeclinedfrom233to51.Further,asmanyofthesurvivingwomen’s
collegesstrivetoretainenrollments,thepopulationofstudentsattendingwomen’scollege
hasbecomeincreasinglydiverseintermsofrace,class,andage(Miller‐Bernal,2012).
Uptothispoint,mostoftheresearchonstudentsattendingwomen’scollegeshas
focusedonoutcomes,andgenerallyrevealsbeneficialeffects.Forexample,women
attendingwomen’scollegeshavebeenshowntoexperiencegreatergainsincognitive
domainsincludingself‐reportedacademicandintellectualdevelopmentthanwomenat
coeducationalcolleges(Astin,1993;BaxterMagolda,1992;Kinzie,Palmer,Thomas,
Umbach&Kuh,2007).Womenattendingthesecollegesalsorankhigheronacademic
engagement(Kinzie,etal.,2007;NationalSurveyofStudentEngagement(NSSE),2003;
Smith,1990;Smith,Wolf,&Morrison,1995),intellectualself‐confidence(Kim,2002),and
self‐perceivedacademicability(Kim&Alvarez,1995)thantheirpeersatcoeducational
institutions.
Inadditiontoacademicbenefits,womenatwomen’scollegesarealsoreportedto
experienceincreasestotheirself‐esteemandleadershipabilities(Smith,Morrison,&Wolf,
1994;Astin,1977).Further,studentsatwomen’scollegeshavebeenshowntobemore
satisfiedwiththeiroverallcollegeexperience(NSSE,2003;Smith,1990)andwiththeir
interactionswithfaculty(Astin,1977;Smith,1990)thanwomenattendingcoeducational
institutions.Researchalsosuggestspotentialsocietalbenefitsofwomen’scolleges,inthat
women’scollegesfosterstudents’commitmenttoimprovingsocialconditionsintheworld

2
aroundthem,inpartbecauseofthemoresociallyconsciouspeergroupsthatareattracted
towomen’scolleges(Kim,2001).
Studieshavealsoidentifiedpost‐collegebenefitstoattendingawomen’scollege,as
graduateshavebeenshowntoearnproportionatelymoredoctoratesinnontraditional
fieldsthanfemalegraduatesofcoeducationalcolleges(Tidball,Smith,Tidball&Wolf‐
Wendel,1999). Further,women’scollegesoftentoutthenumberofalumnaewhoare
leadersofFortune1000companiesormembersofCongress(www.womenscolleges.org).
Whileresearchhasdocumentednumerousbenefitsofattendingawomen’scollege,
thereisalsoevidenceoflessfavorableoutcomes.Specifically,studentsatwomen’scolleges
havebeenshowntobelesssatisfiedwiththequalityofsociallifeontheircampuses(Astin,
1993).Additionally,alumnaefromwomen’scollegesarelesslikelytohaveparticipatedin
intramuralsportsorvarsityathletics,activitieswhichhaveimportantconsequencesfor
collegewomen’sself‐esteem,mentalhealth,andacademicsuccess(Sax,2008).
AnEvolvingPopulationatWomen’sColleges
Whilescholarlyinquiryintothe“outcomes”ofattendingawomen’scollegehas
shapedourunderstandingofwhathappenstostudentsaftertheyattendtheseinstitutions,
researchrevealsverylittleabouthowthe“inputs”towomen’scollegeshavechanged.In
otherwords,howhasthepopulationofstudentsattendingwomen’scollegesevolvedover
time,especiallyinrecentdecadeswhenthenumberofwomen’scollegeshasdeclinedso
dramatically?Howhasthispopulationchangedintermsoftheiracademicbackgrounds,
expectationsforcollege,andpersonalandprofessionalgoals?Isthereadistincttrajectory
thatcanbeidentifiedforwomen’scolleges?
Suchknowledgewouldenablescholarstoconsidertheroleofwomen’scollegesin
thecontemporaryhighereducationlandscape,andwouldassisttheseinstitutionsintheir
effortstobetterservetheirstudents.Inordertocontributetothisgapintheliterature,this
studyusesnationaldataonenteringcollegestudentstoaddressthefollowingmajor
questions:
1. Howdothecharacteristicsandpredispositionsofcurrentwomen’scollege
attendeescomparewiththoseobservedamongwomenenteringcoeducational
institutions?

3
2. Howhavethesetraitsshiftedoverthepastfourdecadesrelativetotrends
observedforwomenatcoeducationalinstitutions?

4
PARTII:RESEARCHMETHODS
hisreportusesdatafromtheCooperativeInstitutionalResearch
Program’s(CIRP)FreshmanSurvey,whichisthenation’slongest‐running
surveyofstudentsenteringAmericancollegesanduniversities. TheCIRP
ishousedwithintheHigherEducationResearchInstitute(HERI)atUCLAandhas
administeredthissurveyannuallytoincomingfirst‐yearcollegestudentsnationwidesince
1966.Eachyear,HERIinvitesallregionallyaccreditedtwo‐andfour‐yearcollegesinthe
UnitedStatestoparticipateintheFreshmanSurvey,resultinginacollectionofdataon
morethan9millionstudentsatmorethan1,500collegesanduniversitiesovermorethan
fourdecades.
TheprimarypurposeoftheCIRPFreshmanSurveyistoprovidebaselinedataon
enteringcollegestudentssothattheymaybefollowed‐upovertimeinordertoassesshow
collegecontributestostudentlearninganddevelopment. Utilizedinnumerousbooksand
hundredsofotherpublications,CIRPdatahaveplayedamajorroleinshapingour
understandingofAmerica’senteringfreshmenandtheirdevelopmentduringthecollege
years.1
TheFreshmanSurveyInstrument(seeAppendixA)iscomprehensiveanddesigned
toelicitawiderangeofbiographicanddemographicdata,aswellasinformationon
students’highschoolbackground,careerplans,educationalaspirations,financial
arrangements,highschoolactivities,andcurrentattitudes.Revisedannually,the
questionnairehasbeendevelopedinconsultationwithstudents,professionalassociations,
participatinginstitutions,governmentagencies,educationalresearchers,administrators,
policymakers,andmembersoftheCIRPAdvisoryCommittee.Thedataforthisreportwere
takenfromFreshmanSurveyscompletedbyfemalefirst‐timefull‐timecollegestudents
whoenteredfour‐yearcollegesanduniversitiesbetween1971and2011.2
1See,forexample,Astin,A.W.(1993),Pascarella&Terenzini(1991),andSax(2008).2AlthoughtheFreshmanSurveyhasbeenadministeredsince1966,dataforthetrendanalysisareavailablestartingin1971.
5
ComparisonGroups
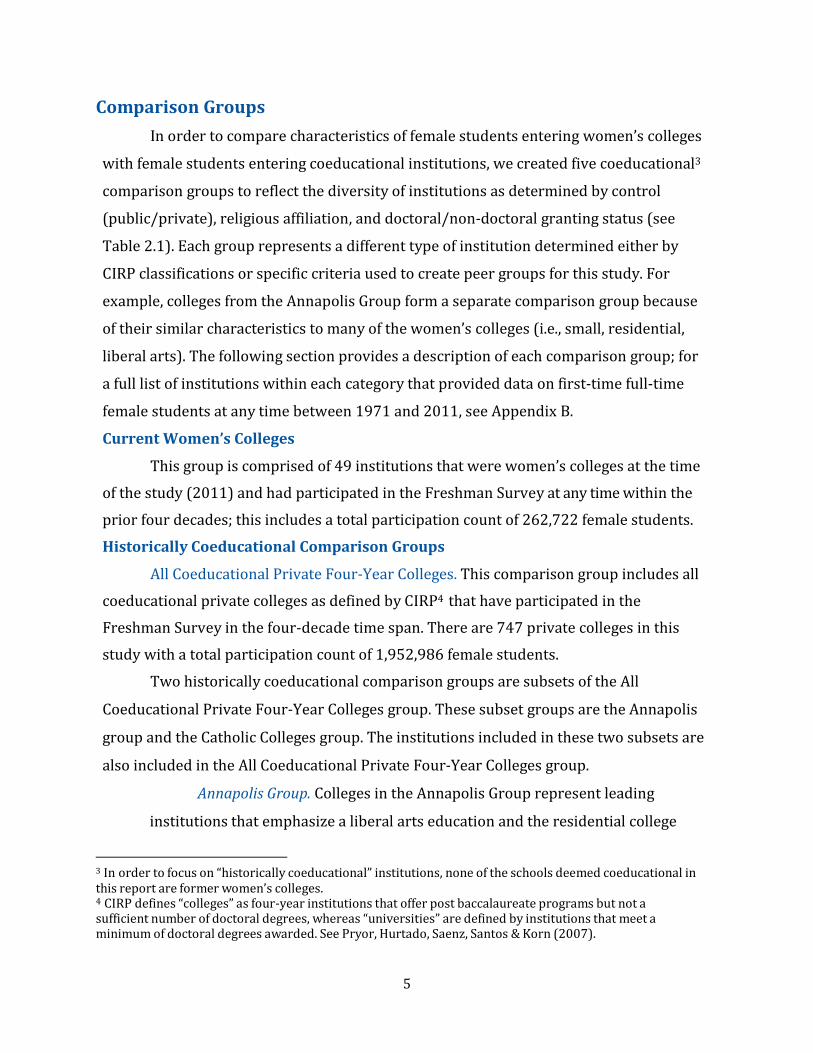
Inordertocomparecharacteristicsoffemalestudentsenteringwomen’scolleges
withfemalestudentsenteringcoeducationalinstitutions,wecreatedfivecoeducational3
comparisongroupstoreflectthediversityofinstitutionsasdeterminedbycontrol
(public/private),religiousaffiliation,anddoctoral/non‐doctoralgrantingstatus(see
Table2.1).Eachgrouprepresentsadifferenttypeofinstitutiondeterminedeitherby
CIRPclassificationsorspecificcriteriausedtocreatepeergroupsforthisstudy.For
example,collegesfromtheAnnapolisGroupformaseparatecomparisongroupbecause
oftheirsimilarcharacteristicstomanyofthewomen’scolleges(i.e.,small,residential,
liberalarts).Thefollowingsectionprovidesadescriptionofeachcomparisongroup;for
afulllistofinstitutionswithineachcategorythatprovideddataonfirst‐timefull‐time
femalestudentsatanytimebetween1971and2011,seeAppendixB.
CurrentWomen’sCollegesThisgroupiscomprisedof49institutionsthatwerewomen’scollegesatthetime
ofthestudy(2011)andhadparticipatedintheFreshmanSurveyatanytimewithinthe
priorfourdecades;thisincludesatotalparticipationcountof262,722femalestudents.
HistoricallyCoeducationalComparisonGroupsAllCoeducationalPrivateFour‐YearColleges.Thiscomparisongroupincludesall
coeducationalprivatecollegesasdefinedbyCIRP4thathaveparticipatedinthe
FreshmanSurveyinthefour‐decadetimespan.Thereare747privatecollegesinthis
studywithatotalparticipationcountof1,952,986femalestudents.
TwohistoricallycoeducationalcomparisongroupsaresubsetsoftheAll
CoeducationalPrivateFour‐YearCollegesgroup.ThesesubsetgroupsaretheAnnapolis
groupandtheCatholicCollegesgroup.Theinstitutionsincludedinthesetwosubsetsare
alsoincludedintheAllCoeducationalPrivateFour‐YearCollegesgroup.
AnnapolisGroup.CollegesintheAnnapolisGrouprepresentleading
institutionsthatemphasizealiberalartseducationandtheresidentialcollege
3Inordertofocuson“historicallycoeducational”institutions,noneoftheschoolsdeemedcoeducationalinthisreportareformerwomen’scolleges.4CIRPdefines“colleges”asfour‐yearinstitutionsthatofferpostbaccalaureateprogramsbutnotasufficientnumberofdoctoraldegrees,whereas“universities”aredefinedbyinstitutionsthatmeetaminimumofdoctoraldegreesawarded.SeePryor,Hurtado,Saenz,Santos&Korn(2007).

6
experience.5Thisgroupincludesallcoeducationalinstitutionsthatarepartofthe
AnnapolisGroupandhaveparticipatedintheFreshmanSurveybetween1971
and2011.Ofthe130AnnapolisGroupmemberinstitutions,thereare109colleges
inthiscomparisongroupwithatotalparticipationcountof638,387female
students.
CatholicColleges.Thisgroupincludesallcoeducationalinstitutionsdefined
byCIRPasCatholiccollegesthatparticipatedintheFreshmanSurveybetween
1971and2011.Thisstudyincludes144CatholicCollegeswithatotal
participationof385,206femalestudents.
PrivateUniversities.ThisgroupincludesallprivateuniversitiesasdefinedbyCIRP
thatparticipatedintheFreshmanSurveybetween1971and2011.Thereare86ofthese
institutionsinthestudywithatotalparticipationcountof816,982femalestudents.
PublicUniversities.ThisgroupincludesallpublicuniversitiesasdefinedbyCIRP
thatparticipatedintheFreshmanSurveybetween1971and2011.Thereare121ofthese
institutionsintheCIRPwithatotalparticipationcountof1,654,381femalestudents.
CategoriesforAnalysis
Atotalof162surveyitemswereidentifiedfromtheFreshmanSurveyfor
analysis.DrawingfromcategoriesdefinedinSax(2008),theseitemswereorganizedinto
12separatetopicalcategories,witheachcategorycontainingseveralsurveyitems
relatingtotherespectivetopic(mostofwhichhavebeenonthesurveyfordecades
allowingfortrendanalyses).Thesecategoriesare:Demographics(15items),Academic
Self‐ConfidenceandEngagement(22items);CollegeChoice(26items);Financial
AttitudesandExpectations(8items);Educational,CareerandFamilyAspirations(9
items);LeadershipOrientation(9items);CommunityOrientation(18items);Artistic
Inclination(5items);PsychologicalandPhysicalWell‐Being(6items);Spirituality(5
items);ExtracurricularActivities(16items);andPoliticalandSocialViews(23items).
5Seeannapolisgroup.orgformoreinformationabouttheAnnapolisGroupanditsmembercolleges.
7
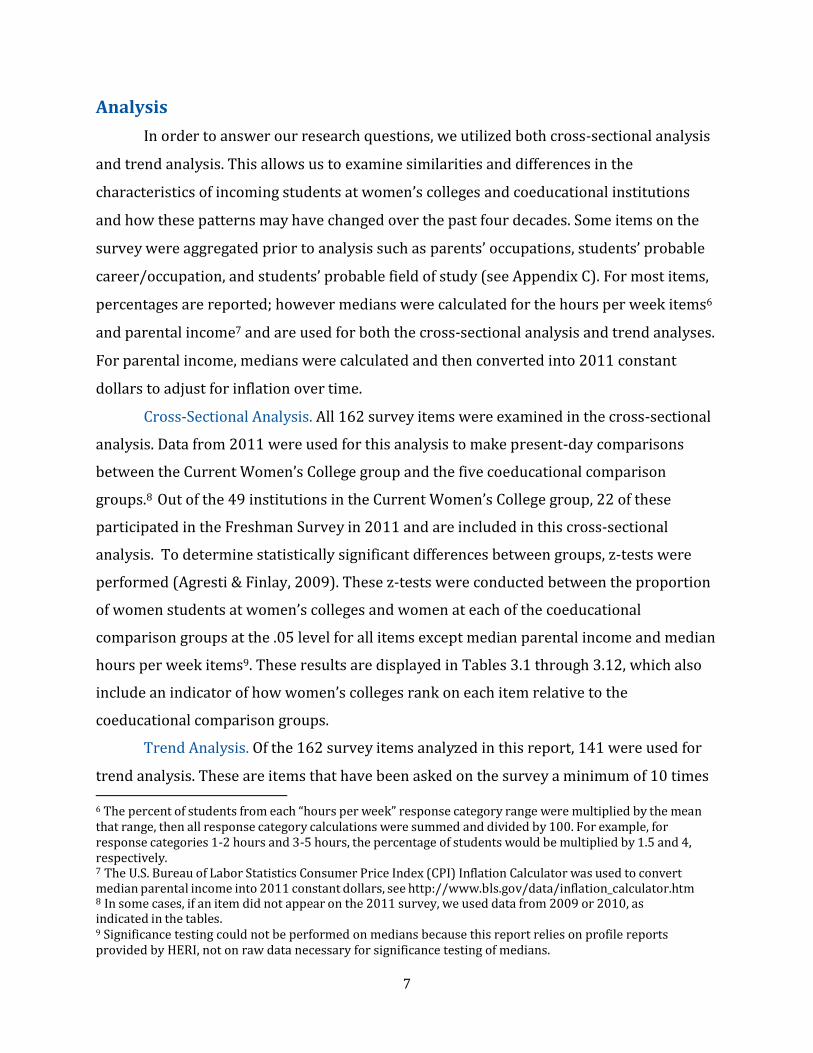
Analysis
Inordertoanswerourresearchquestions,weutilizedbothcross‐sectionalanalysis
andtrendanalysis.Thisallowsustoexaminesimilaritiesanddifferencesinthe
characteristicsofincomingstudentsatwomen’scollegesandcoeducationalinstitutions
andhowthesepatternsmayhavechangedoverthepastfourdecades.Someitemsonthe
surveywereaggregatedpriortoanalysissuchasparents’occupations,students’probable
career/occupation,andstudents’probablefieldofstudy(seeAppendixC).Formostitems,
percentagesarereported;howevermedianswerecalculatedforthehoursperweekitems6
andparentalincome7andareusedforboththecross‐sectionalanalysisandtrendanalyses.
Forparentalincome,medianswerecalculatedandthenconvertedinto2011constant
dollarstoadjustforinflationovertime.
Cross‐SectionalAnalysis.All162surveyitemswereexaminedinthecross‐sectional
analysis.Datafrom2011wereusedforthisanalysistomakepresent‐daycomparisons
betweentheCurrentWomen’sCollegegroupandthefivecoeducationalcomparison
groups.8Outofthe49institutionsintheCurrentWomen’sCollegegroup,22ofthese
participatedintheFreshmanSurveyin2011andareincludedinthiscross‐sectional
analysis.Todeterminestatisticallysignificantdifferencesbetweengroups,z‐testswere
performed(Agresti&Finlay,2009).Thesez‐testswereconductedbetweentheproportion
ofwomenstudentsatwomen’scollegesandwomenateachofthecoeducational
comparisongroupsatthe.05levelforallitemsexceptmedianparentalincomeandmedian
hoursperweekitems9.TheseresultsaredisplayedinTables3.1through3.12,whichalso
includeanindicatorofhowwomen’scollegesrankoneachitemrelativetothe
coeducationalcomparisongroups.
TrendAnalysis.Ofthe162surveyitemsanalyzedinthisreport,141wereusedfor
trendanalysis.Theseareitemsthathavebeenaskedonthesurveyaminimumof10times 6Thepercentofstudentsfromeach“hoursperweek”responsecategoryrangeweremultipliedbythemeanthatrange,thenallresponsecategorycalculationsweresummedanddividedby100.Forexample,forresponsecategories1‐2hoursand3‐5hours,thepercentageofstudentswouldbemultipliedby1.5and4,respectively.7TheU.S.BureauofLaborStatisticsConsumerPriceIndex(CPI)InflationCalculatorwasusedtoconvertmedianparentalincomeinto2011constantdollars,seehttp://www.bls.gov/data/inflation_calculator.htm8Insomecases,ifanitemdidnotappearonthe2011survey,weuseddatafrom2009or2010,asindicatedinthetables.9SignificancetestingcouldnotbeperformedonmediansbecausethisreportreliesonprofilereportsprovidedbyHERI,notonrawdatanecessaryforsignificancetestingofmedians.

8
between1971and2011,identifyinglong‐termdistinctionsbetweencurrentwomen’s
collegesandeachofthecoeducationalcomparisongroups.Trendsoneachoftheitems
fromtheWomen’sCollegegroupwerecomparedtothetrendsfromfiveother
coeducationalcomparisongroups.Itisimportanttonotethatthesampleofwomen’s
collegeschoosingtoparticipateintheFreshmanSurveyvariedfromyeartoyear;
therefore,findingsinanygivenyearmaynotpreciselyreflectthepopulationofallwomen’s
colleges.Nevertheless,thelong‐termtrendsserveasanindicatorofbroaderpatterns
observedamongstudentsattendingthesecolleges.(SeeAppendixDfortheFreshman
Surveyyearlyparticipationhistoryforthe49women’scollegesinoursample.)

9
PARTIII:COMPARINGCURRENTWOMEN’SCOLLEGESWITHHISTORICALLYCOEDUCATIONALINSTITUTIONS
hissectionfocusesondifferencesintheenteringstudentcharacteristics
betweenwomenattendingwomen’scollegesandthoseattending
historicallycoeducationalinstitutions.Thesefindingsaresummarized
acrossthefollowingcategories:Demographics,AcademicSelf‐ConfidenceandEngagement;
CollegeChoice;FinancialAttitudesandExpectations;Educational,CareerandFamily
Aspirations;LeadershipOrientation;CommunityOrientation;ArtisticOrientation;
PsychologicalandPhysicalWell‐Being;Spirituality;ExtracurricularActivities;andPolitical
andSocialViews.
Theresultsthatfollowfocusontwoprimarypointsofcomparison. Thefirstisto
examinehowacohortofcollegestudentsenteringwomen’scollegesinFall2011compares
withfemalestudentsenteringeachoffivehistoricallycoeducationalcomparisongroups:all
privatefour‐yearcolleges,collegesintheAnnapolisGroup,Catholicfour‐yearcolleges,
publicuniversitiesandprivateuniversities.Giventhelargenumberofsurveyitems,this
presentationfocusesonresultsthatareattheextremes(i.e.,2011resultsthatarehighest
orlowestforwomen’scollegesrelativetothecoeducationalcomparisongroups).Readers
canconsultthetablestoseethespecificmagnitudeofthedifferencebetweenwomen’s
collegesandeachoftheotherinstitutionaltypes.
Thesecondanalyticalapproachistoexaminemajortrendsthatarewitnessedwhen
examiningsurveytrendsbetween1971and2011.Givenspaceconsiderations,itisnot
feasibletodisplaytrendresultsforallitems,sothepresentationoftheseresultsis
selective,focusingprimarilyonlong‐termtrendsthatarenotablydifferentbetween
women’scollegesandthecomparisongroups(i.e.,thetrendlinesarenotparallel).Because
thisanalyticalapproachhighlightsareasofdifferenceinthelong‐termtrendsexperienced
bywomen’scollegesandcoeducationalinstitutions,readersshouldrememberthatforthe
largenumberoftrendsnotdiscussed,shiftsovertimetypicallyrevealsimilartrajectories
forwomen’scollegesandcoeducationalinstitutions.

10
Demographics
AsdescribedinSax(2008),thepopulationofwomenattendingcollegesand
universitiesintheUnitedStateshasbecomeincreasinglydiverseintermsofracial/ethnic
andeconomicbackgrounds,andwomenaremorelikelythanevertocomefromfamilies
whereoneorbothparentsearnedcollegedegrees.Inthissection,weexploretheextentto
whichtheseandotherdemographictrendsholdupamongthepopulationofwomen
attendingwomen’scolleges.(SeeTable3.1)
Race/ethnicity.AmongthecohortofwomenenteringcollegeinFall2011,the
women’scollegesparticipatinginourstudyattractamoreraciallyandethnicallydiverse
populationofstudentsthanthecomparisoninstitutions.Inparticular,relativeto
coeducationalcollegesanduniversities,women’scollegesenrollthegreatestproportionsof
studentsidentifyingasAfricanAmerican10(26.9percent),AmericanIndian(3.3percent),
and“other”race/ethnicity(4.6percent),andaresecondonlytopublicuniversitiesinthe
proportionofChicano/Latinostudentsenrolled(14.2percent).Women’scollegesalso
enrollasignificantlyhigherproportionofAsian/AsianAmericanstudents(11.0percent)
relativetootherfour‐yearcolleges,thoughtheAsianstudentpopulationishigheratpublic
andprivateuniversities.Women’scollegesarebyfartheleastlikelytoenrollstudentswho
identifyasWhite/Caucasian(55.4percent).
Lookingatthetrendsovertime,weseethatthedeclineintheWhite/Caucasian
populationisevidentacrossallcategoriesofinstitutions,butismorepronouncedwithin
women’scolleges(seeFigure3.1). Trendsfortwootherracial/ethnicgroupsarealso
worthhighlighting.First,theproportionofAfricanAmericansattendingwomen’scolleges
hasrisendramaticallyovertime,11atrendnotevidentinthecomparisongroups(see
Figure3.2).Second,theproportionofAsianAmericansincreasedatwomen’scolleges
duringthe1970sand1980s,butleveledoffandevendippedafterthemid‐1990s,aperiod
duringwhichAsianAmericanwomen’senrollmentgrewsubstantiallyatcoeducational
institutions,mostsignificantlyatpublicandprivateuniversities(seeFigure3.3). 10ItshouldbenotedthatinstitutionswithlargerAfricanAmericanenrollments(e.g.,HistoricallyBlackWomen’sColleges(BennettCollegeandSpelmanCollege)aswellasseveralwomen’scollegesthathavebecomeminority‐servinginstitutions)comprisedanincreasingshareofinstitutionsparticipatingintheFreshmanSurveyovertime,particularlyfrom2009to2011.11Thedipin1984reflectstheoneyearthatSpelmanCollegedidnotparticipateintheFreshmanSurvey.

11
Theracial/ethnicprofileofstudentsatwomen’scollegesisalsoreflectedinthe
diversityofthehighschoolsandneighborhoodsfromwhichthesewomencame.
Specifically,women’scollegestudentsaretheleastlikelytohailfromhighschoolsand
neighborhoodsthataremostlyorcompletelywhite,whiletheyarethemostlikelyofall
collegewomentocomefromschoolsandneighborhoodsthatareraciallydiverseor
completelynon‐White.Infact,afull29.8percentofwomen’scollegeattendeeshailfrom
neighborhoodsthataremostlyorcompletelynon‐White.
Familyincome.AsshowninTable3.1,studentsattendingwomen’scollegescome
fromfamilieswiththelowestmedianincomes(approximately$84,000,relativetoroughly
$100,000ormoreineachofthecomparisongroups,includingahighof$126,000for
womenattendingprivateuniversities).Thisrepresentsasignificantshiftsincetheearly
1970swhenwomen’scollegeattendeeshailedfromfamilieswiththehighestfamilyincome
relativetowomenfromcoeducationalinstitutions(seeFigure3.4).Thistrendforwomen’s
collegesisreflectedinadeclineinmedianfamilyincomefrom$117,340in1971(in2011
constantdollars)to$83,831in2011.12
Perhapsrelatedtodecliningfinancialresourcesamongwomen’scollegeattendees,
inthepasttwodecadesthispopulationhasbecomelesslikelytotravelgreatdistances(at
least500miles)toattendcollege(seeFigure3.5).Thispatterndepartsfromthatobserved
forwomenatcoeducationalinstitutionswho,forthemostpart,havebecomeincreasingly
likelytoattendcollegefarfromhome(especiallyatprivateuniversitiesandAnnapolis
Groupcolleges).
Parents’education.Comparedtowomenatotherinstitutions,women’scollege
attendeesarethemostlikelytoreportthattheirmothersandfathersdidnotattend
college.Inotherwords,womenatwomen’scollegesarethemostlikelyofallcollege
womentobefirst‐generationcollegestudents.Similarly,whenlookingattrendsincollege
degreeattainment,wefindaninterestingcontrastbetweenwomen’scollegesand
coeducationalinstitutions.Specifically,forcoeducationalcollegesthereisanincrease
between1971and2011intheproportionofwomenwhosefathershaveearnedcollege
12Thetrendforparentalincomeinthepastfewyears(andotherrecenttrendshighlightedinthisreport)mayreflectthechangingnatureofparticipatinginstitutions,asdescribedearlier.However,theseandothertrendsdoreflectlonger‐termtrajectoriesobservedinoursample.
12
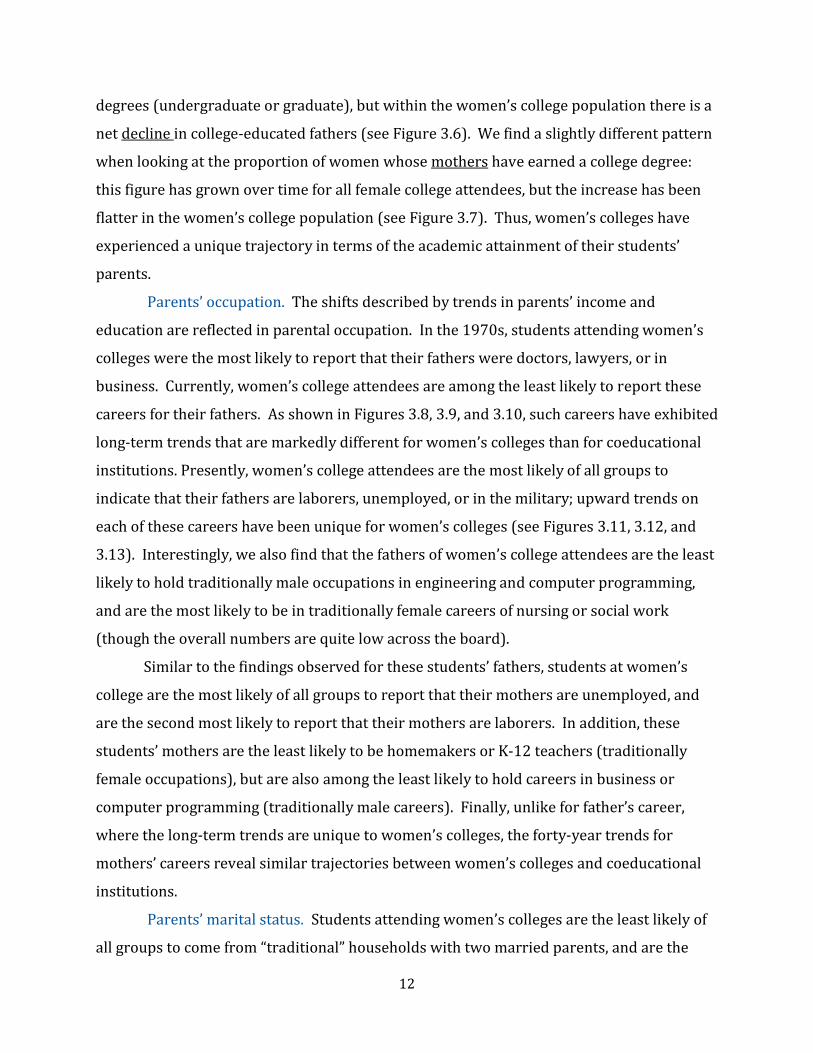
degrees(undergraduateorgraduate),butwithinthewomen’scollegepopulationthereisa
netdeclineincollege‐educatedfathers(seeFigure3.6).Wefindaslightlydifferentpattern
whenlookingattheproportionofwomenwhosemothershaveearnedacollegedegree:
thisfigurehasgrownovertimeforallfemalecollegeattendees,buttheincreasehasbeen
flatterinthewomen’scollegepopulation(seeFigure3.7).Thus,women’scollegeshave
experiencedauniquetrajectoryintermsoftheacademicattainmentoftheirstudents’
parents.
Parents’occupation.Theshiftsdescribedbytrendsinparents’incomeand
educationarereflectedinparentaloccupation.Inthe1970s,studentsattendingwomen’s
collegeswerethemostlikelytoreportthattheirfathersweredoctors,lawyers,orin
business.Currently,women’scollegeattendeesareamongtheleastlikelytoreportthese
careersfortheirfathers.AsshowninFigures3.8,3.9,and3.10,suchcareershaveexhibited
long‐termtrendsthataremarkedlydifferentforwomen’scollegesthanforcoeducational
institutions.Presently,women’scollegeattendeesarethemostlikelyofallgroupsto
indicatethattheirfathersarelaborers,unemployed,orinthemilitary;upwardtrendson
eachofthesecareershavebeenuniqueforwomen’scolleges(seeFigures3.11,3.12,and
3.13).Interestingly,wealsofindthatthefathersofwomen’scollegeattendeesaretheleast
likelytoholdtraditionallymaleoccupationsinengineeringandcomputerprogramming,
andarethemostlikelytobeintraditionallyfemalecareersofnursingorsocialwork
(thoughtheoverallnumbersarequitelowacrosstheboard).
Similartothefindingsobservedforthesestudents’fathers,studentsatwomen’s
collegearethemostlikelyofallgroupstoreportthattheirmothersareunemployed,and
arethesecondmostlikelytoreportthattheirmothersarelaborers.Inaddition,these
students’mothersaretheleastlikelytobehomemakersorK‐12teachers(traditionally
femaleoccupations),butarealsoamongtheleastlikelytoholdcareersinbusinessor
computerprogramming(traditionallymalecareers).Finally,unlikeforfather’scareer,
wherethelong‐termtrendsareuniquetowomen’scolleges,theforty‐yeartrendsfor
mothers’careersrevealsimilartrajectoriesbetweenwomen’scollegesandcoeducational
institutions.
Parents’maritalstatus. Studentsattendingwomen’scollegesaretheleastlikelyof
allgroupstocomefrom“traditional”householdswithtwomarriedparents,andarethe

13
mostlikelytoreportthattheirparentsaredivorced/separatedorthatatleastoneparentis
deceased.Further,theoveralltrendforhavingdivorcedparentshasrisenmoresharplyat
women’scollegesthanatcoeducationalinstitutions,withwomenatprivateuniversitiesthe
mostlikelytoreporttwo‐parentintactfamilies(seeFigure3.14).
AcademicSelf‐ConfidenceandEngagement
Researchoncollege‐goingwomenhasconsistentlyshownthemtohavehighlevels
ofacademicachievementandengagement,butrelativelypooreracademicself‐confidence
(Sax,2008).Hereweexplorehowwomen’sacademicself‐confidenceandengagement
variesbetweenwomen’scollegesandcoeducationalinstitutions(seeTable3.2).
Lookingatgradesearnedinhighschool,afewthemesemerge.Firstisthat
practicallyallwomenattendingwomen’scollegesreportearningatleasta“B”averagein
highschool(92.6percent),withoverhalfofwomenreporting“A”averages(includingA+,
A,andA‐grades)(52.4percent);thesefiguresareevenhigherforwomenattending
coeducationalinstitutions.Theriseinthenumberofstudentsenteringcollegewith“A”
averages,especiallyinthepasttwodecades,hasbeendescribedas“gradeinflation”
(RosovskyandHartley,2002). However,itappearsthatthisphenomenonissomewhatless
prevalentamongwomenattendingwomen’scolleges,astheyrepresenttheonlycategory
inwhichtheproportionof“A”earnershasactuallydeclinedoverthepastdecade(see
Figure3.15).Timedevotedtostudyingandhomeworkduringhighschoolisalsoonthe
declineforstudentsenteringwomen’scolleges,apatternnotobservedatother
institutionaltypes(seeFigure3.16). Relatedtothesetrendsisthat,presently,women’s
collegeattendeesarethemostlikelytoanticipateneedingtutoringfortheircollegecourses
(43.0percent).Finally,althoughmoststudentsatwomen’scollegesindicatedthatthey
frequentlyoroccasionallystudiedwithotherstudentsintheirlastyearofhighschool(89.9
percent),thisfigurewaslowestamongwomen’scollegeattendeesrelativetothosewomen
whoattendedcoeducationalcolleges.
Manyofthesetrendsarereflectedintheacademicself‐ratingsreportedbywomen
attendingwomen’scolleges. Thesurveyasksstudentstoindicatetheirabilitiesrelativeto
“theaveragepersonyourage”onavarietyoftraits. Comparedtowomenatcoeducational
institutions,women’scollegeattendeesreportthelowestlevelsofmathconfidence;only

14
33.9percentratethemselvesinthetoptwocategories(“aboveaverage”or“highest10%”)
inmathematicalability,afigurewhichisslightlyhigherintheprivatefour‐yearcomparison
groups,andsignificantlyhigheramongwomenattendingpublicandprivateuniversities.
Mathself‐ratingshavebeenonthedeclineforwomenatmostinstitutions,including
women’scolleges(seeFigure3.17).Resultsforself‐ratedacademicabilityaresubstantially
higherthanformathability,with70.1percentofwomen’scollegestudentsindicatingthat
theyareinthetoptwocategoriesinacademicability,thoughwomen’sacademicself‐
confidenceisstillhigherinmostofthecomparisoninstitutions.Further,women’scolleges
representtheonlygroupwhereincomingstudents’self‐ratingsonacademicabilityhave
generallydeclinedovertime(seeFigure3.18).Despitetheircomparativelylowacademic
andmathematicalself‐ratings,women’scollegestudentsindicatesomeofthehighest
ratingsinotherareas:theyreportthehighestlevelsofconfidenceintheircomputerskills
(33.8percentratingthemselves“aboveaverage”or“highest10%”)andthesecond‐highest
levelsofintellectualself‐confidence(55.4percent).
Thereareseveralotherpositivesignsforwomen’scolleges,especiallywhenit
comestowhattheirstudentsexpecttoexperienceincollege. Studentsattendingwomen’s
collegesarefarmorelikelythanwomenattendingcoeducationalinstitutionstobelieve
thereisa“verygoodchance”theywillcommunicateregularlywiththeirprofessors(60.3
percent)orworkonafacultyresearchproject(41.1percent;significantlyhigherthanall
comparisongroups). Further,women’scollegesaresecondonlytotheAnnapolisGroupin
theproportionofwomenwhosaytheyaregoingtocollege“tolearnaboutthingsthat
interestme”(89.1percent)or“togainageneraleducationandappreciationofideas”(81.9
percent).
CollegeChoice
TheFreshmanSurveyincludesavarietyofquestionsaboutthecollegechoice
processandthereasonswhystudentsselectedtheirparticularcollege(seeTable3.3).
Whilestudentsatalltypesofcollegesareapplyingtomorecollegesthaneverbefore,the
riseincollegeapplicationshasbeenlesssteepforwomenattendingwomen’scolleges(see
Figure3.19).Studentsatwomen’scollegesarealsotheleastlikelyofallgroupstoindicate
thattheyareattendingtheirfirstchoiceschool(56.4percent),afigurethathasdeclined
15
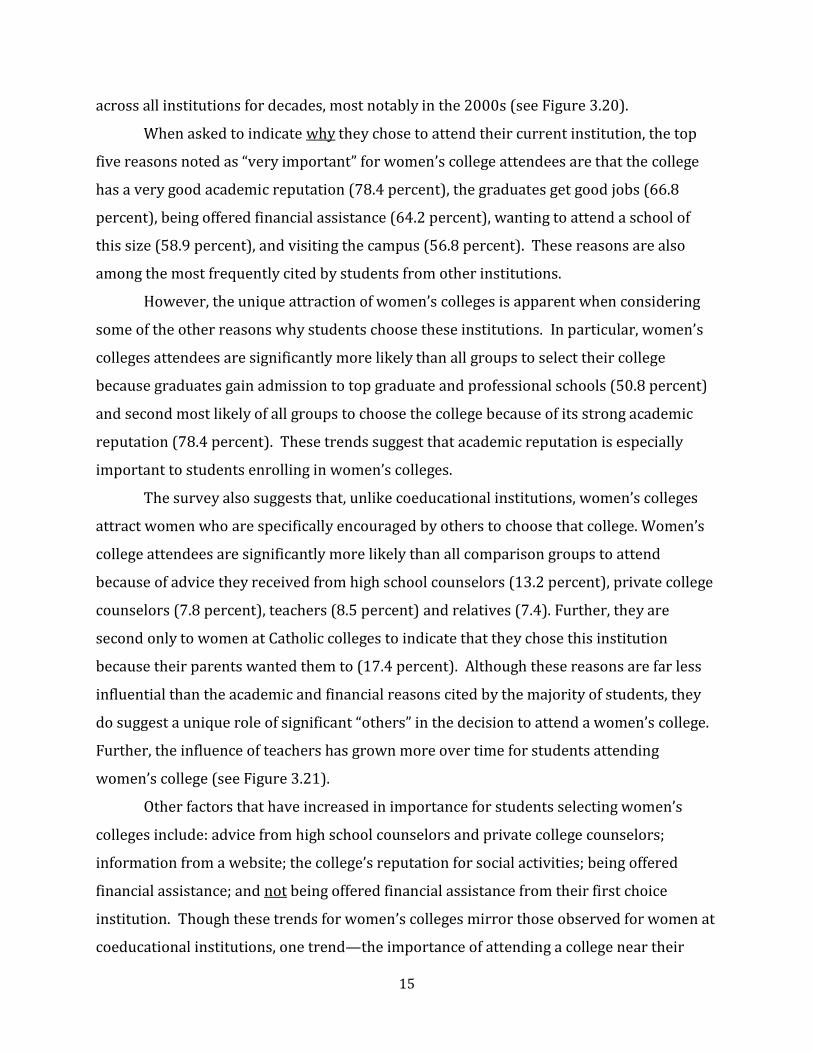
acrossallinstitutionsfordecades,mostnotablyinthe2000s(seeFigure3.20).
Whenaskedtoindicatewhytheychosetoattendtheircurrentinstitution,thetop
fivereasonsnotedas“veryimportant”forwomen’scollegeattendeesarethatthecollege
hasaverygoodacademicreputation(78.4percent),thegraduatesgetgoodjobs(66.8
percent),beingofferedfinancialassistance(64.2percent),wantingtoattendaschoolof
thissize(58.9percent),andvisitingthecampus(56.8percent).Thesereasonsarealso
amongthemostfrequentlycitedbystudentsfromotherinstitutions.
However,theuniqueattractionofwomen’scollegesisapparentwhenconsidering
someoftheotherreasonswhystudentschoosetheseinstitutions. Inparticular,women’s
collegesattendeesaresignificantlymorelikelythanallgroupstoselecttheircollege
becausegraduatesgainadmissiontotopgraduateandprofessionalschools(50.8percent)
andsecondmostlikelyofallgroupstochoosethecollegebecauseofitsstrongacademic
reputation(78.4percent).Thesetrendssuggestthatacademicreputationisespecially
importanttostudentsenrollinginwomen’scolleges.
Thesurveyalsosuggeststhat,unlikecoeducationalinstitutions,women’scolleges
attractwomenwhoarespecificallyencouragedbyotherstochoosethatcollege.Women’s
collegeattendeesaresignificantlymorelikelythanallcomparisongroupstoattend
becauseofadvicetheyreceivedfromhighschoolcounselors(13.2percent),privatecollege
counselors(7.8percent),teachers(8.5percent)andrelatives(7.4).Further,theyare
secondonlytowomenatCatholiccollegestoindicatethattheychosethisinstitution
becausetheirparentswantedthemto(17.4percent).Althoughthesereasonsarefarless
influentialthantheacademicandfinancialreasonscitedbythemajorityofstudents,they
dosuggestauniqueroleofsignificant“others”inthedecisiontoattendawomen’scollege.
Further,theinfluenceofteachershasgrownmoreovertimeforstudentsattending
women’scollege(seeFigure3.21).
Otherfactorsthathaveincreasedinimportanceforstudentsselectingwomen’s
collegesinclude:advicefromhighschoolcounselorsandprivatecollegecounselors;
informationfromawebsite;thecollege’sreputationforsocialactivities;beingoffered
financialassistance;andnotbeingofferedfinancialassistancefromtheirfirstchoice
institution. Thoughthesetrendsforwomen’scollegesmirrorthoseobservedforwomenat
coeducationalinstitutions,onetrend—theimportanceofattendingacollegeneartheir

16
home—hasgrownmostrapidlyovertimeamongstudentsattendingwomen’scolleges(see
Figure3.22). Perhapsrelatedtothisisthatstudentsatwomen’scollegesarethemost
likelyto“agreestrongly”thatthecurrenteconomicsituationsignificantlyaffectedtheir
collegechoice(24.8percent).Finally,thoughthenumbersaresmall,itmaybeimportantto
notethatstudentsattendingwomen’scollegesaresignificantlymorelikelythanallother
groupsofwomentobelievethereisaverygoodchancetheywilltransfertoanothercollege
beforegraduating(6.2percent).
FinancialAttitudesandExpectations
Asdemonstratedinthepriorsection,financialconsiderationsplayakeyrolein
women’sdecisionsaboutwheretoattendcollege.Thesignificanceofeconomicfactors
continuesaswomenentercollegeandanticipatetheirfinancialneedsalongthepathto
degreeattainment(seeTable3.4).Morethanhalfofstudentsenteringwomen’scolleges
(56.4percent)indicatethattheyplantogetajobtohelppayforcollegeexpenses,aslightly
butsignificantlyhigherlevelthaniswitnessedatthecoeducationalinstitutions(except
equaltotherateobservedatCatholiccolleges).Inaddition,thoughoverallratesarelow,
women’scollegeattendeesaresignificantlymorelikelythanallgroupstoanticipate
workingfull‐timewhileattendingcollege(7.3percent),atrendthathasrisenfasterover
timeforstudentsattendingwomen’scollegesthanforanyothergroup(seeFigure3.23).
Giventhesepatterns,perhapsitisnotsurprisingthatthewomen’scollegesampleis
significantlymorelikelytohavetakenoutloans(66percent)andtoindicate“major”
concernsaboutwhethertheywillhaveenoughfundstocompletecollege(17.8percent).
Further,whilethetrendonfinancialconcernhasfluctuatedovertimecommensuratewith
shiftsintheeconomy,ratesoffinancialconcernhavebeensignificantlyhigheratwomen’s
collegesforoveradecade(seeFigure3.24).
Whenitcomestolonger‐termfinancialgoals,themajorityofwomen’scollege
attendeesindicatethatbeingverywell‐offfinanciallyisaveryimportantoressentiallife
goal(77.4percent),afindingconsistentwithwomenacrossmostinstitutions.Further,
women’scollegeattendeesarethemostlikelyofallgroupstoindicateastrongdesireto
becomesuccessfulintheirownbusiness(40.7percent).
17
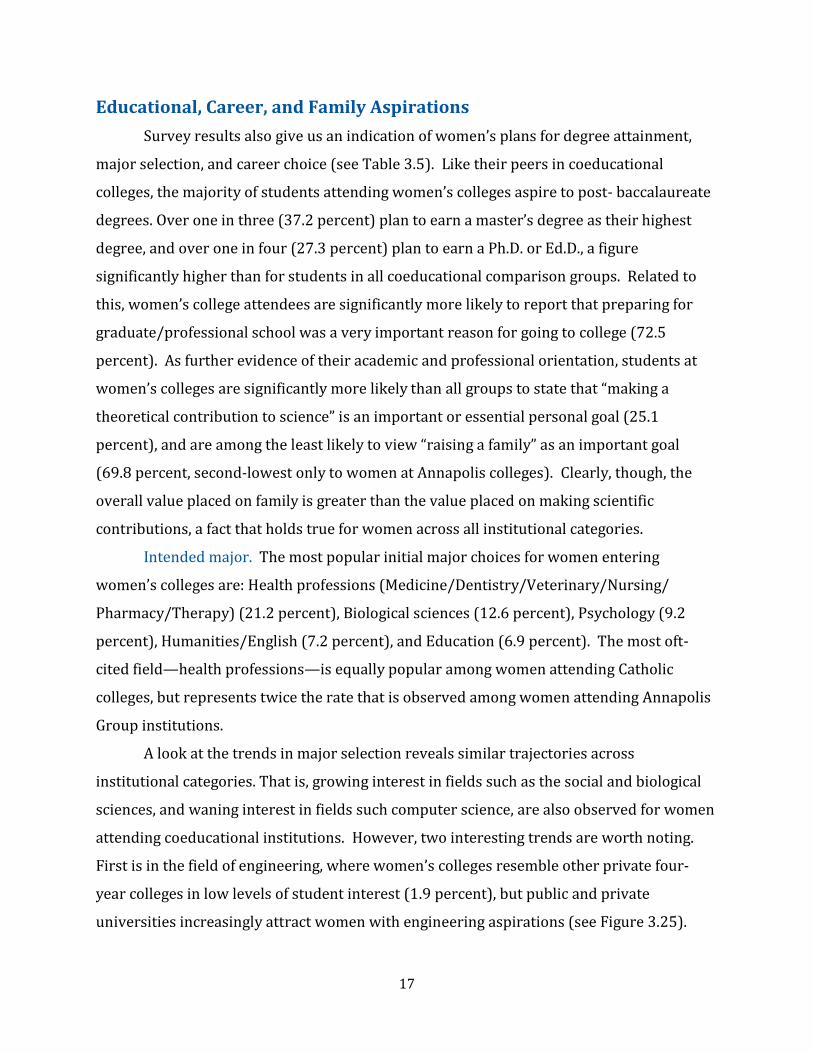
Educational,Career,andFamilyAspirations
Surveyresultsalsogiveusanindicationofwomen’splansfordegreeattainment,
majorselection,andcareerchoice(seeTable3.5).Liketheirpeersincoeducational
colleges,themajorityofstudentsattendingwomen’scollegesaspiretopost‐baccalaureate
degrees.Overoneinthree(37.2percent)plantoearnamaster’sdegreeastheirhighest
degree,andoveroneinfour(27.3percent)plantoearnaPh.D.orEd.D.,afigure
significantlyhigherthanforstudentsinallcoeducationalcomparisongroups.Relatedto
this,women’scollegeattendeesaresignificantlymorelikelytoreportthatpreparingfor
graduate/professionalschoolwasaveryimportantreasonforgoingtocollege(72.5
percent).Asfurtherevidenceoftheiracademicandprofessionalorientation,studentsat
women’scollegesaresignificantlymorelikelythanallgroupstostatethat“makinga
theoreticalcontributiontoscience”isanimportantoressentialpersonalgoal(25.1
percent),andareamongtheleastlikelytoview“raisingafamily”asanimportantgoal
(69.8percent,second‐lowestonlytowomenatAnnapoliscolleges). Clearly,though,the
overallvalueplacedonfamilyisgreaterthanthevalueplacedonmakingscientific
contributions,afactthatholdstrueforwomenacrossallinstitutionalcategories.
Intendedmajor.Themostpopularinitialmajorchoicesforwomenentering
women’scollegesare:Healthprofessions(Medicine/Dentistry/Veterinary/Nursing/
Pharmacy/Therapy)(21.2percent),Biologicalsciences(12.6percent),Psychology(9.2
percent),Humanities/English(7.2percent),andEducation(6.9percent).Themostoft‐
citedfield—healthprofessions—isequallypopularamongwomenattendingCatholic
colleges,butrepresentstwicetheratethatisobservedamongwomenattendingAnnapolis
Groupinstitutions.
Alookatthetrendsinmajorselectionrevealssimilartrajectoriesacross
institutionalcategories.Thatis,growinginterestinfieldssuchasthesocialandbiological
sciences,andwaninginterestinfieldssuchcomputerscience,arealsoobservedforwomen
attendingcoeducationalinstitutions. However,twointerestingtrendsareworthnoting.
Firstisinthefieldofengineering,wherewomen’scollegesresembleotherprivatefour‐
yearcollegesinlowlevelsofstudentinterest(1.9percent),butpublicandprivate
universitiesincreasinglyattractwomenwithengineeringaspirations(seeFigure3.25).
18
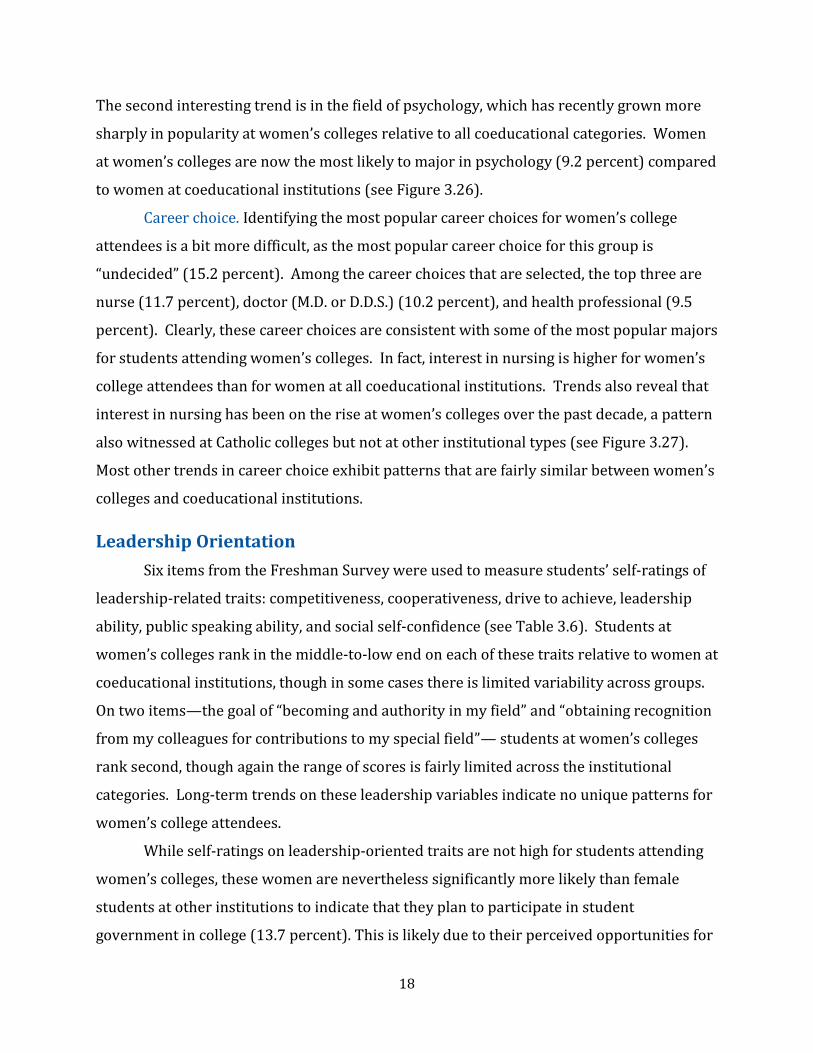
Thesecondinterestingtrendisinthefieldofpsychology,whichhasrecentlygrownmore
sharplyinpopularityatwomen’scollegesrelativetoallcoeducationalcategories.Women
atwomen’scollegesarenowthemostlikelytomajorinpsychology(9.2percent)compared
towomenatcoeducationalinstitutions(seeFigure3.26).
Careerchoice.Identifyingthemostpopularcareerchoicesforwomen’scollege
attendeesisabitmoredifficult,asthemostpopularcareerchoiceforthisgroupis
“undecided”(15.2percent).Amongthecareerchoicesthatareselected,thetopthreeare
nurse(11.7percent),doctor(M.D.orD.D.S.)(10.2percent),andhealthprofessional(9.5
percent).Clearly,thesecareerchoicesareconsistentwithsomeofthemostpopularmajors
forstudentsattendingwomen’scolleges.Infact,interestinnursingishigherforwomen’s
collegeattendeesthanforwomenatallcoeducationalinstitutions. Trendsalsorevealthat
interestinnursinghasbeenontheriseatwomen’scollegesoverthepastdecade,apattern
alsowitnessedatCatholiccollegesbutnotatotherinstitutionaltypes(seeFigure3.27).
Mostothertrendsincareerchoiceexhibitpatternsthatarefairlysimilarbetweenwomen’s
collegesandcoeducationalinstitutions.
LeadershipOrientation
SixitemsfromtheFreshmanSurveywereusedtomeasurestudents’self‐ratingsof
leadership‐relatedtraits:competitiveness,cooperativeness,drivetoachieve,leadership
ability,publicspeakingability,andsocialself‐confidence(seeTable3.6).Studentsat
women’scollegesrankinthemiddle‐to‐lowendoneachofthesetraitsrelativetowomenat
coeducationalinstitutions,thoughinsomecasesthereislimitedvariabilityacrossgroups.
Ontwoitems—thegoalof“becomingandauthorityinmyfield”and“obtainingrecognition
frommycolleaguesforcontributionstomyspecialfield”—studentsatwomen’scolleges
ranksecond,thoughagaintherangeofscoresisfairlylimitedacrosstheinstitutional
categories.Long‐termtrendsontheseleadershipvariablesindicatenouniquepatternsfor
women’scollegeattendees.
Whileself‐ratingsonleadership‐orientedtraitsarenothighforstudentsattending
women’scolleges,thesewomenareneverthelesssignificantlymorelikelythanfemale
studentsatotherinstitutionstoindicatethattheyplantoparticipateinstudent
governmentincollege(13.7percent).Thisislikelyduetotheirperceivedopportunitiesfor

19
leadershipatawomen’scollege.
CommunityOrientation
Severalitemsonthesurveyassessstudents’commitmenttoimprovingcommunities
andhelpingothersinneed(seeTable3.7).Studentsattendingwomen’scollegesrankfirst
onthemajorityofquestionsinthiscategory.Specifically,whencomparedtowomen
attendingcoeducationalinstitutions,women’scollegeattendeesarethemostlikelyto
indicatethatthefollowinggoalsare“veryimportant”or“essential”tothem:helpingothers
indifficulty(81.7percent),influencingsocialvalues(53.8percent),helpingtopromote
racialunderstanding(50.7percent),becomingacommunityleader(45.5percent),
participatinginacommunityactionprogram(43.9percent),andbecominginvolvedin
programstocleanuptheenvironment(33.8percent).Women’scollegeattendeesalso
reportthehighestlevelsofvolunteerworkpriortoenteringcollege(3.7medianhoursper
week),andaresignificantlymorelikelythanallgroupstoanticipateparticipatingin
studentprotestsanddemonstrationswhileincollege(13.6percent).
Long‐termtrendsrevealthatthetrajectoryformostoftheseitemshasbeensimilar
forwomen’scollegesandcoeducationalinstitutions,butthatsomeaspectsofcommunity
orientationrevealagrowingsalienceamongstudentsatwomen’scolleges.Inparticular,
women’scollegeshaveincreasinglydistinguishedthemselvesfromcoeducational
institutionsinenrollingstudentswhoarestronglycommittedtopromotingracial
understandingandinfluencingsocialvalues(seeFigures3.28and3.29).Inaddition,the
timestudentsspendperformingvolunteerworkintheyearpriortocollegehasgrown
fasterforstudentsenrollinginwomen’scollegethanatcoeducationalinstitutions,
particularlyinrecentyears(seeFigure3.30).
ArtisticInclination
Aswithcommunityorientation,studentsattendingwomen’scollegesdistinguish
themselvesintermsoftheirartisticinclination(seeTable3.8). Theyaresignificantlymore
likelythanstudentsinthecoeducationalcomparisongroupstorankthefollowinggoalsas
“veryimportant”or“essential”:writingoriginalworks(20.6percent),becoming
accomplishedinoneoftheperformingarts(20.4percent),andcreatingartisticworks(19.7

20
percent).Further,“aboveaverage”or“highest10%”ratingsoncreativity(58.6percent)
andartisticability(34.5percent)aresecond‐highestamongwomen’scollegeattendees
relativetoothergroups.
Interestingly,whileartisticinclinationsaretypicallythehighestatwomen’s
colleges,inrecentyearstherehasbeenanotabledeclineinartisticinterestsamong
studentsacrossallinstitutionalcategories,mostnoticeablyatwomen’scolleges.For
example,interestinwritingoriginalworksandbecomingaccomplishedintheperforming
artshaswanedinrecentyears,withsharperdeclinesobservedamongthoseentering
women’scolleges(seeFigures3.31and3.32).
PsychologicalandPhysicalWell‐Being
Oneofthemostsignificantandtroublingthemestoemergefromthedataisa
patternoflowpsychologicalandphysicalhealthreportedbywomenattendingwomen’s
colleges(seeTable3.9).Comparedwithwomenattendingcoeducationalinstitutions,those
whoenrollinwomen’scollegesaresignificantlylesslikelytoindicate“aboveaverage”or
“highest10%”self‐ratingsoftheiremotionalhealth(43.0percent)andphysicalhealth
(40.7percent),andaremorelikelytoreportthattheyfrequentlyfeltoverwhelmed(42.4
percent)ordepressed(11.4percent)intheyearpriortocollege.Giventhis,perhapsitis
notsurprisingthatwomenenteringwomen’scollegesarethemostlikelytoanticipate
seekingpersonalcounselingincollege(16.3percent).
Trendsovertimereveallong‐termdeclinesinratingsofemotionalhealthand
increasesinfeelingoverwhelmedforstudentsatallinstitutionaltypes,patternsthatare
fairlysimilarbetweenwomen’scollegesandcoeducationalcolleges. However,sometrends
revealdistinctivepatternsforwomen’scolleges:ratesofself‐reporteddepressionthat
remainconsistentlyhigherthanforwomenatcoeducationalschools(evenifoverallrates
aredownovertime)(seeFigure3.33),andasubstantiallysharperincreaseinthe
anticipatedneedforpersonalcounselingincollege(seeFigure3.34).
Spirituality
Whenitcomestoreligiouspreference,studentsattendingwomen’scollegesare
mostlikelytoidentifythemselvesasProtestant/Christian(45.6percent),followedby

21
RomanCatholic(23.3percent),None(21.7percent),andJewish(2.3percent).An
additional7.1percentofwomen’scollegeattendeesidentifytheirreligiouspreferencein
othercategoriesnotrepresentedbytheabovegroups.Women’scollegesareamongthe
leastlikelytoenrollstudentswhoidentifyasRomanCatholic(withsmallerpercentages
reportedonlyatAnnapolisGroupcolleges)orJewish(withsmallerpercentagesreported
onlyatCatholiccolleges).Long‐termtrendsinreligiousidentificationarefairlysimilar
betweenwomen’scollegesandcoeducationalinstitutions.
Questionsregardingreligiousandspiritualengagementrevealpatternsthat
distinguishwomenattendingwomen’scollegesfromthoseatcoeducationalinstitutions
(seeTable3.10).Studentsenteringwomen’scollegesaresignificantlymorelikelythan
womenatthecomparisoninstitutionstoratetheirspiritualityas“aboveaverage”or
“highest10%”(43.7percent),andarethemostlikelytohavediscussedreligionfrequently
inthepastyear(38.8percent).Further,theyarenearlytiedwithwomenatAnnapolis
institutionsintheimportancetheyascribetodevelopingameaningfulphilosophyoflife
(considered“veryimportant”or“essential”by54.2percentofwomenatwomen’s
colleges).TheyarealsosecondonlytowomenatCatholiccollegesinreportingthatthey
attendedreligiousservicesinthepastyear(78.5percent).Thus,ratesofreligiousand
spiritualinvolvementareonthehighsideforwomenenteringwomen’scolleges,however
trendsovertimedonotrevealanydistinctivepatternsforthissector.
ExtracurricularActivities
Thesurveyasksanumberofquestionsrelatedtostudents’extracurricularactivities
(someofwhichhavealreadybeenreported,suchasvolunteerworkandreligious
attendance).AssummarizedinTable3.11,thissectionreportsonacollectionofother
activitiesthatreflectthebehaviorsofwomenintheyearpriortoenteringcollege—
patternsofbehaviorwhichareshowntopersistintothecollegeyears(Sax,2008).
Comparedwithwomenenteringcoeducationalinstitutions,thoseenteringwomen’s
collegesreportthehighestmedianhoursperweekutilizingonlinesocialnetworks(5.4
hoursperweek),watchingtelevision(4.1hoursperweek),readingforpleasure(3.1hours
perweek),andplayingvideo/computergames(approximately1hourperweek).However,
theyaretheleastlikelytohavespenttimesocializingwithfriends(8.8hoursperweek)

22
andexercisingorplayingsports(6.3hoursperweek).Thus,eventhoughthewomen’s
collegepopulationreportsspendingmoretimesocializingandexercisingthantheydoon
themoreisolatingactivities,thepatternsheresuggestthattheyengageintheseactivitiesat
differentratesthantheircoeducationalpeers.Similarly,women’scollegeattendeesare
significantlylesslikelythanotherwomentoindicatethattheydrankwine/liquor(34.9
percent)orbeer(21percent)intheyearpriortocollege.Also,relatedtotheirlowratesof
exerciseandsports,studentsenteringwomen’scollegesaresignificantlylesslikelyto
indicatethattheyexpecttoplayclub,intramuralorrecreationalsportsincollege(23.2
percent).
Long‐termtrendsinextracurricularinvolvementarefairlysimilarbetween
women’scollegesandcoeducationalcolleges,withonenotableexception.Thatis,thetime
devotedtosportsandexercisehasincreasedovertimeforwomenacrossallcoeducational
institutions,buthasremainedsteady(andlowerthanallothergroups)forwomen
attendingwomen’scolleges(seeFigure3.35).
PoliticalandSocialViews
TheFreshmanSurveyasksanumberofquestionsthatshedlightonthepolitical
orientationsandattitudesofenteringcollegestudents(seeTable3.12).Lookingfirstat
self‐identifiedpoliticalleanings,wefindthatwomen’scollegeattendeesleanideologically
moretotheleftthantheright. Afull42.7percentofthemreporttheirpoliticalorientation
as“farleft”or“liberal,”comparedtoonly16.6percentwhoidentifyas“conservative”or
“farright.” Theremainingstudents(40.7percent)identifythemselvesas“middle‐of‐the‐
road.”Thismiddle‐leftleaningpatternisapparentacrossthecoeducationalgroupsaswell.
Relativetowomenatcoeducationalinstitutions,women’scollegeattendeesshow
relativelyhighlevelsofpoliticalengagement.Theyaresignificantlymorelikelythanall
groupstoindicatethatinfluencingthepoliticalstructureisa“veryimportant”or
“essential”personalgoal(23.7percent)andarethemostlikelytohaveworkedinalocal,
state,ornationalpoliticalcampaign(12.1percent).
Attitudesonpoliticalandsocialissuesindicateaprogressivemindsetthatis
especiallystrongamongstudentsattendingwomen’scollege.Comparedwithwomenfrom
thecoeducationalcomparisongroups,women’scollegeattendeesaresignificantlymore
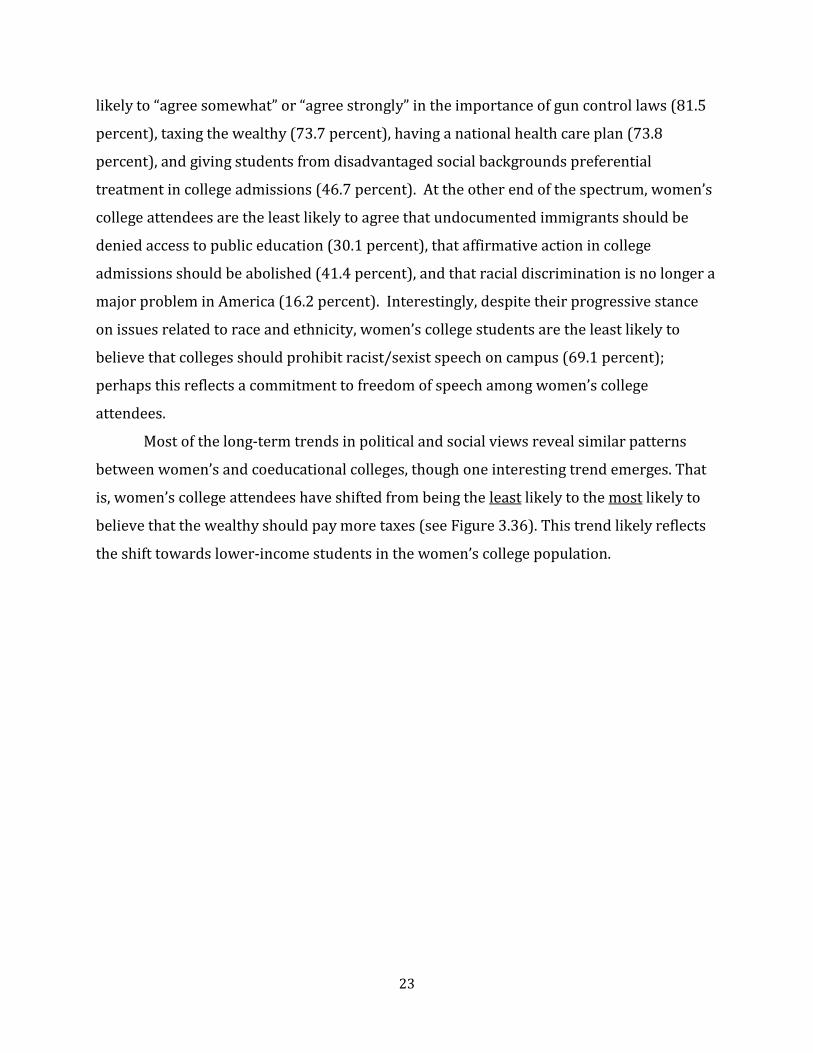
23
likelyto“agreesomewhat”or“agreestrongly”intheimportanceofguncontrollaws(81.5
percent),taxingthewealthy(73.7percent),havinganationalhealthcareplan(73.8
percent),andgivingstudentsfromdisadvantagedsocialbackgroundspreferential
treatmentincollegeadmissions(46.7percent).Attheotherendofthespectrum,women’s
collegeattendeesaretheleastlikelytoagreethatundocumentedimmigrantsshouldbe
deniedaccesstopubliceducation(30.1percent),thataffirmativeactionincollege
admissionsshouldbeabolished(41.4percent),andthatracialdiscriminationisnolongera
majorprobleminAmerica(16.2percent).Interestingly,despitetheirprogressivestance
onissuesrelatedtoraceandethnicity,women’scollegestudentsaretheleastlikelyto
believethatcollegesshouldprohibitracist/sexistspeechoncampus(69.1percent);
perhapsthisreflectsacommitmenttofreedomofspeechamongwomen’scollege
attendees.
Mostofthelong‐termtrendsinpoliticalandsocialviewsrevealsimilarpatterns
betweenwomen’sandcoeducationalcolleges,thoughoneinterestingtrendemerges.That
is,women’scollegeattendeeshaveshiftedfrombeingtheleastlikelytothemostlikelyto
believethatthewealthyshouldpaymoretaxes(seeFigure3.36).Thistrendlikelyreflects
theshifttowardslower‐incomestudentsinthewomen’scollegepopulation.

24
SUMMARYOFKEYFINDINGSANDQUESTIONSFORCONSIDERATION
hisreportreviewstheincomingcharacteristicsofwomenattending
women’scollegesandthoseattendingcoeducationalinstitutions.Across
allcategoriesexamined,notabledifferenceswerefound betweentheFall
2011enteringcohortofstudentsatwomen’scollegerelativetotheircoeducationalpeers.
Insomecaseswealsofindthatthetrajectoryonaparticularsurveyquestionisuniquefor
studentsatwomen’scolleges,suchthatshiftsovertimeinthecharacteristicsofwomen
attendingtheseinstitutionsaremoreorlesspronouncedthanshiftsoccurringamongthe
populationofwomenenteringcoeducationalinstitutions.Belowaresomeofthemajor
findings,eachfollowedbyalistofquestionsthatthewomen’scollegesmaywishto
consider.Women’scollegesattractanincreasinglydiverseandfinanciallydisadvantagedstudent
population.
Questionswomen’scollegesmaywishtoconsider:Whatarethemostsuccessful
recruitmentstrategiesforattractingadiversepopulationofstudents?Towhatextentdo
ourmarketingmaterialsreflectthischangingpopulation?Howawareareweaboutour
students’financialchallenges,needforemploymentandfinancialaid,andongoingfamily
responsibilities?Whatprogramsandservicesarecurrentlyinplacetoaddresstheunique
culturalandfinancialneedsofourstudents?Women’scollegesincreasinglyattractstudentswithloweracademicconfidence,including
manywhoanticipateneedingacademicsupport.
Questionswomen’scollegesmaywishtoconsider:Howsuccessfulisorientationand
advisingathelpingnewstudentsadjusttoourinstitutions’academicdemands?What
processesarecurrentlyinplacetoidentifyandassiststudentswhomaybenefitfrom
academicsupportservices?Howawareareourfacultyofthechangingacademic
backgroundsofourstudents?

25
Studentsatwomen’scollegeshavestrongintellectualorientations,areattractedtotheir
college’sacademicreputation,andhavehighexpectationsfortheirengagementwithfaculty.
Questionswomen’scollegesmaywishtoconsider:Arewemeetingtheneedsofall
studentswhoenterourcollegeswithhighlevelsofintellectualcuriosityandanexpectation
toengagewiththeirfacultyinofficehoursandthroughresearchprojects?Whatstrategies
doweusetofurtherstimulatestudents’intellectualcuriosity?Highschoolteachersandcounselors,aswellasmembersofthestudent’sfamily,playaunique
roleinencouragingwomentochooseawomen’scollege.
Questions women’s colleges may wish to consider: What strategies are used to
marketwomen’scollegestofamiliesandhighschoolpersonnel?Whatperceptionsdothese
individualshaveofwomen’scolleges,andhowaccuratearethey?Nursingandotherhealthprofessionsareincreasinglypopularcareerchoicesforwomen’s
collegeattendees.
Questionswomen’scollegesmaywishtoconsider:Isthisadirectionthatour
collegeshavetakenintentionallyorinresponsetochangingstudentinterests?How
successfulareournursing,pre‐medandotherhealth‐relatedprograms?Doourgraduates
pursuecareersand/orgraduatedegreesinthesefields?Women’scollegesattractstudentswhocaredeeplyaboutimprovingtheworldaroundthem.
Questionswomen’scollegesmaywishtoconsider:Towhatextentarewemeeting
theneedsofstudentswhoaremotivatedforcivicengagementandotheraltruistic
activities?Howwellarewereachingouttostudentswhoarelesscommunity‐oriented?
Doesourcurriculumcapitalizeonstudents’communityandglobalinterestsinawaythatis
integrativeandthatfostersself‐reflection?Studentsatwomen’scollegeshaveuniqueneedsregardinghealthandwell‐being.
Questionswomen’scollegesmaywishtoconsider:Howwell‐equippedisour
institutiontoservetheneedsofwomenwhoexperiencestress,self‐doubtandother
psychologicalconcernsastheyarriveatcollege?Giventhepositiveconnectionbetween

26
exerciseandemotionalhealth,whatcanourinstitutiondotopromotegreaterinvolvement
ofourstudentsinsportsandexercise,andlesstimeengaginginmoreisolatingand/or
sedentarybehaviors?Studentsattendingwomen’sremainsomeofthemostartisticandspiritualwomenincollege.
Questionswomen’scollegesmaywishtoconsider:Whatisitaboutourinstitutions
thatattractsmorespiritualandartisticwomen?Doourprogramsandservicessatisfythe
artisticandspiritualneedsofthesestudents?

27
CONCLUSION
hisreporthighlightsthecurrentcharacteristicsofwomenattending
women’scollegesandrevealswhethertheseinstitutionsare,asagroup,
onauniquetrajectoryintermsofthestudentstheyadmit.Thoughsome
trendsforwomenareuniversalregardlessofwhattypeofcollegetheyattend(e.g.,growing
financialconcerns,increasingstress,anddeclininglevelsofself‐reportedemotional
health),thewomen’scollegesinourstudyfacecertainuniquechallengesintermsofthe
compositionofthestudentstheyenroll,mostnotablythosewhoarelow‐income,first‐
generationcollegestudents. Theseare,infact,thefastest‐growingsegmentsofthecollege‐
goingpopulationacrossallinstitutions;thetrendissimplymorepronouncedatwomen’s
colleges. Thus,women’scollegesmaybeseenashavingauniqueopportunityto
demonstratehowbesttoeducateanincreasinglydiversecollegestudentpopulation.
Further,theeducationalclimateatwomen’scollegesmaybenefitfromthefactthatthese
institutionstendtoattractstudentswhoareespeciallyambitious,intellectuallycurious,
creative,andsocialchange‐oriented.
Finally,itisimportanttorememberthatwomen’scollegesarenothomogenous;
rather,thereisgreatdiversityamongtheseinstitutions,especiallyintermsoftheirhistory,
missionandresources.Itisimportantforindividualcollegestoassessthevalidityofthese
trendsforstudentsontheirowncampus.

28
REFERENCESAgresti,A.&Finlay,B.(2009).Statisticalmethodsforthesocialsciences(4thed).Upper
SaddleRiver,NJ:PrenticeHall.Astin,A.W.(1977).Fourcriticalyears:Effectsofcollegeonbeliefs,attitudes,andknowledge.
SanFrancisco:Jossey‐Bass.Astin,A.(1993).Whatmattersincollege:Fourcriticalyearsrevisited.SanFrancisco:Jossey‐
Bass.Kim,M.(2001).Institutionaleffectivenessofwomen‐onlycolleges:Cultivatingstudents'
desiretoinfluencesocialconditions.JournalofHigherEducation,72(3),287‐321.Kim,M.(2002).Cultivatingintellectualdevelopment:Comparingwomen‐onlycollegesand
coeducationalcollegesforeducationaleffectiveness.ResearchinHigherEducation,43(4),447‐481.
Kim,M.,M.&Alvarez,R.(1995). Women‐onlycolleges: Someunanticipatedconsequences.
JournalofHigherEducation,66,641‐648.Kinzie,J.,Thomas,A.D.,Palmer,M.M.,Umbach,P.D.&Kuh,G.D.(2007).Womenstudents
atcoeducationalandwomen’scolleges:Howdotheirexperiencescompare?JournalofCollegeStudentDevelopment,48(2),145‐165.
Miller‐Bernal,L.(2012).TheRoleofWomen’sCollegesintheTwenty‐FirstCentury.
DiversityinAmericanHigherEducation:TowardaMoreComprehensiveApproach,221.
NationalSurveyofStudentEngagement(2003).Convertingdataintoaction:Expandingthe
boundariesofinstitutionalimprovement.Bloomington,IN:IndianaUniversityCenterforPostsecondaryResearch.JournalofEducation,76(1),5‐30.
Pascarella,E.T.andTerenzini,P.T.(1991).HowCollegeAffectsStudents.SanFrancisco:
Jossey‐BassPryor,J.H.,Hurtado,S.,Saenz,V.B.,Santos,J.L.,andKorn,W.S.(2007).TheAmerican
Freshman:FortyYearTrends,1966‐2006.LosAngeles,CA:HigherEducationResearchInstitute.
Rosovsky,H.&Hartley,M.(2002).Evaluationandtheacademy:Arewedoingtheright
Thing?Gradeinflationandlettersofrecommendation.Cambridge,MA:AmericanAcademyofArtsandSciences.

29
Sax,L.J. (2008).TheGenderGapinCollege:MaximizingtheDevelopmentalPotentialofWomenandMen.SanFrancisco:Jossey‐Bass.
Smith,D.G.(1990).Women’scollegesandcoedcolleges:Isthereadifferenceforwomen?
JournalofHigherEducation,61,181‐197.Smith,D.G.,Morrison,D.E.&Wolf,L.B.(1994).Collegeasagenderedexperience.Journal
ofHigherEducation,65(6),696‐725.Smith,D.G.,Wolf,L.B.,&Morrison,D.E.(1995).Pathstosuccess:Factorsrelatedtothe
impactofwomen’scolleges.JournalofHigherEducation,66,245‐266.Snyder,T.D.,&Dillow,S.A.(2012).DigestofEducationStatistics,2011(NCES2012‐001).
NationalCenterforEducationStatistics,InstituteofEducationSciences,U.S.DepartmentofEducation.Washington,DC.
Solomon,B.M.(1985).IntheCompanyofEducatedWomen.NewHaven:YaleUniversity
Press.Tidball,M.E.,Smith,D.G.,Tidball,C.S.,&Wolf‐Wendel,L.E.(1999).Takingwomen
seriously:Lessonsandlegaciesforeducatingthemajority.Phoenix,AZ:TheAmericanCounselonEducationandOryxPress.
U.S. Department of Education, National Center for Education Statistics, Integrated
Postsecondary Education Data System (IPEDS). (Spring 2011) Enrollmentcomponent;(Fall2010)Completionscomponent.

30
TABLESANDFIGURES

31
Table3.1.DemographicsAmongIncomingFemaleFirst‐YearStudents,byInstitutionType,2011
SurveyItem
CurrentWomen'sCollegesRank
PrivateFour‐YearColleges Universities
CurrentWomen'sColleges
AllCoedPrivate4yr
Colleges
AnnapolisGroup
CatholicColleges
PrivateUniversities
PublicUniversities
(A) (B) (C) (D) (E) (F)
n=4,358 n=46,011 n=16,032 n=9,135 n=20,595 n=39,706
(%) (%) (%) (%) (%) (%)
Student'srace/ethnicity
White/Caucasian 6 55.4 BCDEF 80.7 80.6 78.9 67.3 69.8
AfricanAmerican/Black
1 26.9 BCDEF 8.3 7.1 7.3 8.2 8.5
Chicano/Latinoa 2 14.2 BCE 10.0 9.1 13.8 11.4 14.5
AsianAmerican/Asian
3 11.0 BCDEF 7.3 9.8 5.5 20.6 13.7
Otherrace/ethnicity
1 4.6 BCDEF 3.4 3.7 3.1 4.2 3.4
AmericanIndian/AlaskaNative
1 3.3 BCDEF 2.3 1.9 1.7 1.9 2.1
NativeHawaiian/PacificIslander
1(T) 1.2 BCDE 0.9 0.7 1.0 1.0 1.2
AgeofstudentasofDecember2011
16oryounger 2(T) 0.0 BC 0.1 0.1 0.0 0.0 0.0
17 2 2.2 BCDEF 2.0 2.1 2.0 2.3 2.1
18 6 69.5 DEF 70.8 70.7 73.4 72.8 72.3
19 1(T) 26.1 DEF 26.1 26.0 24.0 24.1 24.9
20 1 1.5 BCDEF 0.9 1.0 0.4 0.6 0.5
21orolder 1 0.6 BCDEF 0.2 0.2 0.1 0.1 0.1
Englishisnativelanguage
Yes 5 87.4 BCD 92.7 91.7 92.8 86.7 87.7
(Table3.1continues)
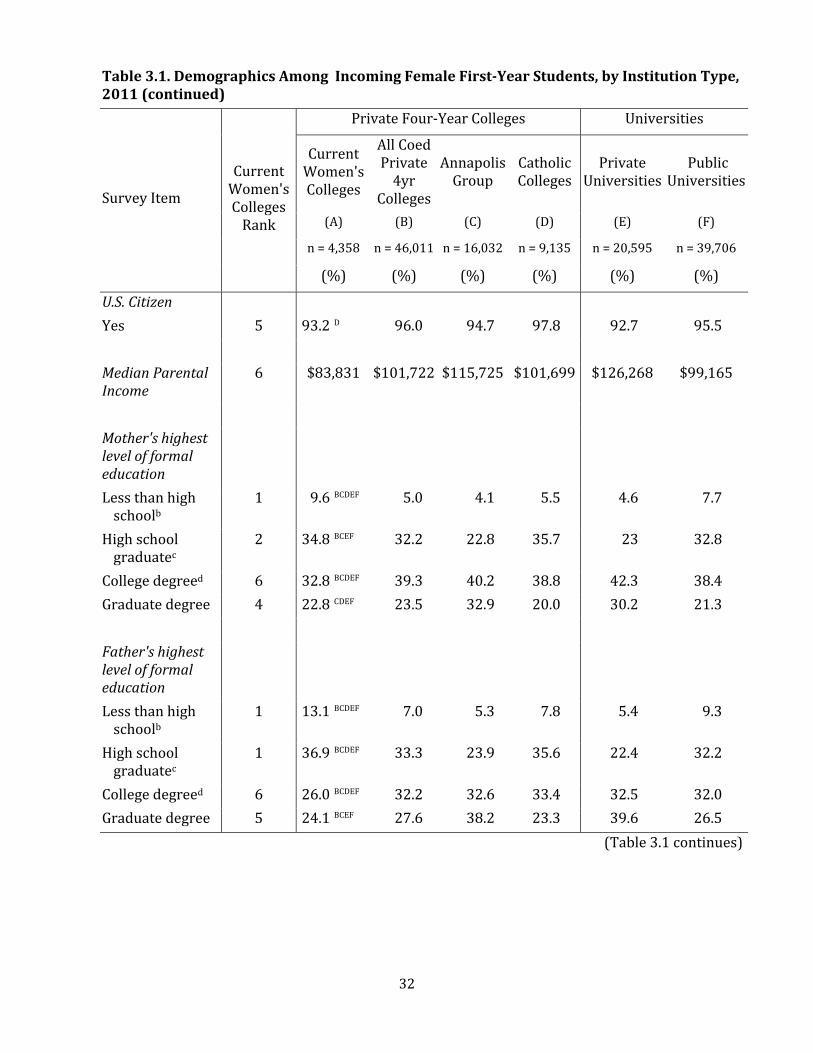
32
Table3.1.DemographicsAmongIncomingFemaleFirst‐YearStudents,byInstitutionType,2011(continued)
SurveyItem
CurrentWomen'sCollegesRank
PrivateFour‐YearColleges Universities
CurrentWomen'sColleges
AllCoedPrivate4yr
Colleges
AnnapolisGroup
CatholicColleges
PrivateUniversities
PublicUniversities
(A) (B) (C) (D) (E) (F)
n=4,358 n=46,011 n=16,032 n=9,135 n=20,595 n=39,706
(%) (%) (%) (%) (%) (%)
U.S.Citizen
Yes 5 93.2 D 96.0 94.7 97.8 92.7 95.5
MedianParentalIncome
6 $83,831 $101,722 $115,725 $101,699 $126,268 $99,165
Mother'shighestlevelofformaleducation
Lessthanhighschoolb
1 9.6 BCDEF 5.0 4.1 5.5 4.6 7.7
Highschoolgraduatec
2 34.8 BCEF 32.2 22.8 35.7 23 32.8
Collegedegreed 6 32.8 BCDEF 39.3 40.2 38.8 42.3 38.4
Graduatedegree 4 22.8 CDEF 23.5 32.9 20.0 30.2 21.3
Father'shighestlevelofformaleducation
Lessthanhighschoolb
1 13.1 BCDEF 7.0 5.3 7.8 5.4 9.3
Highschoolgraduatec
1 36.9 BCDEF 33.3 23.9 35.6 22.4 32.2
Collegedegreed 6 26.0 BCDEF 32.2 32.6 33.4 32.5 32.0
Graduatedegree 5 24.1 BCEF 27.6 38.2 23.3 39.6 26.5
(Table3.1continues)
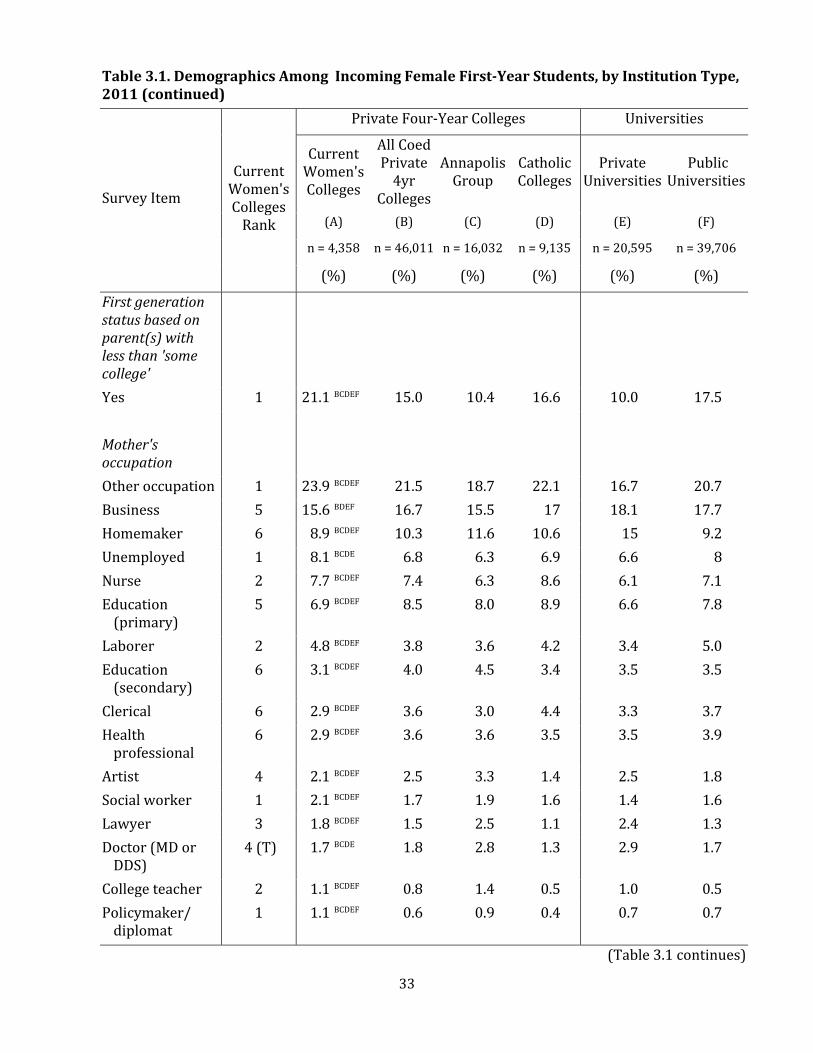
33
Table3.1.DemographicsAmongIncomingFemaleFirst‐YearStudents,byInstitutionType,2011(continued)
SurveyItem
CurrentWomen'sCollegesRank
PrivateFour‐YearColleges Universities
CurrentWomen'sColleges
AllCoedPrivate4yr
Colleges
AnnapolisGroup
CatholicColleges
PrivateUniversities
PublicUniversities
(A) (B) (C) (D) (E) (F)
n=4,358 n=46,011 n=16,032 n=9,135 n=20,595 n=39,706
(%) (%) (%) (%) (%) (%)
Firstgenerationstatusbasedonparent(s)withlessthan'somecollege'
Yes 1 21.1 BCDEF 15.0 10.4 16.6 10.0 17.5
Mother'soccupation
Otheroccupation 1 23.9 BCDEF 21.5 18.7 22.1 16.7 20.7
Business 5 15.6 BDEF 16.7 15.5 17 18.1 17.7
Homemaker 6 8.9 BCDEF 10.3 11.6 10.6 15 9.2
Unemployed 1 8.1 BCDE 6.8 6.3 6.9 6.6 8
Nurse 2 7.7 BCDEF 7.4 6.3 8.6 6.1 7.1
Education(primary)
5 6.9 BCDEF 8.5 8.0 8.9 6.6 7.8
Laborer 2 4.8 BCDEF 3.8 3.6 4.2 3.4 5.0
Education(secondary)
6 3.1 BCDEF 4.0 4.5 3.4 3.5 3.5
Clerical 6 2.9 BCDEF 3.6 3.0 4.4 3.3 3.7
Healthprofessional
6 2.9 BCDEF 3.6 3.6 3.5 3.5 3.9
Artist 4 2.1 BCDEF 2.5 3.3 1.4 2.5 1.8
Socialworker 1 2.1 BCDEF 1.7 1.9 1.6 1.4 1.6
Lawyer 3 1.8 BCDEF 1.5 2.5 1.1 2.4 1.3
Doctor(MDorDDS)
4(T) 1.7 BCDE 1.8 2.8 1.3 2.9 1.7
Collegeteacher 2 1.1 BCDEF 0.8 1.4 0.5 1.0 0.5
Policymaker/diplomat
1 1.1 BCDEF 0.6 0.9 0.4 0.7 0.7
(Table3.1continues)

34
Table3.1.DemographicsAmongIncomingFemaleFirst‐YearStudents,byInstitutionType,2011(continued)
SurveyItem
CurrentWomen'sCollegesRank
PrivateFour‐YearColleges Universities
CurrentWomen'sColleges
AllCoedPrivate4yr
Colleges
AnnapolisGroup
CatholicColleges
PrivateUniversities
PublicUniversities
(A) (B) (C) (D) (E) (F)
n=4,358 n=46,011 n=16,032 n=9,135 n=20,595 n=39,706
(%) (%) (%) (%) (%) (%)
Mother'soccupation
Collegeadministrator/staff
2(T) 0.9 CEF 0.9 1.1 0.9 0.7 0.5
Computerprogrammer
6 0.9 BCDEF 1.1 1.2 1.0 1.8 1.7
Engineer 4(T) 0.8 CDEF 0.8 0.9 0.7 1.8 1.6
Researchscientist
3 0.6 BCDEF 0.5 0.8 0.3 0.8 0.5
Military 1 0.5 BCDEF 0.1 0.1 0.1 0.1 0.2
Clinicalpsychologist
2(T) 0.4 BCDF 0.3 0.5 0.2 0.4 0.2
Lawenforcement 1 0.4 BCDEF 0.3 0.3 0.3 0.2 0.3
Architect 3(T) 0.3 CDE 0.3 0.5 0.2 0.4 0.3
Clergy 3(T) 0.2 BC 0.4 0.5 0.2 0.2 0.2
Farmerorforester
5(T) 0.1 BCDF 0.3 0.4 0.2 0.1 0.2
Father'soccupation
Otheroccupation 1 25.1 BCDEF 20.6 16.9 21.6 15.4 19.7
Business 6 23.0 BCDEF 28.7 29.2 30.6 33.7 28.3
Laborer 1 12.6 BCDEF 10.5 8.4 11.8 7.4 10.8
Unemployed 1 6.3 BCDEF 4.1 3.9 4.0 3.2 4.5
Engineer 6 6.2 BCDEF 7.2 6.8 7.9 9.3 10.4
Doctor(MDorDDS)
4(T) 3.3 BCDE 3.7 5.7 3.2 6.4 3.3
Computerprogrammer
6 2.7 BCDEF 3.6 3.9 3.2 4.1 4.0
(Table3.1continues)
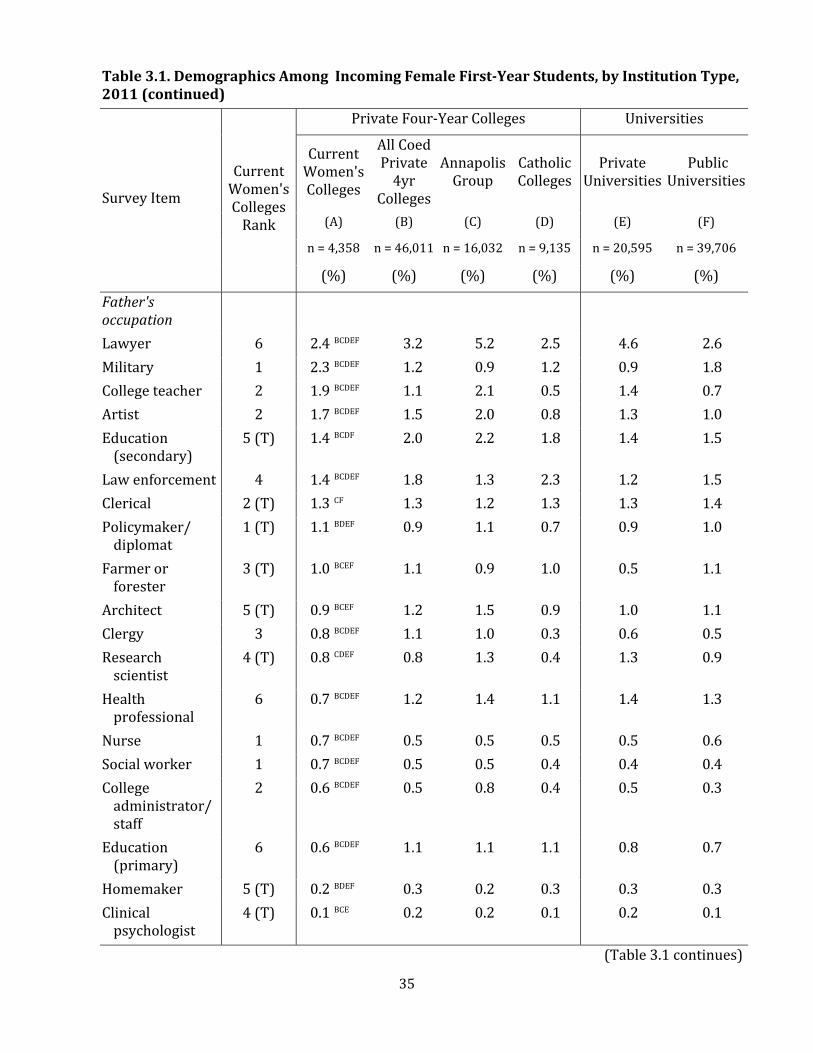
35
Table3.1.DemographicsAmongIncomingFemaleFirst‐YearStudents,byInstitutionType,2011(continued)
SurveyItem
CurrentWomen'sCollegesRank
PrivateFour‐YearColleges Universities
CurrentWomen'sColleges
AllCoedPrivate4yr
Colleges
AnnapolisGroup
CatholicColleges
PrivateUniversities
PublicUniversities
(A) (B) (C) (D) (E) (F)
n=4,358 n=46,011 n=16,032 n=9,135 n=20,595 n=39,706
(%) (%) (%) (%) (%) (%)
Father'soccupation
Lawyer 6 2.4 BCDEF 3.2 5.2 2.5 4.6 2.6
Military 1 2.3 BCDEF 1.2 0.9 1.2 0.9 1.8
Collegeteacher 2 1.9 BCDEF 1.1 2.1 0.5 1.4 0.7
Artist 2 1.7 BCDEF 1.5 2.0 0.8 1.3 1.0
Education(secondary)
5(T) 1.4 BCDF 2.0 2.2 1.8 1.4 1.5
Lawenforcement 4 1.4 BCDEF 1.8 1.3 2.3 1.2 1.5
Clerical 2(T) 1.3 CF 1.3 1.2 1.3 1.3 1.4
Policymaker/diplomat
1(T) 1.1 BDEF 0.9 1.1 0.7 0.9 1.0
Farmerorforester
3(T) 1.0 BCEF 1.1 0.9 1.0 0.5 1.1
Architect 5(T) 0.9 BCEF 1.2 1.5 0.9 1.0 1.1
Clergy 3 0.8 BCDEF 1.1 1.0 0.3 0.6 0.5
Researchscientist
4(T) 0.8 CDEF 0.8 1.3 0.4 1.3 0.9
Healthprofessional
6 0.7 BCDEF 1.2 1.4 1.1 1.4 1.3
Nurse 1 0.7 BCDEF 0.5 0.5 0.5 0.5 0.6
Socialworker 1 0.7 BCDEF 0.5 0.5 0.4 0.4 0.4
Collegeadministrator/staff
2 0.6 BCDEF 0.5 0.8 0.4 0.5 0.3
Education(primary)
6 0.6 BCDEF 1.1 1.1 1.1 0.8 0.7
Homemaker 5(T) 0.2 BDEF 0.3 0.2 0.3 0.3 0.3
Clinicalpsychologist
4(T) 0.1 BCE 0.2 0.2 0.1 0.2 0.1
(Table3.1continues)

36
Table3.1.DemographicsAmongIncomingFemaleFirst‐YearStudents,byInstitutionType,2011(continued)
SurveyItem
CurrentWomen'sCollegesRank
PrivateFour‐YearColleges Universities
CurrentWomen'sColleges
AllCoedPrivate4yr
Colleges
AnnapolisGroup
CatholicColleges
PrivateUniversities
PublicUniversities
(A) (B) (C) (D) (E) (F)
n=4,358 n=46,011 n=16,032 n=9,135 n=20,595 n=39,706
(%) (%) (%) (%) (%) (%)
Parents'status
Bothaliveandlivingwitheachother
6 61.3 BCDEF 72.8 74.9 75.4 78.1 70.5
Bothalive,divorcedorlivingapart
1 33.7 BCDEF 23.8 21.9 21.4 19.0 26.0
Oneorbothdeceased
1 5.0 BCDEF 3.5 3.3 3.2 2.8 3.4
Typeofhighschool
Publicschool(notcharterormagnet)
3 67.1 DEF 68.9 65.1 64.2 63.2 79.8
Privatereligious/parochialschool
4 11.2 BCDEF 14.2 10.2 24.2 16.0 8.5
Privateindependentcollege‐prepschool
4 11.0 BCDEF 11.5 19.2 7.4 15.5 5.2
Publicmagnetschool
1 5.5 BCDEF 2.5 3.1 1.7 3.6 3.8
Publiccharterschool
1 4.4 BCDEF 1.8 1.7 1.8 1.4 2.4
Homeschool 2 0.8 BCDEF 1.1 0.6 0.7 0.4 0.3
(Table3.1continues)

37
Table3.1.DemographicsAmongIncomingFemaleFirst‐YearStudents,byInstitutionType,2011(continued)
SurveyItem
CurrentWomen'sCollegesRank
PrivateFour‐YearColleges Universities
CurrentWomen'sColleges
AllCoedPrivate4yr
Colleges
AnnapolisGroup
CatholicColleges
PrivateUniversities
PublicUniversities
(A) (B) (C) (D) (E) (F)
n=4,358 n=46,011 n=16,032 n=9,135 n=20,595 n=39,706
(%) (%) (%) (%) (%) (%)
Racialcompositionofhighschool
Completelynon‐White
1 8.6 BCDEF 2.4 3.0 2.4 3.1 3.8
Mostlynon‐White 1 18.7 BCDEF 10.0 9.9 10.9 11.9 15.7
Roughlyhalfnon‐White
1 26.5 BCDE 23.1 22.2 19.9 24.2 26.0
MostlyWhite 6 41.7 BCDEF 56.9 57.5 58.8 53.7 48.3
CompletelyWhite 6 4.4 BCDEF 7.6 7.3 8.8 7.2 6.3
Racialcompositionofneighborhood
Completelynon‐White
1 12.7 BCDEF 4.3 5.1 4.3 5.4 5.9
Mostlynon‐White 1 17.1 BCDEF 8.5 8.2 9.0 10.8 12.5
Roughlyhalfnon‐White
1 15.5 BCDEF 12.5 11.7 11.8 14.4 14.0
MostlyWhite 6 41.0 BCDEF 53.0 53.6 52.2 52.2 50.2
CompletelyWhite 6 13.8 BCDEF 21.6 21.4 22.6 17.2 17.3
(Table3.1continues)

38
Table3.1.DemographicsAmongIncomingFemaleFirst‐YearStudents,byInstitutionType,2011(continued)
SurveyItem
CurrentWomen'sCollegesRank
PrivateFour‐YearColleges Universities
CurrentWomen'sColleges
AllCoedPrivate4yr
Colleges
AnnapolisGroup
CatholicColleges
PrivateUniversities
PublicUniversities
(A) (B) (C) (D) (E) (F)
n=4,358 n=46,011 n=16,032 n=9,135 n=20,595 n=39,706
(%) (%) (%) (%) (%) (%)
Distanceofcollegefrompermanenthomeinmiles
Morethan500 3 27.9 BCDEF 23.5 32.0 13.7 35.6 13.7
101to500 6 25.3 BCDEF 32.3 37.7 30.9 26.8 39.1
51to100 5 11.8 BCDEF 16.7 14.2 16.8 9.8 16.6
11to50 2 23.6 BCDEF 19.1 11.0 26.2 19.8 22.0
10orless 2 11.3 BCDEF 8.3 5.1 12.3 8.0 8.5
(T)IndicatesrankingtieBCDEFSignificantdifferencebetweenCurrentWomen'sCollegesandComparisonGroup(p<.05)aIncludesMexicanAmerican/Chicano,PuertoRican,andotherLatinobIncludesgrammarschoolorlessandsomehighschoolcIncludeshighschoolgraduate,postsecondaryschoolotherthancollege,andsomecollegedIncludescollegedegreeandsomegraduateschoolNote:Race/Ethnicitycolumnsdonotsumto100becausesomerespondentsmarkedmorethanonerace/ethnicity.

39
Table3.2.AcademicSelf‐ConfidenceandEngagementAmongIncomingFemaleFirst‐YearStudents,byInstitutionType,2011
SurveyItem
CurrentWomen'sCollegesRank
PrivateFour‐YearColleges Universities
CurrentWomen'sColleges
AllCoedPrivate4yr
Colleges
AnnapolisGroup
CatholicColleges
PrivateUniversities
PublicUniversities
(A) (B) (C) (D) (E) (F)n=4,358 n=46,011 n=16,032 n=9,135 n=20,595 n=39,706
(%) (%) (%) (%) (%) (%)Averagehighschoolgrades
AorA+ 6 23.4 BCDEF 31.0 37.6 28.2 45.9 33.9A‐ 6 29.0 BCDEF 30.2 33.3 30.8 31.8 30.1B+ 1 23.5 BCDEF 20.5 17.7 22.0 13.8 18.2B 1 16.7 BCDEF 13.3 9.1 14.4 6.7 13.6C+orB‐ 1 6.4 BCDEF 4.6 2.1 4.4 1.7 3.9Corlower 1 0.9 BCDEF 0.4 0.1 0.3 0.1 0.3 Self‐rating(highest10%oraboveaverage)
Academicability 4(T) 70.1 CEF 70.1 79.6 67.9 84.9 75.0Self‐confidence(intellectual)
2 55.4 BDEF 50.1 54.6 49.5 61.2 53.7
Writingability 4 49.6 CDE 50.1 56.7 47.4 59.3 49.4Mathematicalability 6 33.9 BCDEF 35.6 38.7 36.2 51.6 42.1Computerskills 1 33.8 BCDEF 27.5 23.4 30.3 32.0 31.4 Expectations(verygoodchance)
Makeatleasta'B'average
3 73.5 EF 72.8 72.8 75.8 76.1 67.9
Discusscoursecontentwithstudentsoutsideofclass
3 64.2 BCDEF 60.7 69.1 59.8 70.3 56.8
Communicateregularlywithyourprofessors
1 60.3 BDEF 52.4 59.1 53.0 52.8 40.9
(Table3.2continues)

40
Table3.2.AcademicSelf‐ConfidenceandEngagementAmongIncomingFemaleFirst‐YearStudents,byInstitutionType,2011(continued)
SurveyItem
CurrentWomen'sCollegesRank
Private Four‐YearColleges Universities
CurrentWomen'sColleges
AllCoedPrivate4yr
Colleges
AnnapolisGroup
CatholicColleges
PrivateUniversities
PublicUniversities
(A) (B) (C) (D) (E) (F)n=4,358 n=46,011 n=16,032 n=9,135 n=20,595 n=39,706
(%) (%) (%) (%) (%) (%)Expectations(verygoodchance)
Participateinastudyabroadprogram
3 50.8 CDEF 50.4 64.4 47.8 59.1 43.8
Gettutoringhelpinspecificcoursesa
1 43.0 BCDEF 33.5 32.7 39.7 34.2 39.3
Workonaprofessor'sresearchproject
1 41.1 BCDEF 33.2 33.8 34.6 36.2 31.6
Needextratimetocompleteyourdegreerequirements
2 5.7 BCDEF 4.9 3.5 5.1 3.7 5.9
Classroomengagement(frequentlyoroccasionally)
Studiedwithotherstudents
6 89.9 E 91.3 92.5 92.7 93.4 92.3
Camelatetoclass 4 52.1 BD 50.2 52.9 46.5 53.7 53.4Wasboredinclass* 5 30.1 BCEF 32.4 31.9 29.6 33.9 37.8 (Table3.2continues)
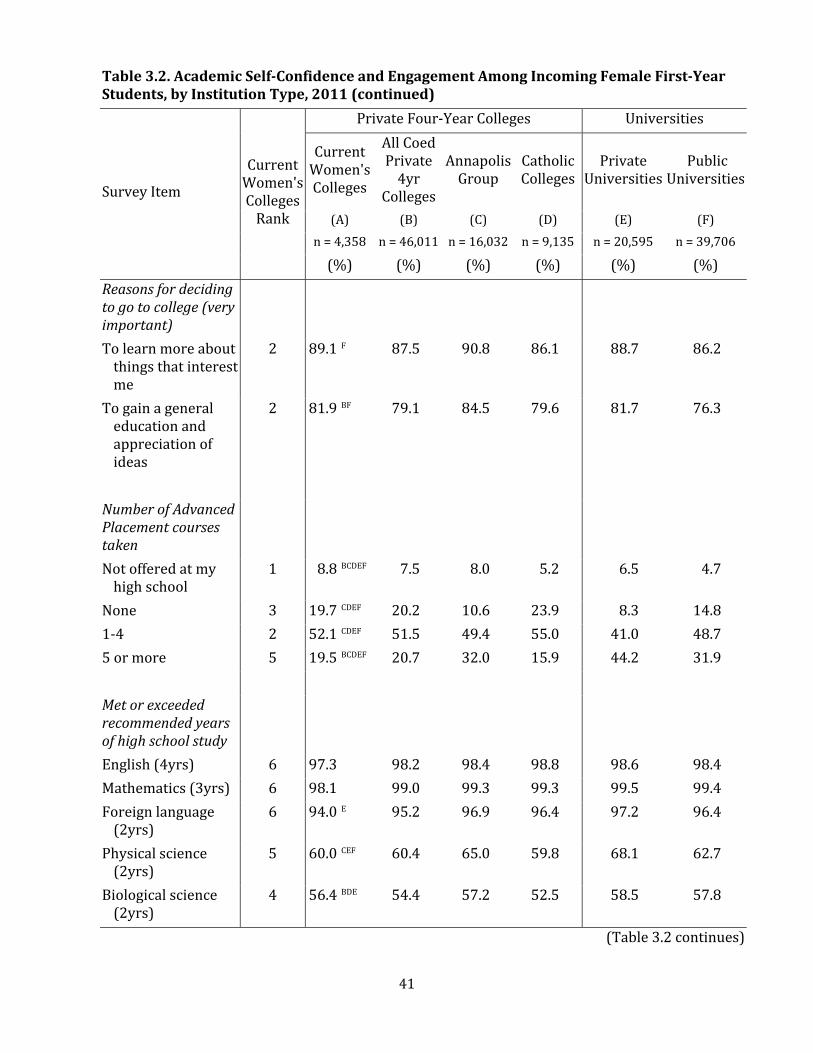
41
Table3.2.AcademicSelf‐ConfidenceandEngagementAmongIncomingFemaleFirst‐YearStudents,byInstitutionType,2011(continued)
SurveyItem
CurrentWomen'sCollegesRank
Private Four‐YearColleges Universities
CurrentWomen'sColleges
AllCoedPrivate4yr
Colleges
AnnapolisGroup
CatholicColleges
PrivateUniversities
PublicUniversities
(A) (B) (C) (D) (E) (F)n=4,358 n=46,011 n=16,032 n=9,135 n=20,595 n=39,706
(%) (%) (%) (%) (%) (%)Reasonsfordecidingtogotocollege(veryimportant)
Tolearnmoreaboutthingsthatinterestme
2 89.1 F 87.5 90.8 86.1 88.7 86.2
Togainageneraleducationandappreciationofideas
2 81.9 BF 79.1 84.5 79.6 81.7 76.3
NumberofAdvancedPlacementcoursestaken
Notofferedatmyhighschool
1 8.8 BCDEF 7.5 8.0 5.2 6.5 4.7
None 3 19.7 CDEF 20.2 10.6 23.9 8.3 14.81‐4 2 52.1 CDEF 51.5 49.4 55.0 41.0 48.75ormore 5 19.5 BCDEF 20.7 32.0 15.9 44.2 31.9 Metorexceededrecommendedyearsofhighschoolstudy
English(4yrs) 6 97.3 98.2 98.4 98.8 98.6 98.4Mathematics(3yrs) 6 98.1 99.0 99.3 99.3 99.5 99.4Foreignlanguage(2yrs)
6 94.0 E 95.2 96.9 96.4 97.2 96.4
Physicalscience(2yrs)
5 60.0 CEF 60.4 65.0 59.8 68.1 62.7
Biologicalscience(2yrs)
4 56.4 BDE 54.4 57.2 52.5 58.5 57.8
(Table3.2continues)

42
Table3.2.AcademicSelf‐ConfidenceandEngagementAmongIncomingFemaleFirst‐YearStudents,byInstitutionType,2011(continued)
SurveyItem
CurrentWomen'sCollegesRank
Private Four‐YearColleges Universities
CurrentWomen'sColleges
AllCoedPrivate4yr
Colleges
AnnapolisGroup
CatholicColleges
PrivateUniversities
PublicUniversities
(A) (B) (C) (D) (E) (F)n=4,358 n=46,011 n=16,032 n=9,135 n=20,595 n=39,706
(%) (%) (%) (%) (%) (%)Metorexceededrecommendedyearsofhighschoolstudy
History/Amgov’t(1yr)
6 98.6 99.0 99.1 99.2 99.2 99.2
Computerscience(1/2yr)
2 53.5 CEF 52.2 44.4 54.9 46.5 50.2
Artand/ormusic(1yr)
5 86.0 C 87.5 89.3 86.6 88.3 85.9
Activitiesinthepastyear(medianhoursperweek)
Studying/homework 5 7.8 8.0 9.6 7.9 10.1 7.3Talkingwithteachersoutsideofclass
1 2.2 2.0 2.1 1.9 2.0 1.7
*Frequentlyonly BCDEFSignificantdifferencebetweenCurrentWomen'sCollegesandComparisonGroup(p<.05)aOn2010survey (T)Indicatesrankingtie
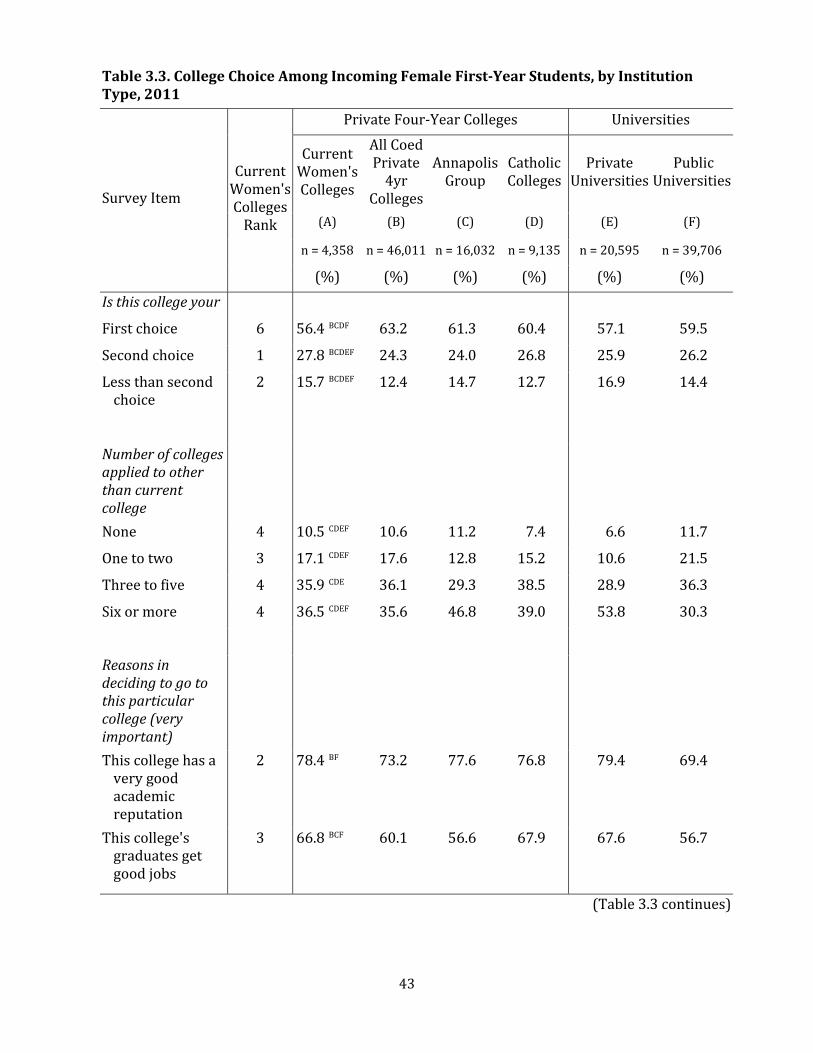
43
Table3.3.CollegeChoiceAmongIncomingFemaleFirst‐YearStudents,byInstitutionType,2011
SurveyItem
CurrentWomen'sCollegesRank
PrivateFour‐YearColleges Universities
CurrentWomen'sColleges
AllCoedPrivate4yr
Colleges
AnnapolisGroup
CatholicColleges
PrivateUniversities
PublicUniversities
(A) (B) (C) (D) (E) (F)
n=4,358 n=46,011 n=16,032 n=9,135 n=20,595 n=39,706
(%) (%) (%) (%) (%) (%)Isthiscollegeyour Firstchoice 6 56.4BCDF 63.2 61.3 60.4 57.1 59.5 Secondchoice 1 27.8BCDEF 24.3 24.0 26.8 25.9 26.2 Lessthansecondchoice
2 15.7BCDEF 12.4 14.7 12.7 16.9 14.4
Numberofcollegesappliedtootherthancurrentcollege
None 4 10.5CDEF 10.6 11.2 7.4 6.6 11.7
Onetotwo 3 17.1CDEF 17.6 12.8 15.2 10.6 21.5
Threetofive 4 35.9CDE 36.1 29.3 38.5 28.9 36.3
Sixormore 4 36.5CDEF 35.6 46.8 39.0 53.8 30.3
Reasonsindecidingtogotothisparticularcollege(veryimportant)
Thiscollegehasaverygoodacademicreputation
2 78.4BF 73.2 77.6 76.8 79.4 69.4
Thiscollege'sgraduatesgetgoodjobs
3 66.8BCF 60.1 56.6 67.9 67.6 56.7
(Table3.3continues)

44
Table3.3.CollegeChoiceAmongIncomingFemaleFirst‐YearStudents,byInstitutionType,2011(continued)
SurveyItem
CurrentWomen'sCollegesRank
PrivateFour‐YearColleges Universities
CurrentWomen'sColleges
AllCoedPrivate4yr
Colleges
AnnapolisGroup
CatholicColleges
PrivateUniversities
PublicUniversities
(A) (B) (C) (D) (E) (F)
n=4,358 n=46,011 n=16,032 n=9,135 n=20,595 n=39,706
(%) (%) (%) (%) (%) (%)Reasonsindecidingtogotothisparticularcollege(veryimportant)
Iwasofferedfinancialassistance
2 64.2 BCEF 62.0 58.1 66.3 51.6 40.0
Iwantedtogotoaschoolaboutthesizeofthiscollege
4 58.9 BCDEF 61.6 63.1 62.5 47.5 35.9
Avisittocampus 4 56.8 BCEF 59.6 63.1 57.9 54.2 44.5 Thiscollege'sgraduatesgainadmissiontotopgraduate/professionalschools
1 50.8 BCDEF 39.8 44.6 45.4 47.8 39.5
Thiscollegehasagoodreputationforitssocialactivities
3(T) 40.7 BCDF 38.9 38.5 43.0 40.7 43.3
Thecostofattendingthiscollege
3 37.5 BCDEF 35.0 31.3 39.5 31.3 43.7
Informationfromawebsite
1(T) 27.3 BCDF 23.7 25.9 21.3 27.3 21.5
Rankingsinnationalmagazines
3 23.4 BDE 18.8 22.7 18.9 32.0 23.9
Iwantedtolivenearhome
2 21.1 BCDEF 18.3 11.8 23.7 14.1 17.9
(Table3.3continues)

45
Table3.3.CollegeChoiceAmongIncomingFemaleFirst‐YearStudents,byInstitutionType,2011(continued)
SurveyItem
CurrentWomen'sCollegesRank
PrivateFour‐YearColleges Universities
CurrentWomen'sColleges
AllCoedPrivate4yr
Colleges
AnnapolisGroup
CatholicColleges
PrivateUniversities
PublicUniversities
(A) (B) (C) (D) (E) (F)
n=4,358 n=46,011 n=16,032 n=9,135 n=20,595 n=39,706
(%) (%) (%) (%) (%) (%)Reasonsindecidingtogotothisparticularcollege(veryimportant)
IwasadmittedthroughanEarlyActionorEarlyDecisionprogram
4 20.6 BCDEF 21.4 27.5 19.3 23.9 16.4
Myparentswantedmetocomehere
2 17.4 BCDEF 14.0 11.3 18.1 14.7 14.7
Highschoolcounseloradvisedme
1 13.2 BCDEF 10.0 10.9 11.0 9.1 8.0
Iwasattractedbythereligiousaffiliation/orientationofthecollege
3 13.1 BCDEF 17.0 7.8 23.1 12.2 3.1
Couldnotaffordfirstchoice
3 11.5 BCDEF 10.0 8.7 12.7 8.8 14.6
Notofferedaidbyfirstchoice
2 11.3 BCDEF 9.1 8.1 11.8 8.4 10.2
Myteacheradvisedme
1 8.5 BCDEF 6.0 5.7 6.3 5.1 5.2
Privatecollegecounseloradvisedme
1 7.8 BCDEF 5.3 5.9 5.3 4.6 2.2
Myrelativeswantedmetocomehere
1 7.4 BCDEF 4.9 3.5 6.7 5.0 5.6
(Table3.3continues)
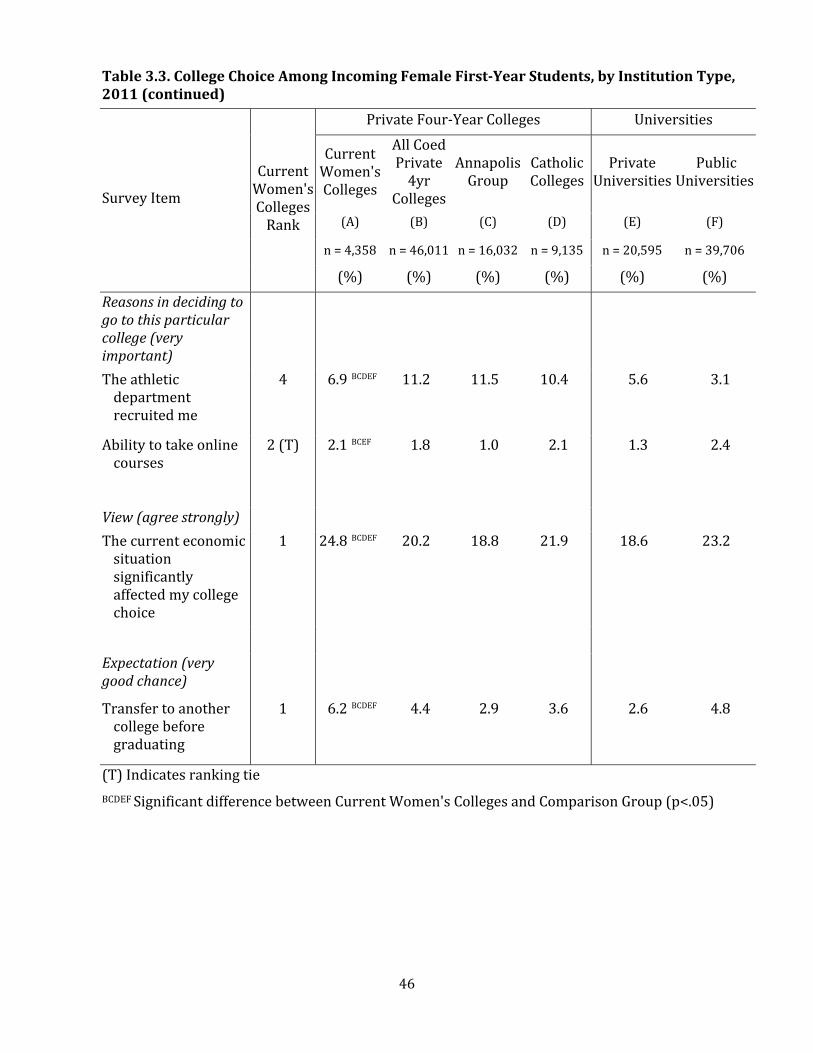
46
Table3.3.CollegeChoiceAmongIncomingFemaleFirst‐YearStudents,byInstitutionType,2011(continued)
SurveyItem
CurrentWomen'sCollegesRank
PrivateFour‐YearColleges Universities
CurrentWomen'sColleges
AllCoedPrivate4yr
Colleges
AnnapolisGroup
CatholicColleges
PrivateUniversities
PublicUniversities
(A) (B) (C) (D) (E) (F)
n=4,358 n=46,011 n=16,032 n=9,135 n=20,595 n=39,706
(%) (%) (%) (%) (%) (%)Reasonsindecidingtogotothisparticularcollege(veryimportant)
Theathleticdepartmentrecruitedme
4 6.9 BCDEF 11.2 11.5 10.4 5.6 3.1
Abilitytotakeonlinecourses
2(T) 2.1 BCEF 1.8 1.0 2.1 1.3 2.4
View(agreestrongly) Thecurrenteconomicsituationsignificantlyaffectedmycollegechoice
1 24.8 BCDEF 20.2 18.8 21.9 18.6 23.2
Expectation(verygoodchance)
Transfertoanothercollegebeforegraduating
1 6.2 BCDEF 4.4 2.9 3.6 2.6 4.8
(T)Indicatesrankingtie BCDEFSignificantdifferencebetweenCurrentWomen'sCollegesandComparisonGroup(p<.05)

47
Table3.4.FinancialAttitudesandExpectationsAmongIncomingFemaleFirst‐YearStudents,byInstitutionType,2011
SurveyItem
CurrentWomen'sCollegesRank
PrivateFour‐YearColleges Universities
CurrentWomen'sColleges
AllCoedPrivate4yr
Colleges
AnnapolisGroup
CatholicColleges
PrivateUniversities
PublicUniversities
(A) (B) (C) (D) (E) (F)n=4,358 n=46,011 n=16,032 n=9,135 n=20,595 n=39,706
(%) (%) (%) (%) (%) (%)Expectations(verygoodchance)
Getajobtohelppayforcollegeexpenses
1(T) 56.4BCEF 54.4 52.2 56.4 50.5 52.7
Workfull‐timewhileattendingcollege
1 7.3BCDEF 5.6 4.1 5.5 4.5 6.6
Finances Majorconcernaboutabilitytofinancecollegeeducation
1 17.8BCDEF 12.5 10.6 12.9 12.1 12.7
Receivedfundsforcollegeeducationfrom:
Familyresources 6 81.1BCDE 84.6 88.4 85.2 89.5 81.3Aidwhichneednotberepaid
2 82.4CDEF 80.5 76.2 85.5 73.7 70.4
Aidwhichmustberepaid
1 66.0BCEF 59.6 51.9 65.9 50.1 49.4
Ownresources 4 64.1D 66.1 65.5 69.4 63.1 63.1 Reasonfordecidingtogotocollege
Tobeabletomakemoremoney
3 65.7BCDEF 61.1 52.2 69.1 61.5 68.3
(Table3.4 continues)

48
Table3.4.FinancialAttitudesandExpectationsAmongIncomingFemaleFirst‐YearStudents,byInstitutionType,2011(continued)
SurveyItem
CurrentWomen'sCollegesRank
PrivateFour‐YearColleges Universities
CurrentWomen'sColleges
All CoedPrivate4yr
Colleges
AnnapolisGroup
CatholicColleges
PrivateUniversities
PublicUniversities
(A) (B) (C) (D) (E) (F)n=4,358 n=46,011 n=16,032 n=9,135 n=20,595 n=39,706
(%) (%) (%) (%) (%) (%)Goals(veryimportantoressential)
Beingverywellofffinancially
3 77.4BCE 71.4 64.0 80.1 73.7 79.0
Becomingsuccessfulinabusinessofmyown
1 40.7BCDEF 34.1 29.8 37 35.6 37.2
Activityinthepastyear(Medianhoursperweek)
Working(forpay) 4 5.7 6.2 4.8 6.8 4.7 6.1(T)Indicatesrankingtie BCDEFSignificantdifferencebetweenCurrentWomen'sCollegesandComparisonGroup(p<.05)

49
Table3.5.Educational,Career&FamilyAspirationsAmongIncomingFemaleFirst‐YearStudents,byInstitutionType,2011
SurveyItem
CurrentWomen'sCollegesRank
PrivateFour‐YearColleges Universities
CurrentWomen'sColleges
AllCoedPrivate4yr
Colleges
AnnapolisGroup
CatholicColleges
PrivateUniversities
PublicUniversities
(A) (B) (C) (D) (E) (F)
n=4,358 n=46,011 n=16,032 n=9,135 n=20,595 n=39,706
(%) (%) (%) (%) (%) (%)Degreeaspirations Master'sdegree(M.A.,M.S.,etc.)
6 37.2 BCDEF 42.5 39.4 45.4 38.6 40.6
Ph.D.orEd.D 1 27.3 BCDEF 20.4 25.9 17.8 21.2 20.8
Bachelor'sdegree(B.A.,B.S.,etc.)
4 13.0 BCDEF 17.9 10.9 15.8 12.4 16.8
M.D.,D.D.S.,D.V.M.orD.O.
4 13.0 BCDEF 11.3 15.0 12.3 17.0 15.0
LL.B.orJ.D.(law) 3 6.2 BCDEF 4.6 6.6 5.3 7.5 4.5
Other 1(T) 1.5 CDEF 1.5 1.2 1.3 1.4 1.1
B.D.orM.Div.(divinity)
1(T) 0.2 DEF 0.2 0.2 0.1 0.1 0.1
Goals(essentialorveryimportant)
Raisingafamily 5 69.8 BDEF 74.0 68.1 81.1 72.8 72.9Makingatheoreticalcontributiontoscience
1 25.1 BCDEF 19.4 21.4 20.8 23.2 24.1
Yourprobablefieldofstudy
Healthprofessional 1(T) 21.2 BCEF 16.4 10.7 21.2 14.6 16.7
Biologicalsciences 5 12.6 BCF 12.2 16.2 12.9 13.0 15.2
Psychology 1 9.2 BCDEF 7.4 8.2 7.5 5.8 6.7
(Table3.5continues)

50
Table3.5.Educational,Career&FamilyAspirationsAmongIncomingFemaleFirst‐YearStudents,byInstitutionType,2011(continued)
SurveyItem
CurrentWomen'sCollegesRank
PrivateFour‐YearColleges Universities
CurrentWomen'sColleges
AllCoedPrivate4yr
Colleges
AnnapolisGroup
CatholicColleges
PrivateUniversities
PublicUniversities
(A) (B) (C) (D) (E) (F)
n=4,358 n=46,011 n=16,032 n=9,135 n=20,595 n=39,706
(%) (%) (%) (%) (%) (%)Yourprobablefieldofstudy
Humanities/English 2 7.2 BCDEF 6.9 9.7 4.9 6.0 4.9
Education 3 6.9 BCDEF 8.9 5.4 9.6 3.3 5.0
Finearts 2 6.6 BCDEF 7.2 5.8 2.4 5.5 3.3
Undecided 5 6.4 BCDEF 7.3 10.6 7.0 6.2 7.6
Historyorpoliticalscience
3 5.8 BCDEF 4.8 8.2 3.9 7.1 4.0
Business 6 5.7 BCDEF 10.2 6.1 14.2 12.9 11.5
Socialsciences 2 5.7 BCDEF 4.4 6.8 2.7 4.8 4.3
Other(non‐technical) 5 3.0 BCDEF 3.8 2.5 3.6 3.2 4.3
Journalism/communications
6 2.6 BCDEF 3.7 2.7 4.2 5.4 3.6
Physicalsciences 3(T) 2.4 BCD 2.6 3.4 1.7 2.4 2.4
Engineering 4 1.9 BCDEF 1.6 1.4 2.1 6.9 7.0
Technical/appliedmajors
1 0.9 BCDEF 0.8 0.5 0.8 0.5 0.7
Mathematicsorstatistics
6 0.8 BCDEF 1.0 1.4 0.9 1.1 1.0
Architecture 3 0.5 BCDEF 0.4 0.3 0.1 0.9 0.8
Computerscience 3 0.4 BCDEF 0.3 0.3 0.3 0.7 0.5
Agriculture 2(T) 0.1 CDEF 0.1 0.0 0.0 0.0 0.8
(Table3.5continues)

51
Table3.5.Educational,Career&FamilyAspirationsAmongIncomingFemaleFirst‐YearStudents,byInstitutionType,2011(continued)
SurveyItem
CurrentWomen'sCollegesRank
PrivateFour‐YearColleges Universities
CurrentWomen'sColleges
AllCoedPrivate4yr
Colleges
AnnapolisGroup
CatholicColleges
PrivateUniversities
PublicUniversities
(A) (B) (C) (D) (E) (F)
n=4,358 n=46,011 n=16,032 n=9,135 n=20,595 n=39,706
(%) (%) (%) (%) (%) (%)Yourprobablecareer Undecided 5 15.2 BCDEF 17.4 25.5 14.3 16.2 17.0
Nurse 1 11.7 BCDEF 6.2 1.5 10.5 4.2 6.0
Doctor(MDorDDS) 5 10.2 BCDEF 9.2 11.8 11.3 15.1 12
Healthprofessional 4 9.5 BCDEF 9.8 8.0 9.9 7.3 11.6
Othercareer 2 9.5 CDE 9.7 7.6 8.6 7.4 9.3
Artist 3 9.2 BDEF 10.3 9.4 5.5 8.8 6.1
Business 6 5.9 BDEF 9.0 6.0 11.7 12.2 10.2
Lawyer 2 5.3 BCDEF 3.6 4.8 4.4 5.7 3.9
Education(primary) 3 4.3 BCDEF 5.7 3.6 6.5 1.9 3.2
Education(secondary)
3 3.7 BDEF 4.2 3.6 4.2 1.7 2.7
Clinicalpsychologist 1 3.0 BCDEF 2.5 2.5 2.9 1.7 1.9
Policymaker/diplomat 3 3.0 BCDEF 2.5 4.6 1.7 4.6 2.0
Researchscientist 5 2.5 BCDEF 2.7 4.3 1.7 3.2 2.8
Engineer 4 1.7 BCDEF 1.5 1.6 2.0 5.4 5.6
Socialworker 2(T) 1.6 CDEF 1.6 1.3 1.4 0.8 1.4
Collegeteacher 1 1.3 BCDEF 0.7 1.2 0.4 0.5 0.4
Architect 3(T) 0.5 DEF 0.5 0.5 0.2 1.0 0.9
Computerprogrammer
2(T) 0.5 BCDE 0.3 0.2 0.4 0.6 0.5
Clerical 4(T) 0.4 CDEF 0.4 0.2 0.5 0.5 0.7
Lawenforcement 4 0.4 BCDEF 0.7 0.3 0.8 0.3 0.5
Laborer 2(T) 0.3 CDE 0.3 0.1 0.4 0.2 0.3
FarmerorForester 6 0.1 BCDEF 0.6 0.8 0.2 0.3 0.6
(Table3.5continues)
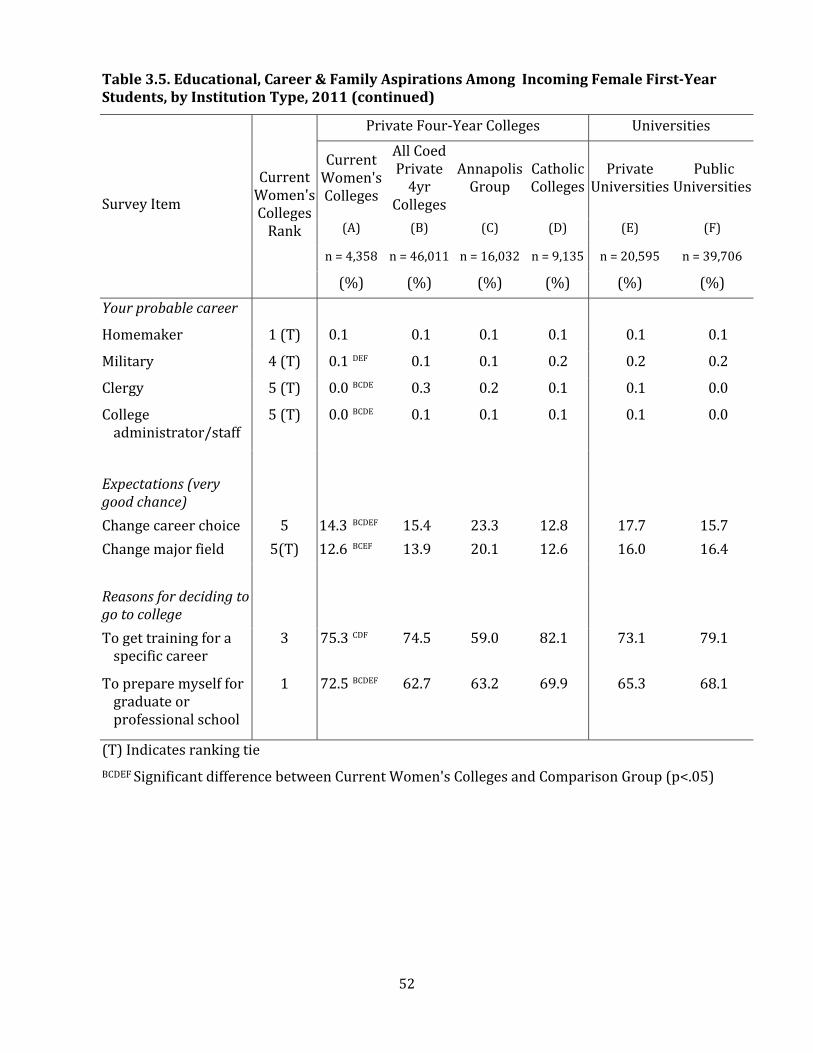
52
Table3.5.Educational,Career&FamilyAspirationsAmongIncomingFemaleFirst‐YearStudents,byInstitutionType,2011(continued)
SurveyItem
CurrentWomen'sCollegesRank
PrivateFour‐YearColleges Universities
CurrentWomen'sColleges
AllCoedPrivate4yr
Colleges
AnnapolisGroup
CatholicColleges
PrivateUniversities
PublicUniversities
(A) (B) (C) (D) (E) (F)
n=4,358 n=46,011 n=16,032 n=9,135 n=20,595 n=39,706
(%) (%) (%) (%) (%) (%)Yourprobablecareer
Homemaker 1(T) 0.1 0.1 0.1 0.1 0.1 0.1
Military 4(T) 0.1 DEF 0.1 0.1 0.2 0.2 0.2
Clergy 5(T) 0.0 BCDE 0.3 0.2 0.1 0.1 0.0
Collegeadministrator/staff
5(T) 0.0 BCDE 0.1 0.1 0.1 0.1 0.0
Expectations(verygoodchance)
Changecareerchoice 5 14.3 BCDEF 15.4 23.3 12.8 17.7 15.7Changemajorfield 5(T) 12.6 BCEF 13.9 20.1 12.6 16.0 16.4 Reasonsfordecidingtogotocollege
Togettrainingforaspecificcareer
3 75.3 CDF 74.5 59.0 82.1 73.1 79.1
Topreparemyselfforgraduateorprofessionalschool
1 72.5 BCDEF 62.7 63.2 69.9 65.3 68.1
(T)Indicatesrankingtie BCDEFSignificantdifferencebetweenCurrentWomen'sCollegesandComparisonGroup(p<.05)
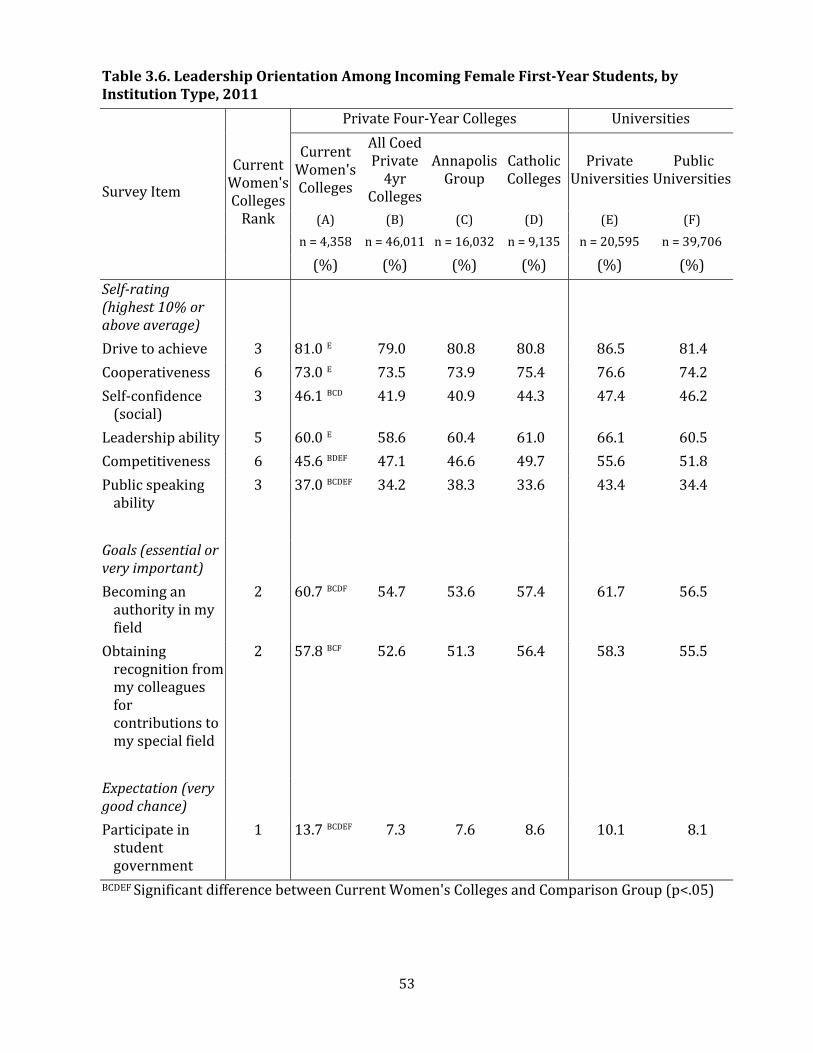
53
Table3.6.LeadershipOrientationAmongIncomingFemaleFirst‐YearStudents,byInstitutionType,2011
SurveyItem
CurrentWomen'sCollegesRank
PrivateFour‐YearColleges Universities
CurrentWomen'sColleges
AllCoedPrivate4yr
Colleges
AnnapolisGroup
CatholicColleges
PrivateUniversities
PublicUniversities
(A) (B) (C) (D) (E) (F)n=4,358 n=46,011 n=16,032 n=9,135 n=20,595 n=39,706
(%) (%) (%) (%) (%) (%)Self‐rating(highest10%oraboveaverage)
Drivetoachieve 3 81.0E 79.0 80.8 80.8 86.5 81.4Cooperativeness 6 73.0E 73.5 73.9 75.4 76.6 74.2Self‐confidence(social)
3 46.1BCD 41.9 40.9 44.3 47.4 46.2
Leadershipability 5 60.0E 58.6 60.4 61.0 66.1 60.5Competitiveness 6 45.6BDEF 47.1 46.6 49.7 55.6 51.8Publicspeakingability
3 37.0BCDEF 34.2 38.3 33.6 43.4 34.4
Goals(essentialorveryimportant)
Becominganauthorityinmyfield
2 60.7BCDF 54.7 53.6 57.4 61.7 56.5
Obtainingrecognitionfrommycolleaguesforcontributionstomyspecialfield
2 57.8BCF 52.6 51.3 56.4 58.3 55.5
Expectation(verygoodchance)
Participateinstudentgovernment
1 13.7BCDEF 7.3 7.6 8.6 10.1 8.1
BCDEFSignificantdifferencebetweenCurrentWomen'sCollegesandComparisonGroup(p<.05)
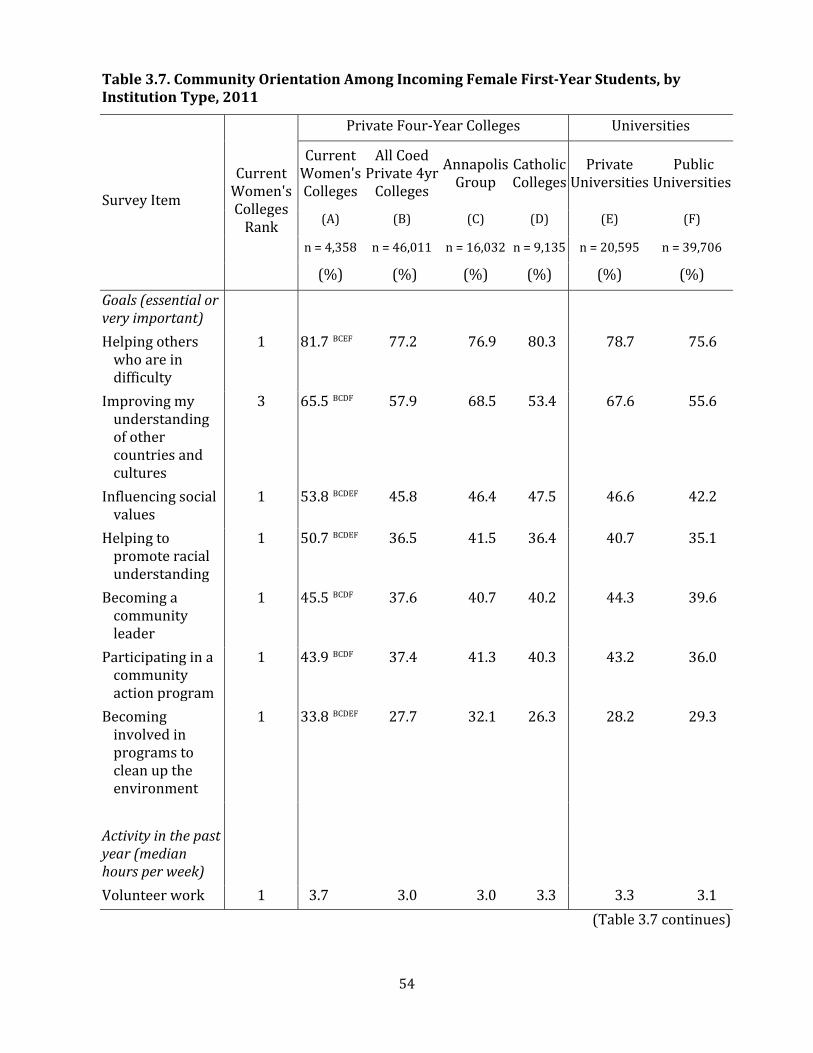
54
Table3.7.CommunityOrientationAmongIncomingFemaleFirst‐YearStudents,byInstitutionType,2011
SurveyItem
CurrentWomen'sCollegesRank
PrivateFour‐YearColleges Universities
CurrentWomen'sColleges
AllCoedPrivate4yrColleges
AnnapolisGroup
CatholicColleges
PrivateUniversities
PublicUniversities
(A) (B) (C) (D) (E) (F)
n=4,358 n=46,011 n=16,032 n=9,135 n=20,595 n=39,706
(%) (%) (%) (%) (%) (%)
Goals(essentialorveryimportant)
Helpingotherswhoareindifficulty
1 81.7 BCEF 77.2 76.9 80.3 78.7 75.6
Improvingmyunderstandingofothercountriesandcultures
3 65.5 BCDF 57.9 68.5 53.4 67.6 55.6
Influencingsocialvalues
1 53.8 BCDEF 45.8 46.4 47.5 46.6 42.2
Helpingtopromoteracialunderstanding
1 50.7 BCDEF 36.5 41.5 36.4 40.7 35.1
Becomingacommunityleader
1 45.5 BCDF 37.6 40.7 40.2 44.3 39.6
Participatinginacommunityactionprogram
1 43.9 BCDF 37.4 41.3 40.3 43.2 36.0
Becominginvolvedinprogramstocleanuptheenvironment
1 33.8 BCDEF 27.7 32.1 26.3 28.2 29.3
Activityinthepastyear(medianhoursperweek)
Volunteerwork 1 3.7 3.0 3.0 3.3 3.3 3.1 (Table3.7continues)

55
Table3.7.CommunityOrientationAmongIncomingFemaleFirst‐YearStudents,byInstitutionType,2011(continued)
SurveyItem
CurrentWomen'sCollegesRank
PrivateFour‐YearColleges Universities
CurrentWomen'sColleges
AllCoedPrivate4yrColleges
AnnapolisGroup
CatholicColleges
PrivateUniversities
PublicUniversities
(A) (B) (C) (D) (E) (F)
n=4,358 n=46,011 n=16,032 n=9,135 n=20,595 n=39,706
(%) (%) (%) (%) (%) (%)
Expectations(verygoodchance)
Participateinstudentprotestsordemonstrations
1 13.6 BCDEF 7.0 10.4 5.5 8.5 6.3
Participateinvolunteerorcommunityservicework
3 53.9 BEF 50.1 55.4 52.4 59.8 46.6
Activityinthepastyear(frequentlyoroccasionally)
Socializedwithsomeoneofanotherracial/ethnicgroup*
2 74.2 BCDF 68.5 71.5 65.8 75.7 71.5
Tutoredanotherstudent
4 62.7 BDE 58.9 63.9 60.4 72.2 64.4
Self‐rating(highest10%oraboveaverage)
Abilitytoworkcooperativelywithdiversepeople
3 80.9 BDE 77.7 81.3 77.6 84.2 80.4
Toleranceofotherswithdifferentbeliefs
4 77.0 CDE 74.7 82.0 73.2 82.4 77.1
(Table3.7continues)
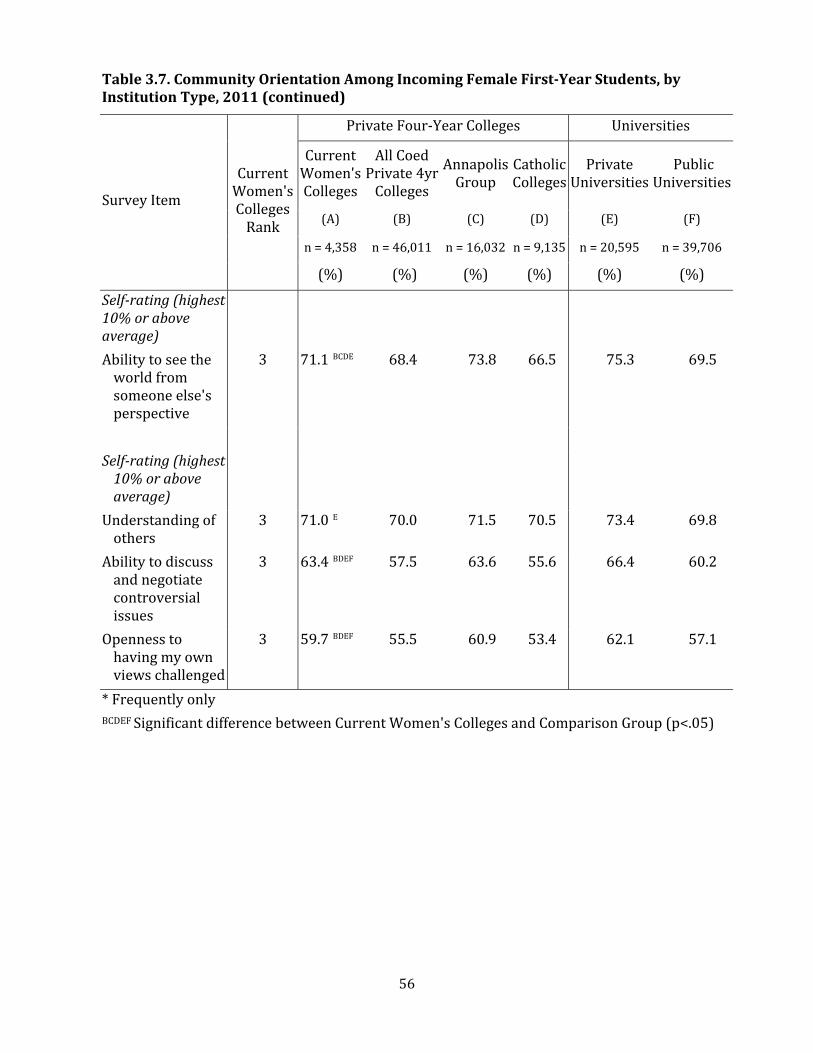
56
Table3.7.CommunityOrientationAmongIncomingFemaleFirst‐YearStudents,byInstitutionType,2011(continued)
SurveyItem
CurrentWomen'sCollegesRank
PrivateFour‐YearColleges Universities
CurrentWomen'sColleges
AllCoedPrivate4yrColleges
AnnapolisGroup
CatholicColleges
PrivateUniversities
PublicUniversities
(A) (B) (C) (D) (E) (F)
n=4,358 n=46,011 n=16,032 n=9,135 n=20,595 n=39,706
(%) (%) (%) (%) (%) (%)
Self‐rating(highest10%oraboveaverage)
Abilitytoseetheworldfromsomeoneelse'sperspective
3 71.1 BCDE 68.4 73.8 66.5 75.3 69.5
Self‐rating(highest10%oraboveaverage)
Understandingofothers
3 71.0 E 70.0 71.5 70.5 73.4 69.8
Abilitytodiscussandnegotiatecontroversialissues
3 63.4 BDEF 57.5 63.6 55.6 66.4 60.2
Opennesstohavingmyownviewschallenged
3 59.7 BDEF 55.5 60.9 53.4 62.1 57.1
*FrequentlyonlyBCDEFSignificantdifferencebetweenCurrentWomen'sCollegesandComparisonGroup(p<.05)

57
Table3.8.ArtisticInclinationAmongIncomingFemaleFirst‐YearStudents,byInstitutionType,2011
SurveyItem
CurrentWomen'sCollegesRank
PrivateFour‐YearColleges Universities
CurrentWomen'sColleges
AllCoedPrivate4yr
Colleges
AnnapolisGroup
CatholicColleges
PrivateUniversities
PublicUniversities
(A) (B) (C) (D) (E) (F)
n=4,358 n=46,011 n=16,032 n=9,135 n=20,595 n=39,706
(%) (%) (%) (%) (%) (%)
Goals(essentialorveryimportant)
Becomingaccomplishedinoneoftheperformingarts(acting,dancing,etc.)
1 20.4BCDEF 18.0 18.9 13.8 17.9 14.3
Creatingartisticwork(painting,sculpture,etc.)
1 19.7BCDEF 16.6 17.2 11.2 14.8 13.2
Writingoriginalworks(poems,novels,etc.)
1 20.6BCDEF 16.6 19.8 13.0 16.0 13.3
Self‐rating(highest10%oraboveaverage)
Creativity 2 58.6BDF 55.5 58.8 51.0 58.0 53.0Artisticability 2(T) 34.5BDF 31.9 34.5 24.9 34.7 30.3(T)Indicatesrankingtie BCDEFSignificantdifferencebetweenCurrentWomen'sCollegesandComparisonGroup(p<.05)

58
Table3.9.PsychologicalandPhysicalWell‐BeingAmongIncomingFemaleFirst‐YearStudents,byInstitutionType,2011
SurveyItem
CurrentWomen'sCollegesRank
PrivateFour‐YearColleges Universities
CurrentWomen'sColleges
AllCoedPrivate4yr
Colleges
AnnapolisGroup
CatholicColleges
PrivateUniversities
PublicUniversities
(A) (B) (C) (D) (E) (F)
n=4,358 n=46,011 n=16,032 n=9,135 n=20,595 n=39,706
(%) (%) (%) (%) (%) (%)
Self‐rating(highest10%oraboveaverage)
Self‐understanding
3 56.5BDEF 52.9 56.7 51.5 59.3 53.5
Emotionalhealth 6 43.0BCDEF 46.0 46.1 48.5 52.2 49.9Physicalhealth 6 40.7BCDEF 47.3 49.0 50.2 51.9 48.7 Expectation(verygoodchance)
Seekpersonalcounseling
1 16.3BCDEF 10.2 11.1 9.7 10.7 11.2
Activitiesinthepastyear(frequently)
FeltoverwhelmedbyallIhadtodo
1 42.4BDEF 40.9 41.9 39.4 39.9 38.3
Feltdepressed 1 11.4BCDEF 8.5 8.8 7.1 7.5 7.3BCDEFSignificantdifferencebetweenCurrentWomen'sCollegesandComparisonGroup(p<.05)

59
Table3.10.SpiritualityAmongIncomingFemaleFirst‐YearStudents,byInstitutionType,2011
SurveyItem
CurrentWomen'sCollegesRank
PrivateFour‐YearColleges Universities
CurrentWomen'sColleges
AllCoedPrivate4yr
Colleges
AnnapolisGroup
CatholicColleges
PrivateUniversities
PublicUniversities
(A) (B) (C) (D) (E) (F)
n=4,358 n=46,011 n=16,032 n=9,135 n=20,595 n=39,706
(%) (%) (%) (%) (%) (%)
Yourreligiouspreference
Protestant/Christian 1 45.6 BCDEF 43.1 36.0 26.0 31.7 40.4RomanCatholic 5 23.3 BCDEF 27.6 20.9 58.4 30.8 25.0None 4 21.7 CDEF 21.4 31.2 11.8 23.8 24.9Other 2 7.1 BCDEF 4.9 6.5 3.4 8.3 6.7Jewish 5 2.3 BCDEF 3.0 5.3 0.3 5.3 3.0 Self‐rating(highest10%oraboveaverage)
Spirituality 1 43.7 BCDEF 37.9 33.7 38.8 38.7 36.3 Goals(essentialorveryimportant)
Developingameaningfulphilosophyoflife
2 54.2 BDF 48.8 54.3 46.8 53.1 46.8
Activityinthepastyear(frequentlyoroccasionally)
Attendedareligiousservice
2 78.5 CDF 78.0 72.1 85.7 76.7 74.4
Discussedreligion* 1 38.8 BCDF 36.5 36.0 37.1 38.2 31.3*Frequentlyonly BCDEFSignificantdifferencebetweenCurrentWomen'sCollegesandComparisonGroup(p<.05)
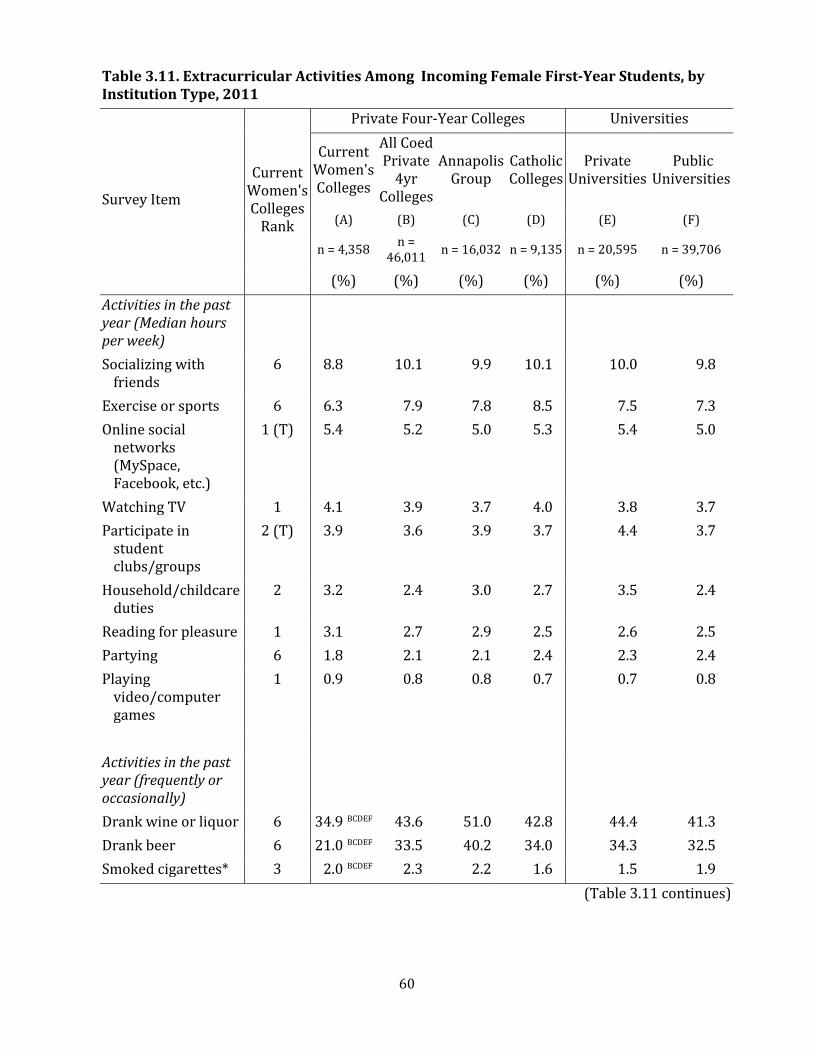
60
Table3.11.ExtracurricularActivitiesAmongIncomingFemaleFirst‐YearStudents,byInstitutionType,2011
SurveyItem
CurrentWomen'sCollegesRank
PrivateFour‐YearColleges Universities
CurrentWomen'sColleges
AllCoedPrivate4yr
Colleges
AnnapolisGroup
CatholicColleges
PrivateUniversities
PublicUniversities
(A) (B) (C) (D) (E) (F)
n=4,358 n=46,011 n=16,032 n=9,135 n=20,595 n=39,706
(%) (%) (%) (%) (%) (%)Activitiesinthepastyear(Medianhoursperweek)
Socializingwithfriends
6 8.8 10.1 9.9 10.1 10.0 9.8
Exerciseorsports 6 6.3 7.9 7.8 8.5 7.5 7.3Onlinesocialnetworks(MySpace,Facebook,etc.)
1(T) 5.4 5.2 5.0 5.3 5.4 5.0
WatchingTV 1 4.1 3.9 3.7 4.0 3.8 3.7Participateinstudentclubs/groups
2(T) 3.9 3.6 3.9 3.7 4.4 3.7
Household/childcareduties
2 3.2 2.4 3.0 2.7 3.5 2.4
Readingforpleasure 1 3.1 2.7 2.9 2.5 2.6 2.5Partying 6 1.8 2.1 2.1 2.4 2.3 2.4Playingvideo/computergames
1 0.9 0.8 0.8 0.7 0.7 0.8
Activitiesinthepastyear(frequentlyoroccasionally)
Drankwineorliquor 6 34.9 BCDEF 43.6 51.0 42.8 44.4 41.3Drankbeer 6 21.0 BCDEF 33.5 40.2 34.0 34.3 32.5Smokedcigarettes* 3 2.0 BCDEF 2.3 2.2 1.6 1.5 1.9 (Table3.11continues)
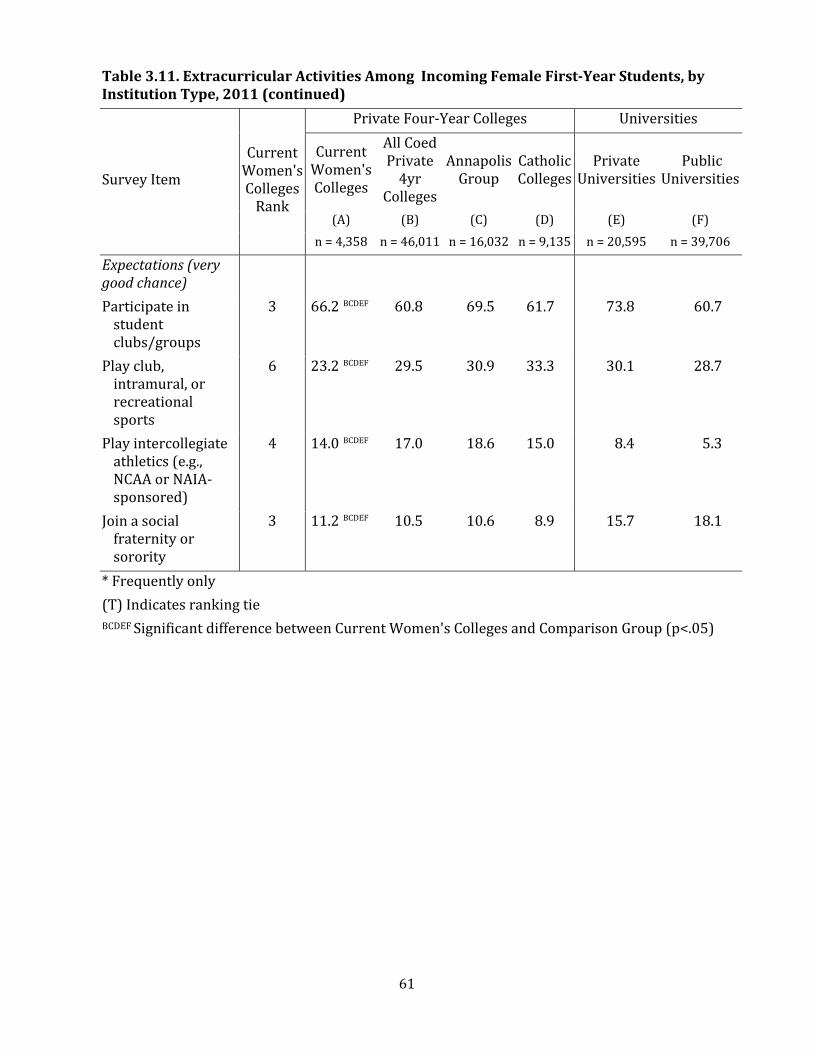
61
Table3.11.ExtracurricularActivitiesAmongIncomingFemaleFirst‐YearStudents,byInstitutionType,2011(continued)
SurveyItem
CurrentWomen'sCollegesRank
PrivateFour‐YearColleges Universities
CurrentWomen'sColleges
AllCoedPrivate4yr
Colleges
AnnapolisGroup
CatholicColleges
PrivateUniversities
PublicUniversities
(A) (B) (C) (D) (E) (F)n=4,358 n=46,011 n=16,032 n=9,135 n=20,595 n=39,706
Expectations(verygoodchance)
Participateinstudentclubs/groups
3 66.2 BCDEF 60.8 69.5 61.7 73.8 60.7
Playclub,intramural,orrecreationalsports
6 23.2 BCDEF 29.5 30.9 33.3 30.1 28.7
Playintercollegiateathletics(e.g.,NCAAorNAIA‐sponsored)
4 14.0 BCDEF 17.0 18.6 15.0 8.4 5.3
Joinasocialfraternityorsorority
3 11.2 BCDEF 10.5 10.6 8.9 15.7 18.1
*Frequentlyonly(T)Indicatesrankingtie BCDEFSignificantdifferencebetweenCurrentWomen'sCollegesandComparisonGroup(p<.05)
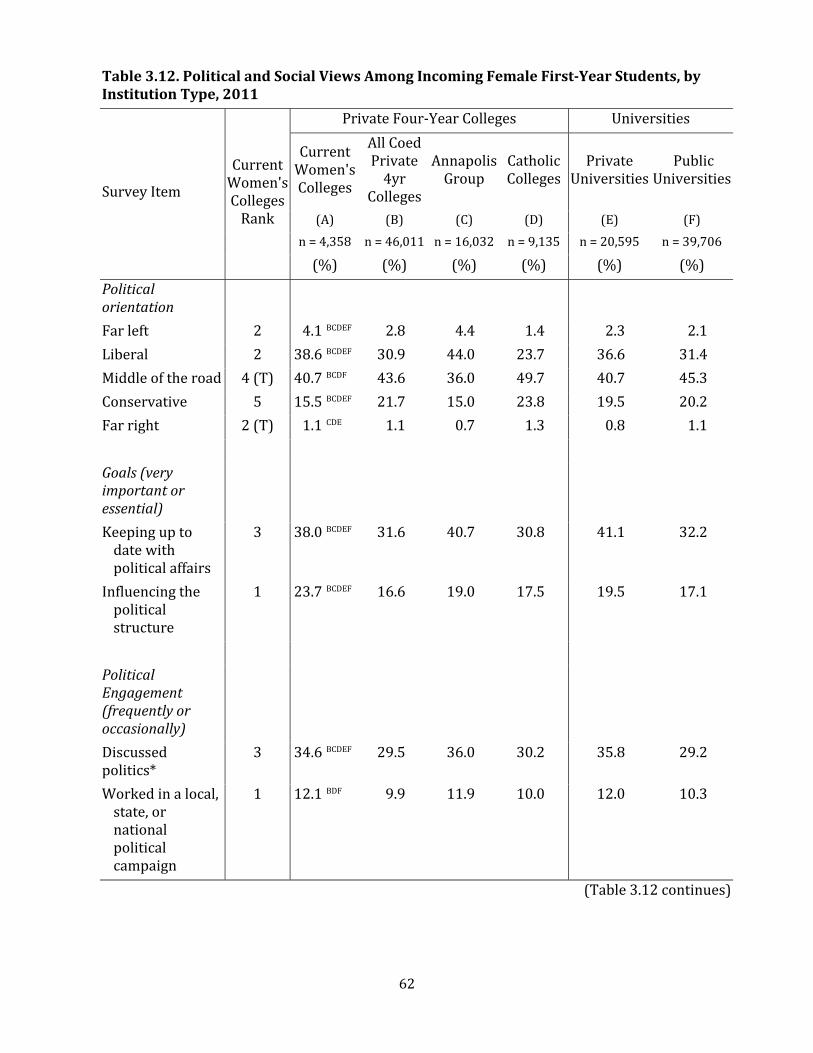
62
Table3.12.PoliticalandSocialViewsAmongIncomingFemale First‐YearStudents,byInstitutionType,2011
SurveyItem
CurrentWomen'sCollegesRank
PrivateFour‐YearColleges Universities
CurrentWomen'sColleges
AllCoedPrivate4yr
Colleges
AnnapolisGroup
CatholicColleges
PrivateUniversities
PublicUniversities
(A) (B) (C) (D) (E) (F)n=4,358 n=46,011 n=16,032 n=9,135 n=20,595 n=39,706
(%) (%) (%) (%) (%) (%)Politicalorientation
Farleft 2 4.1BCDEF 2.8 4.4 1.4 2.3 2.1Liberal 2 38.6BCDEF 30.9 44.0 23.7 36.6 31.4Middleoftheroad 4(T) 40.7BCDF 43.6 36.0 49.7 40.7 45.3Conservative 5 15.5BCDEF 21.7 15.0 23.8 19.5 20.2Farright 2(T) 1.1CDE 1.1 0.7 1.3 0.8 1.1 Goals(veryimportantoressential)
Keepinguptodatewithpoliticalaffairs
3 38.0BCDEF 31.6 40.7 30.8 41.1 32.2
Influencingthepoliticalstructure
1 23.7BCDEF 16.6 19.0 17.5 19.5 17.1
PoliticalEngagement(frequentlyoroccasionally)
Discussedpolitics*
3 34.6BCDEF 29.5 36.0 30.2 35.8 29.2
Workedinalocal,state,ornationalpoliticalcampaign
1 12.1BDF 9.9 11.9 10.0 12.0 10.3
(Table3.12continues)
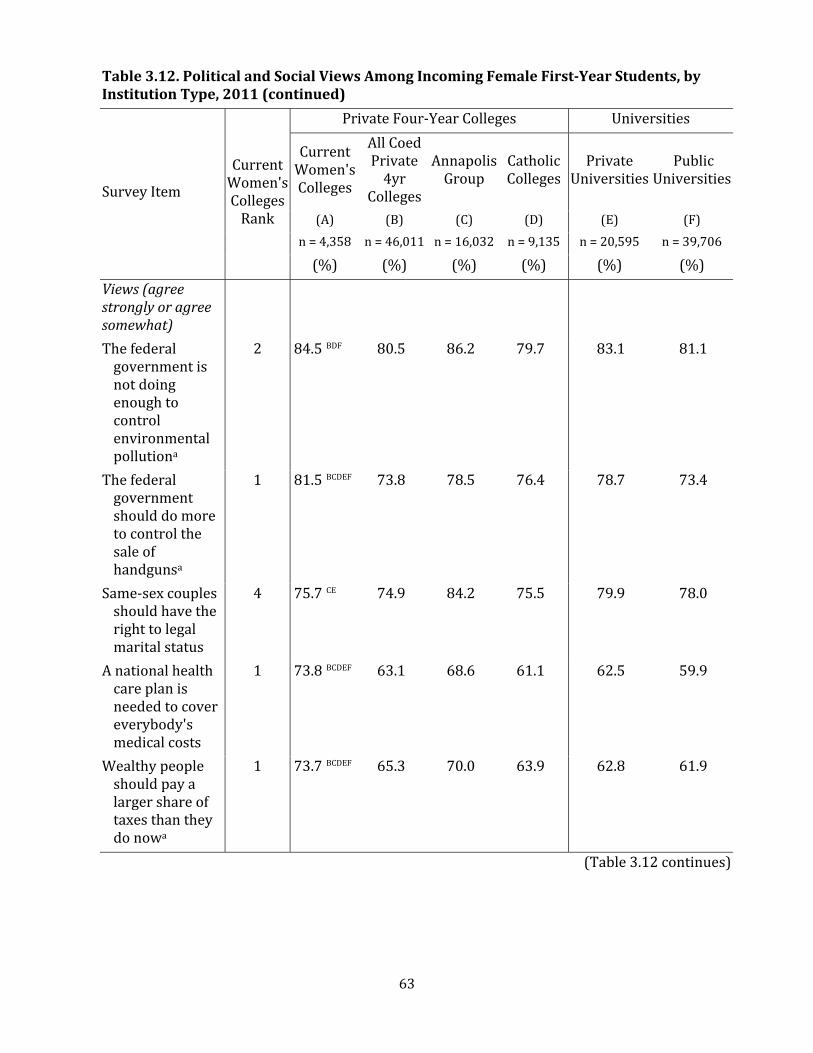
63
Table3.12.PoliticalandSocialViewsAmongIncomingFemaleFirst‐YearStudents,byInstitutionType,2011(continued)
SurveyItem
CurrentWomen'sCollegesRank
PrivateFour‐YearColleges Universities
CurrentWomen'sColleges
AllCoedPrivate4yr
Colleges
AnnapolisGroup
CatholicColleges
PrivateUniversities
PublicUniversities
(A) (B) (C) (D) (E) (F)n=4,358 n=46,011 n=16,032 n=9,135 n=20,595 n=39,706
(%) (%) (%) (%) (%) (%)Views(agreestronglyoragreesomewhat)
Thefederalgovernmentisnotdoingenoughtocontrolenvironmentalpollutiona
2 84.5BDF 80.5 86.2 79.7 83.1 81.1
Thefederalgovernmentshoulddomoretocontrolthesaleofhandgunsa
1 81.5BCDEF 73.8 78.5 76.4 78.7 73.4
Same‐sexcouplesshouldhavetherighttolegalmaritalstatus
4 75.7CE 74.9 84.2 75.5 79.9 78.0
Anationalhealthcareplanisneededtocovereverybody'smedicalcosts
1 73.8BCDEF 63.1 68.6 61.1 62.5 59.9
Wealthypeopleshouldpayalargershareoftaxesthantheydonowa
1 73.7BCDEF 65.3 70.0 63.9 62.8 61.9
(Table3.12continues)

64
Table3.12.PoliticalandSocialViewsAmongIncomingFemaleFirst‐YearStudents,byInstitutionType,2011(continued)
SurveyItem
CurrentWomen'sCollegesRank
PrivateFour‐YearColleges Universities
CurrentWomen'sColleges
AllCoedPrivate4yr
Colleges
AnnapolisGroup
CatholicColleges
PrivateUniversities
PublicUniversities
(A) (B) (C) (D) (E) (F)n=4,358 n=46,011 n=16,032 n=9,135 n=20,595 n=39,706
(%) (%) (%) (%) (%) (%)Views(agreestronglyoragreesomewhat)
Collegesshouldprohibitracist/sexistspeechoncampusb
6 69.1BCDE 72.7 72.2 71.7 73.3 69.7
Thechiefbenefitofacollegeeducationisthatitincreasesone'searningpower
3 68.0BCDE 65.0 56.7 71.1 63.1 70.1
Abortionshouldbelegal
4 60.5BCDE 58.2 71.3 51.0 65.5 62.0
Studentsfromdisadvantagedsocialbackgroundsshouldbegivenpreferentialtreatmentincollegeadmissions
1 46.7BCDEF 40.1 39.4 38.0 35.3 37.2
Thereistoomuchconcerninthecourtsfortherightsofcriminalsb
5 46.2BCDF 50.5 42.4 54.9 46.8 51.5
Marijuanashouldbelegalized
4 43.2CDE 42.1 50.5 38.0 44.8 44.0
(Table3.12continues)

65
Table3.12.PoliticalandSocialViewsAmongIncomingFemaleFirst‐YearStudents,byInstitutionType,2011(continued)
SurveyItem
CurrentWomen'sCollegesRank
PrivateFour‐YearColleges Universities
CurrentWomen'sColleges
AllCoedPrivate4yr
Colleges
AnnapolisGroup
CatholicColleges
PrivateUniversities
PublicUniversities
(A) (B) (C) (D) (E) (F)n=4,358 n=46,011 n=16,032 n=9,135 n=20,595 n=39,706
(%) (%) (%) (%) (%) (%)Views(agreestronglyoragreesomewhat)
Affirmativeactionincollegeadmissionsshouldbeabolisheda
6 41.4BCDEF 45.3 45.2 46.7 51.5 49.6
Collegeshavetherighttobanextremespeakersfromcampusb
3 38.9CD 39.8 34.6 41.0 37.9 37.8
Thefederalgovernmentshouldraisetaxestohelpreducethedeficita
2 35.6BCDF 31.1 39.4 28.2 35.4 32.2
Undocumentedimmigrantsshouldbedeniedaccesstopubliceducation
6 30.1BCDEF 39.0 31.7 42.1 35.6 40.4
Federalmilitaryspendingshouldbeincreased
4 26.4BCDEF 29.1 21.6 32.9 23.5 29.1
Realistically,anindividualcandolittletobringaboutchangesinoursocietyb
1(T) 23.5BCEF 21.9 19.2 23.5 18.8 21.4
(Table3.12continues)

66
Table3.12.PoliticalandSocialViewsAmongIncomingFemaleFirst‐YearStudents,byInstitutionType,2011(continued)
SurveyItem
CurrentWomen'sCollegesRank
PrivateFour‐YearColleges Universities
CurrentWomen'sColleges
AllCoedPrivate4yr
Colleges
AnnapolisGroup
CatholicColleges
PrivateUniversities
PublicUniversities
(A) (B) (C) (D) (E) (F)n=4,358 n=46,011 n=16,032 n=9,135 n=20,595 n=39,706
(%) (%) (%) (%) (%) (%)Views(agreestronglyoragreesomewhat)
RacialdiscriminationisnolongeramajorprobleminAmerica
6 16.2BDEF 20.7 16.6 22.2 19.7 21.4
*Frequentlyonly aOn2010survey bOn2009survey (T)Indicatesrankingtie BCDEFSignificantdifferencebetweenCurrentWomen's CollegesandComparisonGroup(p<.05)
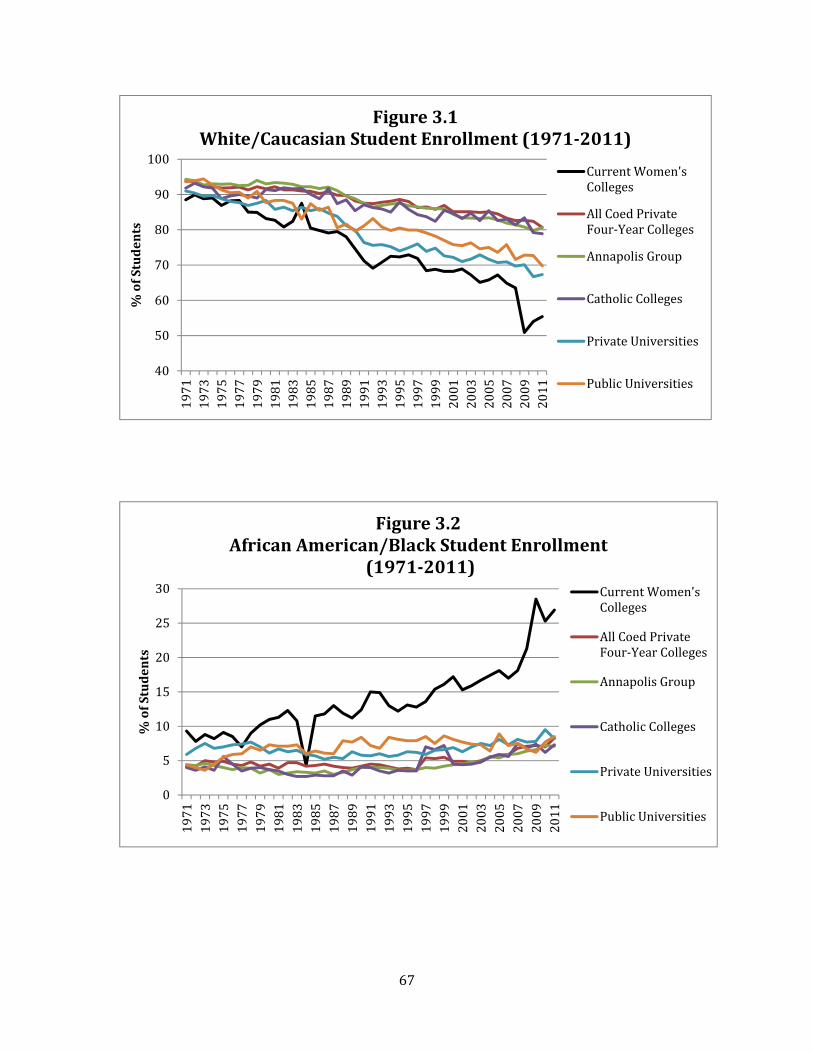
67
40
50
60
70
80
90
100
1971
1973
1975
1977
1979
1981
1983
1985
1987
1989
1991
1993
1995
1997
1999
2001
2003
2005
2007
2009
2011
%ofStudents
Figure3.1White/CaucasianStudentEnrollment(1971‐2011)
CurrentWomen'sColleges
AllCoedPrivateFour‐YearColleges
AnnapolisGroup
CatholicColleges
PrivateUniversities
PublicUniversities
0
5
10
15
20
25
30
1971
1973
1975
1977
1979
1981
1983
1985
1987
1989
1991
1993
1995
1997
1999
2001
2003
2005
2007
2009
2011
%ofStudents
Figure3.2AfricanAmerican/BlackStudentEnrollment
(1971‐2011)CurrentWomen'sColleges
AllCoedPrivateFour‐YearColleges
AnnapolisGroup
CatholicColleges
PrivateUniversities
PublicUniversities

68
02468101214161820
1971
1973
1975
1977
1979
1981
1983
1985
1987
1989
1991
1993
1995
1997
1999
2001
2003
2005
2007
2009
2011
%ofStudents
Figure3.3AsianAmerican/AsianStudentEnrollment
(1971‐2011)CurrentWomen'sColleges
AllCoedPrivateFour‐YearColleges
AnnapolisGroup
CatholicColleges
PrivateUniversities
PublicUniversities
70000
80000
90000
100000
110000
120000
130000
140000
150000
1971
1973
1975
1977
1979
1981
1983
1985
1987
1989
1991
1993
1995
1997
1999
2001
2003
2005
2007
2009
2011
Income
Figure3.4MedianParentalIncomein2011ConstantDollars
(1971‐2011)CurrentWomen'sColleges
AllCoedPrivateFour‐YearColleges
AnnapolisGroup
CatholicColleges
PrivateUniversities
PublicUniversities
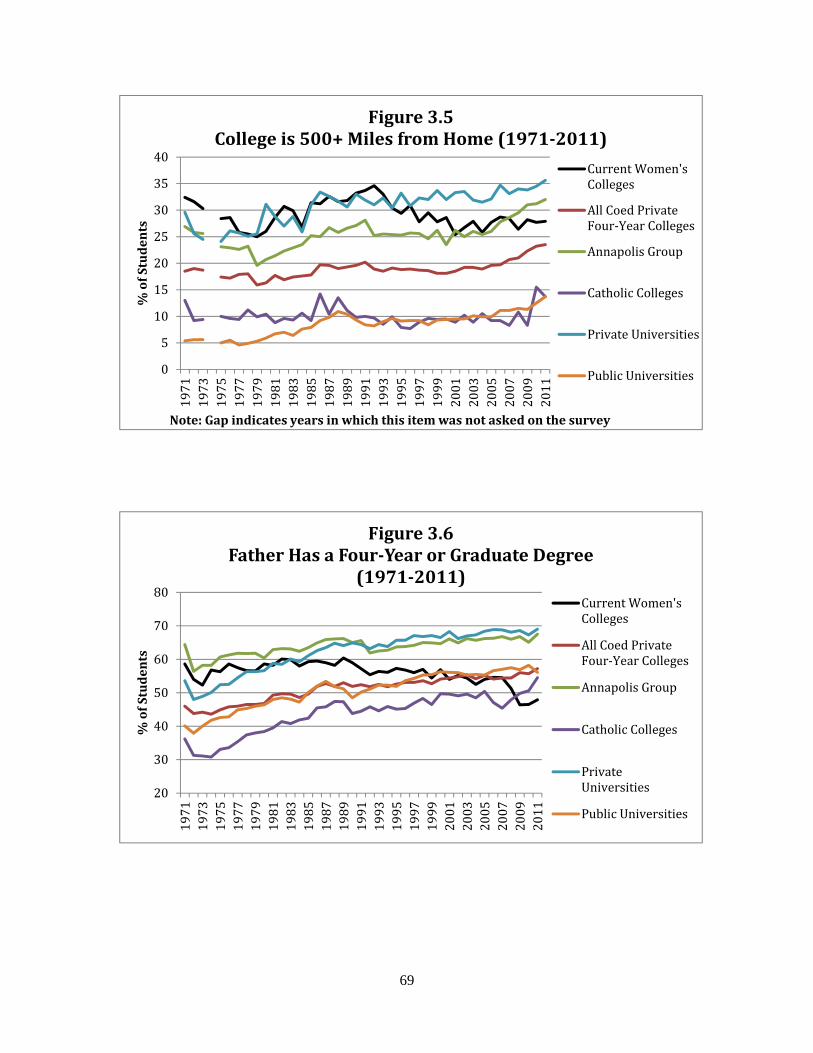
69
0
5
10
15
20
25
30
35
40
1971
1973
1975
1977
1979
1981
1983
1985
1987
1989
1991
1993
1995
1997
1999
2001
2003
2005
2007
2009
2011
%ofStudents
Note:Gapindicatesyearsinwhichthisitemwasnotaskedonthesurvey
Figure3.5Collegeis500+MilesfromHome(1971‐2011)
CurrentWomen'sColleges
AllCoedPrivateFour‐YearColleges
AnnapolisGroup
CatholicColleges
PrivateUniversities
PublicUniversities
20
30
40
50
60
70
80
1971
1973
1975
1977
1979
1981
1983
1985
1987
1989
1991
1993
1995
1997
1999
2001
2003
2005
2007
2009
2011
%ofStudents
Figure3.6FatherHasaFour‐YearorGraduateDegree
(1971‐2011)CurrentWomen'sColleges
AllCoedPrivateFour‐YearColleges
AnnapolisGroup
CatholicColleges
PrivateUniversities
PublicUniversities

70
10
20
30
40
50
60
7019
7119
7319
7519
7719
7919
8119
8319
8519
8719
8919
9119
9319
9519
9719
9920
0120
0320
0520
0720
0920
11
% o
f S
tud
ents
Figure 3.7 Mother Has a Four-Year or Graduate Degree
(1971-2011)Current Women'sColleges
All Coed PrivateFour-Year Colleges
Annapolis Group
Catholic Colleges
Private Universities
Public Universities
012345678910
1971
1973
1975
1977
1979
1981
1983
1985
1987
1989
1991
1993
1995
1997
1999
2001
2003
2005
2007
2009
2011
%ofStudents
Note:Gapindicatesyearsinwhichthisitemwasnotaskedonthesurvey
Figure3.8Father'sOccupation:Doctor(MDorDDS)
(1971‐2011)CurrentWomen'sColleges
AllCoedPrivateFour‐YearColleges
AnnapolisGroup
CatholicColleges
PrivateUniversities
PublicUniversities
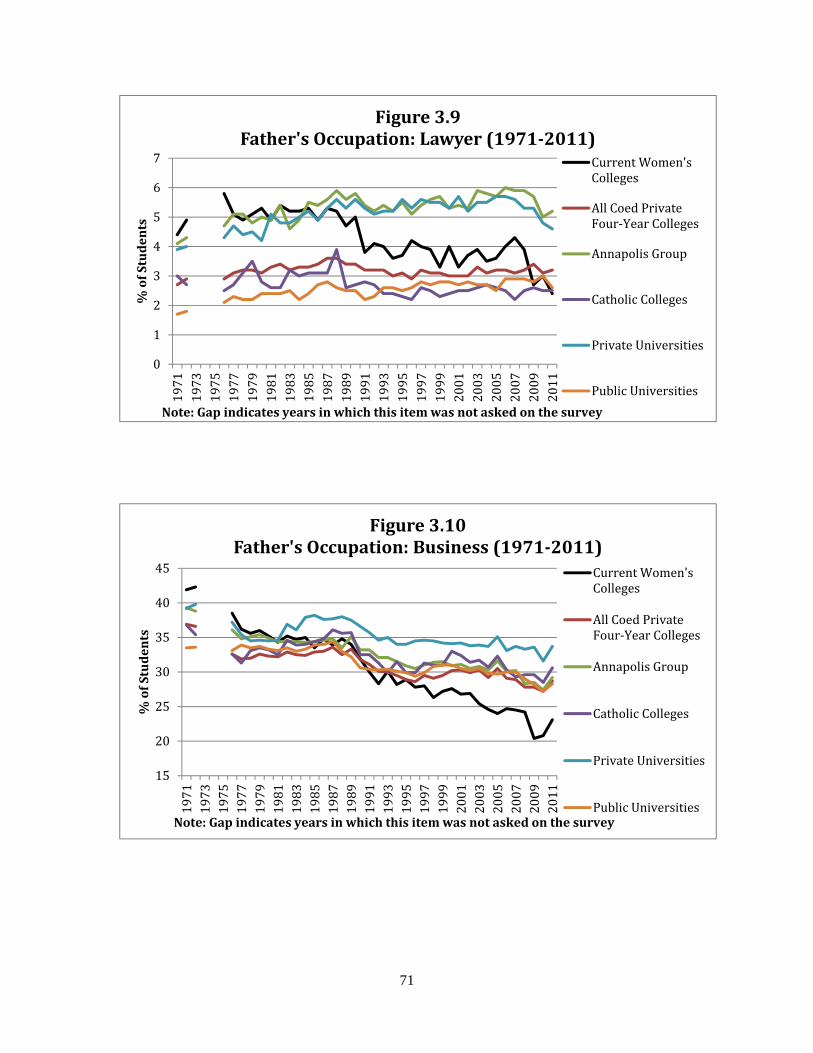
71
0
1
2
3
4
5
6
71971
1973
1975
1977
1979
1981
1983
1985
1987
1989
1991
1993
1995
1997
1999
2001
2003
2005
2007
2009
2011
%ofStudents
Note:Gapindicatesyearsinwhichthisitemwasnotaskedonthesurvey
Figure3.9Father'sOccupation:Lawyer(1971‐2011)
CurrentWomen'sColleges
AllCoedPrivateFour‐YearColleges
AnnapolisGroup
CatholicColleges
PrivateUniversities
PublicUniversities
15
20
25
30
35
40
45
1971
1973
1975
1977
1979
1981
1983
1985
1987
1989
1991
1993
1995
1997
1999
2001
2003
2005
2007
2009
2011
%ofStudents
Note:Gapindicatesyearsinwhichthisitemwasnotaskedonthesurvey
Figure3.10Father'sOccupation:Business(1971‐2011)
CurrentWomen'sColleges
AllCoedPrivateFour‐YearColleges
AnnapolisGroup
CatholicColleges
PrivateUniversities
PublicUniversities

72
0.0
0.5
1.0
1.5
2.0
2.5
3.0
3.5
4.0
1971
1973
1975
1977
1979
1981
1983
1985
1987
1989
1991
1993
1995
1997
1999
2001
2003
2005
2007
2009
2011
%ofStudents
Note:Gapindicatesyearsinwhichthisitemwasnotaskedonthesurvey
Figure3.11Father'sOccupation:Laborer(1971‐2011)
CurrentWomen'sColleges
AllCoedPrivateFour‐YearColleges
AnnapolisGroup
CatholicColleges
PrivateUniversities
PublicUniversities
0
1
2
3
4
5
6
7
8
1971
1973
1975
1977
1979
1981
1983
1985
1987
1989
1991
1993
1995
1997
1999
2001
2003
2005
2007
2009
2011
%ofStudents
Note:Gapindicatesyearsinwhichthisitemwasnotaskedonthesurvey
Figure3.12Father'sOccupation:Unemployed(1971‐2011)
CurrentWomen'sColleges
AllCoedPrivateFour‐YearColleges
AnnapolisGroup
CatholicColleges
PrivateUniversities
PublicUniversities
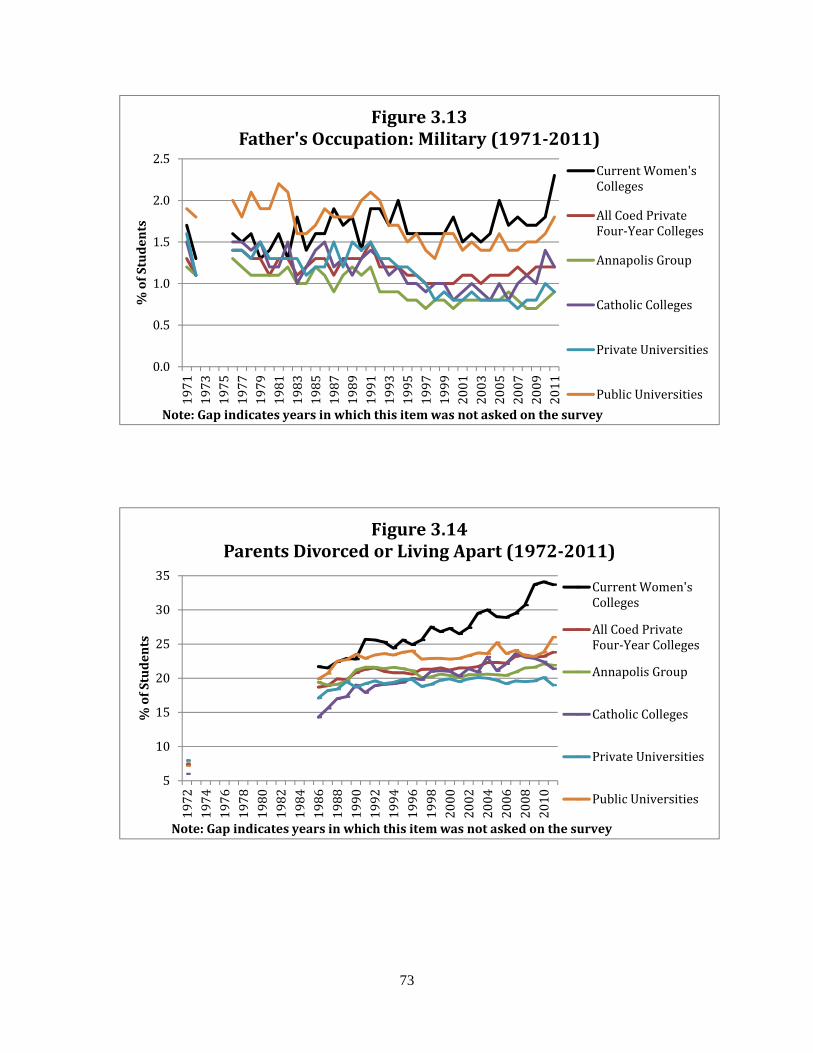
73
0.0
0.5
1.0
1.5
2.0
2.5
1971
1973
1975
1977
1979
1981
1983
1985
1987
1989
1991
1993
1995
1997
1999
2001
2003
2005
2007
2009
2011
%ofStudents
Note:Gapindicatesyearsinwhichthisitemwasnotaskedonthesurvey
Figure3.13Father'sOccupation:Military(1971‐2011)
CurrentWomen'sColleges
AllCoedPrivateFour‐YearColleges
AnnapolisGroup
CatholicColleges
PrivateUniversities
PublicUniversities
5
10
15
20
25
30
35
1972
1974
1976
1978
1980
1982
1984
1986
1988
1990
1992
1994
1996
1998
2000
2002
2004
2006
2008
2010
%ofStudents
Note:Gapindicatesyearsinwhichthisitemwasnotaskedonthesurvey
Figure3.14ParentsDivorcedorLivingApart(1972‐2011)
CurrentWomen'sColleges
AllCoedPrivateFour‐YearColleges
AnnapolisGroup
CatholicColleges
PrivateUniversities
PublicUniversities

74
10
20
30
40
50
60
70
801971
1973
1975
1977
1979
1981
1983
1985
1987
1989
1991
1993
1995
1997
1999
2001
2003
2005
2007
2009
2011
%ofStudents
Figure3.15AverageGradeinHighSchool:A+,A,orA‐
(1971‐2011)CurrentWomen'sColleges
AllCoedPrivateFour‐YearColleges
AnnapolisGroup
CatholicColleges
PrivateUniversities
PublicUniversities
5
6
7
8
9
10
11
1987
1989
1991
1993
1995
1997
1999
2001
2003
2005
2007
2009
2011
Hours
Figure3.16MedianHoursPerWeekinHighSchool:Studying/Homework(1987‐2011)
CurrentWomen'sColleges
AllCoedPrivateFour‐YearColleges
AnnapolisGroup
CatholicColleges
PrivateUniversities
PublicUniversities

75
25
30
35
40
45
50
55
601971
1973
1975
1977
1979
1981
1983
1985
1987
1989
1991
1993
1995
1997
1999
2001
2003
2005
2007
2009
2011
%ofStudents
Note:Gapsindicateyearsinwhichthisitemwasnotaskedonthesurvey
Figure3.17Self‐RatedMathematicalAbility(1971‐2011)
(%Indicating"Highest10%"or"AboveAverage")CurrentWomen'sColleges
AllCoedPrivateFour‐YearColleges
AnnapolisGroup
CatholicColleges
PrivateUniversities
PublicUniversities
55
60
65
70
75
80
85
90
1971
1973
1975
1977
1979
1981
1983
1985
1987
1989
1991
1993
1995
1997
1999
2001
2003
2005
2007
2009
2011
%ofStudents
Note:Gapsindicateyearsinwhichthisitemwasnotaskedonthesurvey
Figure3.18Self‐RatedAcademicAbility(1971‐2011)
(%Indicating"Highest10%"or"AboveAverage")CurrentWomen'sColleges
AllCoedPrivateFour‐YearColleges
AnnapolisGroup
CatholicColleges
PrivateUniversities
PublicUniversities

76
0
10
20
30
40
50
601972
1974
1976
1978
1980
1982
1984
1986
1988
1990
1992
1994
1996
1998
2000
2002
2004
2006
2008
2010
%ofStudents
Figure3.19CollegeApplicationsOtherThanCurrentCollege:
SixorMore(1971‐2011)CurrentWomen'sColleges
AllCoedPrivate4yrColleges
AnnapolisGroup
CatholicColleges
PrivateUniversities
PublicUniversitiesNote: Gap indicates years in which this item was not asked on the survey
55
60
65
70
75
80
85
1974
1976
1978
1980
1982
1984
1986
1988
1990
1992
1994
1996
1998
2000
2002
2004
2006
2008
2010
%ofStudents
Figure3.20AttendingFirstChoiceCollege(1974‐2011)
CurrentWomen'sColleges
AllCoedPrivateFour‐YearCollegesAnnapolisGroup
CatholicColleges
PrivateUniversities
PublicUniversities

77
2
3
4
5
6
7
8
9
101973
1975
1977
1979
1981
1983
1985
1987
1989
1991
1993
1995
1997
1999
2001
2003
2005
2007
2009
2011
%ofStudents
Figure3.21ReasonForAttendingThisCollege:MyTeacherAdvisedMe(1973‐2011)(%Indicating"VeryImportant")
CurrentWomen'sColleges
AllCoedPrivateFour‐YearColleges
AnnapolisGroup
CatholicColleges
PrivateUniversities
PublicUniversities
5
10
15
20
25
30
1983
1985
1987
1989
1991
1993
1995
1997
1999
2001
2003
2005
2007
2009
2011
%ofStudents
Figure3.22ReasonForAttendingThisCollege:
IWantedtoLiveNearHome(1983‐2011)(%Indicating"VeryImportant")
CurrentWomen'sColleges
AllCoedPrivateFour‐YearColleges
AnnapolisGroup
CatholicColleges
PrivateUniversities
PublicUniversities

78
0
1
2
3
4
5
6
7
81982
1984
1986
1988
1990
1992
1994
1996
1998
2000
2002
2004
2006
2008
2010
%ofStudents
Figure3.23ExpecttoWorkFull‐TimeWhileAttendingCollege(1982‐2011)
(%Indicating"VeryGoodChance")CurrentWomen'sColleges
AllCoedPrivateFour‐YearColleges
AnnapolisGroup
CatholicColleges
PrivateUniversities
PublicUniversities
5
10
15
20
25
30
1971
1973
1975
1977
1979
1981
1983
1985
1987
1989
1991
1993
1995
1997
1999
2001
2003
2005
2007
2009
2011
%ofStudents
Note:Gapsindicateyearsinwhichthisitemwasnotaskedonthesurvey
Figure3.24PercentIndicatingMajorConcernsAboutFinancing
College(1971‐2011)CurrentWomen'sColleges
AllCoedPrivateFour‐YearColleges
AnnapolisGroup
CatholicColleges
PrivateUniversities
PublicUniversities

79
0
1
2
3
4
5
6
7
8
91971
1973
1975
1977
1979
1981
1983
1985
1987
1989
1991
1993
1995
1997
1999
2001
2003
2005
2007
2009
2011
%ofStudents
Figure3.25YourProbableFieldofStudy:Engineering
(1971‐2011)
CurrentWomen'sColleges
AllCoedPrivateFour‐YearColleges
AnnapolisGroup
CatholicColleges
PrivateUniversities
PublicUniversities
3
4
5
6
7
8
9
10
1971
1973
1975
1977
1979
1981
1983
1985
1987
1989
1991
1993
1995
1997
1999
2001
2003
2005
2007
2009
2011
%ofStudents
Figure3.26YourProbableFieldofStudy:Psychology
(1971‐2011)
CurrentWomen'sColleges
AllCoedPrivateFour‐YearColleges
AnnapolisGroup
CatholicColleges
PrivateUniversities
PublicUniversities
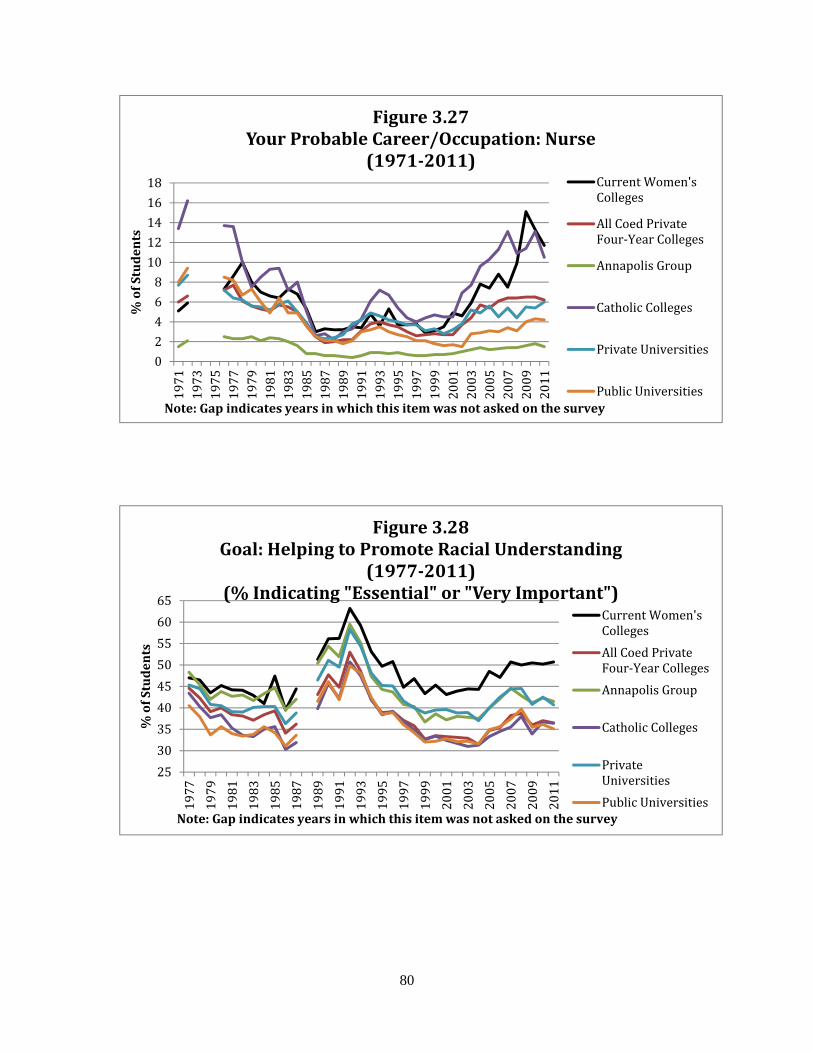
80
024681012141618
1971
1973
1975
1977
1979
1981
1983
1985
1987
1989
1991
1993
1995
1997
1999
2001
2003
2005
2007
2009
2011
%ofStudents
Note:Gapindicatesyearsinwhichthisitemwasnotaskedonthesurvey
Figure3.27YourProbableCareer/Occupation:Nurse
(1971‐2011)CurrentWomen'sColleges
AllCoedPrivateFour‐YearColleges
AnnapolisGroup
CatholicColleges
PrivateUniversities
PublicUniversities
253035404550556065
1977
1979
1981
1983
1985
1987
1989
1991
1993
1995
1997
1999
2001
2003
2005
2007
2009
2011
%ofStudents
Note:Gapindicatesyearsinwhichthisitemwasnotaskedonthesurvey
Figure3.28Goal:HelpingtoPromoteRacialUnderstanding
(1977‐2011)(%Indicating"Essential"or"VeryImportant")
CurrentWomen'sCollegesAllCoedPrivateFour‐YearCollegesAnnapolisGroup
CatholicColleges
PrivateUniversitiesPublicUniversities

81
25
30
35
40
45
50
55
601971
1973
1975
1977
1979
1981
1983
1985
1987
1989
1991
1993
1995
1997
1999
2001
2003
2005
2007
2009
2011
%ofStudents
Note:Gapindicatesyearsinwhichthisitemwasnotaskedonthesurvey
Figure3.29Goal:InfluencingSocialValues(1971‐2011)(%Indicating"Essential"or"VeryImportant")
CurrentWomen'sColleges
AllCoedPrivateFour‐YearColleges
AnnapolisGroup
CatholicColleges
PrivateUniversities
PublicUniversities
1.0
1.5
2.0
2.5
3.0
3.5
4.0
1987
1989
1991
1993
1995
1997
1999
2001
2003
2005
2007
2009
2011
Hours
Figure3.30MedianHoursPerWeekinHighSchool:
VolunteerWork(1987‐2011)CurrentWomen'sColleges
AllCoedPrivateFour‐YearColleges
AnnapolisGroup
CatholicColleges
PrivateUniversities
PublicUniversities
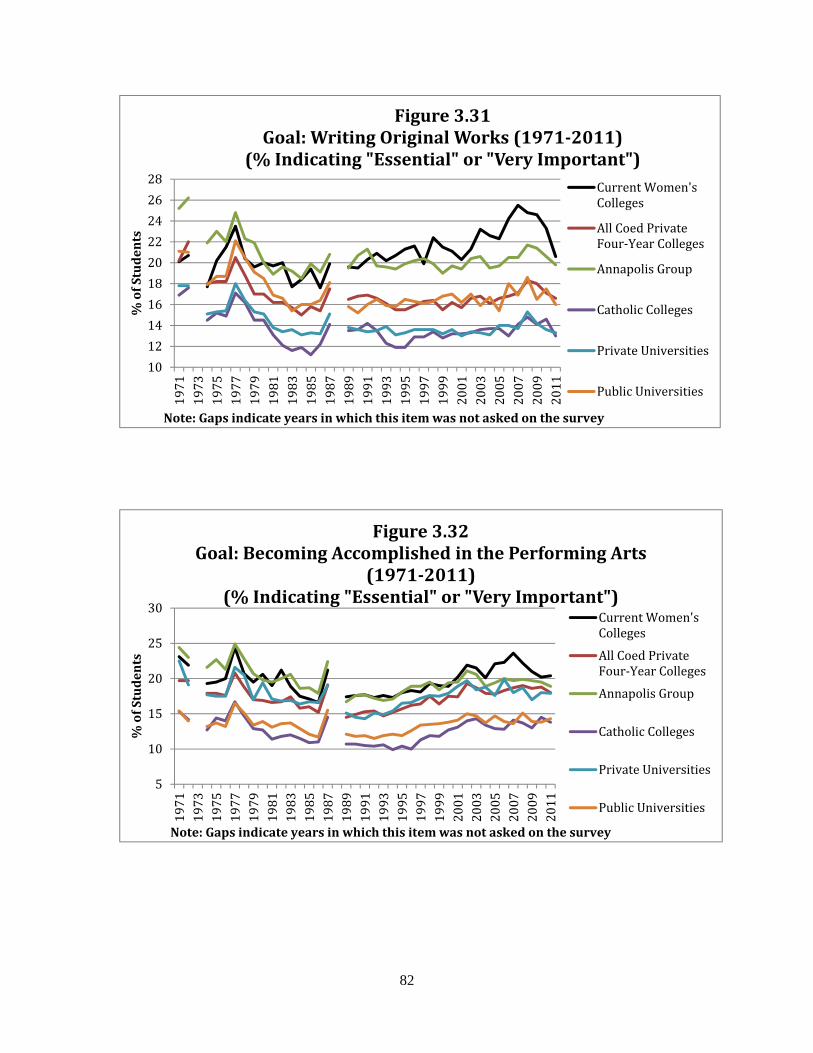
82
10121416182022242628
1971
1973
1975
1977
1979
1981
1983
1985
1987
1989
1991
1993
1995
1997
1999
2001
2003
2005
2007
2009
2011
%ofStudents
Note:Gapsindicateyearsinwhichthisitemwasnotaskedonthesurvey
Figure3.31Goal:WritingOriginalWorks(1971‐2011)
(%Indicating"Essential"or"VeryImportant")CurrentWomen'sColleges
AllCoedPrivateFour‐YearColleges
AnnapolisGroup
CatholicColleges
PrivateUniversities
PublicUniversities
5
10
15
20
25
30
1971
1973
1975
1977
1979
1981
1983
1985
1987
1989
1991
1993
1995
1997
1999
2001
2003
2005
2007
2009
2011
%ofStudents
Note:Gapsindicateyearsinwhichthisitemwasnotaskedonthesurvey
Figure3.32Goal:BecomingAccomplishedinthePerformingArts
(1971‐2011)(%Indicating"Essential"or"VeryImportant")
CurrentWomen'sColleges
AllCoedPrivateFour‐YearColleges
AnnapolisGroup
CatholicColleges
PrivateUniversities
PublicUniversities
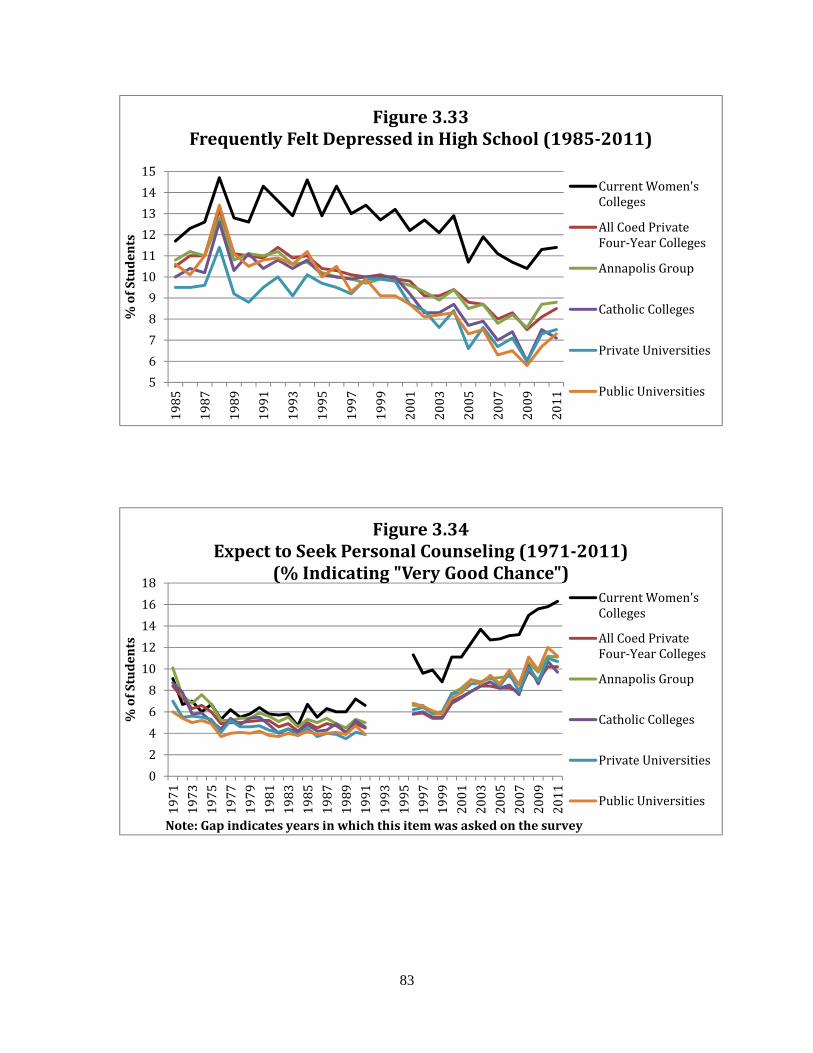
83
56789101112131415
1985
1987
1989
1991
1993
1995
1997
1999
2001
2003
2005
2007
2009
2011
%ofStudents
Figure3.33FrequentlyFeltDepressedinHighSchool(1985‐2011)
CurrentWomen'sColleges
AllCoedPrivateFour‐YearColleges
AnnapolisGroup
CatholicColleges
PrivateUniversities
PublicUniversities
024681012141618
1971
1973
1975
1977
1979
1981
1983
1985
1987
1989
1991
1993
1995
1997
1999
2001
2003
2005
2007
2009
2011
%ofStudents
Note:Gapindicatesyearsinwhichthisitemwasaskedonthesurvey
Figure3.34ExpecttoSeekPersonalCounseling(1971‐2011)
(%Indicating"VeryGoodChance")CurrentWomen'sColleges
AllCoedPrivateFour‐YearColleges
AnnapolisGroup
CatholicColleges
PrivateUniversities
PublicUniversities

84
5.0
5.5
6.0
6.5
7.0
7.5
8.0
8.5
9.01987
1989
1991
1993
1995
1997
1999
2001
2003
2005
2007
2009
2011
Hours
Figure3.35MedianHoursPerWeekinHighSchool:
ExerciseorSports(1987‐2011)CurrentWomen'sColleges
AllCoedPrivateFour‐YearColleges
AnnapolisGroup
CatholicColleges
PrivateUniversities
PublicUniversities
45
50
55
60
65
70
75
80
1972
1974
1976
1978
1980
1982
1984
1986
1988
1990
1992
1994
1996
1998
2000
2002
2004
2006
2008
2010
%ofStudents
Note:Gapsindicateyearsinwhichthisitemwasnotaskedonthesurvey
Figure3.36BeliefthatWealthyPeopleShouldPayaLargerShareof
TaxesThanTheyDoNow(1972‐2010)(%Indicating"AgreeStrongly"or"AgreeSomewhat")
CurrentWomen'sColleges
AllCoedPrivateFour‐YearColleges
AnnapolisGroup
CatholicColleges
PrivateUniversities
PublicUniversities

85
APPENDICESA‐D

Appendix A
86

Appendix A
87
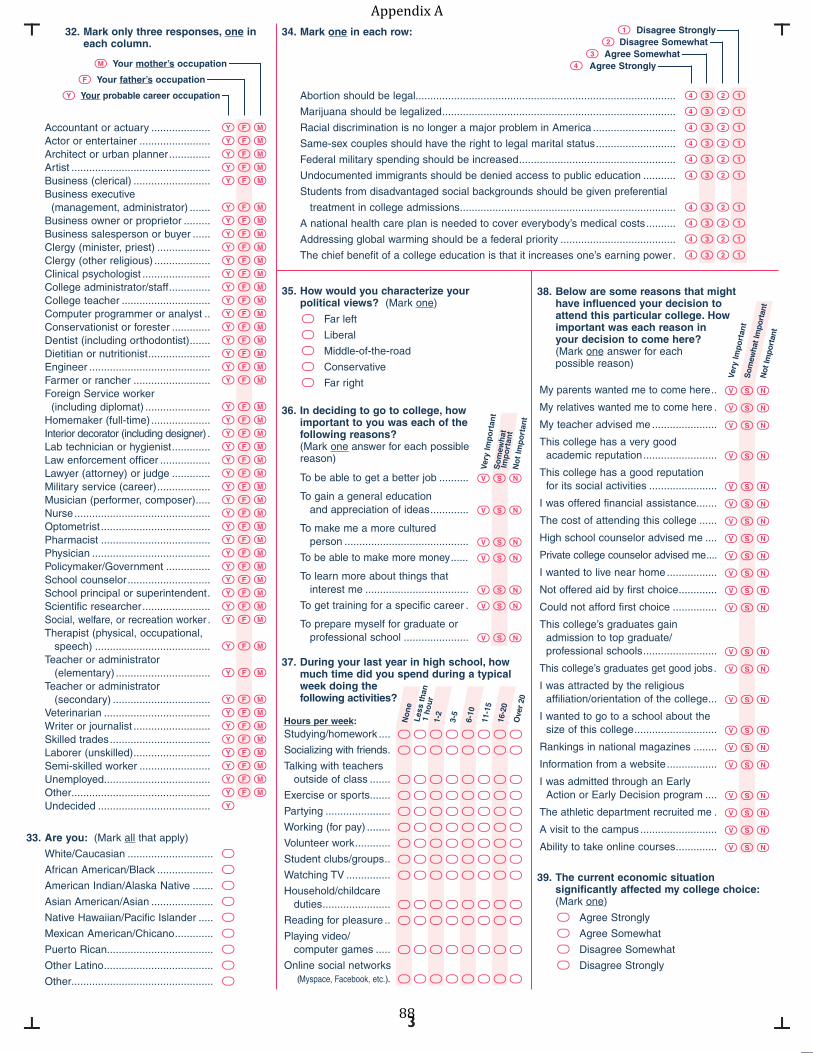
Appendix A
88

Appendix A
89
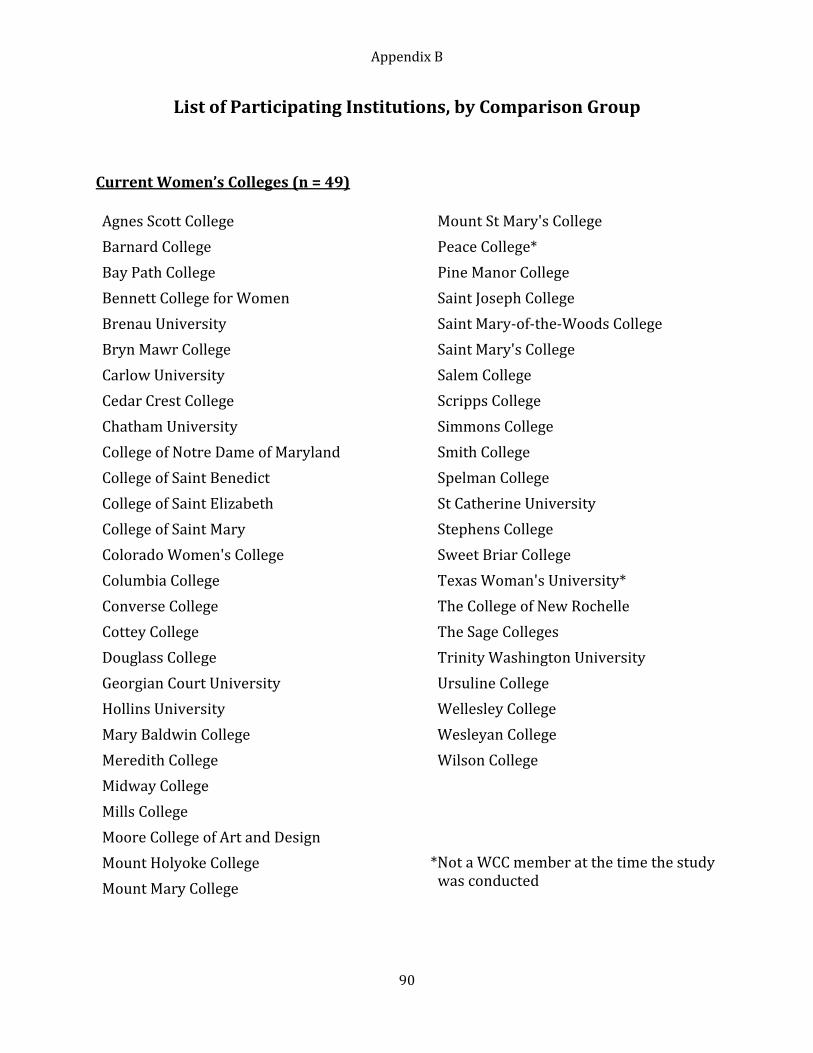
Appendix B
List of Participating Institutions, by Comparison Group
Current Women’s Colleges (n = 49)
Agnes Scott College Barnard College Bay Path College Bennett College for WomenBrenau University Bryn Mawr CollegeCarlow University Cedar Crest College Chatham University College of Notre Dame of Maryland College of Saint Benedict College of Saint Elizabeth College of Saint Mary Colorado Women's College Columbia College Converse College Cottey College Douglass College Georgian Court University Hollins UniversityMary Baldwin College Meredith College Midway College Mills College Moore College of Art and Design Mount Holyoke College Mount Mary College
Mount St Mary's College Peace College*Pine Manor College Saint Joseph College Saint Mary-of-the-Woods College Saint Mary's College Salem College Scripps College Simmons College Smith College Spelman College St Catherine University Stephens College Sweet Briar College Texas Woman's University*The College of New RochelleThe Sage Colleges Trinity Washington University Ursuline College Wellesley College Wesleyan CollegeWilson College
*Not a WCC member at the time the studywas conducted
90

Appendix B
All Coed Private Four-Year Colleges (n = 747)
Abilene Christian University Adrian College Alaska Pacific University Albion College Albright College Alderson Broaddus College Alfred University Allegheny College Alliance College Alliant International University Alma College Alvernia University American College of Applied Art American InterContinental University-Atlanta American Intercontinental University-Los Angeles American International College Amherst College Anderson University-Indiana Anderson University-South Carolina Andrews University Anna Maria College Antioch College Antioch College-Washington/Balt Aquinas College at Newton Aquinas College-Grand Rapids Art Center College of Design Asbury University Ashland University Assumption College Athens State University
Atlanta Christian College Atlanta College of Art Atlantic Union College Augsburg College Augustana College-Illinois Augustana College-South Dakota Aurora University Austin College Ave Maria University Averett University Avila University Azusa Pacific University Babson College Bacone College Baker University Baldwin-Wallace College Baptist Bible College and Seminary Baptist Medical System School of Nursing Barat College Bard College Bard College at Simon's Rock Barrington College Barton College Bates College Belhaven University Bellarmine University Bellarmine-Ursuline College Bellevue University Belmont Abbey College Belmont University Beloit College
91

Appendix B
Benedictine College Benedictine University Bennington College Bentley University Berea College Berry College Bethany College-Kansas Bethany College-West Virginia Bethany Lutheran College Bethel College-Mishawaka Bethel College-North Newton Bethel University-McKenzie Bethel University-Saint Paul Biola University Birmingham Southern College Blackburn College Bloomfield College Bluffton University Bowdoin College Bradford College Bradley University Brevard College Briarcliffe College Bridgewater College Brigham Young University-Hawaii Brown University Bryan College-Dayton Bryant University Bryn Athyn College of the New Church Bucknell University Buena Vista University Butler University Cabrini College
Caldwell College California Baptist University California College of the Arts California Institute of Technology California Institute of the Arts California Lutheran University Calvin College Campbell University Campbellsville University Canisius College Capital University Cardinal Stritch University Carleton College Carroll College Carroll University Carson-Newman College Carthage College Catawba College Cedarville University Centenary College of Louisiana Central College Central Methodist University-College of Liberal Arts & Sciences Centre College Chaminade University of Honolulu Champlain College Chancellor University Chapman University Charleston Southern University Chowan University Christian Brothers University Claremont McKenna College Clark University
92

Appendix B
Clarkson College Clarkson University Clearwater Christian College Cleveland Institute of Art Cleveland Institute of Music Coe College Cogswell Polytechnical College Coker College Colby College Colgate University College for Creative Studies College of Charleston College of Emporia College of Our Lady of the Elms College of Saint Teresa College of the Atlantic College of the Holy Cross Colorado Christian University Colorado College Colorado Heights University Columbia International University Columbus College of Art and Design Concordia College at Moorhead Concordia College-New York Concordia University-Irvine Concordia University-Portland Concordia University-Seward Concordia University-Texas Connecticut College Cooper Union for the Advancement of Science and Art Corban University Corcoran College of Art and Design
Cornell College Cornerstone University Cornish College of the Arts Covenant College Creighton University Crossroads College Crown College Culver-Stockton College Cumberland University Curry College Daemen College Dakota Wesleyan University Dana College Daniel Webster College Dartmouth College Davidson College Davis & Elkins College Defiance College Delaware Valley College Denison University DePauw University DeSales University DeVry University-Illinois DeVry University-Ohio Dickinson College Doane College-Crete Dominican College of Blauvelt Dominican College-Racine Dominican University Dominican University of California Dordt College Drew University Drexel University
93
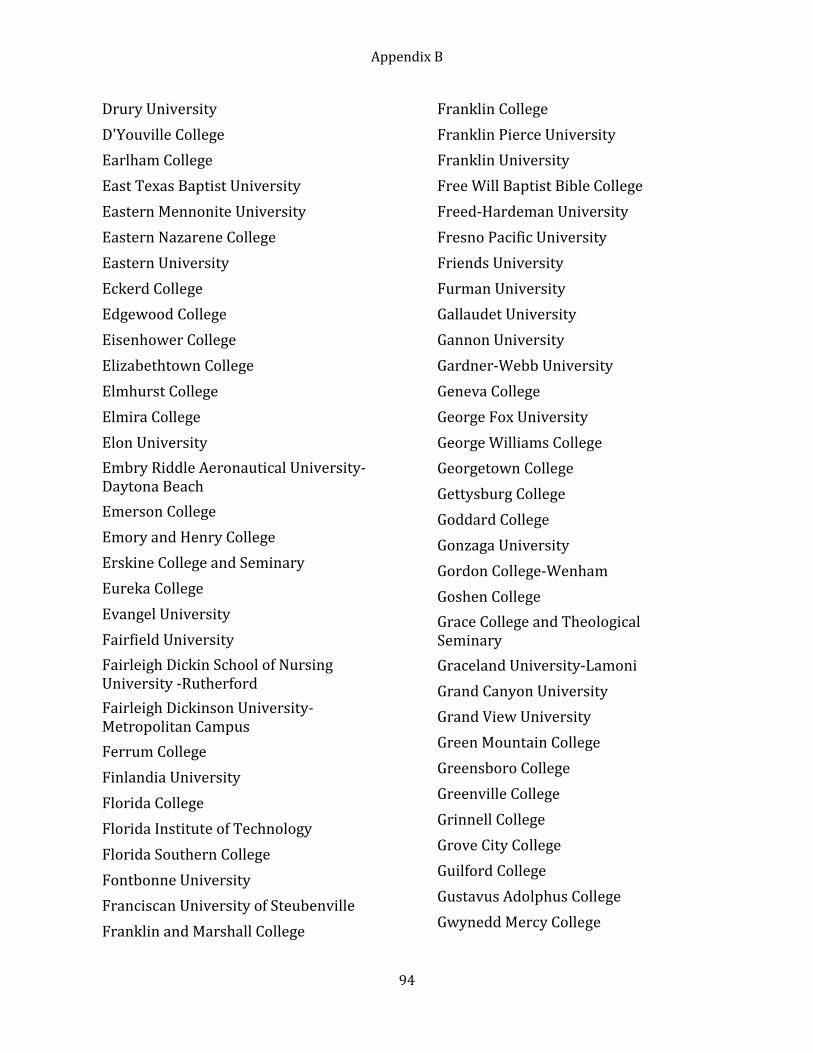
Appendix B
Drury University D'Youville College Earlham College East Texas Baptist University Eastern Mennonite University Eastern Nazarene College Eastern University Eckerd College Edgewood College Eisenhower College Elizabethtown College Elmhurst College Elmira College Elon University Embry Riddle Aeronautical University-Daytona Beach Emerson College Emory and Henry College Erskine College and Seminary Eureka College Evangel University Fairfield University Fairleigh Dickin School of Nursing University -Rutherford Fairleigh Dickinson University-Metropolitan Campus Ferrum College Finlandia University Florida College Florida Institute of Technology Florida Southern College Fontbonne University Franciscan University of Steubenville Franklin and Marshall College
Franklin College Franklin Pierce University Franklin University Free Will Baptist Bible College Freed-Hardeman University Fresno Pacific University Friends University Furman University Gallaudet University Gannon University Gardner-Webb University Geneva College George Fox University George Williams College Georgetown College Gettysburg College Goddard College Gonzaga University Gordon College-Wenham Goshen College Grace College and Theological Seminary Graceland University-Lamoni Grand Canyon University Grand View University Green Mountain College Greensboro College Greenville College Grinnell College Grove City College Guilford College Gustavus Adolphus College Gwynedd Mercy College
94
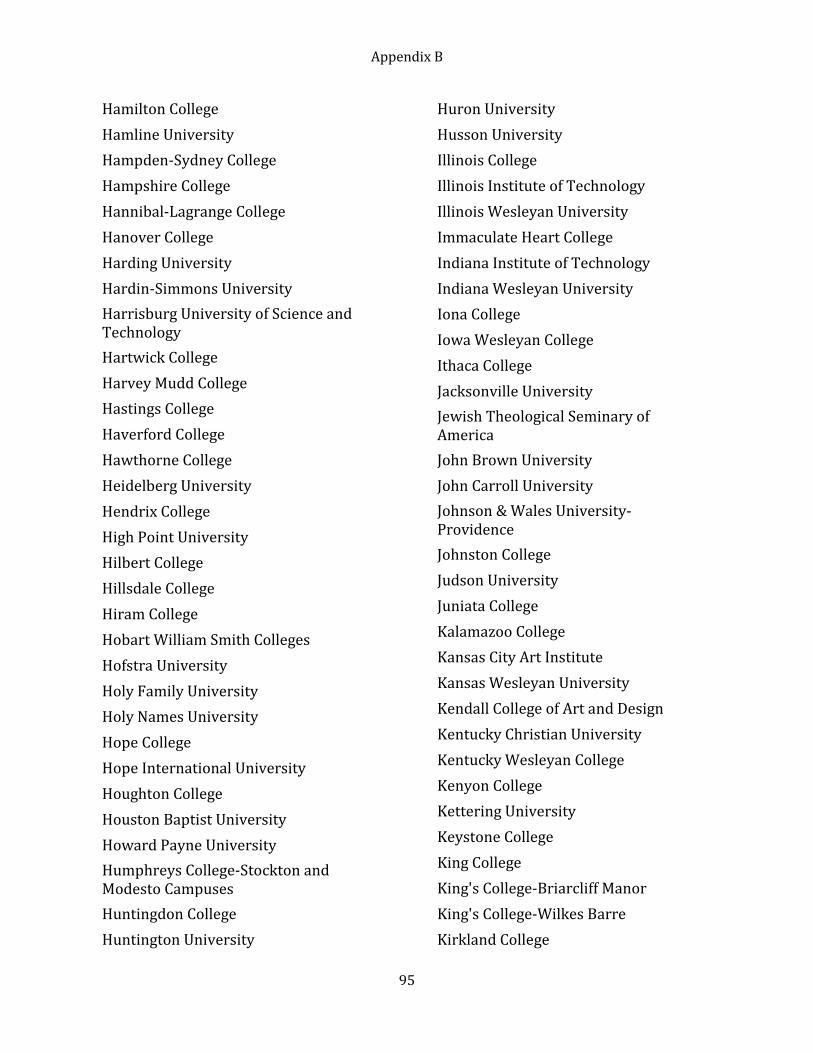
Appendix B
Hamilton College Hamline University Hampden-Sydney College Hampshire College Hannibal-Lagrange College Hanover College Harding University Hardin-Simmons University Harrisburg University of Science and Technology Hartwick College Harvey Mudd College Hastings College Haverford College Hawthorne College Heidelberg University Hendrix College High Point University Hilbert College Hillsdale College Hiram College Hobart William Smith Colleges Hofstra University Holy Family University Holy Names University Hope College Hope International University Houghton College Houston Baptist University Howard Payne University Humphreys College-Stockton and Modesto Campuses Huntingdon College Huntington University
Huron University Husson University Illinois College Illinois Institute of Technology Illinois Wesleyan University Immaculate Heart College Indiana Institute of Technology Indiana Wesleyan University Iona College Iowa Wesleyan College Ithaca College Jacksonville University Jewish Theological Seminary of America John Brown University John Carroll University Johnson & Wales University-Providence Johnston College Judson University Juniata College Kalamazoo College Kansas City Art Institute Kansas Wesleyan University Kendall College of Art and Design Kentucky Christian University Kentucky Wesleyan College Kenyon College Kettering University Keystone College King College King's College-Briarcliff Manor King's College-Wilkes Barre Kirkland College
95

Appendix B
Knox College Kuyper College La Roche College La Salle University Lafayette College LaGrange College Laguna College of Art and Design Lake Forest College Lakeland College Lambuth University Landmark College Lasell College Lawrence Technological University Lawrence University Le Moyne College Lebanon Valley College Lee University Lees-McRae College Lehigh University Lenoir-Rhyne University LeTourneau University Lewis & Clark College Lewis University Limestone College Lincoln Christian University Lincoln Memorial University Lindenwood University Linfield College Lipscomb University Lone Mountain College Long Island University-C W Post Campus Long Island University-Regional Campuses
Loras College Louisiana College Loyola University California Loyola University-Baltimore Lubbock Christian University Luther College Lycoming College Lynchburg College Lynn University Lyon College Macalester College MacMurray College Maharishi University of Management Maine College of Art Malone University Manchester College Manhattan College Manhattanville College Marian University-Wisconsin Marietta College Marist College Marlboro College Mars Hill College Martin Methodist College Mary Manse College Marygrove College Maryland Institute College of Art Marymount College of Fordham University Marymount College of Kansas Maryville College Maryville University of Saint Louis Massachusetts College of Pharmacy and Health Sciences
96
Appendix B
McKendree University McMurry University McPherson College Medaille College Memphis College of Art Menlo College Mercer University-Macon Mercy College-Dobbs Ferry Mercyhurst College Merrimack College Messiah College MidAmerica Nazarene University Mid-Atlantic Christian University Middlebury College Milligan College Millikin University Millsaps College Milton College Milwaukee Institute of Art & Design Milwaukee School of Engineering Minneapolis College of Art and Design Mississippi College Missouri Baptist University Missouri Valley College Molloy College Monmouth College Monmouth University Montreat College Montserrat College of Art Moravian College and Moravian Theological Seminary Morningside College Mount Aloysius College
Mount Ida College Mount Mercy University Mount Olive College Mount Saint Mary College Mount Saint Scholastica College Mount Senario College Mount St Mary's University Mount Vernon College Mount Vernon Nazarene University Muhlenberg College Mundelein College Muskingum University Naropa University NasSchool of Nursing College National-Louis University Nazareth College Nazareth College-Kalamazoo Nebraska Methodist College of Nursing & Allied Health Nebraska Wesleyan University Neumann University New College of Florida New England College Newberry College Niagara University North Carolina Wesleyan College North Central College North Central University North Greenville University North Park University Northland College Northwest Christian University Northwest Nazarene University
97

Appendix B
Northwest University Northwestern College-Orange City Northwestern College-Saint Paul Notre Dame College-Manchester Nova Southeastern University Nyack College Oakland City University Oberlin College Occidental College Oglethorpe University Ohio Dominican University Ohio Northern University Ohio Wesleyan University Oklahoma Baptist University Oklahoma Christian University Oklahoma City University Oklahoma Wesleyan University Olivet College Olivet Nazarene University Ona M Wilcox School of Nursing Oral Roberts University Oregon College of Art and Craft Otis College of Art and Design Ottawa University-Ottawa Otterbein University Ouachita Baptist University Our Lady of the Lake College Our Lady of the Lake University-San Antonio Oxford College of Emory University Pace University-New York Pace University-Pleasantville Pace University-White Plains
Pacific Lutheran University Pacific Northwest College of Art Pacific Union College Pacific University Palm Beach Atlantic University-West Palm Beach Park University Parks College of Saint Louis University ParSchool of Nursings College Patrick Henry College Pepperdine University Pfeiffer University Philadelphia Biblical University-Langhorne Philadelphia University Phillips University Piedmont College Pikeville College Pitzer College Point Loma Nazarene University Point Park University Polytechnic Institute of New York University Pomona College Post University Pratt Institute-Main Presbyterian College Prescott College Presentation College Principia College Providence College Quincy University Quinnipiac University Randolph College
98
Appendix B
Randolph-Macon College Reed College Regis University Reinhardt University Rhode Island School of Design Rhodes College Richmond College Rider University Ringling College of Art and Design Ripon College Roanoke College Robert Morris College-Pittsburgh Robert Morris University Robert Morris University-Illinois Roberts Wesleyan College Rochester Institute of Technology Rockford College Rockhurst University Rocky Mountain College Roger Williams University Rollins College Roosevelt University Rose-Hulman Institute of Technology Sacred Heart University Sage College of Albany Saint Ambrose University Saint Anselm College Saint Bonaventure University Saint Catharine College Saint Edward's University Saint Francis University Saint John College Saint John Fisher College
Saint John's College-Santa Fe Saint John's College-Winfield Saint Johns University-St Joseph Saint Josephs College Saint Joseph's College of Maine Saint Joseph's College-New York Saint Joseph's University Saint Leo University Saint Louis Conservatory of Music Saint Martin's University Saint Mary of the Plains College Saint Marys College of California Saint Mary's College-Orchard Lake Saint Mary's Dominican College Saint Mary's University of Minnesota Saint Michael's College Saint Norbert College Saint Peter's College Saint Thomas Aquinas College Saint Thomas University Saint Vincent College Saint Vincent's School of Nursing Saint Xavier University Salem International University Salve Regina University Samford University San Diego Christian College San Francisco Art Institute Santa Clara University Santa Fe University of Art and Design Sarah Lawrence College Savannah College of Art and Design School of the Art Institute
99
Appendix B
School of the Art Institute of Chicago School of the Museum of Fine Arts-Boston School of Visual Arts Schreiner University Seattle Pacific University Seattle University Sewanee-The University of the South Sheldon JackSchool of Nursing College Shorter University Siena College Siena Heights University Silver Lake College Simpson College Simpson University Skidmore College Southeastern University-Lakeland Southern Adventist University Southern Nazarene University Southern New Hampshire University Southern Vermont College Southern Wesleyan University Southwest Baptist University Southwestern Adventist University Southwestern College-Winfield Southwestern University Spalding University Spring Arbor University Spring Hill College Springfield College St Andrews Presbyterian College St Francis College St Lawrence University
St Louis College of Pharmacy St Marys University St Olaf College Sterling College-Kansas Stetson University Stevens Institute of Technology Stevenson University Stonehill College Suffolk University Susquehanna University Swain School of Design Swarthmore College Tabor College Taylor University Taylor University Fort Wayne Tennessee Temple University Texas Lutheran University Texas Wesleyan University The Art Institute of Boston The College of Idaho The College of Saint Rose The College of Saint Scholastica The College of Wooster The Illinois Institute of Art-Chicago The Master's College and Seminary The New School The University of Findlay The University of Tampa The University of Tennessee at Chattanooga The University of the Arts Thiel College Thomas More College
100

Appendix B
Toccoa Falls College Touro College Transylvania University Trevecca Nazarene University Trinity Christian College Trinity College Trinity College of Vermont Trinity International University-Illinois Trinity University Trinity Western University Tusculum College Union College-Barbourville Union College-Lincoln Union College-Schenectady Union University Unity College University of Bridgeport University of Charleston University of Dallas University of Dayton University of Detroit Mercy University of Evansville University of Hartford University of Indianapolis University of La Verne University of Mary University of Mary Hardin-Baylor University of Mobile University of Mount Union University of New Haven University of Portland University of Puget Sound
University of Redlands University of Richmond University of Rio Grande University of San Diego University of San Francisco University of Scranton University of Sioux Falls University of St Francis University of St Thomas-St Paul University of the Ozarks University of the Sciences-Philadelphia University of the Southwest Upsala College Urbana University Ursinus College Utica College Valparaiso University Vanguard University of Southern California Vassar College Villa Maria College Villa Maria College-Buffalo Virginia Intermont College Virginia Wesleyan College Viterbo University Wabash College Wagner College Walla Walla University Walsh University Warner Pacific College Warner University Warren Wilson College Wartburg College
101
Appendix B
Washington & Jefferson College Washington and Lee University Washington College Wayland Baptist University Waynesburg University Webb Institute Webber International University Webster University Wentworth Institute of Technology Wesley College Wesleyan University West Virginia Wesleyan College Westbrook College Western New England University Westmar University Westminster College-Fulton Westminster College-New Wilmington Westminster College-Salt Lake City Westmont College Wheaton College Wheeling Jesuit University Wheelock College Whitman College
Whittier College Whitworth University Widener University-Main Campus Wilkes University Willamette University William Carey University William Jewell College William Tyndale College Williams Baptist College Williams College Wilmington College Wingate University Wisconsin Lutheran College Wittenberg University Wofford College Woodbury University Worcester Polytechnic Institute Xavier University of Louisiana Xavier University-Cincinnati Yankton College York College Pennsylvania
102
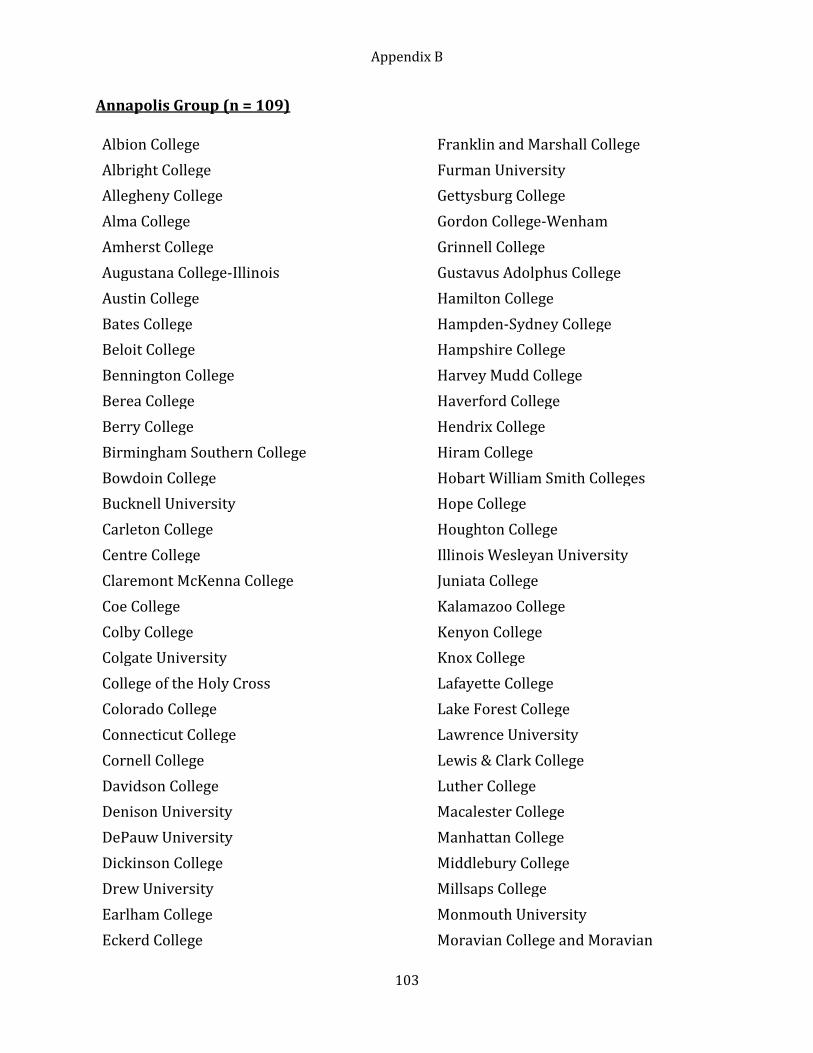
Appendix B
Annapolis Group (n = 109)
Albion College Albright College Allegheny College Alma College Amherst College Augustana College-Illinois Austin College Bates College Beloit College Bennington College Berea College Berry College Birmingham Southern College Bowdoin College Bucknell University Carleton College Centre College Claremont McKenna College Coe College Colby College Colgate University College of the Holy Cross Colorado College Connecticut College Cornell College Davidson College Denison University DePauw University Dickinson College Drew University Earlham College Eckerd College
Franklin and Marshall College Furman University Gettysburg College Gordon College-Wenham Grinnell College Gustavus Adolphus College Hamilton College Hampden-Sydney College Hampshire College Harvey Mudd College Haverford College Hendrix College Hiram College Hobart William Smith Colleges Hope College Houghton College Illinois Wesleyan University Juniata College Kalamazoo College Kenyon College Knox College Lafayette College Lake Forest College Lawrence University Lewis & Clark College Luther College Macalester College Manhattan College Middlebury College Millsaps College Monmouth University Moravian College and Moravian
103
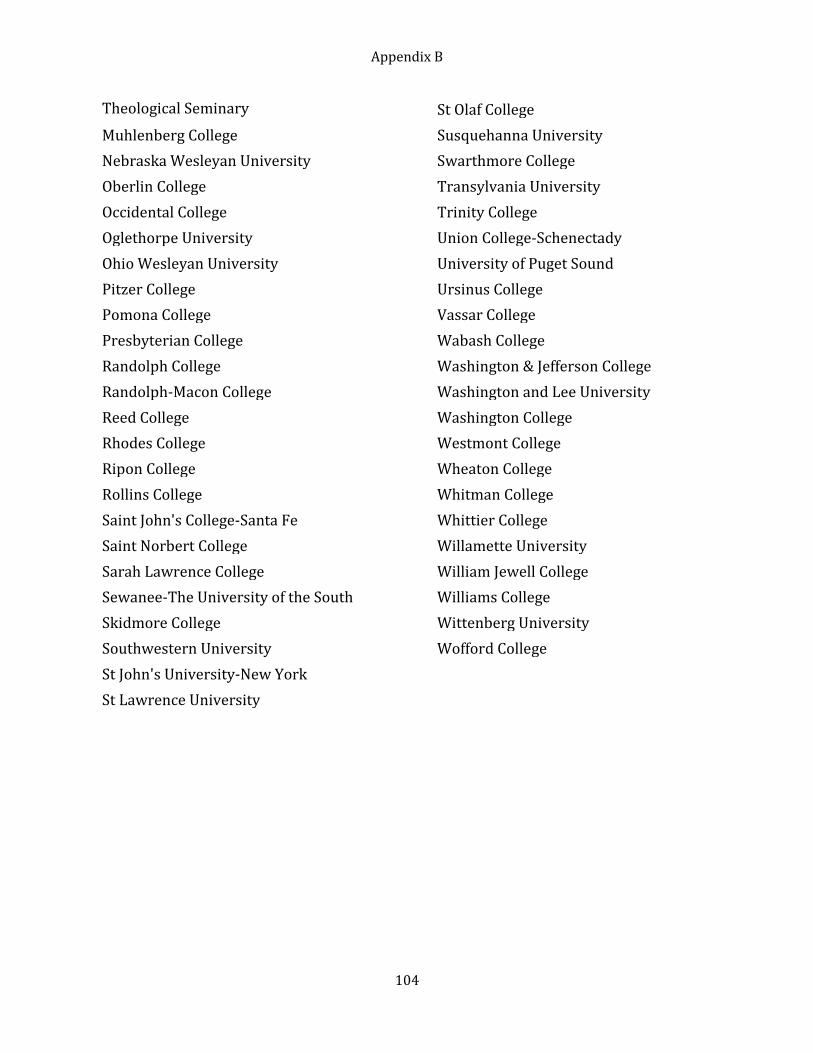
Appendix B
Theological Seminary
Muhlenberg College Nebraska Wesleyan University Oberlin College Occidental College Oglethorpe University Ohio Wesleyan University Pitzer College Pomona College Presbyterian College Randolph College Randolph-Macon College Reed College Rhodes College Ripon College Rollins College Saint John's College-Santa Fe Saint Norbert College Sarah Lawrence College Sewanee-The University of the South Skidmore College Southwestern University St John's University-New York St Lawrence University
St Olaf College Susquehanna University Swarthmore College Transylvania University Trinity College Union College-Schenectady University of Puget Sound Ursinus College Vassar College Wabash College Washington & Jefferson College Washington and Lee University Washington College Westmont College Wheaton College Whitman College Whittier College Willamette University William Jewell College Williams College Wittenberg University Wofford College
104

Appendix B
Catholic Colleges (n = 144)
Alvernia University Anna Maria College Aquinas College at Newton Aquinas College-Grand Rapids Assumption College Ave Maria University Avila University Barat College Bellarmine University Bellarmine-Ursuline College Belmont Abbey College Benedictine College Benedictine University Cabrini College Caldwell College Canisius College Cardinal Stritch University Carroll College Chaminade University of Honolulu Christian Brothers University College of Our Lady of the Elms College of Saint Teresa College of the Holy Cross Colorado Heights University Creighton University Daemen College DeSales University Dominican College of Blauvelt Dominican College-Racine Dominican University Dominican University of California D'Youville College
Edgewood College Fairfield University Fontbonne University Franciscan University of Steubenville Gannon University Gonzaga University Gwynedd Mercy College Holy Family University Holy Names University Immaculate Heart College Iona College John Carroll University King's College-Wilkes Barre La Roche College La Salle University Le Moyne College Lewis University Lone Mountain College Loras College Loyola University California Loyola University-Baltimore Manhattan College Manhattanville College Marian University-Wisconsin Marist College Mary Manse College Marygrove College Marymount College of Fordham University Marymount College of Kansas Maryville University of Saint Louis Medaille College
105

Appendix B
Mercyhurst College Merrimack College Molloy College Mount Aloysius College Mount Mercy University Mount Saint Mary College Mount Saint Scholastica College Mount Senario College Mount St Mary's University Nazareth College Neumann University Niagara University Notre Dame College-Manchester Ohio Dominican University Our Lady of the Lake College Our Lady of the Lake University-San Antonio Pace University-White Plains Presentation College Providence College Quincy University Regis University Rockhurst University Sacred Heart University Saint Ambrose University Saint Anselm College Saint Bonaventure University Saint Catharine College Saint Edward's University Saint Francis University Saint John College Saint John Fisher College Saint Johns University-St Joseph
Saint Josephs College Saint Joseph's College of Maine Saint Joseph's University Saint Leo University Saint Martin's University Saint Mary of the Plains College Saint Marys College of California Saint Mary's Dominican College Saint Mary's University of Minnesota Saint Michael's College Saint Norbert College Saint Peter's College Saint Thomas University Saint Vincent College Saint Xavier University Salve Regina University Santa Clara University Santa Fe University of Art and Design Seattle University Siena College Siena Heights University Silver Lake College Southern Vermont College Spalding University Spring Hill College St Francis College St Marys University Stonehill College The College of Saint Rose The College of Saint Scholastica Thomas More College Trinity College of Vermont University of Dallas
106
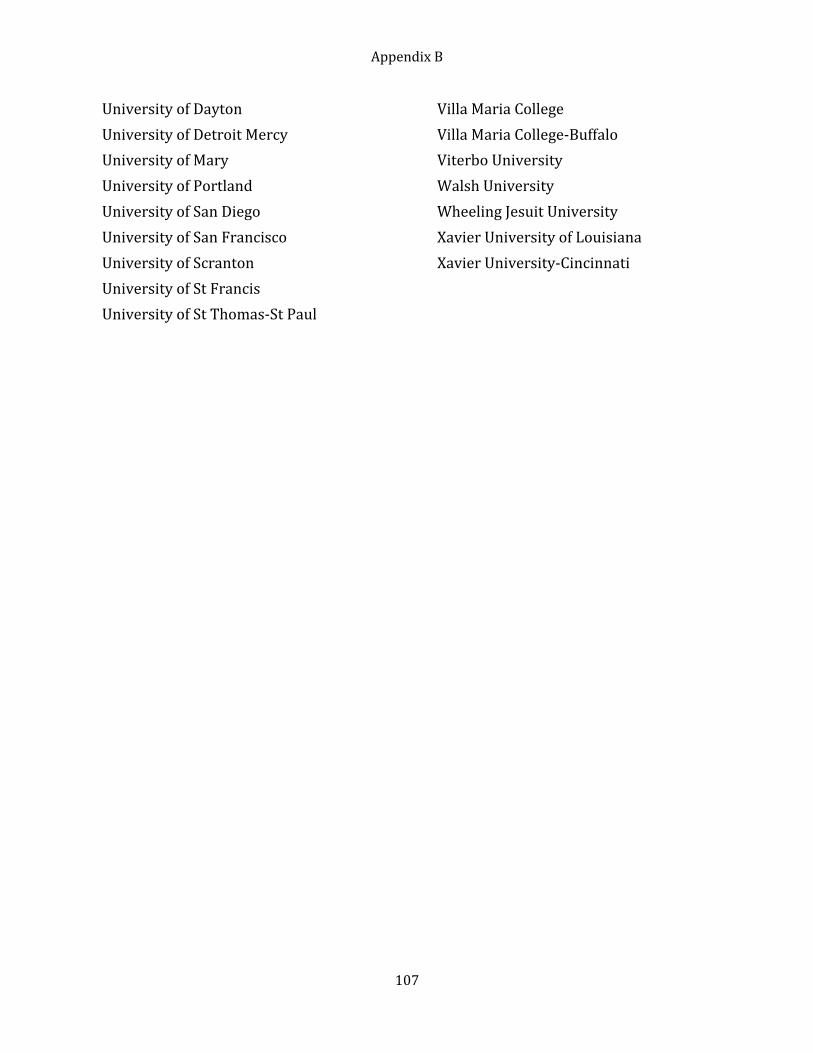
Appendix B
University of Dayton University of Detroit Mercy University of Mary University of Portland University of San Diego University of San Francisco University of Scranton University of St Francis University of St Thomas-St Paul
Villa Maria College Villa Maria College-Buffalo Viterbo University Walsh University Wheeling Jesuit University Xavier University of Louisiana Xavier University-Cincinnati
107
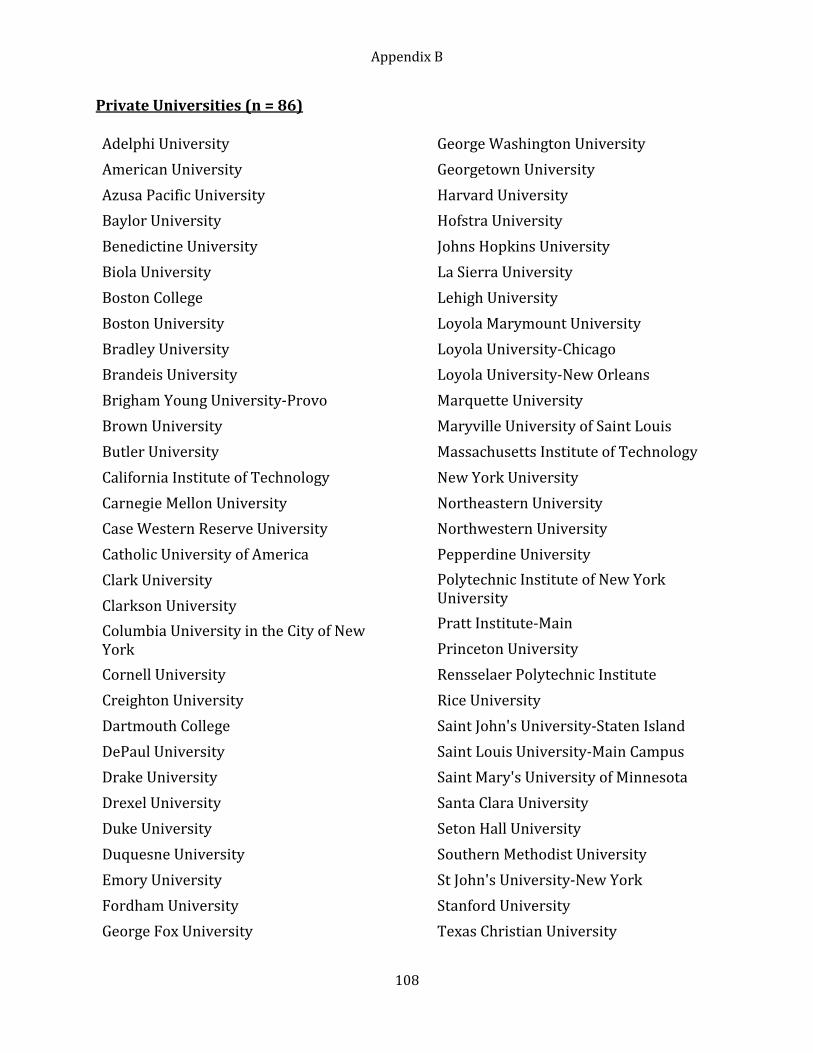
Appendix B
Private Universities (n = 86)
Adelphi University American University Azusa Pacific University Baylor University Benedictine University Biola University Boston College Boston University Bradley University Brandeis University Brigham Young University-Provo Brown University Butler University California Institute of Technology Carnegie Mellon University Case Western Reserve University Catholic University of America Clark University Clarkson University Columbia University in the City of New York Cornell University Creighton University Dartmouth College DePaul University Drake University Drexel University Duke University Duquesne University Emory University Fordham University George Fox University
George Washington University Georgetown University Harvard University Hofstra University Johns Hopkins University La Sierra University Lehigh University Loyola Marymount University Loyola University-Chicago Loyola University-New Orleans Marquette University Maryville University of Saint Louis Massachusetts Institute of Technology New York University Northeastern University Northwestern University Pepperdine University Polytechnic Institute of New York University Pratt Institute-Main Princeton University Rensselaer Polytechnic Institute Rice University Saint John's University-Staten Island Saint Louis University-Main Campus Saint Mary's University of Minnesota Santa Clara University Seton Hall University Southern Methodist University St John's University-New York Stanford University Texas Christian University
108

Appendix B
The New School Tufts University Tulane University of Louisiana University of Bridgeport University of Chicago University of Denver University of Detroit University of Miami University of Notre Dame University of Pennsylvania University of Portland University of Rochester University of San Diego
University of Southern California University of St Thomas-St Paul University of the Pacific University of Tulsa Vanderbilt University Villanova University Wake Forest University Washington University in St Louis Widener University-Main Campus Yale University Yeshiva University
109

Appendix B
Public Universities (n = 121)
Auburn University Main Campus Bowling Green State University-Main Campus Clemson University Cleveland State University College of William and Mary Colorado State University-Fort Collins East Carolina University Florida International University Florida State University George Mason University Georgia Institute of Technology-Main Campus Georgia Southern University Indiana University-Bloomington Indiana University-Purdue University-Indianapolis Iowa State University Kent State University at Kent Louisiana State University and Agricultural & Mechanical College Miami University-Oxford Michigan State University Mississippi State University Missouri University of Science and Technology Montana State University-Bozeman New Mexico State University-Main Campus North Carolina State University at Raleigh North Dakota State University-Main Campus Northern Arizona University
Northern Illinois University Oakland University Ohio State University-Main Campus Ohio University-Main Campus Oklahoma State University-Main Campus Oregon State University Pennsylvania State University-Main Campus Purdue University-Main Campus Rutgers University-New Brunswick Rutgers University-Newark South Dakota State University Southern Illinois University Carbondale Stony Brook University SUNY at Albany SUNY at Binghamton SUNY College at Buffalo Texas A & M University-College Station Texas A & M University-Corpus Christi Texas A & M University-Kingsville Texas Tech University The University of Alabama The University of Montana The University of Tennessee The University of Texas at Austin The University of West Florida University at Buffalo University of Akron Main Campus University of Alabama at Birmingham University of Alabama in Huntsville
110
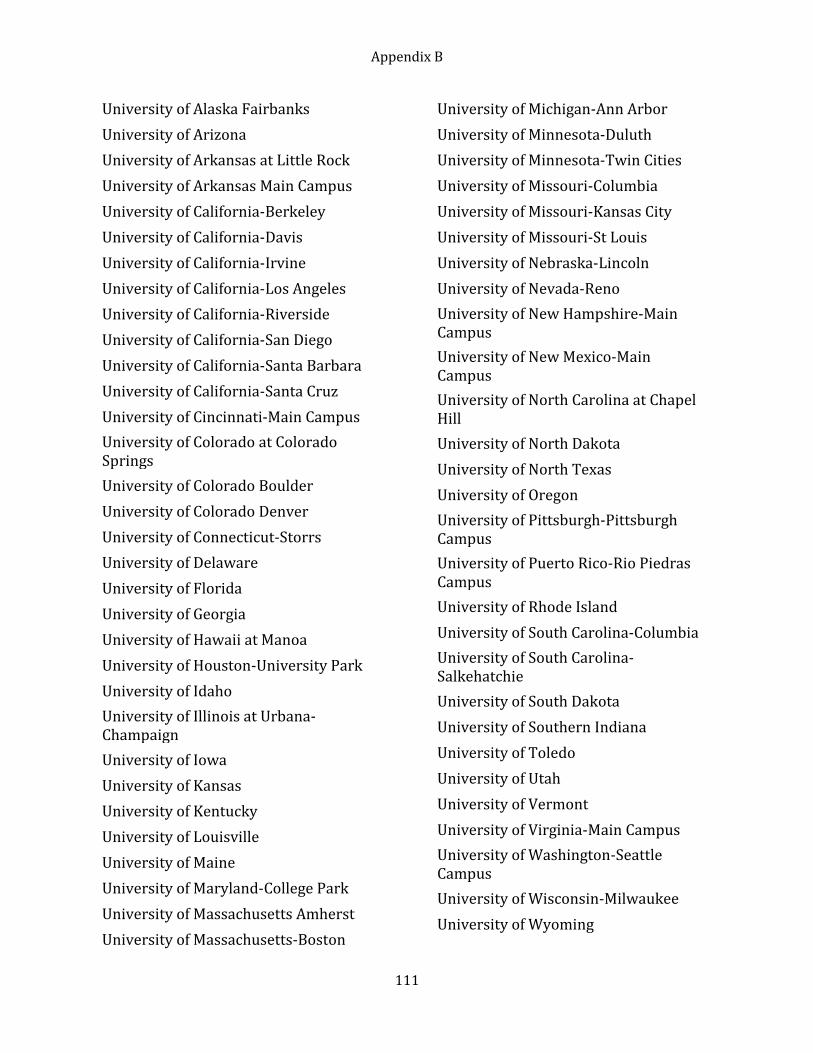
Appendix B
University of Alaska Fairbanks University of Arizona University of Arkansas at Little Rock University of Arkansas Main Campus University of California-Berkeley University of California-Davis University of California-Irvine University of California-Los Angeles University of California-Riverside University of California-San Diego University of California-Santa Barbara University of California-Santa Cruz University of Cincinnati-Main Campus University of Colorado at Colorado Springs University of Colorado Boulder University of Colorado Denver University of Connecticut-Storrs University of Delaware University of Florida University of Georgia University of Hawaii at Manoa University of Houston-University Park University of Idaho University of Illinois at Urbana-Champaign University of Iowa University of Kansas University of Kentucky University of Louisville University of Maine University of Maryland-College Park University of Massachusetts Amherst University of Massachusetts-Boston
University of Michigan-Ann Arbor University of Minnesota-Duluth University of Minnesota-Twin Cities University of Missouri-Columbia University of Missouri-Kansas City University of Missouri-St Louis University of Nebraska-Lincoln University of Nevada-Reno University of New Hampshire-Main Campus University of New Mexico-Main Campus University of North Carolina at Chapel Hill University of North Dakota University of North Texas University of Oregon University of Pittsburgh-Pittsburgh Campus University of Puerto Rico-Rio Piedras Campus University of Rhode Island University of South Carolina-Columbia University of South Carolina-Salkehatchie University of South Dakota University of Southern Indiana University of Toledo University of Utah University of Vermont University of Virginia-Main Campus University of Washington-Seattle Campus University of Wisconsin-Milwaukee University of Wyoming
111
Appendix B
Utah State University Virginia Commonwealth University Virginia Polytechnic Institute and State University Washington State University Wayne State University West Virginia University
112

Appendix C
STUDENT’S PROBABLE MAJOR
Aggregated Item Disaggregated Item(s)
Agriculture Agriculture, Forestry
Architecture Architecture or Urban Planning
Biological Sciences Biology (general), Biochemistry or Biophysics, Botany, Environmental Science, Marine (life) Science, Microbiology or Bacteriology, Zoology, Other Biological Sciences
Business Accounting, Business Administration (general), Finance, International Business, Marketing, Management, Other Business
Computer Science Data Processing/Computer Programming/Computer Science
Education Business Education, Elementary Education, Music or Art Education, Physical Education or Recreation, Secondary Education, Special Education, Other Education
Engineering Aeronautical or Astronautical Engineering, Civil Engineering, Chemical Engineering, Electrical or Electronic Engineering, Industrial Engineering, Mechanical Engineering, Other Engineering
Fine Arts Art (fine and applied), Music, Theater
Health Professional Medical/Dental/Veterinary, Nursing, Pharmacy, Therapy (occupational, physical, speech)
History or Political Science History, Political Science (gov’t, international relations)
Humanities/English English (language and literature), Language and Literature (other than English), Philosophy, Speech, Theology or Religion, Other Arts & Humanities
Journalism/Communications Journalism, Communications
Mathematics or Statistics Mathematics, Statistics
Physical Sciences Astronomy, Atmospheric Science (including Meteorology), Chemistry, Earth Science, Marine Science, Physics, Other Physical Science
Psychology Psychology
Social Sciences Anthropology, Economics, Ethnic Studies, Geography, Social Work, Sociology, Women’s Studies, Other Social Science
Technical/Applied Majors Health Technology (medical, dental, laboratory), Drafting or Design, Electronics, Mechanics, Other Technical,
Other (Non-technical) Home Economics, Library Science, Other Professional, Building Trades, Law Enforcement, Military Science, Secretarial Studies, Other Field
Undecided Undecided
113

Appendix C
PROBABLE CAREER/OCCUPATION
Aggregated Item Disaggregated Item(s)
Architect Architect
Artist Actor or entertainer, Artist, Interior decorator, Musician, Writer
Business Accountant or actuary, Business executive (management, administrator), Business owner or proprietor, Business salesperson or buyer
Clerical Business (clerical)
Clergy Clergy (minister, priest), Clergy (other religious)
Clinical Psychologist Clinical Psychologist
College Administrator/Staff College Administrator/Staff
College Teacher College teacher
Computer Programmer Computer Programmer
Doctor (MD or DDS) Dentist (including orthodontist), Physician
Education (secondary) School counselor, School principal or superintendent, Teacher or administrator (secondary)
Education (primary) Teacher (elementary)
Engineer Engineer
Farmer or Forester Conservationist or forester, Farmer or rancher
Health Professional Dietitian or home economist, Lab technician or hygienist, Optometrist, Pharmacist, Therapist (physical, occupational, speech), Veterinarian
Homemaker Homemaker (full-time)
Laborer Laborer (unskilled), Semi-skilled worker, Skilled trades
Law Enforcement Law Enforcement
Lawyer Lawyer (attorney) or judge
Military Military service (career)
Nurse Nurse
Policymaker/Diplomat Foreign service worker (including diplomat), Policymaker/government
Research Scientist Scientific researchers
Social Worker Social, welfare or recreation worker
Other Career Other career
Unemployed* Unemployed
Undecided** Undecided
* Mother’s and father’s career only** Student’s probable career only
114
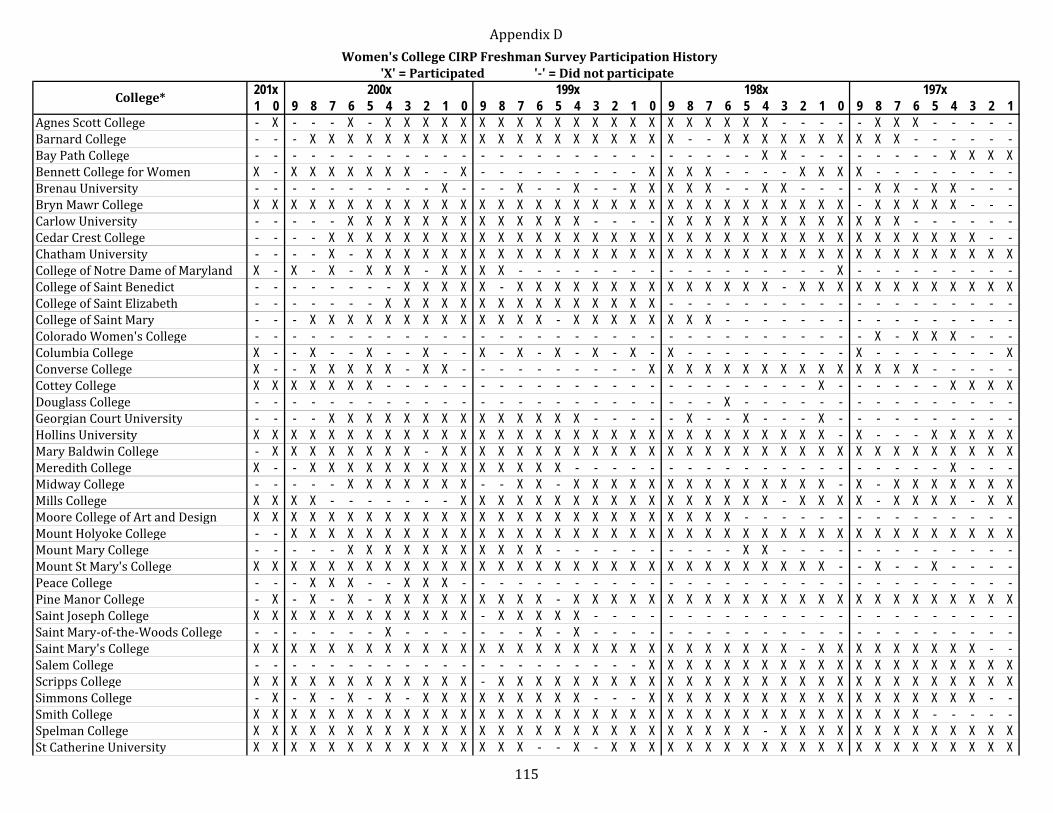
AppendixD
1 0 9 8 7 6 5 4 3 2 1 0 9 8 7 6 5 4 3 2 1 0 9 8 7 6 5 4 3 2 1 0 9 8 7 6 5 4 3 2 1AgnesScottCollege - X - - - X - X X X X X X X X X X X X X X X X X X X X X - - - - - X X X - - - - -BarnardCollege - - - X X X X X X X X X X X X X X X X X X X X - - X X X X X X X X X X - - - - - -BayPathCollege - - - - - - - - - - - - - - - - - - - - - - - - - - - X X - - - - - - - - X X X XBennettCollegeforWomen X - X X X X X X X - - X - - - - - - - - - X X X X - - - - X X X X - - - - - - - -BrenauUniversity - - - - - - - - - - X - - - X - - X - - X X X X X - - X X - - - - X X - X X - - -BrynMawrCollege X X X X X X X X X X X X X X X X X X X X X X X X X X X X X X X X - X X X X X - - -CarlowUniversity - - - - - X X X X X X X X X X X X X - - - - X X X X X X X X X X X X X - - - - - -CedarCrestCollege - - - - X X X X X X X X X X X X X X X X X X X X X X X X X X X X X X X X X X X - -ChathamUniversity - - - - X - X X X X X X X X X X X X X X X X X X X X X X X X X X X X X X X X X X XCollegeofNotreDameofMaryland X - X - X - X X X - X X X X - - - - - - - - - - - - - - - - - X - - - - - - - - -CollegeofSaintBenedict - - - - - - - - X X X X X - X X X X X X X X X X X X X X - X X X X X X X X X X X XCollegeofSaintElizabeth - - - - - - - X X X X X X X X X X X X X X X - - - - - - - - - - - - - - - - - - -CollegeofSaintMary - - - X X X X X X X X X X X X X - X X X X X X X X - - - - - - - - - - - - - - - -ColoradoWomen'sCollege - - - - - - - - - - - - - - - - - - - - - - - - - - - - - - - - - X - X X X - - -ColumbiaCollege X - - X - - X - - X - - X - X - X - X - X - X - - - - - - - - - X - - - - - - - XConverseCollege X - - X X X X X - X X - - - - - - - - - - X X X X X X X X X X X X X X X - - - - -CotteyCollege X X X X X X X - - - - - - - - - - - - - - - - - - - - - - - X - - - - - - X X X XDouglassCollege - - - - - - - - - - - - - - - - - - - - - - - - - X - - - - - - - - - - - - - - -GeorgianCourtUniversity - - - - X X X X X X X X X X X X X X - - - - - X - - X - - - X - - - - - - - - - -HollinsUniversity X X X X X X X X X X X X X X X X X X X X X X X X X X X X X X X - X - - - X X X X XMaryBaldwinCollege - X X X X X X X X - X X X X X X X X X X X X X X X X X X X X X X X X X X X X X X XMeredithCollege X - - X X X X X X X X X X X X X X - - - - - - - - - - - - - - - - - - - - X - - -MidwayCollege - - - - - X X X X X X X - - X X - X X X X X X X X X X X X X X - X - X X X X X X XMillsCollege X X X X - - - - - - - X X X X X X X X X X X X X X X X X - X X X X - X X X X - X XMooreCollegeofArtandDesign X X X X X X X X X X X X X X X X X X X X X X X X X X - - - - - - - - - - - - - - -MountHolyokeCollege - - X X X X X X X X X X X X X X X X X X X X X X X X X X X X X X X X X X X X X X XMountMaryCollege - - - - - X X X X X X X X X X X - - - - - - - - - - X X - - - - - - - - - - - - -MountStMary'sCollege X X X X X X X X X X X X X X X X X X X X X X X X X X X X X X X - - X - - X - - - -PeaceCollege - - - X X X - - X X X - - - - - - - - - - - - - - - - - - - - - - - - - - - - - -PineManorCollege - X - X - X - X X X X X X X X X - X X X X X X X X X X X X X X X X X X X X X X X XSaintJosephCollege X X X X X X X X X X X X - X X X X X - - - - - - - - - - - - - - - - - - - - - - -SaintMary‐of‐the‐WoodsCollege - - - - - - - X - - - - - - - X - X - - - - - - - - - - - - - - - - - - - - - - -SaintMary'sCollege X X X X X X X X X X X X X X X X X X X X X X X X X X X X X - X X X X X X X X X - -SalemCollege - - - - - - - - - - - - - - - - - - - - - X X X X X X X X X X X X X X X X X X X XScrippsCollege X X X X X X X X X X X X - X X X X X X X X X X X X X X X X X X X X X X X X X X X XSimmonsCollege - X - X - X - X - X X X X X X X X X - - - X X X X X X X X X X X X X X X X X X - -SmithCollege X X X X X X X X X X X X X X X X X X X X X X X X X X X X X X X X X X X X - - - - -SpelmanCollege X X X X X X X X X X X X X X X X X X X X X X X X X X X - X X X X X X X X X X X X XStCatherineUniversity X X X X X X X X X X X X X X X - - X - X X X X X X X X X X X X X X X X X X X X X X
Women'sCollegeCIRPFreshmanSurveyParticipationHistory'X'=Participated'‐'=Didnotparticipate
198x199x201xCollege* 197x200x
115
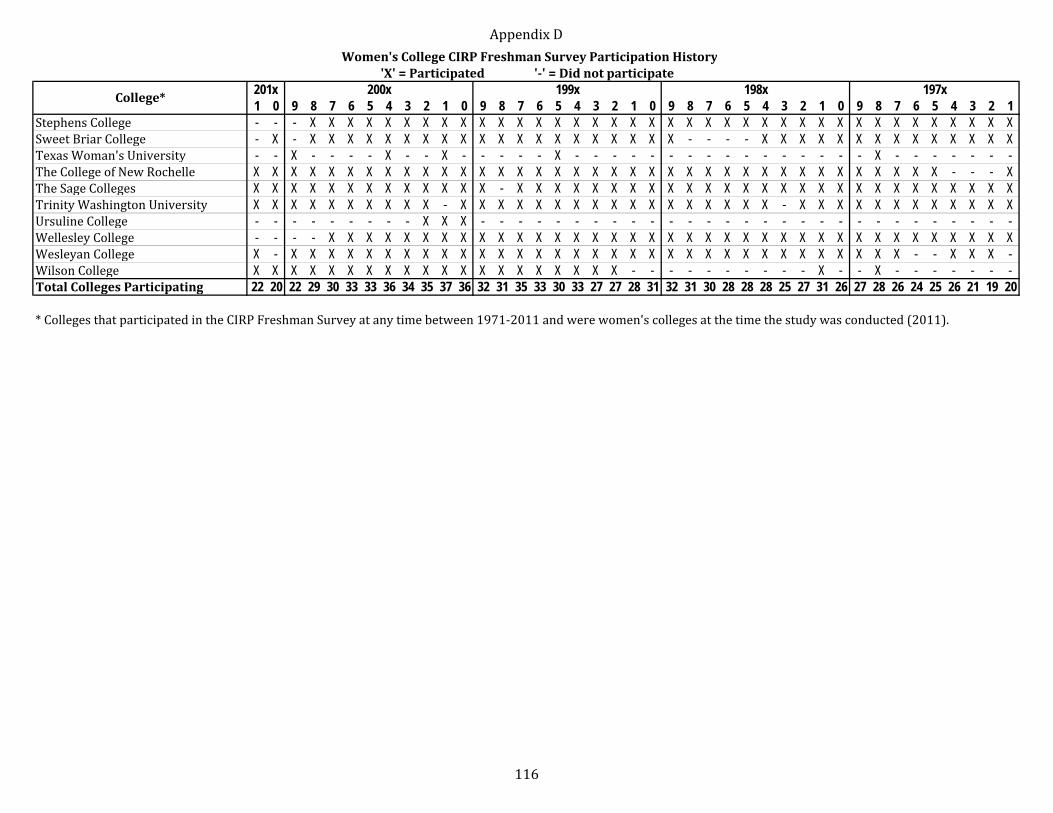
AppendixD
1 0 9 8 7 6 5 4 3 2 1 0 9 8 7 6 5 4 3 2 1 0 9 8 7 6 5 4 3 2 1 0 9 8 7 6 5 4 3 2 1
Women'sCollegeCIRPFreshmanSurveyParticipationHistory'X'=Participated'‐'=Didnotparticipate
198x199x201xCollege* 197x200x
StephensCollege - - - X X X X X X X X X X X X X X X X X X X X X X X X X X X X X X X X X X X X X XSweetBriarCollege - X - X X X X X X X X X X X X X X X X X X X X - - - - X X X X X X X X X X X X X XTexasWoman'sUniversity - - X - - - - X - - X - - - - - X - - - - - - - - - - - - - - - - X - - - - - - -TheCollegeofNewRochelle X X X X X X X X X X X X X X X X X X X X X X X X X X X X X X X X X X X X X - - - XTheSageColleges X X X X X X X X X X X X X - X X X X X X X X X X X X X X X X X X X X X X X X X X XTrinityWashingtonUniversity X X X X X X X X X X - X X X X X X X X X X X X X X X X X - X X X X X X X X X X X XUrsulineCollege - - - - - - - - - X X X - - - - - - - - - - - - - - - - - - - - - - - - - - - - -WellesleyCollege - - - - X X X X X X X X X X X X X X X X X X X X X X X X X X X X X X X X X X X X XWesleyanCollege X - X X X X X X X X X X X X X X X X X X X X X X X X X X X X X X X X X - - X X X -WilsonCollege X X X X X X X X X X X X X X X X X X X X - - - - - - - - - - X - - X - - - - - - -TotalCollegesParticipating 22 20 22 29 30 33 33 36 34 35 37 36 32 31 35 33 30 33 27 27 28 31 32 31 30 28 28 28 25 27 31 26 27 28 26 24 25 26 21 19 20
*CollegesthatparticipatedintheCIRPFreshmanSurveyatanytimebetween1971‐2011andwerewomen'scollegesatthetimethestudywasconducted(2011).
116

This report was made possible with support from the Women’s College Coalitionwomenscolleges.org