whitepaper the data core: driving utility operational
TRANSCRIPT

— WHITEPAPER
The Data Core: Driving utility operational excellence through data integration
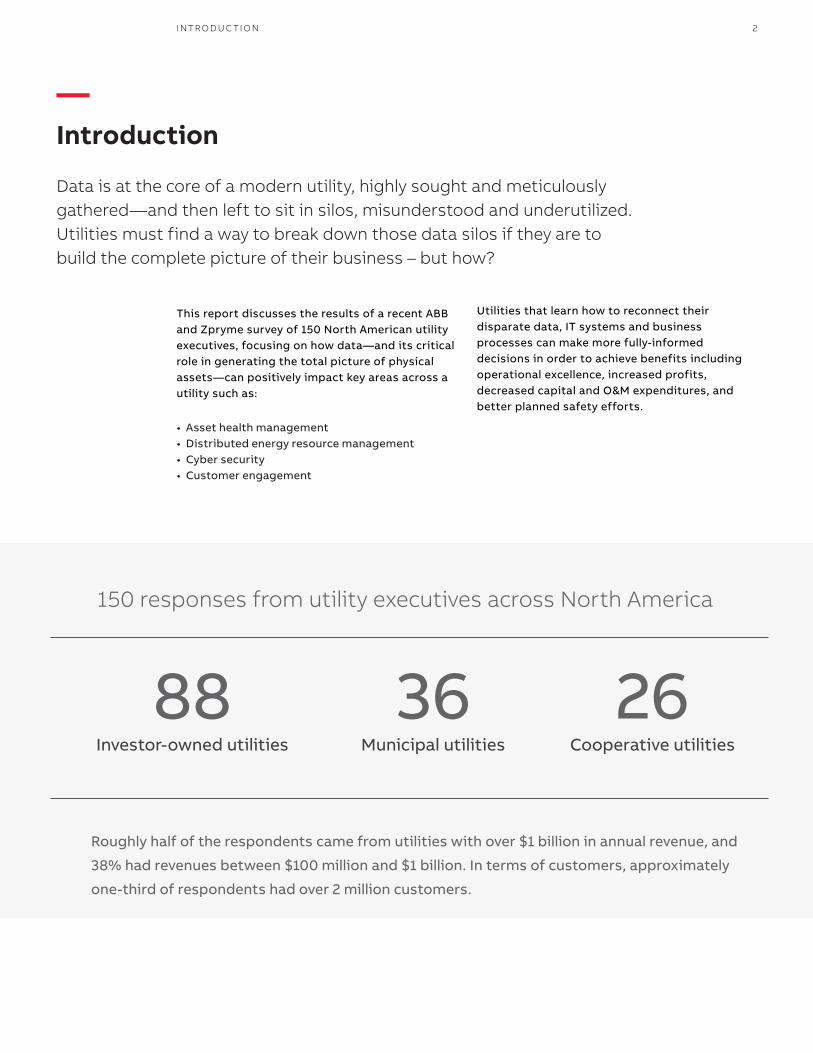
88Investor-owned utilities
36Municipal utilities
26Cooperative utilities
150 responses from utility executives across North America
Roughly half of the respondents came from utilities with over $1 billion in annual revenue, and
38% had revenues between $100 million and $1 billion. In terms of customers, approximately
one-third of respondents had over 2 million customers.
I NTR O D U C TI O N 2
This report discusses the results of a recent ABB and Zpryme survey of 150 North American utility executives, focusing on how data—and its critical role in generating the total picture of physical assets—can positively impact key areas across a utility such as:
• Asset health management• Distributed energy resource management• Cyber security • Customer engagement
Utilities that learn how to reconnect their disparate data, IT systems and business processes can make more fully-informed decisions in order to achieve benefits including operational excellence, increased profits, decreased capital and O&M expenditures, and better planned safety efforts.
—Introduction
Data is at the core of a modern utility, highly sought and meticulously gathered—and then left to sit in silos, misunderstood and underutilized. Utilities must find a way to break down those data silos if they are to build the complete picture of their business – but how?

Figure 1: Top drivers behind improving analytics efforts (%)
Figure 2: Biggest challenges with data management (%)
74 OPERATIONAL EXCELLENCE
68 CUSTOMER SATISFACTION
46 FINANCIAL PERFORMANCE
33 REGULATORY COMPLIANCE32 HEALTH & SAFETY
67%Integration of different systems
46%Defining what data is relevant
39%Budget constraints
38%Organizational/data silos
34%IT securityissues
3 TH E DATA CO R E D R I V I N G U TI L IT Y O PER ATI O N A L E XCEL L EN CE

Figure 3: Types of data gathered by utilities (%)
MAINTENANCE DATA
WORKFORCE DATA
EMERGENCY RESPONSE DATA 38%
DISTRIBUTION SENSORS
ASSET DATA
SUBSTATION IEDs
AMI METERS
44%
48%
53%
55%
58%
70%
TH E CH A L L EN G E 4
When it comes to getting the most out of their data, utilities still lack connections among the dis-parate data sources and systems that have come on board with smart grid efforts, whether meter data or energy storage technologies. As shown in Figure 2, over two-thirds of respondents said the integration of different IT systems is the most common challenge with data analytics, even before budget constraints.
This lack of connection limits a utility’s view across the organization; without that visibility, it’s hard to know where improvements might be made. Asset management is a prime example. “When we don’t have the ability to build a complete picture of an as-set, we don’t have a baseline,” noted Dr. Siri Vara-dan, PE and Director of Product Management for the Enterprise Software product group within ABB. “Only when you know the baseline of an asset can
—The challengeDisparate sources, systems and processes
Along with expanding deployment of automation technologies, the smart grid era of utilities introduced an increasingly connected network of smart assets impacting electricity generation, transmission and distribution (T&D) – from smart meters to electric vehicles to community-scale solar and wind farms.
you tell that something is not right. We have to inte-grate all that data to build the big picture.”
Gathering data to help build these baselines is sim-ple; it can come from a variety sources. Figure 3 shows that AMI meters are the most frequently mentioned contributors of data, but over half of the respondents also collect distribution sensor and asset data as well as data from Intelligent Elec-tronic Devices (IEDs) within substations. The prob-lem isn’t collecting the data, it’s how the data is managed, analyzed, and viewed. With all of these data sources in play, how does each contribute to other areas of the business? The data sources are just pieces of larger puzzles—such as Asset Performance Management (APM) or out-age management—that utilities must consider.

Figure 4: Importance of data and analytics for key business areas (Scale of importance 1-5)
3.97
4.09
3.57
—1=less IMPORTANCE 5=more
Workforce management
Network management
Cyber security
3.30Forecasting & planning
3.13Outage management
2.93Asset management
5 TH E DATA CO R E D R I V I N G U TI L IT Y O PER ATI O N A L E XCEL L EN CE
Figure 4 demonstrates the importance of data analytics for different business areas within a utility—a score of “1” means that data and analytics are not perceived as important and a score of “5” means that they are considered extremely important.
Network management rises to the top of the list, but it is important to note that lower-ranked
business areas such as outage management and asset management ultimately feed into the success of network management efforts. Utilities can’t afford to say, “I don’t need to know what’s going on there”; asset health management, net-work management, workforce management, and cyber security must be considered holistically or risk triggering a cascading failure in the business.
—Siloed data, siloed approaches
In addition to siloed data and systems, many utilities also silo key areas of their organizations.

SI LO ED DATA 6
—Spotlight interview
Collaboration and integration are keys to success
Joseph ThomasVice President, Electric Systems Operations The United Illuminating Company
The integration of different IT systems is the most frequently mentioned challenge with data management for U.S. utilities. How does that compare with what you’re seeing? Utilities for many years had the philosophy to get best-of-breed applications. Well, with that you have numerous systems and databases – and trying to integrate them is very costly. Managing version control is also a challenge, and it really doesn’t set the stage for the ever changing customer, regula-tory and energy market expectations. Another as-pect is the challenge around data quality. Over the years there weren’t many capabilities to scrub data before it actually hit your core data systems.
The key is for utilities to figure out how to reduce the number of systems, select the right vendors that are progressive and will help take you where you need to go, and ensure the data that we mi-grate into these new systems is high-quality.
What does a complete picture of an asset look like? What would it include? You have electrical infrastructure, or the assets that include substations, transformers, wires, poles, and the meters at the transmission and dis-tribution levels. Another asset is the supporting communication system and technologies to com-municate with and manage those assets. The final asset is the data, and managing that data as an as-set to serve all stakeholders. The key is to trans-form data into information that brings value to ev-eryone.
When we integrate all that, the complete picture is really that we can monitor an asset’s performance, and predict outcomes. If an asset has the potential to have a problem we can measure it and identify the appropriate actions before it actually fails.
How will next-generation utility efforts—such as DERs, microgrids and virtual power plants—change your organization’s data and asset man-agement needs? It’s already happening. We have at least eight to 10 solar applications a week in our service territory. We used to have 200 to 300 per year a couple of years ago – this year we’ll have over 2,000. We’re seeing solar farms, fuel cells being successfully built and placed into operation. We’re currently in the process of building a municipal microgrid for one of our towns.
The challenges I see are the electrical system of the past was very vertical and designed for one way power flow. It came from the power plants via transmission and distribution lines right to the cus-tomers. You could model what the impacts of any system or customer changes to system reliability and performance with an overall focus on ensuring safe delivery of energy. Now when you have new types of non-dispatched sources interconnecting at the distribution level, you really don’t have the appropriate real-time visibility and rich data to run models and to determine if the new source may or may not cause a problem.
What recommendations do you have for other util-ities as they work to overcome data silos within their own organizations? First and foremost, select good leaders that are in a mode of partnership. It’s all about serving the customers, and meeting customer, regulatory and shareholder expectations all of the time. We must have well-defined strategies and visions, and be working together as a team.
The second is any project that has an IT component has to have a governance oversight consisting of IT/OT and business unit leaders. It is really a culture of teamwork and collaboration, gaining a respect for each other and how everyone contributes to the success of the project and overall company results.

7
Figure 5: Expectations for areas with largest return on investment in the next 10 years (%)
30SMARTMETERS
23DISTRIBUTIONANALYTICS
17RENEWABLEPOWER/ENERGYSTORAGE
11MICROGRIDS& VIRTUALPOWERPLANTS
11ASSETPERFORMANCEMANAGEMENT
5SMARTHOMES
3OTHER
7 TH E DATA CO R E D R I V I N G U TI L IT Y O PER ATI O N A L E XCEL L EN CE
—Approaching data from a holistic view
When data sets get together, they become more than the sum of their parts.
Integrating disparate data sets can improve the overall health of a utility through:
• Faster restoration times• Reduced equipment downtime • Streamlined workforce management processes • Superior customer service
The next section of this report explores key areas that can benefit from this approachds.
—Cyber security
Naturally, as connected devices and systems in-crease, so do cyber security issues. Utilities face questions such as: How do we deploy things like smart grid or distributed generation technologies, and do so in a secure manner? Yet the very devices and systems that raise the questions also provide the answers: increasingly connected data from as-set management and network operations can help identify unusual behavior that might not have oth-erwise been noticed.
Data analytics can help utilities uncover cyber secu-rity breaches more quickly and ensure a more resil-ient network.
—Supporting emerging markets
Much of the value utilities expect from a smarter grid will come from smart meters and their data and control opportunities, but other areas will de-liver value as well.
As illustrated in Figure 5, smart meters led the re-sponse pool, but approximately 28% of respon-dents expect their largest return on investments to come from emerging areas such as renewable power, energy storage, microgrids, and virtual power plants, all of which fall under Distributed En-ergy Resource (DER) management. How can asset management and data support these emerging technologies?
Gary Rackliffe, Vice President of Smart Grids North America for ABB, noted that additional sensors and detailed information about these distributed as-sets can help build a more complete picture of the grid. With the right analysis, a utility can spot

Figure 6: Top 3 areas utilities plan to invest in during the next five years
44
45
42
Distributed energy resources
Distribution SCADA
Outage management
37Predictive maintenance
31Asset performance management
29Substation automation
27Energy storage
24Volt/VAR optimization
21Workforce management
TH E CH A L L EN G E 8
trends in asset performance, enabling proactive changes in maintenance that can help extend the life of assets or give early warnings of impending failures, which will be increasingly important as utilities manage dispersed assets on their net-works.
—Outage restoration
When asked, “What are the top three areas in which you plan to invest the most in the next five years?” outage management was listed as a top area by more than 40% of utilities, as shown in Figure 6. But although asset management runs in the middle of the pack, it and the data associated with it can di-rectly impact the success of outage management ef-forts.
“Outage management systems have significant inte-gration,” said Sam Okoli, Product Management, Out-
age Lifecycle Management, from the Enterprise Software product group within ABB. “We need these systems to work as one to deal with outages. A lot of utilities are getting Outage Management Systems (OMS) that are not equipped to deal with all of the data that could benefit them.”
—“Data from assets can feed into the analysis and control of the net-work. We’ll also have better remote monitoring and diagnostics with condition-based maintenance.”
– Gary Rackliffe, Vice President of Smart Grids North America, ABB
With increased access to many different data sources, utilities need to focus more on using the data to develop specific and targeted programs for their customers, and provide more information when outages occur. Utilities also need to better uti-lize smart meter infrastructure to provide more lo-calized estimated restoration times—i.e., letting specific customers know when they will receive power, down to each residence within a block.
The ability to monitor many more assets will help utilities dive deeper into the causes and solutions for outages. “We’re going to see more pervasive data and better SCADA* systems to identify nested outages,” said Okoli. “We’ll see an increased focus on providing better real-time communication between field and the control, and really making sense of data. It won’t just be that customers are experienc-ing an outage, but why are they out? That’s going to be helped by more connected sensors.”
* (Supervisory Control and Data Acquisition)

9 TH E DATA CO R E D R I V I N G U TI L IT Y O PER ATI O N A L E XCEL L EN CE
—Spotlight interview
Taking asset management to the next level
Jeff FleemanDirector, Advanced Transmission Studies and Technologies American Electric Power
The integration of different IT systems is the most frequently mentioned challenge with data manage-ment for U.S. utilities.
How does that compare with what you’re seeing? What are your organization’s most significant challenges with data management? We definitely have issues with disintegrated sys-tems and disintegrated data. We are aware of it in-creasingly as we need better access to data to make decisions and support those decisions. It’s only going to get worse with further complications that are coming—with more players and more dis-tributed generation for example.
We grew into this problem gradually. It happened by evolving data and analysis tools over time to solve different problems, and not having one cen-tralized plan.
What does a complete picture of an asset look like? It is a pretty long list. You need some standard definitions, identification and descriptive data, lo-cation and installation data, maintenance data, en-vironmental data, and logistics and accounting data.
Tell us a little bit about Asset Health Center…how is that helping to build a better picture of your as-sets? It is a starting point, I’m very proud that we’re do-ing it. I think it is industry-leading in its ambitious-ness. So far it has helped us understand some things that we didn’t predict, and in other cases it helped us prevent failures. It will do three main things for us:
• It is going to prevent failures and their conse-quences
• It is going to optimize our maintenance efforts • It will help us prioritize our replacement of aging
or poorly performing assets
This will help us as we have to replace more assets because the customers will have to pay for these assets as part of the regulatory construct. We’ll need to be justifying why we are replacing these assets. So having Asset Health Center will be able to help us a lot by answering regulators’ concerns about why we’re replacing assets.
What recommendations do you have for other util-ities as they work to overcome data silos within their own organizations? We need to collaborate, we need to integrate, and we need to automate. Some of these things are hard, but it’s not going to get any easier. We have to commit ourselves to the fact that we will solve these problems. We need to work on it, and say we will solve it even though we can’t solve it overnight. We can start marching in that direction.

TAKING IT TO THE NEXT LEVEL 10
PLAN TO USE NO PLANS TO USE
56 26 18IVR/ NOTIFICATIONS
63 20 17TWITTER
67 21 12SMS/TEXT
69 15 16FACEBOOK
82 15 4WEB PORTAL
IN USE
Figure 7: Current and planned use of social media for customer communications in an outage (%)
63%
68%
62%
Energy information & education for customers
General customer notifications
Platform for customer feedback
61%Customer reporting of outages
51%Other urgent customer notifications
Figure 8: Areas of customer engagement using social media
—Taking it to the next level with social data mining
This report has covered much around the benefits of better integrating asset data, but a truly comprehensive view of a utility must include the customers it serves.
To achieve this, customer data will play an increasingly important role in delivering operational excellence.
One area of customer engagement occurs during an outage. In the world of outages, utilities most widely use web portals to communicate with cus-tomers in the event of an outage, but the numbers in Figure 7 indicate that utilities are using a variety of technologies to engage with their customers regarding outages. In fact, social media, such as Facebook and Twitter, along with texting are more popular forms of engagement than automated phone calls. Not only are utilities finding new ways to communicate with customers, but the informa-tion gathered in these efforts goes beyond report-ing outages to include data such as user behavior on social media sites.
Utilities are also stretching social media for a variety of communications with customers that go beyond just reporting and monitoring outag-es. As shown in Figure 8, opportunities for using
social media in a customer engagement strategy include: general customer notifications (68%), energy information and education for custom-ers (63%), and platforms for customer feedback (62%).
It’s important to note that social media is a two-way street that can help build a more holistic picture of the utility for both employees and customers. Customers are not only able to receive data from utilities, they can also provide it back to them, which can help utilities to improve reliability and service. In the case of outage man- agement, Okoli pointed out that “Consumers are going to respond to better outage management by receiving more information about their consumption and how they can change their consumption patterns. Utilities can provide customers with suggestions about how to change the use of certain loads in the home, which can help reduce or minimize outages.”

11 TH E DATA CO R E D R I V I N G U TI L IT Y O PER ATI O N A L E XCEL L EN CE
—Spotlight interview
Customers are assets, too
Matt CroucherDirector, Demand Analytics CPS Energy
The integration of different IT systems is the most frequently mentioned challenge with data manage-ment for U.S. utilities. How does that compare with what you’re seeing? We’re definitely going through the challenging pro-cess of trying to merge data sets housed in various proprietary IT systems. Traditionally within the utility sector, data collection, management and dissemina-tion has been determined at the business unit level which leads to a significant amount of disparate datasets as well as a high degree of incoordination. As we look to enhance the value from our internal data by combining datasets, we’re finding it difficult because some datasets are easy to extract and other ones are more difficult—for example, you might have to acquire different licensing agreements.
There is also a human capital challenge. Often the people who know the data, the databases and the logic around their organisation is a limited few. The focus within the utility industry has been on report-ing only and not true analytics. Hence, there are a lot of data queries that were setup 15 years ago, and everyone just runs the same report often to maintain consistency in reporting through time. Once you try to deconstruct those, you don’t necessarily have the immediate expertise anymore to handle the change management in a smooth manner.
What does a complete picture of an asset look like? In the utility industry when we look at assets, we look at physical hardware. We need to develop a better picture of the data generated from our physical as-sets, but also our customers. We don’t have a com-plete integrated and cohesive picture of the cus-tomer. Our goal is to build this picture out. Given that the focus of customer data has often been on the billing aspects of the business often the more de-tailed customer information data collection is not as robust as it would be compared to our physical as-sets.
What role does social media play in delivering reliable network operations? How do you see that evolving in the future? Social media is going to shine more light on reliabil-ity and outage performance. People can be tweet-ing back and forth, and sending Facebook mes-sages to utilities nearly instantaneously and to a wider audience. Very quickly people can see the is-sues that others are having with their utility com-pany. It will certainly add pressure to provide more reliable network operations because everyone is providing a media-type voice.
How will next-generation utility efforts—such as DERs, microgrids and virtual power plants—change your organization’s data and asset man-agement needs? More people are having an impact on the grid, and it’s going to generate a need for data collection and analytics at the grid edge. As we get more sensors and more sophisticated information from the grid and the devices connecting to the grid, we’re going to have to get better at using and understanding that data.
What recommendations do you have for other util-ities as they work to overcome data silos within their own organizations? Do something, even if it is a small project with a few data sources to break out of your silos. Identify different departments in your organization that are interested in collaboration. There is an emphasis to break down organizational silos within the utility sector from a knowledge transfer, coordination of activities and budget considerations but the data generated within each business unit remains the most siloed out of everything. There is going to be value if people do use data in their own groups, but the full value comes from trying to develop use cases across the organization. Connected data is always going to be more valuable to a utility than just big data that is siloed.
FUTURE FOR UTILITIES 12
—What's the future for utilities?
This report reveals that there are numerous opportunities available to utilities as they begin to break down the silos across their organizations and connect different data sources to make more fully informed decisions.
Data can drive significant changes, but only when it feeds the big picture. Recommendations for utilities include:
• Understand what data your organization has to-day and what it’s doing with the information
• Consider what data is needed to build a more complete picture of your organization’s assets
• Explore how different data sources can be lever-aged across your organization, for example: how asset data influences areas such as cyber secu-rity and outage management
• Consider the roles of customer data and social media in building a more complete picture of the utility for both employees and customers
• Plan for how emerging technologies, such as mi-crogrids and DERs, will fit into your organization in terms of data needs and opportunities, as well as how those technologies may change your orga-nization’s approach toward data
What is your data doing for you? Isn’t it time it did more? Contact us to learn more about unlocking the potential of your data resources.

13 TH E DATA CO R E D R I V I N G U TI L IT Y O PER ATI O N A L E XCEL L EN CE
Additional informationWe reserve the right to make technical changes or modify the contents of this document without prior notice. With regard to purchase orders, the agreed particulars shall prevail. ABB AG does not accept any responsibility whatso-ever for potential errors or possible lack of information in this document.
We reserve all rights in this document and in the subject matter and illustra-tions contained therein. Any reproduc-tion, disclosure to third parties or utilization of its contents – in whole or in parts – is forbidden without prior written consent of ABB AG.
Enterprise Software is part of the Grid Automation business unit in ABB’s Power Grids division.
ABB is a global leader in power and automation technologies. Our solutions improve the efficiency, productivity and quality of our customers’ operations while minimizing environmental impact. Innovation is at the forefront of what we do and many of the technologies that drive modern society were pioneered by ABB.
The Enterprise Software product group offers an unparalleled range of solutions for asset performance management, opera-tions and workforce management, network control and energy portfolio management.

—ABB Ltd.
Grid Automation Enterprise Software
Americas: +1 678 825 1458+1 800 868 0497 from US and Canada
Europe, Middle East, Africa: +44 1483 794080
Asia Pacific: +61 7 3303 3333
abb.com/enterprise-software
9AKK107045A1535
RE
V A
18.
5.20
10 #
1499
5
© Copyright 2017 ABB. All rights reserved. Specifications subject to change without notice.