whitepaper product quality flavor - beefresearch papers... · to document and improve the flavor of...
TRANSCRIPT
Beef Flavor: A review from chemistry to consumerC.R. Kerth and R.K. Miller
Texas A&M University Department of Animal Science
BEEFRESEARCH
WH
ITE
PA
PE
R:
PR
OD
UC
T Q
UA
LIT
Y
1
IntroductionFlavor is an important component of beef taste to consumers and, in the late 1800s, documented efforts first appeared to formally improve beef flavor in a controlled manner (Chemioux, 1874). So, for more than 140 years Americans have sought to document and improve the flavor of beef with patented discoveries and research (Chemioux, 1874; Filbert, 1909; and Howe and Barbella, 1937). In fact, Howe and Barbella (1937) noted that very little evidence existed as to the chemical characteristics of meat flavor. They surmised it was likely a composite of salts, acids and a group of products resulting from heating, and it most likely involved the disintegration products of proteins and lipids. The purpose of this paper is to provide a review of the most recent literature and knowledge of beef flavor. A linear story exists in the explanation of the generation of aroma compounds, the methods in which they are generated and the relevance to today’s consumer. After all, beef has a unique flavor among muscle foods making it distinctively popular with consumers.
Physiology of flavorA discussion on the topic of beef flavor requires a basic understanding of taste itself. It is important to realize that taste, and more specifically flavor, is detected by humans by a very complex system of sensory tissues located on the tongue and in the sinus and nasal cavities.
Basic tastes Chandrashekar et al. (2006) and Ogawa (1994) have provided a modern description of the physiology of gustatory (basic senses of taste in the mouth, sinus and tongue) sensing of flavor. The basic tastes detected on the tongue include sweet, sour, salty, bitter and umami. Historically, it has been thought that the primary sensing of these basic tastes occurred in specific locations on the tongue for each individual taste with little overlap. They reported that there is no ‘taste map’ on the tongue. Chandrashekar et al. (2006) described emerging taste sensing as quite simple. A taste bud is composed of 50-150 taste receptor cells (TRCs) distributed across different papillae on the tongue. Each TRC projects microvillae on the apical surface of the taste bud to
form a ‘taste pore’ which is the site of the interaction with the food containing the taste. It seems clear from this report that distinct cell types on the tongue express unique receptors and are tuned to detect each of the five basic tastes. Each receptor cell functions as a dedicated sensor, wired to give the stereotypic response for each taste.
Gilbertson et al. (2000) described seven trans-membrane helix receptors found in TRCs of the taste buds on the tongue that initiate signaling cascades by coupling to G proteins, effector enzymes, second messengers and ion channels. Apical ion channels pass ions leading to depolarizing and/or hyper-polarizing responses, resulting in taste. They identified adenylyl cyclase-generated cAMP and PLCBeta-2-generated IP3 as secondary messengers in sweet transduction. Epithelial-type sodium channels transduction mechanisms result in the salty taste and proton concentration is directly related to sour taste. Bitter taste is detected in 20-30% of TRCs in the palate and all taste papillae and chemosensory cells in the gut and vomeronasal organs by gustducin, which is a transducing-like G-protein. Finally, umami is primarily stimulated by L-glutamate, typically in the form of monosodium glutamate.
Aroma flavors In 1969, Mozell et al. reported that a great deal of confusion existed as to the extent that smell impacted flavor. They studied human subjects that either had naturally or artificially disabled nasal chemoreceptors. Since sucrose and salt are classical gustatory senses and are not normally considered to stimulate nasal chemoreceptors, they were surprised to find a dramatic loss in the ability of their subjects to identify salt water and sugar water when their nasal receptors were rendered functionally inoperable. They concluded that smell plays an extremely important role in the perception of all flavors.
Shepherd (2005) reviewed the theory of olfactory processing and its importance to flavor and aromas. Of particular note is the fact that cells in the olfactory bulb are sensitive to one-carbon differences between stimulating molecules, demonstrating the degree of sensitivity of human smell. Shepard

2
(2005) concluded that odor “images,” combined with taste, somatosensation, vision, hearing and motor manipulation, provide the basis for the perception of flavor. This is a higher cognitive function uniquely developed in humans with the help of language.
Chemistry of aroma flavors Although the five basic gustatory flavors make up an important part of beef flavor, it is evident that even those basic flavors depend largely on volatile aromas detected by the olfactory system. While a great deal of interaction exists among these various receptors, this review will focus primarily on the volatile aroma compounds in beef, making note of the contribution of the basic tastes where appropriate.
Aroma chemical traits Wasserman (1972) described raw meat “in general has a salty, metallic, bloody taste and a sweet aroma resembling serum.” Additionally, MacLeod and Ames (1986) reported that even after heating ground fillet steak in a skillet for 1 minute at 104°C, no meaty aromas were present. But after heating at 171°C, numerous “meaty” aromas were noted. This indicates that heating meat is required to produce the meaty, beefy aromas normally found in cooked beef.
Lipid thermal degradation The thermal breakdown of lipids can best be described as the disassembly of neutral (triglycerides) and polar (phospholipids) lipids due to the change in energy stabilization during the heating process. It is generally recognized that disassembly favors shorter fatty acid chains and less saturation. Furthermore, triglycerides under thermal degradation form diglycerides, monoglycerides, and glycerol with no preference in the order of fatty acid position on the glycerol backbone. In general, the polar lipids are favored for degradation over the neutral lipids due to their higher degree of unsaturation as well as the absence of a fatty acid on the third carbon of the glycerol backbone giving rise to easier degradation. Nawar (1969) reported that when triglycerides were heated, shorter-chain fatty acids were released at a much greater incidence than long-chain fatty acids. It was suggested that shorter-chain fatty acids are favored due to their higher solubility in water. This
suggests that because the release of fatty acids from the glycerol chain is dependent on the amount of heat and composition, length and degree of unsaturation of fatty acids, the amount of heating would directly affect the quantity of volatile fatty acid products and therefore the flavor.
Much of that early work (Hornstein and Crowe, 1960; Kramlich and Pearson, 1960; Macy et al., 1964; Wasserman and Gray, 1965) suggested that the products of lipid degradation during cooking are responsible for species flavor largely based on the fact that the composition of fatty acids were very unique to each species. It also was suggested that the lean tissue was responsible for the ‘meaty’ flavor found in all species, though it is important to remember that all lean tissue contains the phospholipid fraction in the cell membranes that house unique fatty acids. These polar lipids make up a very small proportion of the total lipids in beef, but are extremely important to the formation of flavor components. Therefore, it is difficult to solely attribute species flavors to adipose tissue alone, but instead, it’s necessary to understand the complex nature of flavor development and the overlap of lipid and water-soluble compounds and their contribution to flavor.
The simplest products of lipid degradation result from the modification of fatty acids upon their removal from the glycerol backbone. These primary degradation products tend to be fairly simple compounds that bear resemblance to the fatty acid from which they are derived. As Mottram (1998) described, the most basic volatile compounds are aliphatic hydrocarbons, aldehydes, ketones, alcohols, carboxylic acids and esters. While most of these exist as simple, straight-chain compounds, it is important to know that some aromatic (cyclical structure) and oxygenated heterocyclic compounds such as lactones and alkylfurans compounds have also been reported.
The products of thermal lipid degradation are very similar to those of lipid oxidation that occur during long-term storage of beef under oxidizing conditions (Mottram, 1998; 1985). The compounds, their composition, and the resulting aromas in oxidized
beef tend to be described as having negative, rancid, off-flavor aroma descriptors, while those derived from thermal degradation during the cooking process are described as being very favorable and characteristic of cooked beef. In cooked beef, these chemical reactions occur much more rapidly and the different profiles, or composition of volatiles, contribute to the desirable aromas. It is important to remember that, even if beef is cooked without any subcutaneous, intermuscular, or intramuscular fat, the volatile compounds derived from lipids are quantitatively dominant. Only in beef grilled under severe conditions, generally greater than 300oF (149oC), are Maillard (browning chemistry)-derived volatiles the major components.
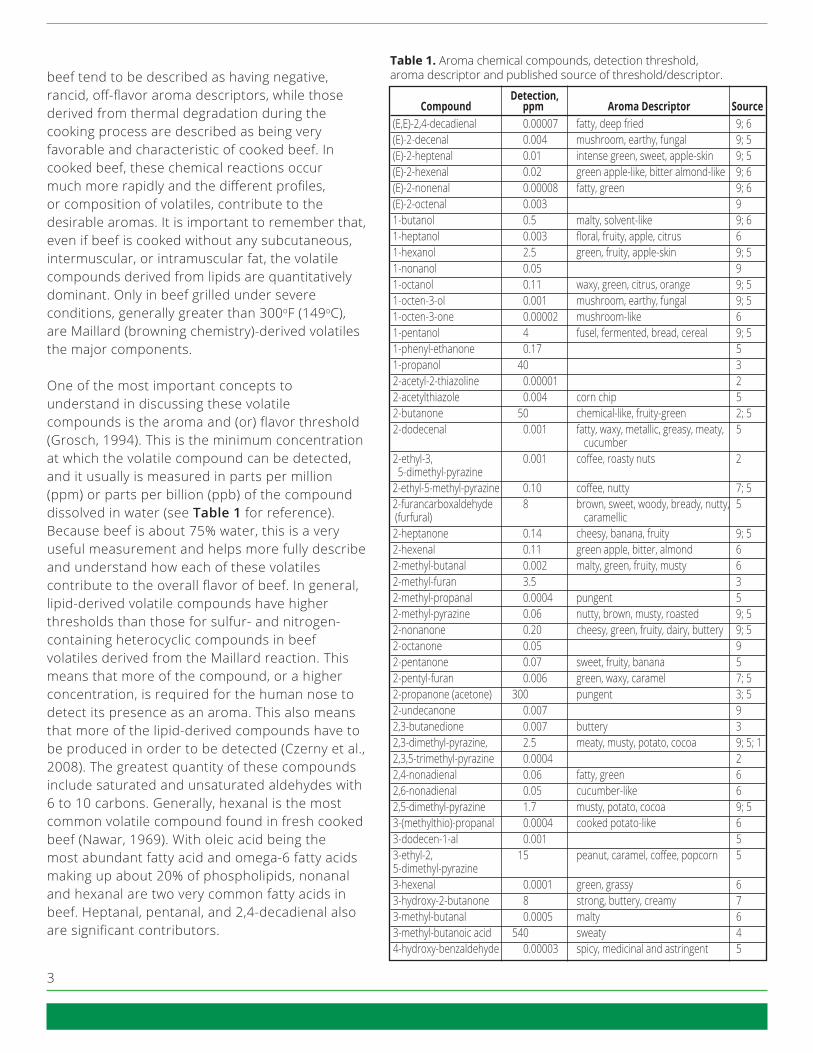
One of the most important concepts to understand in discussing these volatile compounds is the aroma and (or) flavor threshold (Grosch, 1994). This is the minimum concentration at which the volatile compound can be detected, and it usually is measured in parts per million (ppm) or parts per billion (ppb) of the compound dissolved in water (see Table 1 for reference). Because beef is about 75% water, this is a very useful measurement and helps more fully describe and understand how each of these volatiles contribute to the overall flavor of beef. In general, lipid-derived volatile compounds have higher thresholds than those for sulfur- and nitrogen-containing heterocyclic compounds in beef volatiles derived from the Maillard reaction. This means that more of the compound, or a higher concentration, is required for the human nose to detect its presence as an aroma. This also means that more of the lipid-derived compounds have to be produced in order to be detected (Czerny et al., 2008). The greatest quantity of these compounds include saturated and unsaturated aldehydes with 6 to 10 carbons. Generally, hexanal is the most common volatile compound found in fresh cooked beef (Nawar, 1969). With oleic acid being the most abundant fatty acid and omega-6 fatty acids making up about 20% of phospholipids, nonanal and hexanal are two very common fatty acids in beef. Heptanal, pentanal, and 2,4-decadienal also are significant contributors.
3
Detection, Compound ppm Aroma Descriptor Source (E,E)-2,4-decadienal 0.00007 fatty, deep fried 9; 6 (E)-2-decenal 0.004 mushroom, earthy, fungal 9; 5 (E)-2-heptenal 0.01 intense green, sweet, apple-skin 9; 5 (E)-2-hexenal 0.02 green apple-like, bitter almond-like 9; 6 (E)-2-nonenal 0.00008 fatty, green 9; 6 (E)-2-octenal 0.003 9 1-butanol 0.5 malty, solvent-like 9; 6 1-heptanol 0.003 floral, fruity, apple, citrus 6 1-hexanol 2.5 green, fruity, apple-skin 9; 5 1-nonanol 0.05 9 1-octanol 0.11 waxy, green, citrus, orange 9; 5 1-octen-3-ol 0.001 mushroom, earthy, fungal 9; 5 1-octen-3-one 0.00002 mushroom-like 6 1-pentanol 4 fusel, fermented, bread, cereal 9; 5 1-phenyl-ethanone 0.17 5 1-propanol 40 3 2-acetyl-2-thiazoline 0.00001 2 2-acetylthiazole 0.004 corn chip 5 2-butanone 50 chemical-like, fruity-green 2; 5 2-dodecenal 0.001 fatty, waxy, metallic, greasy, meaty, 5 cucumber 2-ethyl-3, 0.001 coffee, roasty nuts 2 5-dimethyl-pyrazine 2-ethyl-5-methyl-pyrazine 0.10 coffee, nutty 7; 5 2-furancarboxaldehyde 8 brown, sweet, woody, bready, nutty, 5 (furfural) caramellic 2-heptanone 0.14 cheesy, banana, fruity 9; 5 2-hexenal 0.11 green apple, bitter, almond 6 2-methyl-butanal 0.002 malty, green, fruity, musty 6 2-methyl-furan 3.5 3 2-methyl-propanal 0.0004 pungent 5 2-methyl-pyrazine 0.06 nutty, brown, musty, roasted 9; 5 2-nonanone 0.20 cheesy, green, fruity, dairy, buttery 9; 5 2-octanone 0.05 9 2-pentanone 0.07 sweet, fruity, banana 5 2-pentyl-furan 0.006 green, waxy, caramel 7; 5 2-propanone (acetone) 300 pungent 3; 5 2-undecanone 0.007 9 2,3-butanedione 0.007 buttery 3 2,3-dimethyl-pyrazine, 2.5 meaty, musty, potato, cocoa 9; 5; 1 2,3,5-trimethyl-pyrazine 0.0004 2 2,4-nonadienal 0.06 fatty, green 6 2,6-nonadienal 0.05 cucumber-like 6 2,5-dimethyl-pyrazine 1.7 musty, potato, cocoa 9; 5 3-(methylthio)-propanal 0.0004 cooked potato-like 6 3-dodecen-1-al 0.001 5 3-ethyl-2, 15 peanut, caramel, coffee, popcorn 5 5-dimethyl-pyrazine 3-hexenal 0.0001 green, grassy 6 3-hydroxy-2-butanone 8 strong, buttery, creamy 7 3-methyl-butanal 0.0005 malty 6 3-methyl-butanoic acid 540 sweaty 4 4-hydroxy-benzaldehyde 0.00003 spicy, medicinal and astringent 5
Table 1. Aroma chemical compounds, detection threshold, aroma descriptor and published source of threshold/descriptor.

4
Maillard-reaction products The Maillard reaction is a type of non-enzymatic browning of great interest to food scientists (Thorpe and Baynes, 2003). The Maillard reaction that involves carbonyl groups with free amino acids is most often associated with the browning that takes place when beef is cooked at higher temperatures. Aside from the Maillard reaction, browning can also occur at room or refrigerated temperatures such as when dehydrated foods darken and develop off-flavors. Additionally, although browning is a trademark found during the Maillard reaction, it should not be confused with the carmelization of sugar during heating in the absence of amino acids. Generally, Maillard reactions do not occur until the surface temperature of the beef reaches about 300oF (149oC) and under dry-cooking conditions. If the surface of the beef remains moist, the temperature at the surface never gets above boiling (212oF/100oC) and the Maillard reaction cannot take place. Cooking methods will be discussed in greater detail later in this paper. According to Nursten (1980), the significance of the Maillard reaction for food includes the production of color, the production of flavor and off-flavor, a reduction in nutritional value, possible toxicity through the potential formation of imidazoles and nitroso-derivatives, and finally the formation of antioxidant properties.
Unlike protein-derived volatile compounds, the lipid-degradation products contain only carbon, hydrogen and oxygen, as these are the only elements present in lipids that play a part in volatile compounds. The main reaction in Maillard products involves the breakdown of proteins in beef when in the presence of a ‘reducing’ sugar. The two primary elements derived from protein other than the carbon, hydrogen and oxygen, also found in the lipids, are nitrogen from the peptide backbone, and sulfur from the side chains of amino acids, which are the building blocks of proteins. Fortunately, a reducing sugar, ribose, is available in close proximity to the proteins in the form of DNA and RNA as these contain deoxyribose or ribose in the nucleic acids, respectively. The first step in the Maillard reaction is the removal of water, or a dehydration reaction. This further reinforces the need of a dry atmosphere to promote the first reaction to take place. Associated with the Maillard reaction is Strecker degradation
4-methyl-phenol (p cresol) 0.004 fecal, horse stable-like 6 4-pentenal 1.5 roasted 2; 5 6-methyl-5-hepten-2-one 0.05 9 Acetaldehyde 0.02 fresh, green 9; 6 Acetic acid 180 sour, vinegar 6 Acetic acid, butyl ester 0.00001 5 Acetic acid, decyl ester 0.23 waxy, soapy, fatty 5 Acetophenone 0.07 nutty, musty, fruity 9; 5 Alpha-pinene 0.006 woody, pine, turpentine-like 2 Benzaldehyde 0.35 almond, nutty, woody 9 Benzeneacetaldehyde 0.004 sweet, floral honey, rosy 8; 5 Benzenemethanol 20 chemical, fruity, balsamic 8 Butanal (butyraldehyde) 0.009 musty, fusel, fermented, 9; 5 bready/yeasty Butanoic acid 2.4 sweaty, rancid 4 Butanoic acid, ethyl ester 0.0008 fruity 6 Butyrolactone 20 milky, creamy, peach-like 5 Decanal 0.002 orange, citrus 9; 11; 5 Dimethyl sulfide 0.001 asparagus-like, putrid 3; 6 Dimethyl trisulfide 0.000005 sulfureous, alliaceous, gassy 2; 5 Dimethyl disulfide 0.0002 3 Dodecanal 0.0005 soapy, waxy, citrus, orange rind 11; 5 Dodecane n/a floral, fragrant, geranium 1 E-2-decenal 0.0004 9 Ethanol 990 medicinal 3 Heptanal 0.003 castor oil, strong, fatty, harsh 9 Heptanoic acid 3.0 cheesy, fruity, dirty 2; 5 Heptanol 0.003 5 Heptenal 0.003 fishy 9 Hexanal 0.005 green, grasssy 9; 6 Hexanoic acid 3.0 floral, lavender 10; 5 Indole 0.14 fecal, mothball-like 9; 6 L-limonene 0.00001 lemon-like, citrus 2 Methanethiol 0.00002 veg oil, alliaceous, eggy, creamy 5 Methyl-pyrazine 60 7 Nonanal 0.001 citrus-like, soapy 9; 6 Nonenal 0.0002 cucumber, melon 2; 5 Octanal 0.007 citrus-like, green 10 Octanoic acid 3.0 10 Octenal 0.003 2 Pentanal 0.01 winey, fermented, bready 9; 5 Pentanoic acid 11 sweaty, fruity 6 Phenyl acetaldehyde 0.004 sweet, honey, rose 9; 5 Propanoic acid 5 acidic, dairy, fruity 5 Styrene 0.004 sweet, balsamic, floral — 5 extremely penetrating Sulfur dioxide 50 5 Thiobis-methane 0.0003 sulfureous, creamy, tomato, fishy 5 Trimethyl-pyrazine 0.009 raw, musty, potato 2; 5 Undecanal 0.0004 waxy, buttery, soapy, 2; 5 laundry detergent Undecenal 0.0008 soapy, metallic 61 Macleod and Ames, 19862 Leffingwell and Leffingwell, 19913 Mulders, 19734 Schieberle and Hofmann, 19975 Burdock, 20106 Czerny et al., 2008
7 Buttery and Ling, 19958 Shimoda et al., 19969 Buttery et al., 198810 Van Gemert and Nettenbreijer, 197711 Ahmed et al, 1978
5
of amino acids by dicarbonyl compounds formed in the Maillard reaction (Thorpe and Baynes, 2003). The amino acid is decarboxylated and deaminated forming an aldehyde while the dicorbonyl is converted to an aminoketone or aminoalcohol. If the amino acid is cysteine, Strecker degradation can also lead to the production of hydrogen sulfide, ammonia and acetaldehyde. These lead to a rich source of intermediates of many important classes of flavor compounds including furans (contains O), pyrazines (contains N), pyrroles (contains N), oxazoles (contains N), thiophenes (contains S), thiazoles (contains S) and other heterocyclic compounds. The Maillard and related reactions are extraordinarily complex and contribute a myriad of compounds involved in the flavors, which are generally described as roasted, browned, meaty, caramelized and more.
Lipid-Maillard interactionsAs would be expected with the hundreds of compounds possibly produced from both the lipid-degradation and Maillard reactions, the interaction of these products is unavoidable (Farmer and Mottram, 1990). As a result, new volatile products may be formed. Also, the presence of products from one reaction could wholly or partially block the development of products from another reaction.
Shahidi (2004) described how the aldehydes that were generated during thermal lipid degradation can participate in the Maillard reaction at both the initial and later stages of thermal processing. Volatile pyridines, pyrazines, thiophenes, thiazoles and oxazoles with alkyl side chains can be formed. Several thiazoles with four- to eight-carbon alkyl substituents in the two position have been reported in roast beef, and other alkylthiazoles with longer alkyl chains have been identified in the volatiles of heated beef. In general, volatile compounds from lipid-Maillard interactions have weaker odor intensities and higher odor thresholds compared to those generated in each of the primary reactions. Moreover, volatiles produced in the interaction of these two systems may have indirect impacts on the generation of volatile flavor compounds. In particular, Shahidi (2004) reported that phospholipids and their degradation products inhibit important reactions involved in the formation of heterocyclic aroma compounds in the Maillard
reaction. Therefore, the generation of sulfur-containing hetercyclics during thermal processing of beef may be reduced by this inhibition. Interestingly, this inhibition may help to maintain reasonable levels of many of the sulfur compounds that may have malodors at higher concentrations and thereby contribute to a balanced generation of complex aroma and flavor notes.
Factors that affect aroma chemicalsNumerous factors can affect the generation of volatile aroma chemicals. The intent of this section is to use the information covered in the previous section to relate different intrinsic and extrinsic factors that can affect the generation of these compounds. The intrinsic factors are inherent traits in the muscle related to the chemical composition, pH, or anything else that can affect the chemical reactions previously described. We generally have very little control over these factors other than to recognize their existence and perhaps apply methods to maximize the intended result. Extrinsic factors, on the other hand, are those we implicitly control, allowing us to manipulate thegeneration of the desired aroma compounds andreduce the generation of unwanted aroma compounds.
Extrinsic factorsBy far, the most important extrinsic factor that affects the generation of volatile aroma compounds is cooking method. When referring to cooking method, the primary consideration is whether the method heats the beef under moist conditions or dry conditions. In general, moist conditions exist in enclosed containers, like slow cookers, or under conditions in which the moisture cooking out of the beef is unable to escape the surface of the beef, due to either insufficient heat or the cooking surface (meat surface/heat source interface) preventing the removal of the moisture (Lorenzen et al., 1999, 2003).
As mentioned previously, moist heat cookery causes the beef to cook at low temperatures very close to the boiling point of water (< 212oF or 100oC). These low temperatures prevent the surface temperature of the beef to reach sufficient temperatures for the development of Maillard products. Secondarily, low temperatures fail to promote the initial step in the Maillard reaction, which is a dehydration step or a loss of water from the beef surface. These conditions
6
normally are associated with methods such as pot roasting, boiling, braising and stewing. The surface color of the beef cooked using these methods turns a brownish-gray color and does not resemble the caramelized brown color that results from the Maillard reaction.
Dry-heat cookery such as grilling, broiling or pan-frying typically uses temperatures of > 350oF (177oC) and results in the surface turning brown or black colors (Lorenzen et al., 1999, 2003). Dry, high-temperature cooking of beef generates Maillard products through an extremely complex process that involves not only the temperature, but also the length of time that the beef is held at that temperature. As the degree of doneness increases, the internal temperature increases and the time that the beef is held at the cooking temperature increases to reach the desired internal temperature. The flavor will change as the physical characteristics of the internal portion of the beef changes due to cooking time and temperature. In addition, the flavor profile of the external surface will vary dependent on the length of cooking time, even when the cooking temperature is held the same (Lorenzen et al., 1999, 2003).
Intrinsic factorsThe physical make up and chemical traits of the beef determine how the beef will act during the cooking process with regard to the production of volatile aroma compounds. Because the very basic cooking theory involves the transfer of heat and the transfer of mass (water), the ability of beef to conduct heat and transfer water become paramount to its cooking. Additionally, since water is the primary mode of heat transfer, these two phenomena end up working against each other (MacLeod and Coppock, 1977).
The transfer of water within the beef through evaporation from its surface is mostly affected by the ability of the muscle to hold water (its water-holding capacity) and its water activity. While very little water is actually chemically bound to proteins within the muscle, it is held in place by capillary forces and water tension. The ability of the muscle to hold water is primarily determined by the pH of the muscle. As the pH of the beef increases, the water-holding capacity also increases and heat transfer increases (Meynier and Mottram, 1995). Pale, soft and exudative beef
does not hold water well, so the free water travels readily to the surface where it cools the heating surface and keeps the surface temperature low. This results in the generation of mostly lipid-degradation products and very few Maillard-reaction products. While pH has an indirect impact on the ability of beef to produce Maillard products, Meynier and Mottram (1995) also reported with in vitro studies that pH directly affects the production of specific classes of Maillard-reaction products. Pyrazine, pyrimidine, and some thiophene production was increased as pH rose from 4.5 to 6.5 while the quantity of most of the furans rose as the pH decreased.
Volatile measurement Today, the measurement of volatile aroma compounds is relatively straightforward and reliable. Most research on volatile compounds utilizes headspace analyses where the cooked beef, usually the same sample that is used for human sensory evaluation, is put into an enclosed container and the space above the beef is sampled with a solid-phase micro-extraction fiber or SPME. This SPME fiber is then desorbed onto a gas chromatography/mass spectrophotometer (GC/MS) which may or may not be equipped with an olfactory, or smell port where a panelist can smell the volatile compounds as they exit the GC/MS. The panelist’s evaluation is then matched with the identification of the compound on the mass spectrometer to be used for analyses. The benefit of measuring the beef samples in this manner is that the volatile compounds can be measured on the exact samples that a trained or consumer sensory panel are using so volatile aroma compounds can be correlated to consumer like and dislike.
Current state of beef sensory researchSensory researchThe relationship between beef attributes and eating quality has been extensively studied within the beef industry since the early 1900s. The beef industry recognized the need to assess eating quality or palatability of beef when it implemented the USDA Beef Quality grading system in 1916, which was first published in 1923 (USDA, 1997). This system used carcass maturity and intramuscular fat or marbling to segment beef carcasses into classes based on beef palatability. Understanding the relationship of
7
carcass fatness and marbling with beef palatability and consumer preferences has been investigated from the early 1900s to the present. Watkins (1936) discussed the need of the beef industry to understand consumer preferences for beef and variation in those preferences. While he did not present data on consumer perceptions, he did discuss the concept of fatness and its relationship to meat palatability. Scott (1939) stated that consumers were becoming better educated in the selection of beef and that they looked for a certain amount of fat as an indication of quality. Scott (1939) further discussed that tenderness and flavor were important attributes to consumers. He stated that tenderness was the most important factor and that flavor, while not as important, was still an important component in consumer acceptability. While Watkins (1936) and Scott (1939) did not present data to substantiate their statements, the need to meet consumer demands within the beef industry is a long-established practice.
In the early and middle 1900s, the beef industry generally accepted the premise that fatness, and specifically intramuscular fat or marbling, was related to beef eating quality. Brady (1957) summarized early consumer research that examined the preferences of consumers relative to USDA quality grade. However, this consumer preference research was based on local consumer preferences and consumers rated acceptance based on preference for one cut versus another. Brady (1957) addressed education level and income as they relate to consumer preferences. While the research was limited, early research established that fatness or marbling related to consumer perception of beef eating quality. Brady (1957) also stated that much of this consumer preference information had been inferred from laboratory panels or trained sensory panels with the implication that consumers who disagreed were ignorant or misinformed. He further justified the need to conduct consumer research to understand the linkage between consumer research and trained sensory or laboratory research.
The majority of the meat science literature before 1987 concentrated on examining the effect of production practices, carcass fatness, post-harvest technologies and/or marbling on beef eating quality using trained sensory panelists or mechanical
measurements of tenderness, mainly Warner-Bratzler shear force. However, Francis et al. (1977) conducted one of the first, large beef consumer tests to understand the effect of marbling on consumer preference, even though the study selected consumers who were attending the Farm Progress Show. They presented consumers (n=806) with two ribeye steaks differing in marbling and consumers rated flavor, juiciness, tenderness and overall acceptability using 6-point hedonic scales. Consumers preferred steaks with higher amounts of marbling for flavor, juiciness, tenderness and overall acceptability. These results helped document factors that affected beef eating quality. However, the use of consumer data to understand differences in beef palatability and the relationship between the findings of trained sensory attribute panels and consumer acceptance was not addressed nationally until Savell et al. (1987) conducted the National Consumer Retail Beef Study.
In the National Consumer Retail Beef Study, Savell et al. (1987) evaluated the effect of marbling on consumer preferences in 540 households in three cities. The study showed regional preferences existed based on marbling level and that differences in trained panel sensory attributes of juiciness, tenderness and flavor desirability mimicked consumer preferences. Statistical tools to understand the relationships between consumer acceptance and trained sensory data were not available for use in establishing these relationships. In the second phase of the same study, Savell et al. (1989) showed that consumers highly rated both USDA Choice and USDA Select steaks for consumer acceptance, but for different reasons. Consumers preferred the taste of USDA Choice beef and the leanness of USDA Select beef. The reporting and implementation of the results from the National Consumer Retail Beef Study changed how meat scientists and the beef industry addressed beef eating quality. Assessing consumer perceptions to improve beef eating quality became a more standard practice; however, it was concluded from this research that tenderness was the major driver of consumer acceptance.
The majority of trained and consumer research emphasized the relationship between beef tenderness and consumer liking throughout the late 1900s and into the 2000s. Interestingly, assessment of consumer
8
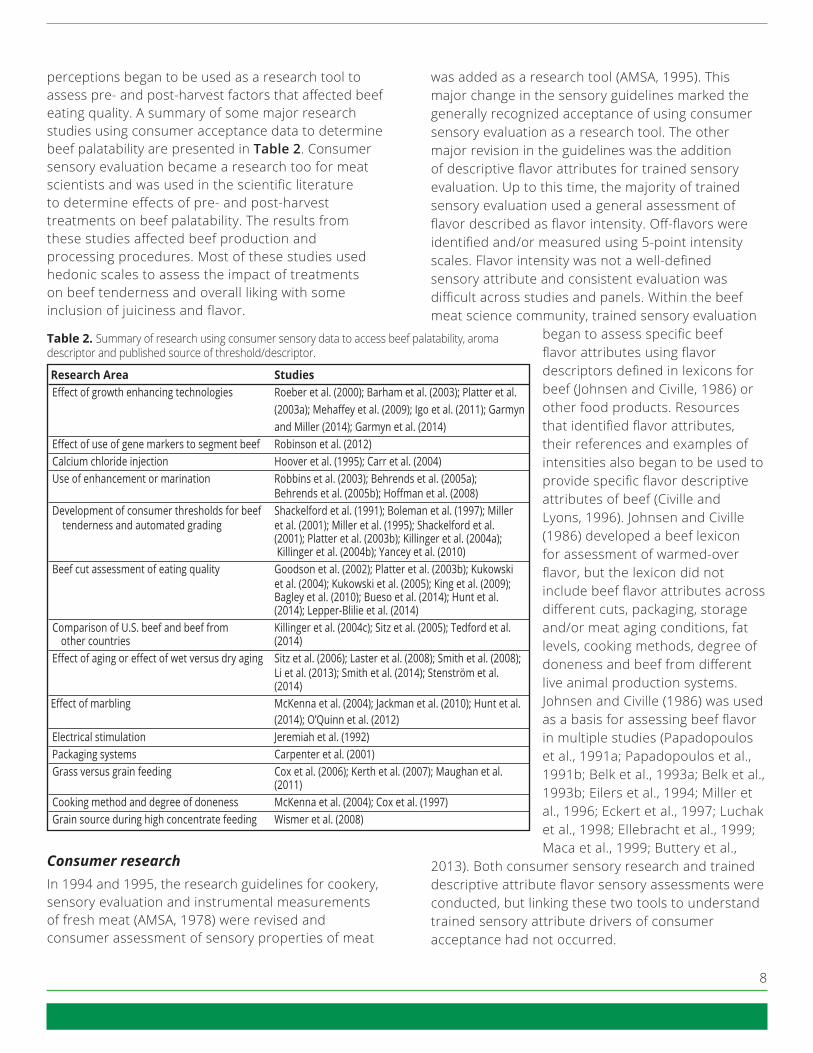
perceptions began to be used as a research tool to assess pre- and post-harvest factors that affected beef eating quality. A summary of some major research studies using consumer acceptance data to determine beef palatability are presented in Table 2. Consumer sensory evaluation became a research too for meat scientists and was used in the scientific literature to determine effects of pre- and post-harvest treatments on beef palatability. The results from these studies affected beef production and processing procedures. Most of these studies used hedonic scales to assess the impact of treatments on beef tenderness and overall liking with some inclusion of juiciness and flavor.
Consumer researchIn 1994 and 1995, the research guidelines for cookery, sensory evaluation and instrumental measurements of fresh meat (AMSA, 1978) were revised and consumer assessment of sensory properties of meat
was added as a research tool (AMSA, 1995). This major change in the sensory guidelines marked the generally recognized acceptance of using consumer sensory evaluation as a research tool. The other major revision in the guidelines was the addition of descriptive flavor attributes for trained sensory evaluation. Up to this time, the majority of trained sensory evaluation used a general assessment of flavor described as flavor intensity. Off-flavors were identified and/or measured using 5-point intensity scales. Flavor intensity was not a well-defined sensory attribute and consistent evaluation was difficult across studies and panels. Within the beef meat science community, trained sensory evaluation
began to assess specific beef flavor attributes using flavor descriptors defined in lexicons for beef (Johnsen and Civille, 1986) or other food products. Resources that identified flavor attributes, their references and examples of intensities also began to be used to provide specific flavor descriptive attributes of beef (Civille and Lyons, 1996). Johnsen and Civille (1986) developed a beef lexicon for assessment of warmed-over flavor, but the lexicon did not include beef flavor attributes across different cuts, packaging, storage and/or meat aging conditions, fat levels, cooking methods, degree of doneness and beef from different live animal production systems. Johnsen and Civille (1986) was used as a basis for assessing beef flavor in multiple studies (Papadopoulos et al., 1991a; Papadopoulos et al., 1991b; Belk et al., 1993a; Belk et al., 1993b; Eilers et al., 1994; Miller et al., 1996; Eckert et al., 1997; Luchak et al., 1998; Ellebracht et al., 1999; Maca et al., 1999; Buttery et al.,
2013). Both consumer sensory research and trained descriptive attribute flavor sensory assessments were conducted, but linking these two tools to understand trained sensory attribute drivers of consumer acceptance had not occurred.
Research Area Studies Effect of growth enhancing technologies Roeber et al. (2000); Barham et al. (2003); Platter et al. (2003a); Mehaffey et al. (2009); Igo et al. (2011); Garmyn and Miller (2014); Garmyn et al. (2014) Effect of use of gene markers to segment beef Robinson et al. (2012) Calcium chloride injection Hoover et al. (1995); Carr et al. (2004) Use of enhancement or marination Robbins et al. (2003); Behrends et al. (2005a); Behrends et al. (2005b); Hoffman et al. (2008) Development of consumer thresholds for beef Shackelford et al. (1991); Boleman et al. (1997); Miller tenderness and automated grading et al. (2001); Miller et al. (1995); Shackelford et al. (2001); Platter et al. (2003b); Killinger et al. (2004a); Killinger et al. (2004b); Yancey et al. (2010) Beef cut assessment of eating quality Goodson et al. (2002); Platter et al. (2003b); Kukowski et al. (2004); Kukowski et al. (2005); King et al. (2009); Bagley et al. (2010); Bueso et al. (2014); Hunt et al. (2014); Lepper-Blilie et al. (2014) Comparison of U.S. beef and beef from Killinger et al. (2004c); Sitz et al. (2005); Tedford et al. other countries (2014) Effect of aging or effect of wet versus dry aging Sitz et al. (2006); Laster et al. (2008); Smith et al. (2008); Li et al. (2013); Smith et al. (2014); Stenström et al. (2014) Effect of marbling McKenna et al. (2004); Jackman et al. (2010); Hunt et al. (2014); O’Quinn et al. (2012) Electrical stimulation Jeremiah et al. (1992) Packaging systems Carpenter et al. (2001) Grass versus grain feeding Cox et al. (2006); Kerth et al. (2007); Maughan et al. (2011) Cooking method and degree of doneness McKenna et al. (2004); Cox et al. (1997) Grain source during high concentrate feeding Wismer et al. (2008)
Table 2. Summary of research using consumer sensory data to access beef palatability, aroma descriptor and published source of threshold/descriptor.

In 1993 and 1994, the beef industry conducted the second major national consumer study: the Beef Customer Satisfaction Study. It was an in-home placement study involving two beef consumers in each of 300 households in each of 4 cities (Neely et al., 1998; Lorenzen et al., 1999; Neely et al., 1999; Savell et al., 1999). Consumers were provided Top Loin, Top Sirloin and Top Round Steaks. Cooking method, degree of doneness, and consumer overall, tenderness, juiciness and flavor liking were assessed. Steaks from the same cuts were used for both trained descriptive meat attribute sensory evaluation and Warner-Bratzler shear force assessment. Lorenzen et al. (2003) examined the relationships between consumer and trained descriptive sensory attribute evaluation. They concluded that although relationships existed between consumer and trained sensory measures, it was difficult to predict from objective data how consumers would rate meat at home. Neely et al. (1998) found that cut and city affected customer sensory rating, and for the first time in a national study, tenderness and flavor were documented as equal contributors to consumer overall liking. Up to this point, the beef industry had concentrated on the effect of tenderness on consumer liking and the assessment of beef flavor, while a component of trained and consumer sensory evaluation was not recognized as being a significant contributor to consumer overall liking.
LexiconWith more emphasis on flavor in beef, trained sensory tools to more adequately evaluate beef flavor were needed. Adhikari et al. (2011) presented a Beef Lexicon that accounted for the effects of cuts, packaging, storage and/or meat aging conditions, fat levels, cooking methods, degree of doneness and beef from different live animal production systems. They defined 26 major and minor aroma and flavor attributes and 12 other attributes that could be present. Maughan et al. (2011) developed 13 terms (astringent, barny, bloody, brothy, browned, fatty, gamey, grassy, juicy, livery, metallic, oxidized/warmed-over flavor and roast beef) and five tastes with definitions and quantitative references. While some of the attributes overlap between the two papers, the Beef Lexicon presented by Adhikari et al. (2011) was found to be repeatable and able to segment differences in beef cuts across USDA
quality grades when used by three independent trained sensory panels (Miller, 2010). Therefore, the Beef Lexicon presented by Adhikari et al. (2011) has been used in subsequent research to identify flavor attributes in beef and how they are related to consumer liking and volatile flavor compounds. Additionally, revisions in the meat cookery and sensory guidelines (AMSA, 2014) have incorporated the Beef Lexicon as a research tool to assess beef flavor. The Beef Lexicon has provided the beef industry with a consistent research tool to evaluate beef flavor.
Statistical ApproachAs new tools evolved for use in trained descriptive attribute sensory evaluation, consumer research tools also expanded in the 1990s and 2000s. New research tools, such as multivariate analysis, are used to understand factors that affect consumer liking. These tools provide sensory, food and meat scientists the ability to understand relationships between trained and consumer sensory attributes, between chemical components (either beef volatile aromatic compounds or chemical compounds) and between trained or consumer sensory tools.
Flavor ResearchFlavor research to understand the connection between chemical compounds and either positive or negative beef flavors is an ongoing process. Miller and Kerth (2012) identified positive and negative beef flavors using the Beef Lexicon (Adhikari et al., 2011). The positive beef flavors identified in the Beef Lexicon were beefy, brown/roasted, bloody/serumy, fat-like, sweet, salty and umami (Miller and Kerth, 2012). Attributes that generally were considered negative were metallic, liver-like, sour, barnyard, musty-earthy/humus and bitter. Beefy, browned/roasted, bloody/serumy, sweet, salty and umami were associated with the lean portion of beef; while, fat-like, liver-like, metallic and bitter were associated with the lipid portion (Miller and Kerth, 2012).
Current Consumer ResearchTo more fully understand the relationships between beef flavor attributes from the Beef Lexicon, consumer sensory liking and volatile aromatic chemical composition, Glasock (2014) used 16 beef treatments to create differences in beef flavor.
9
10
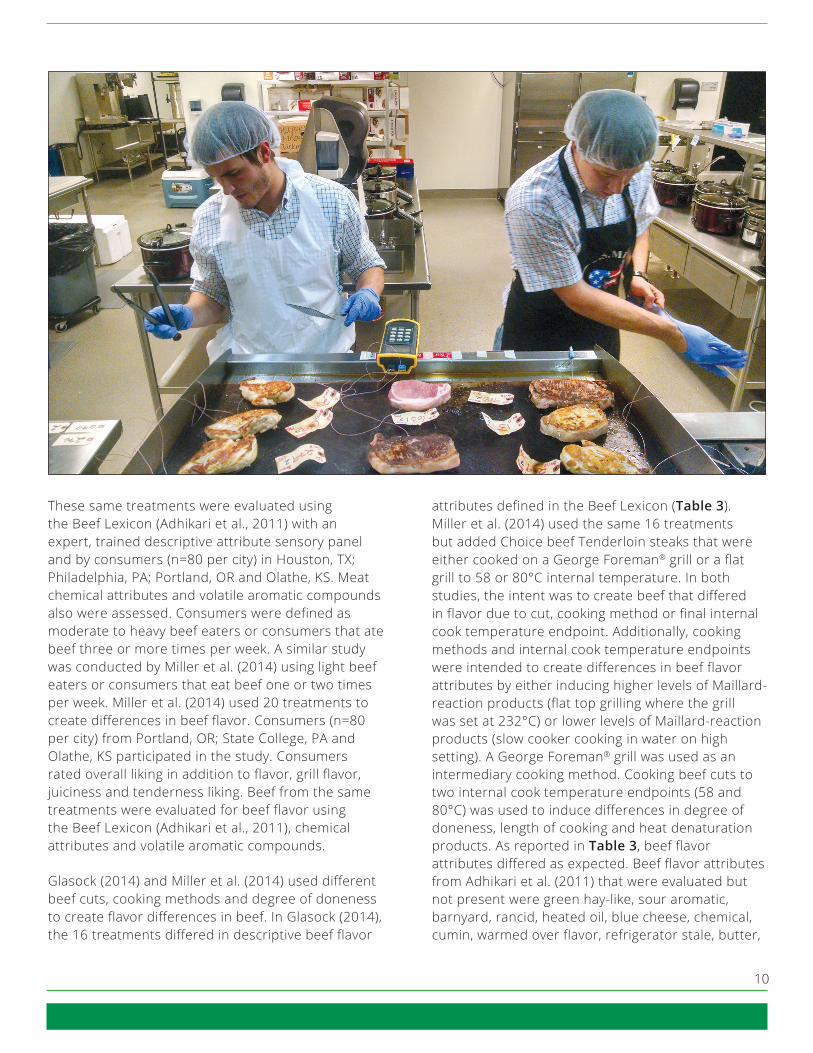
These same treatments were evaluated using the Beef Lexicon (Adhikari et al., 2011) with an expert, trained descriptive attribute sensory panel and by consumers (n=80 per city) in Houston, TX; Philadelphia, PA; Portland, OR and Olathe, KS. Meat chemical attributes and volatile aromatic compounds also were assessed. Consumers were defined as moderate to heavy beef eaters or consumers that ate beef three or more times per week. A similar study was conducted by Miller et al. (2014) using light beef eaters or consumers that eat beef one or two times per week. Miller et al. (2014) used 20 treatments to create differences in beef flavor. Consumers (n=80 per city) from Portland, OR; State College, PA and Olathe, KS participated in the study. Consumers rated overall liking in addition to flavor, grill flavor, juiciness and tenderness liking. Beef from the same treatments were evaluated for beef flavor using the Beef Lexicon (Adhikari et al., 2011), chemical attributes and volatile aromatic compounds.
Glasock (2014) and Miller et al. (2014) used different beef cuts, cooking methods and degree of doneness to create flavor differences in beef. In Glasock (2014), the 16 treatments differed in descriptive beef flavor
attributes defined in the Beef Lexicon (Table 3). Miller et al. (2014) used the same 16 treatments but added Choice beef Tenderloin steaks that were either cooked on a George Foreman® grill or a flat grill to 58 or 80°C internal temperature. In both studies, the intent was to create beef that differed in flavor due to cut, cooking method or final internal cook temperature endpoint. Additionally, cooking methods and internal cook temperature endpoints were intended to create differences in beef flavor attributes by either inducing higher levels of Maillard-reaction products (flat top grilling where the grill was set at 232°C) or lower levels of Maillard-reaction products (slow cooker cooking in water on high setting). A George Foreman® grill was used as an intermediary cooking method. Cooking beef cuts to two internal cook temperature endpoints (58 and 80°C) was used to induce differences in degree of doneness, length of cooking and heat denaturation products. As reported in Table 3, beef flavor attributes differed as expected. Beef flavor attributes from Adhikari et al. (2011) that were evaluated but not present were green hay-like, sour aromatic, barnyard, rancid, heated oil, blue cheese, chemical, cumin, warmed over flavor, refrigerator stale, butter,
Basic Tastes Warmed- Beef Brown/ Bloody/ Fat- Liver- Overall Card- Over Sour Treatment identity roasted serumy like Metallic like Umami Sweet Sour Salty Bitter Sweet boardy Flavor Dairy P – valueg <0.0001 <0.0001 <0.0001 <0.0001 <0.0001 0.17 <0.0001 0.00 <0.0001 0.00 0.00 <0.001 0.01 0.25 <0.001 Choice Top Sirloin Steaks GFh, 58°C 9.4ab 0.9abcd 3.3e 1.4de 2.8d 0.1a 0.3a 0.2a 2.6e 1.2bc 1.9b 0.4a 0.0a 0.0 0.1b
GF, 80°C 10.2bcd 1.1bcd 1.7b 0.9ab 2.1bc 0.1ab 0.7b 0.5b 2.1de 1.2b 1.7b 0.7abc 0.2ab 0.1 0.0ab
Grill, 58°C 9.7abc 1.1bcd 3.0e 1.5de 2.9d 0.1a 0.2a 0.3ab 2.7e 1.2bc 1.8b 0.4a 0.1ab 0.0 0.2b
Grill, 80°C 11.6f 2.5e 1.7b 1.0abcd 2.1b 0.0a 0.9bc 0.5b 2.1d 1.2bc 1.6b 0.6abc 0.2ab 0.1 0.0ab
Choice Bottom Round Roasts CPi, 58°C 9.9bc 0.5a 2.7de 1.1bcd 2.6d 0.3ab 0.8bc 0.6bc 2.2de 1.3bc 1.7b 0.5abc 0.3b 0.1 0.0ab
CP, 80°C 11.0def 1.2cd 1.1ab 1.0abc 1.7a 0.2ab 1.2c 0.7bc 1.4bc 1.4c 1.3a 0.9c 0.2ab 0.2 0.0ab Se Bottom Round Roasts CP, 58°C 9.2a 0.4a 2.3ce 1.0abc 2.5c 0.0a 0.7b 0.4ab 2.5e 1.3bc 1.8b 0.5ab 0.3b 0.0 0.2ab
CP, 80°C 11.3ef 0.9abcd 0.9a 1.0abc 1.7a 0.4b 1.3c 0.7bc 1.4bc 1.2b 1.4ab 0.9c 0.3ab 0.2 0.0ab
Choice Top Loin Steaks GF, 58°C 10.1bcd 0.8abc 2.5de 1.3cd 2.6cd 0.0a 0.5ab 0.6bc 2.1de 1.3bc 1.5ab 0.5abc 0.2ab 0.0 0.0ab
GF, 80°C 10.8def 0.9abcd 1.6b 1.2cd 2.0ab 0.4b 1.1c 0.6bc 2.0cd 1.3bc 1.5ab 0.6abc 0.2a 0.1 0.0ab
Grill, 58°C 10.4cde 1.4d 2.7e 1.5de 2.5cd 0.0a 0.6ab 0.5bc 2.2de 1.3bc 1.4ab 0.7abc 0.0ab 0.0 0.0ab
Grill, 80°C 11.4ef 2.2e 1.8b 1.3d 2.2b 0.1a 1.1c 0.8c 1.7c 1.5bc 1.6b 0.9c 0.0ab 0.0 0.0ab
High pH Top Loin Steaks GF, 58°C 8.8a 0.6ab 2.7e 1.6e 2.2bc 0.0a 0.4ab 0.7bc 1.3ab 1.0ab 1.6b 0.7bc 0.2ab 0.1 0.0ab
GF, 80°C 9.7abc 1.0abcd 1.5ab 1.3d 1.6a 0.2ab 0.5ab 0.6bc 1.3bc 1.0ab 1.7b 0.7abc 0.3b 0.1 0.0a
Grill, 58°C 8.8a 0.6ab 2.7e 1.6de 2.2bc 0.0a 0.3ab 0.6bc 1.3b 1.0a 1.7b 0.8bc 0.1ab 0.1 0.0a
Grill, 80°C 11.1def 2.1e 1.6b 1.9e 1.7a 0.0a 0.8bc 0.8c 0.9a 1.2bc 1.4ab 1.0c 0.2ab 0.0 0.0ab
RMSEj 1.04 0.61 0.60 0.31 0.38 0.28 0.38 0.24 0.38 0.20 0.32 0.33 0.23 0.16 0.10
Table 3. Beef flavor attribute (0=none; 15=extremely intense) least squares means for 16 beef cuts adapted from Glasock (2014).
abcdefMean values within a column followed by the same letter are not significantly different (P > 0.05).2gP - value from analysis of variance tables.hGeorge Foreman grill.5iCrockpot/slow cooker cooked.jRoot Mean Square Error.
11
12
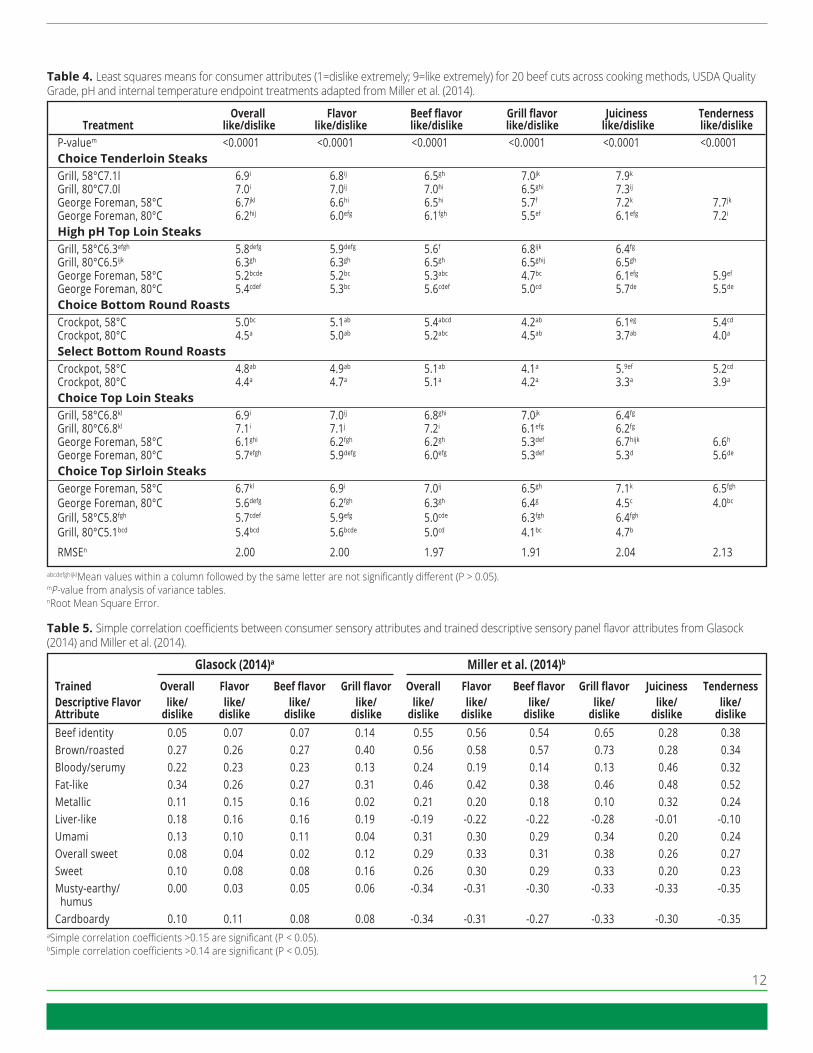
Table 5. Simple correlation coefficients between consumer sensory attributes and trained descriptive sensory panel flavor attributes from Glasock (2014) and Miller et al. (2014).
aSimple correlation coefficients >0.15 are significant (P < 0.05). bSimple correlation coefficients >0.14 are significant (P < 0.05).
Glasock (2014)a Miller et al. (2014)b Trained Overall Flavor Beef flavor Grill flavor Overall Flavor Beef flavor Grill flavor Juiciness Tenderness Descriptive Flavor like/ like/ like/ like/ like/ like/ like/ like/ like/ like/ Attribute dislike dislike dislike dislike dislike dislike dislike dislike dislike dislike Beef identity 0.05 0.07 0.07 0.14 0.55 0.56 0.54 0.65 0.28 0.38 Brown/roasted 0.27 0.26 0.27 0.40 0.56 0.58 0.57 0.73 0.28 0.34 Bloody/serumy 0.22 0.23 0.23 0.13 0.24 0.19 0.14 0.13 0.46 0.32 Fat-like 0.34 0.26 0.27 0.31 0.46 0.42 0.38 0.46 0.48 0.52 Metallic 0.11 0.15 0.16 0.02 0.21 0.20 0.18 0.10 0.32 0.24 Liver-like 0.18 0.16 0.16 0.19 -0.19 -0.22 -0.22 -0.28 -0.01 -0.10 Umami 0.13 0.10 0.11 0.04 0.31 0.30 0.29 0.34 0.20 0.24 Overall sweet 0.08 0.04 0.02 0.12 0.29 0.33 0.31 0.38 0.26 0.27 Sweet 0.10 0.08 0.08 0.16 0.26 0.30 0.29 0.33 0.20 0.23 Musty-earthy/ 0.00 0.03 0.05 0.06 -0.34 -0.31 -0.30 -0.33 -0.33 -0.35 humus Cardboardy 0.10 0.11 0.08 0.08 -0.34 -0.31 -0.27 -0.33 -0.30 -0.35
Table 4. Least squares means for consumer attributes (1=dislike extremely; 9=like extremely) for 20 beef cuts across cooking methods, USDA Quality Grade, pH and internal temperature endpoint treatments adapted from Miller et al. (2014).
abcdefghijklMean values within a column followed by the same letter are not significantly different (P > 0.05).mP-value from analysis of variance tables.nRoot Mean Square Error.
Overall Flavor Beef flavor Grill flavor Juiciness Tenderness Treatment like/dislike like/dislike like/dislike like/dislike like/dislike like/dislike P-valuem <0.0001 <0.0001 <0.0001 <0.0001 <0.0001 <0.0001 Choice Tenderloin Steaks Grill, 58°C 7.1l 6.9i 6.8ij 6.5gh 7.0jk 7.9k
Grill, 80°C 7.0l 7.0i 7.0ij 7.0hi 6.5ghi 7.3ij
George Foreman, 58°C 6.7jkl 6.6hi 6.5hi 5.7f 7.2k 7.7jk
George Foreman, 80°C 6.2hij 6.0efg 6.1fgh 5.5ef 6.1efg 7.2i
High pH Top Loin Steaks Grill, 58°C 6.3efgh 5.8defg 5.9defg 5.6f 6.8ijk 6.4fg
Grill, 80°C 6.5ijk 6.3gh 6.3gh 6.5gh 6.5ghij 6.5gh
George Foreman, 58°C 5.2bcde 5.2bc 5.3abc 4.7bc 6.1efg 5.9ef
George Foreman, 80°C 5.4cdef 5.3bc 5.6cdef 5.0cd 5.7de 5.5de
Choice Bottom Round Roasts Crockpot, 58°C 5.0bc 5.1ab 5.4abcd 4.2ab 6.1eg 5.4cd
Crockpot, 80°C 4.5a 5.0ab 5.2abc 4.5ab 3.7ab 4.0a
Select Bottom Round Roasts Crockpot, 58°C 4.8ab 4.9ab 5.1ab 4.1a 5.9ef 5.2cd
Crockpot, 80°C 4.4a 4.7a 5.1a 4.2a 3.3a 3.9a
Choice Top Loin Steaks Grill, 58°C 6.8kl 6.9i 7.0ij 6.8ghi 7.0jk 6.4fg
Grill, 80°C 6.8kl 7.1i 7.1j 7.2i 6.1efg 6.2fg
George Foreman, 58°C 6.1ghi 6.2fgh 6.2gh 5.3def 6.7hijk 6.6h
George Foreman, 80°C 5.7efgh 5.9defg 6.0efg 5.3def 5.3d 5.6de
Choice Top Sirloin Steaks George Foreman, 58°C 6.7kl 6.9i 7.0ij 6.5gh 7.1k 6.5fgh
George Foreman, 80°C 5.6defg 6.2fgh 6.3gh 6.4g 4.5c 4.0bc
Grill, 58°C 5.8fgh 5.7cdef 5.9efg 5.0cde 6.3fgh 6.4fgh
Grill, 80°C 5.1bcd 5.4bcd 5.6bcde 5.0cd 4.1bc 4.7b
RMSEn 2.00 2.00 1.97 1.91 2.04 2.13

soapy, sour milk dairy, chocolate, spoiled, dairy, medicinal, smoky wood, petroleum, painty and fishy as levels for these attributes were 0 or none. Similar results were reported by Miller et al. (2014) and Miller and Kerth (2012) when the Beef Lexicon attributes were used to evaluate beef that varied by cut, cooking method and internal temperature endpoint. From this work, it was concluded that the Beef Lexicon provided attributes that describe beef flavor and that it segmented beef flavor differences.
Glasock (2014) and Miller et al. (2014) reported on consumer liking ratings. Results from Miller et al. (2014) are presented in Table 4. Note that results were similar across the two studies. The 20 treatments that differed in beef flavor descriptive attributes also differed in consumer overall, flavor, beef flavor, grill flavor, juiciness and tenderness liking. Choice beef Tenderloin steaks cooked on the grill had the highest overall liking and Choice and Select Bottom Round roasts cooked in a crockpot were the least liked by consumers. Consumers liked the overall flavor, beef flavor, grill flavor, juiciness, tenderness and overall like for steaks cooked on the grill compared to steaks cooked on a George Foreman® grill. As internal temperature endpoint increased, or degree of doneness increased, consumer overall liking, flavor liking, beef flavor liking, juiciness liking and tenderness liking decreased across cuts and cooking methods. It was apparent that within these studies, differences in descriptive beef flavor attributes as evaluated by an expert trained panel using the Beef Lexicon and differences in consumer acceptance were present. To understand the relationships between consumer liking and trained sensory panel descriptive attributes, simple correlations were calculated (Table 5). In Miller et al. (2014), overall consumer liking was positively related to beef identity, brown roasted, fat-like, umami and overall sweet and negatively related to liver-like, musty-earthy/humus and cardboard. As would be expected, juiciness and tenderness liking were not as highly related to beef identity and brown/roasted, and grilled flavor liking was highly related to brown/roasted. These simple correlation coefficients showed that there was a relationship between trained descriptive flavor attributes from the Beef Lexicon and consumer liking ratings; however, the relationship was not strong for every attribute.
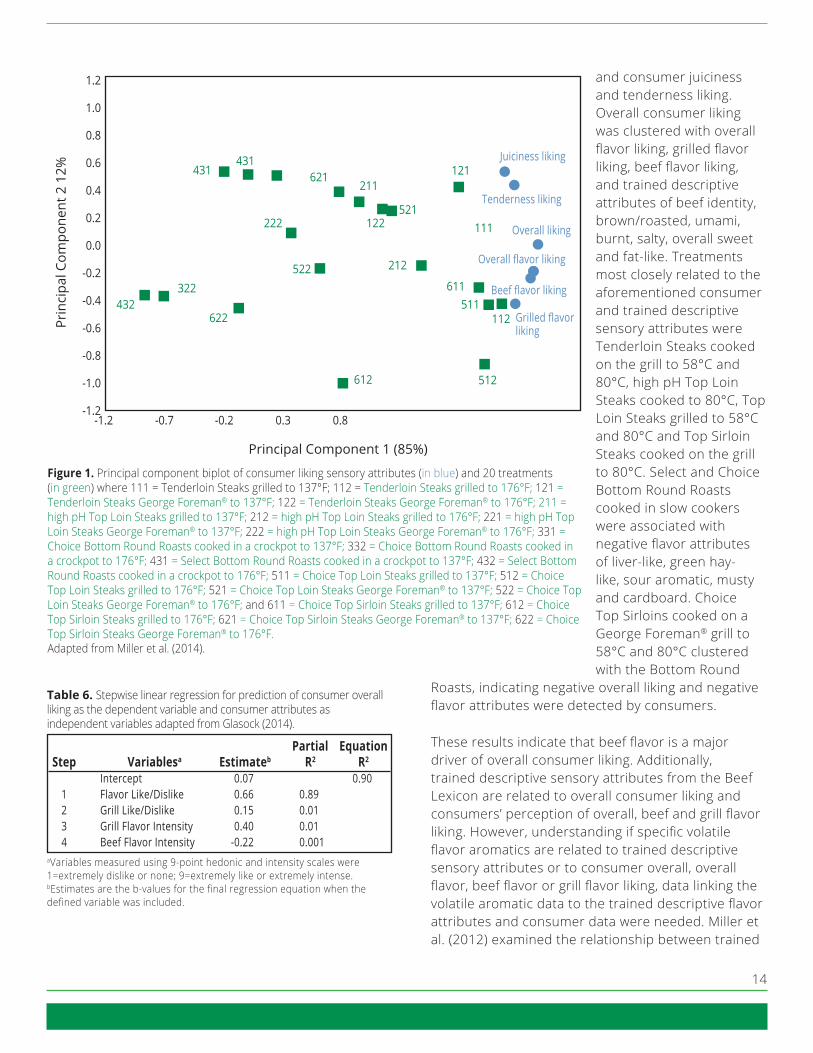
ClusteringTo more fully understand the relationship between consumer liking ratings and trained flavor descriptive attributes, biplots using principal component and partial least squares regression were generated from Miller et al. (2014) (Figures 1 and 2, respectively). Treatments were scattered across the biplot indicating differences in consumer liking across treatments. Principal component 1 accounted for 85% of the variation in consumer attributes with principal component 2 accounting for 12% of the variation. Juiciness and tenderness liking clustered together while overall liking and flavor liking clustered together, indicating that flavor was more highly related to overall liking than juiciness and tenderness liking. Similar results were reported by Glasock (2014). Additionally, Glasock (2014) reported that 90% of the variation in overall consumer liking could be accounted for using flavor, grill flavor liking and grilled beef flavor intensity traits with flavor liking accounting for 90% of the variation in overall consumer liking (Table 6). These results indicate that overall consumer liking, while related to consumer liking for flavor, juiciness and tenderness, was most highly related to consumer flavor liking. When trained descriptive beef flavor attributes were included in the partial least squares regression with consumer sensory traits and treatments (Figure 2), consumer attributes clustered, as in Figure 1, as expected. Juiciness and tenderness liking were closely clustered with trained panel sensory attributes for juiciness and tenderness indicating that consumers and trained sensory panelists rated these samples similarly for juiciness and tenderness.
Metallic and bloody/serumy were closely related to consumer and trained panel attributes for juiciness and tenderness indicating that changes in these attributes mirror each other. In other words, as metallic and bloody/serumy increased, juiciness and tenderness increased, or as metallic and bloody/serumy decreased, juiciness and tenderness similarly decreased. As intensity of bloody/serumy is related to degree of doneness or protein heat denaturation that occurs during cooking, it is not surprising that high pH Top Loin steaks cooked on the grill to either 58 or 80°C or cooked to 58°C on a George Foreman® grill, and Choice Top Loin steaks cooked to 58°C had similar metallic, bloody/serumy, juiciness, tenderness
13
14
and consumer juiciness and tenderness liking. Overall consumer liking was clustered with overall flavor liking, grilled flavor liking, beef flavor liking, and trained descriptive attributes of beef identity, brown/roasted, umami, burnt, salty, overall sweet and fat-like. Treatments most closely related to the aforementioned consumer and trained descriptive sensory attributes were Tenderloin Steaks cooked on the grill to 58°C and 80°C, high pH Top Loin Steaks cooked to 80°C, Top Loin Steaks grilled to 58°C and 80°C and Top Sirloin Steaks cooked on the grill to 80°C. Select and Choice Bottom Round Roasts cooked in slow cookers were associated with negative flavor attributes of liver-like, green hay-like, sour aromatic, musty and cardboard. Choice Top Sirloins cooked on a George Foreman® grill to 58°C and 80°C clustered with the Bottom Round
Roasts, indicating negative overall liking and negative flavor attributes were detected by consumers.
These results indicate that beef flavor is a major driver of overall consumer liking. Additionally, trained descriptive sensory attributes from the Beef Lexicon are related to overall consumer liking and consumers’ perception of overall, beef and grill flavor liking. However, understanding if specific volatile flavor aromatics are related to trained descriptive sensory attributes or to consumer overall, overall flavor, beef flavor or grill flavor liking, data linking the volatile aromatic data to the trained descriptive flavor attributes and consumer data were needed. Miller et al. (2012) examined the relationship between trained
Table 6. Stepwise linear regression for prediction of consumer overall liking as the dependent variable and consumer attributes as independent variables adapted from Glasock (2014).
aVariables measured using 9-point hedonic and intensity scales were 1=extremely dislike or none; 9=extremely like or extremely intense.bEstimates are the b-values for the final regression equation when the defined variable was included.
Partial Equation Step Variablesa Estimateb R2 R2
Intercept 0.07 0.90 1 Flavor Like/Dislike 0.66 0.89 2 Grill Like/Dislike 0.15 0.01 3 Grill Flavor Intensity 0.40 0.01 4 Beef Flavor Intensity -0.22 0.001
Prin
cipa
l Com
pone
nt 2
12%
1.2
1.0
0.8
0.6
0.4
0.2
0.0
-0.2
-0.4
-0.6
-0.8
-1.0
-1.2-1.2 -0.7 -0.2 0.3 0.8
Principal Component 1 (85%)
431431
621211
521
121
111
212522
222
322432
622
612 512
611511
112
Juiciness liking
Tenderness liking
Overall liking
Overall flavor liking
Beef flavor liking
Grilled flavor liking
122
Figure 1. Principal component biplot of consumer liking sensory attributes (in blue) and 20 treatments (in green) where 111 = Tenderloin Steaks grilled to 137°F; 112 = Tenderloin Steaks grilled to 176°F; 121 = Tenderloin Steaks George Foreman® to 137°F; 122 = Tenderloin Steaks George Foreman® to 176°F; 211 = high pH Top Loin Steaks grilled to 137°F; 212 = high pH Top Loin Steaks grilled to 176°F; 221 = high pH Top Loin Steaks George Foreman® to 137°F; 222 = high pH Top Loin Steaks George Foreman® to 176°F; 331 = Choice Bottom Round Roasts cooked in a crockpot to 137°F; 332 = Choice Bottom Round Roasts cooked in a crockpot to 176°F; 431 = Select Bottom Round Roasts cooked in a crockpot to 137°F; 432 = Select Bottom Round Roasts cooked in a crockpot to 176°F; 511 = Choice Top Loin Steaks grilled to 137°F; 512 = Choice Top Loin Steaks grilled to 176°F; 521 = Choice Top Loin Steaks George Foreman® to 137°F; 522 = Choice Top Loin Steaks George Foreman® to 176°F; and 611 = Choice Top Sirloin Steaks grilled to 137°F; 612 = Choice Top Sirloin Steaks grilled to 176°F; 621 = Choice Top Sirloin Steaks George Foreman® to 137°F; 622 = Choice Top Sirloin Steaks George Foreman® to 176°F.Adapted from Miller et al. (2014).
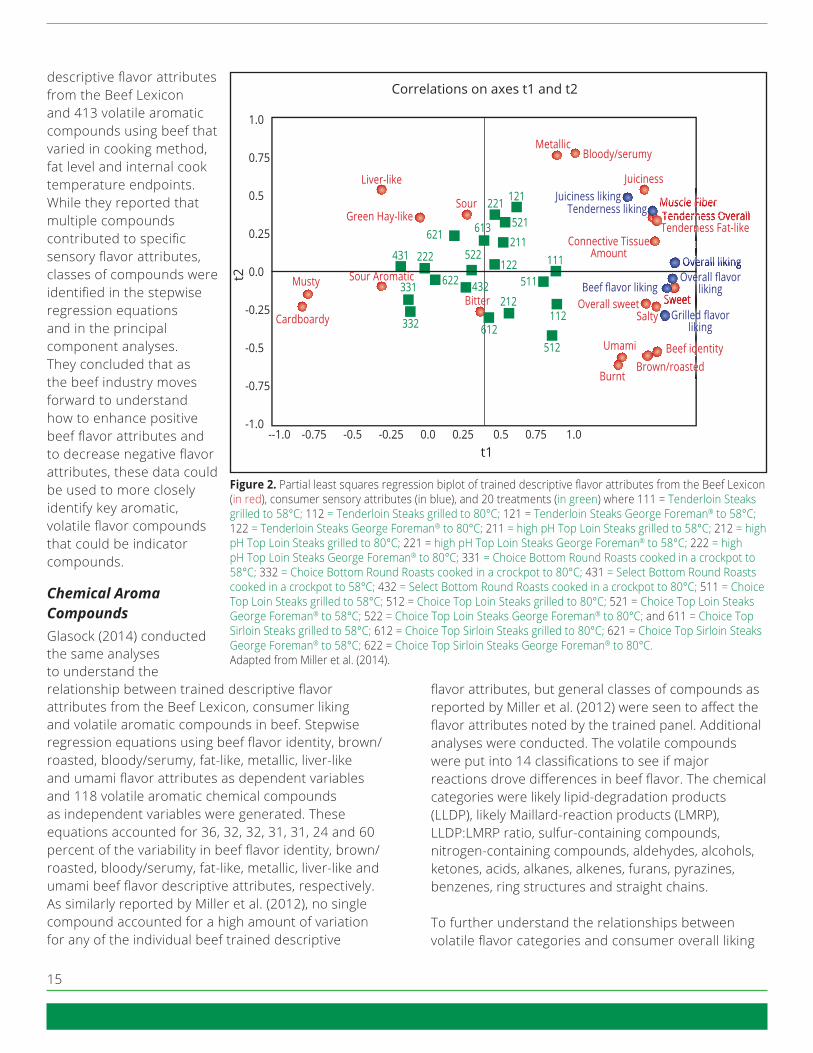
descriptive fl avor attributes from the Beef Lexicon and 413 volatile aromatic compounds using beef that varied in cooking method, fat level and internal cook temperature endpoints. While they reported that multiple compounds contributed to specifi c sensory fl avor attributes, classes of compounds were identifi ed in the stepwise regression equations and in the principal component analyses. They concluded that as the beef industry moves forward to understand how to enhance positive beef fl avor attributes and to decrease negative fl avor attributes, these data could be used to more closely identify key aromatic, volatile fl avor compounds that could be indicator compounds.
Chemical Aroma CompoundsGlasock (2014) conducted the same analyses to understand the relationship between trained descriptive fl avor attributes from the Beef Lexicon, consumer liking and volatile aromatic compounds in beef. Stepwise regression equations using beef fl avor identity, brown/roasted, bloody/serumy, fat-like, metallic, liver-like and umami fl avor attributes as dependent variables and 118 volatile aromatic chemical compounds as independent variables were generated. These equations accounted for 36, 32, 32, 31, 31, 24 and 60 percent of the variability in beef fl avor identity, brown/roasted, bloody/serumy, fat-like, metallic, liver-like and umami beef fl avor descriptive attributes, respectively. As similarly reported by Miller et al. (2012), no single compound accounted for a high amount of variation for any of the individual beef trained descriptive
fl avor attributes, but general classes of compounds as reported by Miller et al. (2012) were seen to aff ect the fl avor attributes noted by the trained panel. Additional analyses were conducted. The volatile compounds were put into 14 classifi cations to see if major reactions drove diff erences in beef fl avor. The chemical categories were likely lipid-degradation products (LLDP), likely Maillard-reaction products (LMRP), LLDP:LMRP ratio, sulfur-containing compounds, nitrogen-containing compounds, aldehydes, alcohols, ketones, acids, alkanes, alkenes, furans, pyrazines, benzenes, ring structures and straight chains.
To further understand the relationships between volatile fl avor categories and consumer overall liking
Liver-like
Green Hay-likeSour
Musty
CardboardyBitter
MetallicBloody/serumy
Juiciness
Muscle FiberMuscle FiberMuscle FiberTenderness OverallTenderness OverallTenderness OverallTenderness OverallTenderness OverallTenderness Fat-like
Beef identityBeef identityBeef identityBrown/roasted
Umami
Burnt
SaltyOverall sweet Sweet
221 121
521
211111
511
112212
612512
332
331 622
522
621 613
431
432
222122
SweetGrilled fl avor
liking
Overall liking
Connective TissueAmount
SweetSweet
Overall likingOverall likingOverall fl avor
likingBeef fl avor liking
Juiciness likingTenderness liking
Correlations on axes t1 and t2
t2
t1
1.0
0.75
0.5
0.25
0.0
-0.25
-0.5
-0.75
-1.0--1.0 -0.75 -0.5 -0.25 0.0 0.25 0.5 0.75 1.0
Figure 2. Partial least squares regression biplot of trained descriptive fl avor attributes from the Beef Lexicon (in red), consumer sensory attributes (in blue), and 20 treatments (in green) where 111 = Tenderloin Steaks grilled to 58°C; 112 = Tenderloin Steaks grilled to 80°C; 121 = Tenderloin Steaks George Foreman® to 58°C; 122 = Tenderloin Steaks George Foreman® to 80°C; 211 = high pH Top Loin Steaks grilled to 58°C; 212 = high pH Top Loin Steaks grilled to 80°C; 221 = high pH Top Loin Steaks George Foreman® to 58°C; 222 = high pH Top Loin Steaks George Foreman® to 80°C; 331 = Choice Bottom Round Roasts cooked in a crockpot to 58°C; 332 = Choice Bottom Round Roasts cooked in a crockpot to 80°C; 431 = Select Bottom Round Roasts cooked in a crockpot to 58°C; 432 = Select Bottom Round Roasts cooked in a crockpot to 80°C; 511 = Choice Top Loin Steaks grilled to 58°C; 512 = Choice Top Loin Steaks grilled to 80°C; 521 = Choice Top Loin Steaks George Foreman® to 58°C; 522 = Choice Top Loin Steaks George Foreman® to 80°C; and 611 = Choice Top Sirloin Steaks grilled to 58°C; 612 = Choice Top Sirloin Steaks grilled to 80°C; 621 = Choice Top Sirloin Steaks George Foreman® to 58°C; 622 = Choice Top Sirloin Steaks George Foreman® to 80°C. Adapted from Miller et al. (2014).
Sour Aromatic
15

16
and descriptive beef fl avor attributes, principal component analysis was conducted (Figure 3). Maillard-reaction products have been shown to occur during cooking with high heat and extended cooking times (Mottram and Whitfi eld, 1993). Mottram (1998) indicated that during cooking, the development of lipid-degradation and Maillard-reaction products occurs rapidly. In the presence of both lipid-degradation and Maillard-reaction products, lipid-degradation products tend to contribute to fl avor to a greater extent (Mottram, 1998). Regardless of cooking method, lipid-degradation products were present in greater concentrations than Maillard-reaction products as expected in Glasock (2014) and Miller et
al. (2014). Mottram (1998) discussed that lipid-derived volatiles were quantitatively dominant to fl avor development unless harsh cooking methods caused extensive browning where Maillard-reaction products would substantially increase.
The relationship between trained descriptive fl avor attributes from the Beef Lexicon, consumer sensory attributes and volatile aromatic compounds from Miller et al. (2014) is presented in Figure 3. This fi gure builds on Figure 2 using partial least squares regression by the addition of the volatile aromatic compounds (n=160). Individual compounds are not identifi ed due to space restrictions except two compounds of particular interest. This figure does what meat scientists since Watkins (1936) have tried to do, tie consumer acceptance, trained sensory panel attributes and chemical
components in beef together. As expected, the sensory attributes of beef identity, brown/roasted and umami clustered with Choice Top Loin Steaks grilled to 80°C. However, the volatile aromatic compounds of 3-ethyl-2,5-dimethyl-pyrazine, 2,5-dimethyl-pyrazine, 2-ethyl-6-methyl-pyrazine, 2-ethyl-5-methyl-pyrazine, trimethyl-pyrazine, 2,3,5-trimethyl pyrazine, 3-methyl-butanal, 2-methyl-butanal, 2-methyl-propanal, butanal, 2-acetylthiazole, 2-furancarboxaldehyde, decyl ester acetic acid, 2-aminoethyl hydrogen sulfate and S-2-[2-succinimidoethylamino]ethyl thiosulfuric acid (caramel and coff ee; musty, cocoa; unknown; coff ee, nutty; musty, potato; unknown; malty; malty, green, fruity; pungent; yeasty, bread; corn chip; brown, bready,
Figure 3. Partial least squares regression biplot (R2=0.87) of trained descriptive fl avor attributes from the Beef Lexicon (in blue), consumer sensory attributes (in black), 160 volatile aromatic compounds (in red) and 20 treatments (in green) where 111 = Tenderloin Steaks grilled to 58°C; 112 = Tenderloin Steaks grilled to 80°C; 121 = Tenderloin Steaks George Foreman® to 58°C; 122 = Tenderloin Steaks George Foreman® to 80°C; 211 = high pH Top Loin Steaks grilled to 58°C; 212 = high pH Top Loin Steaks grilled to 80°C; 221 = high pH Top Loin Steaks George Foreman® to 58°C; 222 = high pH Top Loin Steaks George Foreman® to 80°C; 331 = Choice Bottom Round Roasts cooked in a crockpot to 58°C; 332 = Choice Bottom Round Roasts cooked in a crockpot to 80°C; 431 = Select Bottom Round Roasts cooked in a crockpot to 58°C; 432 = Select Bottom Round Roasts cooked in a crockpot to 80°C; 511 = Choice Top Loin Steaks grilled to 58°C; 512 = Choice Top Loin Steaks grilled to 80°C; 521 = Choice Top Loin Steaks George Foreman® to 58°C; 522 = Choice Top Loin Steaks George Foreman® to 80°C; and 611 = Choice Top Sirloin Steaks grilled to 58°C; 612 = Choice Top Sirloin Steaks grilled to 80°C; 621 = Choice Top Sirloin Steaks George Foreman® to 58°C; 622 = Choice Top Sirloin Steaks George Foreman® to 80°C. Adapted from Miller et al. (2014).
1.0
0.75
0.5
0.25
0.0
-0.25
-0.5
-0.75
-1.0
t1--1.0 -0.75 -0.5 -0.25 0.0 0.25 0.5 0.75 1.0
t2
2-ethyl-3, 5-dimethyl Pyrazine
Beef Idenity
Brown/roastedUnami
Salty
SweetOverall sweet SweetFlavor liking
2-ethyl-3, 5-
Connective tissueamount
dimethyl Pyrazine
amountFat-like
dimethyl PyrazineMuscle fi bertenderness
MetallicMetallicBloody/serumy
Liver-like
0.0 0.0 0.0 Cardboardy
0.25 0.25 Musty-earthy/ humus
0.5 WB shear force
Trans-2-tridecenal
SweetSweet
Connective tissueConnective tissueamount
Overall liking
dimethyl PyrazineTenderness likingTenderness likingTenderness likingJuiciness liking
Bloody/serumyJuiciness
332432
431
621
221 211
521
121
122622
331 212 511 112111611
522
222
Correlations on axes t1 and t2
Bitter

17
caramel; waxy, fatty; unknown; and unknown aromas respectively), (Table 1 ) were closely related to these sensory attributes. This grouping also is closely related to consumer flavor liking and overall liking. These results indicated that when beef samples have either a high level of mainly pyrazine compounds and beef identity, brown/roasted and umami, consumers like the flavor and overall like the beef sample. Overall consumer liking was clustered with sweet, overall sweet, connective tissue amount and fat-like. These results indicate that consumers also like beef that is low in connective tissue, is sweet and has fat-like flavor. The only volatile aromatic compound closely related to tenderness and juiciness attributes was 2-ethyl-3,5-dimethyl-pyrazine (coffee, roasted-nuts aroma). The information included in Table 1 will allow researchers a cursory summary of published aromas found with aroma chemical compounds commonly found in meat. Additionally, the threshold values allow analyses of quantitative data for the aroma chemicals to determine the levels required for each of the chemicals to have an active role in the aroma of any given food. It also is possible to create aroma values from the threshold values by dividing a quantitative value (total ion counts, ppm, etc.) by the threshold value. This creates a unit-less value (like the odor activity value [OAV]) that gives a relative contribution of the aroma compound to the total aroma. The higher this relative value is, the more contribution to the total flavor/aroma (see Grosch, 1994 for review).
As previously shown, consumer and trained sensory descriptors for tenderness and juiciness are clustered. Warner-Bratzler shear force, a mechanical measure of beef tenderness, is in the opposite quadrant, indicating that as Warner-Bratzler shear force increases or beef is tougher, trained and consumer sensory ratings decrease. In other words, consumer do not like the juiciness and tenderness of tougher beef and, similarly, trained sensory panels rate tougher beef lower in juiciness and muscle fiber tenderness.
Metallic and bloody/serumy descriptive attributes were related to consumer and trained sensory panel juiciness and tenderness attributes, and high pH Top Loin Steaks grilled to 58°C were most closely associated with metallic and bloody/serumy descriptive attributes. High pH Top Loin Steaks were
included in the study as beef steaks with higher than normal pH have less heat protein denaturation during cooking and have been shown to appear as though they are at lower degrees of doneness than normal pH steaks cooked similarly. Therefore, it was expected that this treatment would be more closely related to metallic and bloody/serumy, descriptive attributes associated with lower degrees of doneness than other descriptive flavor attributes. Volatile aromatic compounds associated with high pH Top Loin Steaks grilled to 58°C were nonenal, trans-2-tridecenal, 1-heptanol, bicycoheptan-2-one, styrene, 3,3’,5,5’-tetramethoxy-2,2’,4,4’,6,6’-hexanitro-biphenyl, tridecane, 2-methyl-butane, 10-methylnonadecane, 2,6,10-trimethyl-dodecane, 2-methyl-dodecane, 1-hexanol, 1-(acetyloxy)-2-propanone, 4-methyl-phenol, 5-methyl-undecane, octyl ester pentafluoropropionic acid, 1 octen 3 ol, (tetrahydroxycyclopentadienone) tricarbonyliron, 1-butanol, dodecanal, dodecane, (E)-2-decenal and hexadecanal. As shown by the predominance of lipid-degradation products, either the product cooks very quickly or at low temperature as a result of characteristics of the meat itself or of the cookery method. As it happens (and would be expected given previous discussion), meat that has a high pH has a very high water-holding capacity with a great deal of moisture stored within the meat. The presence of this moisture serves as a very good mode of heat transfer, and therefore the steaks tend to cook quickly before any Maillard-reaction products can form. This results in different flavor characteristics compared to normal pH meat, in addition to the differences inherent in the product from a lack of protein denaturation during cooking.
Liver-like has been extensively studied. In Figure 3, liver-like did not cluster closely with treatments or volatile aromatic compounds. Propyl-benzene and tetradecanal were the volatile aromatic compounds most closely clustered to liver-like. Beef steaks and roasts in this study (Miller et al., 2014) did not have high levels of liver-like flavor indicating that this study may not have adequately addressed factors associated with the liver-like flavor attribute.Musty-earthy/humus and cardboard were closely related and clustered with Choice and Select Bottom Round Roasts cooked in a crockpot to 80°C. These treatments were used to produce minimal Maillard-
reaction products and to provide for development of lipid oxidation products. Volatile compounds most closely clustered with these flavor attributes and treatments were 2-pentyl-4,5-dimethyloxazole, 1-(acetyloxy)-2-propanone, 3-hydroxy-2-butanone, 2-pentanone, undecanal, 2-pentyl-furan, acetic acid ethenyl ester, nonadecane, thiobis-methane, N,N’-nonamethylenebis[-S-3-aminopropyl thiosulfuric acid] and aloxiprin.
Conclusions Beef flavor can be described as “simply complex” as there are very well-defined categories in terms of gustatory versus olfactory senses, lipid-degradation versus Maillard reactions and consumer like versus dislike. Within each of these categories is
an impossibly complex system of products and interactions that define beef flavor. Lipid products are generated from low, slow heat while Maillard products come from high, quick cooking. Each category generates specific compounds with fairly well-defined and published aromas. In the reported research, one single category of compounds did not drive overall liking, but these data indicate that compounds resulting from high-heat cookery and lipid degradation are present when consumers rate beef higher for overall liking. Additionally, volatile aromatic compounds are related to specific trained descriptive beef flavor attributes from the Beef Lexicon and these attributes are related to consumer sensory attributes. Consumers and trained sensory panelists rate juiciness and tenderness similarly.
18

References
Adhikari, K., E. IV Chambers, R.K. Miller, L. Vazquez-Araujo, N.Bhumiratana, and C. Phillip. 2011. Development of a lexicon for beef flavor in intact muscle. J. Sensory Stud. 26:413-420.
Ahmed, E.M., R.A. Dennison, R.H. Dougherty, and P.E. Shaw. 1978. Flavor and odor thresholds in water of selected orange juice components. J. Agric. Food Chem. 26(1): 187-191.
AMSA. 1978. Research guidelines for cookery, sensory evaluation and instrumental measurements of fresh meat. 1st Ed. Chicago, IL: National Livestock and Meat Board and American Meat Science Association.
AMSA. 1995. Research guidelines for cookery, sensory evaluation and instrumental measurements of fresh meat. 2nd Ed. Champaign, IL: American Meat Science Association.
AMSA. 2014. Research guidelines for cookery, sensory evaluation and instrumental measurements of fresh meat. Champaign, IL: American Meat Science Association.
Bagley, J.L., K.L. Nicholson, K.D. Pfeiffer, and J.W. Savell. 2010. In-home consumer and shear force evaluation of steaks from the M. serratus ventralis thoracis. Meat Sci. 85:104-109.
Barham, B.L., J.C. Brooks, J.R. Jr. Blanton, A.D. Herring, M.A. Carr, C.R. Kerth, and M.F. Miller. 2003. Effects of growth implants on consumer perceptions of meat tenderness in beef steers. J. Anim. Sci. 81:3052-3056.
Behrends, J.M., K.J. Goodson, M. Koohmaraie, S.D. Shackelford, T.L. Wheeler, W.W. Morgan, J.O. Reagan, B.L. Gwartney, J.W. Wise, and J.W. Savell. 2005a. Beef customer satisfaction: Factors affecting consumer evaluations of calcium chloride-injected to sirloin steaks when given instruction for preparation. J. Anim. Sci. 83:2869-2875.
Behrends, J.M., K.J. Goodson, M. Koohmaraie, S.D. Shackelford, T.L. Wheeler, W.W. Morgan, J.O. Reagan, B.L. Gwartney, J.W. Wise, and J.W. Savell. 2005b. Beef customer satisfaction: USDA quality grade and marination effects on consumer evaluation of top round steaks. J. Anim. Sci. 83:662-670.
Belk, K.E., G.L. Luchak, and R.K. Miller. 1993a. Palatability of beef roasts prepared with different foodservice cooking methods. J. Muscle Foods 4:141-159.
Belk, K.E., R.K. Miller, L.L. Evans, S.P. Liu, and G.R. Acuff. 1993b. Flavor attributes and microbial levels of fresh beef roasts cooked with varying foodservice methodology. J. Muscle Foods 4:321-337.
Boleman, S.J., S.L. Boleman, R.K. Miller, J.F. Taylor, H.R. Cross, T.L. Wheeler, M. Koohmaraie, S.D. Shackelford, M.F. Miller, R.L. West, D.D. Johnson, and J.W. Savell. 1997. Consumer evaluation of beef of known categories of tenderness. J. Anim. Sci. 75:1521-1524.
Brady, D.E. 1957. Results of consumer preference studies. J. Anim. Sci. 16:233-240.
Burdock, G.A. 2010. Fernoli’s handbook of flavor ingredients, 6th Ed. CRC Press, Taylor and Francis Group, LLC, Boca Raton, FL.
Bueso, M.E., M.F. Miller, T. Dinh, J.F. Legako, M. Hunt, and C. Corbin. 2014. Principal component analysis of consumer palatability scores from four beef muscles of two USDA quality grades in relation of fatty acid profile. Meat Sci. 96(1):450-451.
Buttery, R.G., D.G. Guadagni, and L.C. Ling. 1973. Flavor compounds: Volatilities in vegetable oil and oil-water mixtures. Estimation of flavor thresholds. J. Agri. Food Chem. 21(2):198-201.
Buttery, R.G., and L.C. Ling. 1995. Volatile flavor components of corn tortillas and related products. J. Agric. Food Chem. 43:1878-1882.
Buttrey, E.K., K.H. Jenkins, J.B. Lewis, S.B. Smith, R.K. Miller, T.E. Lawrence, F.T. McCollum, III, P.J. Pinedo, N.A. Cole, and J.C. MacDonald. 2013. Effects of 35% corn wet distillers grains plus solubles in steam-flaked and dry-rolled corn-based finishing diets on animal performance, carcass characteristics, beef fatty acid composition, and sensory attributes. J. Anim. Sci. 91:1850-1865.
Carpenter, C.E., D.P. Cornforth, and D. Whittier. 2001. Consumer preferences for beef color and packaging did not affect eating satisfaction. Meat Sci. 57(4):359-363.
Carr, M.A., K.L. Crockett, C.B. Ramsey, and M.F. Miller. 2004. Consumer acceptance of calcium chloride-marinated top loin steaks. J. Anim. Sci. 82:1471-1474.
Chandrashekar, J., M.A. Hoon, N.J.P. Ryba, and C.S. Zuker. 2006. The receptors and cells for mammalian taste. Nature 444: 288-294.
Chemious, L.D. 1874. Cooked corn-beef. U.S. Patent Office No. 153,046.
Civille, G.V., and B.G. Lyons. 1996. Aroma and flavor lexicon for sensory evaluation: Definitions, references, and examples. ASTM Data Series Publication DS66. American Society for Testing Materials, West Conshohocken, PA.
Cox, R.J., J.M. Thompson, C.M. Cunial, S. Winter, and A.J. Gordon. 1997. The effect of degree of doneness of beef steaks on consumer acceptability of meals in restaurants. Meat Sci. 45:75-85.
Cox, R.J., C.R. Kerth, J.G. Gentry, J.W. Prevatt, K.W. Braden, and W.R. Jones. 2006. Determining acceptance of domestic forage- or grain-finished beef by consumers from three southeastern U.S. states. J. Food Sci. 71(7):S542-S546.
Czerny, M., M. Cristlbauer, A. Fischer, M. Granvogl, M. Hammer, C. Hartl, N.M. Hernandez, and P. Schieberle. 2008. Re-investigation on odour thresholds of key food aroma compounds and development of an aroma language based on odour qualities of defined aqueous odorant solutions. Eur. Food Res. Technol. 228:265-273.
Eckert, L.A., J.V. Maca, R.K. Miller, and G.R. Acuff. 1997. Effects of sodium lactate and sodium propionate on the sensory, microbial, and chemical characteristics of fresh aerobically stored ground beef. J. Food Sci. 62:429-433.
Eilers, J.D., J.B. Morgan, A.M. Martin, R.K. Miller, D.S. Hale, G.R. Acuff, and J.W. Savell. 1994. Evaluation of calcium choloride and lactic acid injection on chemical, microbiological and descriptive attributes of mature cow meat. Meat Sci. 38:443-451.
Ellebracht, E.A., A. Castillo, L.M. Lucia, R.K. Miller, and G.R. Acuff. 1999. Reduction of pathogens using hot water and lactic acid on beef trimmings. J. Food Sci. 64: 1094-1099.
Filbert, J.H. 1909. Animal fat product and process of making the same. U.S. Patent Office 929,926.
Farmer, L.J., and D.S. Mottram. 1990. Interaction of lipid in the Maillard reaction between cysteine and ribose: The effect of a triglyceride and three phospholipids on the volatile products. J. Sci. Food Agric. 53:505-525.
Francis, J. J., J. R. Romans, and H. W. Norton. 1977. Consumer rating of two beef marbling levels. J. Anim. Sci. 45:67.
Frankel, E.N. Lipid oxidation: Mechanisms, products and biological significance. J. Am. Oil Chem. Soc. 61(12):1908-1917.
Garmyn, A.J., J.C. Brooks, J.M. Hodgen, W.T. Nichols, J.P Hutcheson, R.J. Rathmann, and M.F. Miller. 2014. Comparative effects of supplementing beef steers with zilpaterol hydrochloride, ractopamine hydrochloride, or no beta-agonist on strip loin composition, raw and cooked color properties, shear force, and consumer assessment of steaks aged for fourteen or twenty-one days postmortem. J. Anim. Sci. 92:3670-3864.
Garmyn, A.J., and M.F. Miller. 2014. Meat science and muscle biology symposium: Implant and beta agonist impacts on beef palatability. J. Anim. Sci. 92:10-20.
Gilbertson, T.A., S. Damak, and R.F. Margolskee. 2000. The molecular physiology of taste transduction. Curr. Opin. Neurobio. 10:519-527.
Glasock, R.A. 2014. Beef flavor attributes and consumer perception. M.S. Thesis, Texas A&M University.
Goodson, K.J., W.W. Morgan, J.O. Reagan, B.L. Gwartney, S.M. Courington, J.W. Wise, and J.W. Savell. 2002. Beef customer satisfaction: Factors affecting consumer evaluations of clod steaks. J. Anim. Sci. 80:401-408.
Grosch, W. 1994. Determination of potent odourants in foods by aroma extract dilution analysis (AEDA) and calculation of odour activity values (OAVs). Flav. And Frag. Jour. 9:147-158.
Hoffman, L.C., M. Mueller, and A. Vermaak. 2008. Sensory and preference testing of selected beef muscles infused with phosphate and lactate blend. Meat Sci. 80:1055-1060.
Hoover, L.C., K.D. Cook, M.F. Miller, K.L. Huffman, C.K. Wu, J.L. Lansdell, and C.B Ramsey. 1995. Restaurant consumer acceptance of beef loin strip steaks tenderized with calcium chloride. J. Anim. Sci. 73:3633-3638.
Hornstein, I., and P.F. Crowe. 1960. Flavor studies on beef and pork. Ag & Food Chem. 8(6):494-498.
Howe, P.E., and N.G. Barbella. 1937. The flavor of meat and meat products. Am. Chem. Soc. Flavors on Foods Symposium, Chapel Hill, NC.
Hunt, M.R., A.J. Garmyn, T.G. O’Quinn, C.H. Corbin, J.F. Legako, R.J. Rathmann, J.C. Brooks, and M.F. Miller. 2014. Consumer assessment of beef palatability from four beef muscles from USDA Choice and Select graded carcasses. Meat Sci. 98:1-8.
Igo, J.L., J.C. Brooks, B.J. Johnson, J. Starkey, R.J. Rathmann, A.J. Garmyn, W.T. Nichols, J.P. Hutcheson, and M.R. Miller. 2011. Characterization of estrogen-trenbolone acetate implants on tenderness and consumer acceptability of beef under the effect of two aging times. J. Anim. Sci. 89:792-797.
Jackman, P., D. W. Sun, P. Allen, K. Brandon, and A.M. White. 2010. Correlation of consumer assessment of longissimus dorsi beef palatability with image colour, marbling and surface texture features. Meat Sci. 84:564-568.
Jeremiah, L.E., A.L. Schaefer, and L.L. Gibson. 1992. The effects of antemortem feed and water withdrawl, antemortem electrolyte supplementation, and post-mortem electrical stimulation on the palatability and consumer acceptance of bull beef after ageing (6 days at 1°C). Meat Sci. 32:149-160.
Johnson, P.B., and G.V. Civille. 1986. A standardization lexicon of meat WOF descriptors. J. Sensory Stud. 1:99-104.
Kerth, C.R., K.W. Braden, R. Cox, L.K. Kerth, and D.L. Jr., Rankins. 2007. Carcass sensory, fat color, and consumer acceptance characteristics of Angus-cross steers finished on ryegrass (Lolium multiflorum) forage or on a high-concentrate diet. Meat Sci. 75:324-331.
Killinger, K.M., C.R. Calkins, W.J. Umberger, D.M. Feuz, and K.M. Eskridge. 2004a. A comparison of consumer sensory acceptance and value of domestic beef steaks and steaks from a branded, Argentine beef program. J. Anim. Sci. 82:3302-3307.
Killinger, K.M., C.R. Calkins, W.J. Umberger, D.M. Feuz, and K.M. Eskridge. 2004b. Consumer sensory acceptance and value for beef steaks of similar tenderness, but differing in marbling level. J. Anim. Sci. 82:3294-3301.
Killinger, K.M., C.R. Calkins, W.J. Umberger, D.M. Feuz, and K.M. Eskridge. 2004c. Consumer visual preference and value for beef steaks differing in marbling level and color. J. Anim. Sci. 82:3288-3292.
King, D.A., S.D. Shackelford, T.L. Wheeler, K.D. Pfeiffer, J.M. Mehaffey, M.F. Miller, R. Nickelson, and M. Koohmaraie. 2009. Consumer acceptance and steak cutting yields of beef top sirloin and knuckle subprimals. Meat Sci. 83:782-787.
Kramlich, W.E., and A.M. Pearson. 1960. Separation and identification of cooked beef flavor components. J. Food Sci. 25(6):712-719.
Kukowski, A.C., R.J. Maddock, and D.M. Wulf. 2004. Evaluating consumer acceptability of various muscles from the beef chuck and rib. J. Anim. Sci. 82:521-525.
Kukowski, A.C., R.J. Maddock, D. M. Wulf, S.W. Fausti, and G.L. Taylor. 2005. Evaluating consumer acceptability and willingness to pay for various beef chuck muscles. J. Anim. Sci. 83:2605-2610.
Laster, M.A., R.D. Smith, K.L. Voges, J.D.W Nicholson, K.B. Harris, R.K. Miller, D.B. Griffin, and J.W. Savell. 2008. Dry versus wet aging of beef: Retail cutting yields and consumer sensory attribute evaluations of steaks from ribeyes, strip loins, and top sirloins from two quality grade groups. Meat Sci. 80:795-804.
Leffingwell, J.C., and D. Leffingwell. 1991. GRAS flavor chemicals – detection thresholds. Perfum. and Flavor 16(1):2-19.
Lepper-Blilie, A.N., E.P. Berg, A.J. Germolus, D.S. Bachanan, and P.T. Berg. 2014. Consumer evaluation of palatability characteristics of beef value-added cuts compared to common retail cuts. Meat Sci. 96: 419-422.
Li, X., J. Babol, A. Wallby, and K. Lundstrom. 2013. Meat quality, microbiological status and consumer preference of beef gluteus medius aged in dry ageing bag or vacuum. Meat Sci. 95:229-234.
Lorenzen, C.L., R.K. Miller, J. F. Taylor, T.R. Neely, J.D. Tatum, J.W. Wise, M.J. Buyck, J.O. Reagan, and J.W. Savell. 1999. Beef customer satisfaction: Cooking method and degree of doneness effects on the top loin steak. J. Anim. Sci. 77:637-644.
Lorenzen, C.L., T.R. Neely, R.K. Miller, J.D. Tatum, J.W. Wise, J.F. Taylor, M.J. Buyck, J.O. Reagan, and J.W. Savell. 2003. Beef customer satisfaction: Trained sensory panel ratings and Warner-Bratzler shear force values. J. Anim. Sci. 81:143-149.
Luchak, G.L., R.K Miller, K.E. Belk, D.S. Hale, H.R. Cross, D.D. Johnson, R.L. West, and F.W. Leak. 1998. Cooking characteristics of USDA Choice versus Select retail beef cuts. Meat Sci. 50:55-72.
Maca, J.V., R.K. Miller, M.E. Binger, L.M. Lucia, and G.R. Acuff. 1999. Sodium lactate and storage temperature effects on shelf life of vacuum packaged beef top rounds. Meat Sci. 53:23-29.
MacLeod, G., and J.M. Ames. 1986. The effect of heat on beef aroma: Comparisons of chemical composition and sensory properties. Flav. & Frag. J. 1:91-104.
MacLeod, G., and B.M. Coppock. 1977. A comparison of the chemical composition of boiled and roasted aromas of heated beef. J. Agric. Food Chem. 25(1):113-117.
Macy, R.L., H.D., Naumann, and M.E. Bailey. 1964. Water-soluble flavor and odor precursors of meat. I. Qualitative study of certain amino acids, carbohydrates, non-amino acid nitrogen compounds, and phosphoric acid esters of beef, pork, and lamb. J. Food Sci. 29: 136-141.
Maughan, C., R. Tansawat, D. Cornforth, R. Ward, and S. Martini. 2011. Development of a beef flavor lexicon and its application to compare the flavor profile and consumer acceptance of rib steaks from grass- or grain-fed cattle. Meat Sci. 90:116-121.
McKenna, D.R., C.L. Lorenzen, D.K., Pollok, W.W. Morgan, W.L. Mies, J.J. Harris, R. Murphy, M. McAdams, D.S. Hale, and J.W. Savell. 2004. Interrelationships of breed type, USDA quality grade, cooking method, and degree of doneness on consumer evaluation of beef in Dallas and San Antonio, Texas, USA. Meat Sci. 66:399-406.
Mehaffey, J.M., J.C. Brooks, R.J. Rathmann, E.M. Alsup, J.P. Hutcheson, W.T. Nichols, M.N. Streeter, D.A. Yates, B.J. Johnson, and M.F. Miller. 2009. Effect of feeding zilpaterol hydrochloride to beef and calf-fed Holstein cattle on consumer palatability ratings. J. Anim. Sci. 87:3712-3721.
Meynier, A., and D.S. Mottram. 1995. The effect of pH on the formation of volatile compounds in meat-related model systems. Food Chem. 52:361-366.
Miller, M.F., L.C. Hoover, K.D. Cook, A.L. Guerra, K.L. Huffman, K.S. Tinney, C.B. Ramsey, H.C. Brittin, and L.M. Huffman. 1995. Consumer acceptability of beef steak tenderness in the home and restaurant. J. Food Sci. 60:963-965.
Miller, M.F., M.A. Carr, C.B. Ramsey, K.L. Crockett, and L.C. Hoover. 2001. Consumer thresholds for establishing value of beef tenderness. J. Anim. Sci. 79:3062-3068.
Miller, R.K., L.C. Rockwell, D.K. Lunt, and G.E. Carstens. 1996. Determination of the flavor attributes of cooked beef from steers fed corn or barley based diets. Meat Sci. 44:235-243.
Miller, R.K. 2010. Differentiation of beef flavor across muscles and quality grades. Final report to the National Cattlemen’s Beef Association, Centennial, CO.
Miller, R.K., and C.R. Kerth. 2012. Identification of compounds responsible for positive beef flavor. Final report to the National Cattlemen’s Beef Association, Centennial, CO.
Miller, R.K., T. Luckemeyer, and C.R. Kerth. 2014. Beef flavor attributes and consumer perception II. Final report to the National Cattlemen’s Beef Association, Centennial, CO.
Mottram, D.S. 1985. The effect of cooking conditions on the formation of volatile heterocyclic compounds in pork. J. Sci. Food Agric. 36:377-383.
Mottram, D.S., and F. Whitfield. 1993. Aroma volatiles from meatlike Maillard systems. In: Thermally Generated flavors. ACS Symposium Series. J. Am. Chem. Soc. 543:180-191.
Mottram, D.S. 1998. Flavour formation in meat and meat products: A review. Food Chem. 62(4):415-424.
Mozell, M.M., B.P. Smith, P.E. Smith, R.L. Sullivan, and P. Swender. 1969. Nasal chemoreception in flavor identification. Arch. Otol. 90:131-137.
Mulders, E.J. 1973. The odour of white bread IV. Quantitative determination of constituents in the vapour and their odour values. Z. Lebensm Unters-Forsch 151:310-317.
Nawar, W.W. 1969. Thermal degradation of lipids. J. Agr. Food Chem. 17(1):18-21.
Neely, T.R., C.L. Lorenzen, R.K. Miller, J.D. Tatum, J.W. Wise, J.F. Taylor, M.J. Buyck, J.O. Reagan, and J.W. Savell. 1998. Beef customer satisfaction: Role of cut, USDA quality grade, and city on in-home consumer ratings. J. Anim. Sci. 76:1027-1033.
Neely, T.R. ., C.L. Lorenzen, R.K. Miller, J.D. Tatum, J.W. Wise, J.F. Taylor, M.J. Buyck, J.O. Reagan, and J.W. Savell. 1999. Beef customer satisfaction: Cooking method and degree of doneness effects on the top round steak. J. Anim. Sci. 77-653-660.
Nursten, H.E. 1980. Recent developments in studies of the Maillard reaction. Food Chem. 6:263-277.
Ogawa, H. 1994. Gustatory cortex of primates: Anatomy and physiology. Neuro. Res. 20:1-13.
O’Quinn, T.G., J.C. Brooks, R.J. Polkinghorne, A.F. Garmyn, B.J. Johnson, J.D. Starkey, R.J. Rathmann, and M.F. Miller. 2012. Consumer assessment of beef strip loin steaks of varying fat levels. J. Anim. Sci. 90:626-634.
Papadopoulos, L.S., R.K. Miller, G.R. Acuff, C. Vanderzandt, and H.R. Cross. 1991a. Consumer and trained sensory comparisons of cooked beef top rounds treated with sodium lactate. J. Food Sci. 56:1141-1146 & 1153.
Papadopoulos, L.S., R.K. Miller, L.J. Ringer, H.R. Cross. 1991b. Sodium lactate effect on sensory characteristics, cooked meat color and chemical composition. J. Food Sci. 56:621-626 & 635.
Platter, W.J., J.D. Tatum, K.E. Belk, P.L. Chapman, J.A. Scanga, and G.C Smith. 2003a. Relationships of consumer sensory ratings, marbling score, and shear force value to consumer acceptance of beef strip loin steaks. J. Anim. Sci. 81:2741-2750.
Platter, W.J., J.D. Tatum, K.E. Belk, J.A. Scanga, and G.C Smith. 2003b. Effects of repetitive use of hormonal implants on beef carcass quality, tenderness, and consumer ratings of beef palatability. J. Anim. Sci. 81:984-996.
Robbins, K., J. Jensen, K.J. Ryan, C. Homco-Ryan, F.K. McKeith, and M.S. Brewer. 2003. Consumer attitudes toward beef and acceptability of enhanced beef. Meat Sci. 65:721-729.
Robinson, D.L., L.M. Café, B.L. McIntyre, G.H. Geesink, W. Barendse, D.W. Pethick, J.M. Thompson, R. Polkinghorne, and P.L. Greenwood. 2012. Production and processing studies on calpain-system gene markers for beef tenderness: Consumer assessment of eating quality. J. Anim. Sci. 90:2850-2860.
Roeber, D.L., R.C. Cannell, K.E. Belk, R.K. Miller, J.D. Tatum, and G.C. Smith. 2000. Implant strategies during feeding: Impact on carcass grades and consumer acceptability. J. Anim. Sci. 78:1867-1874.
Savell, J.W., R.E. Branson, H.R. Cross, D.M. Stiffler, J.W. Wise, D.B. Griffin, and G.C. Smith. 1987. National consumer retail beef study: Palatability evaluations of beef loin steaks that differed in marbling. J. Food Sci. 52:517-519 & 532.
Savell, J.W., H.R. Cross, J.J. Francis, J.W. Wise, D.S. Hale, D.L. Wilkes, and G.C. Smith. 1989. National consumer retail beef study: Interaction of trim level, price and grade on consumer acceptance of beef steaks and roasts. J. Food Qual. 12:251-274.
Savell, J.W., C.L. Lorenzen, T.R. Neely, R.K. Miller, J.D. Tatum, J.W. Wise, J.F. Taylor, M.J. Buyck, and J.O. Reagan. 1999. Beef customer satisfaction: Cooking method and degree of doneness effects on the top sirloin steak. J. Anim. Sci. 77:645-652.
Schieberle, P., and T. Hoffman. 1997. Evaluation of the character impact odorants in fresh strawberry juice by quantitative measurements and sensory studies on model mixtures. J. Agric. Chem. 45:227-232.
Scott, A.L. 1939. How much fat do consumers want in beef? J. Anim. Sci. 1939:103-107.
Shackelford, S.D., M. Koohmaraie, M.F. Miller, J.D. Crouse, and J.O. Reagan. 1991. An evaluation of tenderness of the longissimus muscle of Angus by Hereford versus Brahman crossbred heifers. J. Anim. Sci. 69: 171-177.
Shackelford, S.D., T.L. Wheeler, M.K. Meade, J.O. Reagan, B.L. Byrnes, and M. Koohmaraie. 2001. Consumer impressions of Tender Select beef. J. Anim. Sci. 79:2605-2614.
Shahidi, F., A.G.P. Samaranayaka, and R.B. Pegg. 2004. Maillard reaction and browning. In: Heat effects on meat. Elsevier Ltd.
Shepherd, G.M. 2005. Outline of a theory of olfactory processing and its relevance to humans. Chem. Senses 30(suppl. 1):i3-i5.
Shimoda, M., R.R. Peralta, and Y. Osajima. 1996. Headspace gas analysis of fish sauce. J. Agric. Food Chem. 44(11):3601-3605.
Sitz, B.M., C.R. Calkins, D.M. Feuz, W.J. Umberger, and K.M. Eskridge. 2005. Consumer sensory acceptance and value of domestic, Canadian, and Australian grass-fed beef steaks. J. Anim. Sci. 83:2963-2868.

Sitz, B.M., C.R. Calkins, D.M. Feuz, W.J.Umberger, and K.M. Eskridge. 2006. Consumer sensory acceptance and value of wet-aged and dry-aged beef steaks. J. Anim. Sci. 84:1221-1226.
Smith, A.M., K.B. Harris, D.B. Griffin, R.K. Miller, C.R. Kerth, and J.W. Savell. 2014. Retail yields and palatability evaluations of individual muscles from we-aged and dry-aged beef ribeyes and top sirloin butts that were merchandised innovatively. Meat Sci. 97:21-26.
Smith, R.D., K.L. Nicholson, J.D.W. Nicholson, K.B. Harris, R.K. Miller, D.B. Griffin, and J.W. Savell. 2008. Dry versus wet aging of beef: Retail cutting yields and consumer palatability evaluations of steaks from U.S. Choice and U.S. Select short loins. Meat Sci. 79:631-639.
Stenström, H., X. Li, M.C. Hunt, and K. Lunstrom. 2014. Consumer preference and effect of correct or misleading information after ageing beef longissimus muscle using vacuum, dry ageing, or a dry ageing bag. Meat Sci. 96:661-666.
Tedford, J.L., A. Rodas-Gonzolez, A.J. Garmyn, J.C. Brooks, B.J. Johnson, J.D. Starkey, G.O. Clark, J.A. Collins, and M.F. Miller. 2014. U.S. consumer perception of U.S. and Canadian beef quality grades. J. Anim. Sci. 92:3685-3692.
Thorpe, S.R., and J.W. Baynes. 2003. Maillard reaction products in tissue proteins: New products and new perspectives. Amino Acids 25:275-281.
USDA. 1997. United States standards for grades of carcass beef. United States Department of Agriculture, Agriculture Marketing Service, Livestock and Seed Division, Washington, DC.
Van Gemert, L.J., and A.H. Nettenbreijer. 1977. Compilation of odour threshold values in air and water. TNO Report, National Institute for Water Supply/Central Institute for Nutrition and Food Research, Zeist, the Netherlands.
Wasserman, A.E., and N. Gray. 1965. Meat Flavor. I. Fractionation of water-soluble flavor precursors of beef. J. Food Sci. 30:801-807.
Wasserman, A.E. 1972. Thermally produced flavor components in the aroma of meat and poultry. J. of Ag and Food Chem. 20(4):737-741.
Watkins, R.M. 1936. Finish in beef cattle from the standpoint of the consumer. J. Anim. Sci. 1936b:67-70.
Wismer, W.V., E.K. Okine, A. Stein, M.R. Seibel, and L.A. Goonewardene. 2008. Physical and sensory characterization and consumer preference of corn and barley-fed beef. Meat Sci. 80:857-863.
Yancey, J.W.S., J.K. Apple, J.-F. Muellenet, and J.T. Sawyer. 2010. Consumer responses for tenderness and overall impression can be predicted by visible and near-infrared spectroscopy, Meullenet-Owens razo shear, and Warner-Bratzler shear force. Meat Sci. 85:487-492.
BeefResearch.org
303.694.0305
For more information, contact:
Science and Product SolutionsNational Cattlemen’s Beef AssociationContractor to the Beef Checkoff Program
9110 East Nichols AvenueCentennial, CO 80112
303.694.0305
Copyright© 2013 Cattlemen’s Beef Board and National Cattlemen’s Beef Association.All rights reserved.