white-tailed deer - idaho deer hunter participation and harvest reports during the 2014 and 2015...
TRANSCRIPT
IDAHO DEPARTMENT OF FISH AND GAME
Virgil Moore, Director
Surveys and Inventories
Statewide Report
WHITE-TAILED DEER
July 1, 2014 to June 30, 2016 Prepared by: Wayne Wakkinen ..................................................................................... Panhandle Region Morgan Pfander ...................................................................................... Clearwater Region Regan Berkley ....................................................................................... McCall Sub-Region Craig White, Michelle Commons-Kemner, Rachel Curtis ...................... Southwest Region Daryl Meints ....................................................................................... Magic Valley Region Zach Lockyer ............................................................................................ Southeast Region Curtis Hendricks .................................................................................. Upper Snake Region Greg Painter .................................................................................................. Salmon Region Mike Elmer ................................................................................................ Data Coordinator David Smith ............................................................................... Grants/Contracts Specialist
Compiled and edited by: Craig White, State Deer & Elk Coordinator
2016 Boise, Idaho

Idaho Department of Fish and Game (IDFG) adheres to all applicable state and federal laws and regulations related to discrimination on the basis of race, color, national origin, age, gender, disability or veteran’s status. If you feel you have been discriminated against in any program, activity, or facility of IDFG, or if you desire further information, please write to: Idaho Department of Fish and Game, PO Box 25, Boise, ID 83707 or US Fish and Wildlife Service, Division of Wildlife and Sport Fish Restoration Program, 5275 Leesburg Pike, MS: WSFR, Falls Church, VA 22041-3803, Telephone: (703) 358-2156. This publication will be made available in alternative formats upon request. Please contact IDFG for assistance. Please note that IDFG databases containing this information are dynamic. Records are added, deleted, and/or edited on a frequent basis. This information was current as of 8/30/16. Raw data do not have the benefit of interpretation or synthesis by IDFG. IDFG requests that you direct any requests for this information to us rather than forwarding this information to third parties.

White-Tail Deer Statewide i
TABLE OF CONTENTS Statewide ......................................................................................................................................... 1
Summary ..................................................................................................................................... 1
Management Objectives.............................................................................................................. 1
Population Monitoring ................................................................................................................ 2
Northern Forest ............................................................................................................................... 6
DAU 1 (GMUs 1, 2, 3, 4, 4A, 6) .................................................................................................... 6
Summary ..................................................................................................................................... 6
Management Objectives.............................................................................................................. 6
Population Monitoring ................................................................................................................ 7
Habitat Monitoring...................................................................................................................... 7
Central Forest .................................................................................................................................. 9
DAU 2 (GMUs 7, 9, 10, 12, 14, 15, 16, 18, 23, 24) ....................................................................... 9
Summary ..................................................................................................................................... 9
Management Objectives.............................................................................................................. 9
Population Monitoring .............................................................................................................. 10
Habitat Monitoring.................................................................................................................... 10
Habitat Management ................................................................................................................. 10
Depredation Management ......................................................................................................... 10
Disease Monitoring ................................................................................................................... 11
Emergency Winter Feeding ...................................................................................................... 11
Northern Agriculture ..................................................................................................................... 13
DAU 3 (GMUs 5, 8, 8A, 10A, 11, 11A, 13) ................................................................................. 13
Summary ................................................................................................................................... 13
Management Objectives............................................................................................................ 13
Population Monitoring .............................................................................................................. 14
Habitat Monitoring.................................................................................................................... 14
Habitat Management ................................................................................................................. 14
Depredation Management ......................................................................................................... 14
Disease Monitoring ................................................................................................................... 14
Emergency Winter Feeding ...................................................................................................... 15
Backcountry .................................................................................................................................. 17
DAU 4 (GMUs 16A, 17, 19, 19A, 20, 20A, 26, 27) ..................................................................... 17
Summary ................................................................................................................................... 17

TABLE OF CONTENTS (Continued)
White-Tail Deer Statewide ii
Management Objectives............................................................................................................ 17
Population Monitoring .............................................................................................................. 18
Habitat Monitoring.................................................................................................................... 18
Habitat Management ................................................................................................................. 18
Depredation Management ......................................................................................................... 18
Disease Monitoring ................................................................................................................... 18
Emergency Winter Feeding ...................................................................................................... 18
Rangeland Riparian Habitat .......................................................................................................... 20
DAU 5 (GMUs 21, 21A, 28, 29, 30, 30A, 36A, 36B, 37, 37A, 38, 39, 50, 51 ............................ 20
58, 59, 59A, 60, 60A, 62, 63A, 64, 65, 67, 68A) .......................................................................... 20
Summary ................................................................................................................................... 20
Management Objectives............................................................................................................ 20
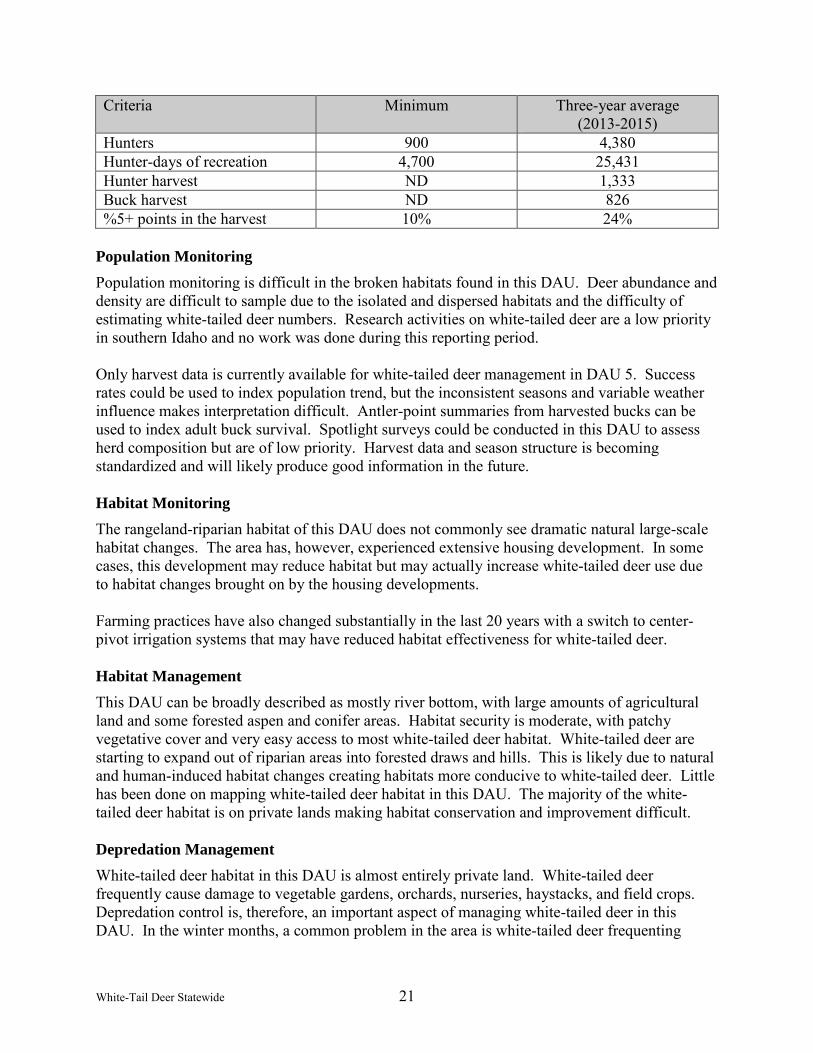
Population Monitoring .............................................................................................................. 21
Habitat Monitoring.................................................................................................................... 21
Habitat Management ................................................................................................................. 21
Depredation Management ......................................................................................................... 21
Disease Monitoring ................................................................................................................... 22
Emergency Winter Feeding ...................................................................................................... 22
Dryland Forest .............................................................................................................................. 24
DAU 6 (GMUs 22, 25, 31, 32, 32A, 33, 34, 35, 36, 43, 44, 48, 49, 61, 62A).............................. 24
Summary ................................................................................................................................... 24
Management Objectives............................................................................................................ 24
Population Monitoring .............................................................................................................. 24
Habitat Monitoring.................................................................................................................... 24
Depredation Management ......................................................................................................... 25
Disease Monitoring ................................................................................................................... 25
Emergency Winter Feeding ...................................................................................................... 25
Southern Idaho .............................................................................................................................. 27
DAU 7 (GMUs 40, 41, 42, 45, 46, 47, 52, 52A, 53, 54, 55, 56, 57, 63, 66, 66A, ........................ 27
69, 70, 71, 72, 73, 73A, 74, 75, 76, 77, and 78)............................................................................ 27
Summary ................................................................................................................................... 27
Management Objectives............................................................................................................ 27

TABLE OF CONTENTS (Continued)
White-Tail Deer Statewide iii
Population Monitoring .............................................................................................................. 27
Habitat Monitoring.................................................................................................................... 28
Habitat Management ................................................................................................................. 28
Depredation Management ......................................................................................................... 28
Disease Monitoring ................................................................................................................... 28
Emergency Winter Feeding ...................................................................................................... 28
Literature Cited ......................................................................................................................... 28
LIST OF FIGURES Figure 1. White-tailed deer Data Analysis Units. .......................................................................... 4
Figure 2. Statewide White-tailed Deer Harvest. ............................................................................ 5
Figure 3. Northern Forest DAU White-tailed Status and Objectives ............................................ 8
Figure 4. Central Forest DAU White-tailed Status and Objectives ............................................. 12
Figure 5. Northern Agriculture DAU White-tailed Status and Objectives .................................. 16
Figure 6. Backcountry DAU White-tailed Deer Status and Objectives ....................................... 19
Figure 7. Rangeland-Riparian Habitat DAU White-tailed Deer Status and Objectives .............. 23
Figure 8. Dryland Forest DAU White-tailed Deer Status and Objectives ................................... 26
Figure 9. Southern Idaho DAU White-tailed Deer Status and Objectives .................................. 29

White-Tail Deer Statewide 1
STATEWIDE REPORT SURVEYS AND INVENTORY
JOB TITLE: White Tail Deer Surveys and Inventories
STUDY NAME: Big Game Population Status, Trends, Use, and Associated Habitat Studies
PERIOD COVERED: July 1, 2014 to June 30, 2016
Statewide Summary White-tailed deer (Odocoileus virginianus ochrourus) are most abundant north of the Salmon River. South of the Salmon River, whitetails are primarily restricted to riparian habitats associated with major river systems. Anecdotal information suggests white-tailed deer have increased in number and distribution in southern Idaho over the last 20 years. Idaho Fish and Game (IDFG) white-tailed deer management is guided by the White-tailed Deer Management Plan – 2005-2014. The state is divided into 7 whitetail data analysis units (DAUs) comprised of game management units (GMUs) based on habitat characteristics and whitetail management priority (Figure 1). White-tailed deer generally receive management priority over mule deer in northern Idaho, while mule deer receive priority in southern Idaho. Beginning in 1975 harvest of mule deer and white-tailed deer was monitored separately. However, hunter effort was not differentiated between mule deer and white-tailed deer hunts. Beginning in 2005, the Department began species-specific monitoring of hunter participation. White-tailed hunter numbers, hunter days afield, and harvest have been increasing over previous 3 reporting periods 2010 through 2012. Hunter harvest has increased from 19,106 in 2010 to 30,344 in 2015 (Figure 2). Management Objectives The White-tailed Deer Management plan lists the following goals for white-tailed deer management during the period 2005-2014:
1) White-tailed deer will be managed for their unique characteristics and important significance as one of Idaho’s wildlife resources.
2) White-tailed deer populations will be maintained under natural conditions in suitable habitat.
3) White-tailed deer populations will be managed to minimize depredation problems and disease occurrence.
4) IDFG will not actively encourage expansion of white-tailed deer in southern Idaho. However, whitetails will be managed in suitable habitats in southern Idaho where substantial overlap with mule deer does not occur.

White-Tail Deer Statewide 2
5) IDFG will strive to provide a diversity of hunting opportunity including long seasons, concurrent deer and elk hunting, either-sex hunting, and maintaining a reasonable opportunity for mature bucks.
6) IDFG will explore opportunities to implement management for higher percentages of mature bucks in some areas.
7) IDFG will work with landowners to improve general public hunting access to private land.
8) General white-tailed deer hunting seasons will be managed to minimize hunter crowding and maintain flexibility in available hunting locations.
9) Private landowners and land management agencies will be encouraged to accommodate habitat requirements for white-tailed deer.
10) IDFG will develop a better understanding of white-tailed deer populations throughout Idaho.
11) IDFG will improve monitoring for disease in white-tailed deer. Overall, management direction is geared to provide a minimum of 35,000 hunters with at least 207,000 recreation days, and harvest a minimum of 8,700 white-tailed deer bucks with at least 15% of the buck harvest comprised of five points or more (western count). Individual management goals are established for each of the seven DAUs. Criteria Minimum Three-year average
(2013-2015) Hunters 35,000 68,679 Hunter-days of recreation 207,000 410,070 Hunter Harvest ND 27,177 Buck harvest 8,700 17,346 %5+ points in the harvest 15% 20%
Population Monitoring White-tailed deer are widely dispersed and occupy a variety of habitats, most of which is comprised of thick vegetative cover making most population enumeration techniques ineffective. The Department has experimented with various techniques including aerial surveys, spot-light counts, and radio telemetry, among others. To date, no single population technique provides reliable and cost-effective measures of population demographics and abundance. However, the Department has been monitoring harvest, index to population abundance and distribution, since 1975. Additionally, species-specific deer hunter participation information has been collected since 2005 and provides additional information on catch-per-unit-effort indices.

White-Tail Deer Statewide 3
Table 1. White-tailed deer hunter participation and harvest reports during the 2014 and 2015 harvest seasons.
Statewide
Check Stations
Check Station Days
Hunter Harvest Reports
% Change in Total Harvest Reports
from Previous Year 2014 6 33 36,134 Not available 2015 8 33 27,820 -23

White-Tail Deer Statewide 4
Figure 1. White-tailed deer Data Analysis Units.

White-Tail Deer Statewide 5
StatewideAll GMUs
3-Year Averages Hunters per square mile: 0.82Harvest per square mile: 0.33
Square Miles: 83,471 Success Rate: 40%Hunters 68,679 Hunter-days/Harvest 15Hunter Days 410,070 Antlered: % 5+ points 21%
Regular Deer Tags 2006 2007 2008 2009 2010 2011 2012 2013 2014 2015Hunters 25,153 24,189 31,439 26,838 24,837 24,034 29,869 28,337 29,481 29,706Hunter Days 163,008 109,097 202,202 173,156 152,972 167,027 187,163 174,193 178,634 174,066White-tailed Harvest Total 9,494 8,875 7,950 6,644 7,056 8,590 10,342 8,863 11,127 11,939
Male 6,398 6,204 5,645 5,331 5,746 5,763 6,918 5,937 7,243 7,710Female 2,932 2,626 2,241 1,304 1,310 2,818 3,403 2,911 3,884 4,229
Success Rate 38% 37% 25% 25% 28% 36% 35% 31% 38% 40%Antlered: % 5+ points 19% 24% 24% 25% 26% 24% 22% 19% 20% 19%White-tailed Deer Tags 2006 2007 2008 2009 2010 2011 2012 2013 2014 2015Hunters 21,207 29,306 34,264 29,204 28,441 28,140 31,487 33,092 36,064 35,352Hunter Days 125,271 118,879 201,341 186,820 177,010 183,615 192,429 200,313 214,442 206,417Harvest Total 10,877 11,662 10,543 9,943 10,382 10,928 12,436 12,443 14,976 15,461
Male 7,713 8,548 7,823 7,311 7,903 7,760 8,748 8,972 10,748 10,964Female 2,941 3,017 2,635 2,627 2,479 3,154 3,640 3,435 4,228 4,497
White-tailed Success Rate 51% 40% 31% 34% 37% 39% 39% 38% 42% 44%Antlered: % 5+ points 20% 22% 25% 25% 26% 24% 22% 23% 22% 21%
Controlled Hunt Tags 2006 2007 2008 2009 2010 2011 2012 2013 2014 2015Permits Issued 2,072 3,112 3,615 3,343 3,765 3,365 3,851 4,104 4,183 5,718Hunter Days 11,993 13,083 21,236 18,665 22,494 21,922 24,044 24,605 24,456 33,085Harvest Total 1,258 1,649 1,410 1,396 1,668 1,539 1,760 1,839 1,938 2,945
Male 153 133 139 338 227 125 153 125 144 194Female 1,105 1,516 1,271 1,058 1,441 1,410 1,607 1,715 1,792 2,751
Success Rate 61% 53% 39% 42% 44% 46% 46% 45% 46% 52%Antlered: % 5+ points 11% 11% 15% 18% 24% 26% 35% 21% 25% 23%
All Deer Tags 2006 2007 2008 2009 2010 2011 2012 2013 2014 2015Hunters 48,432 56,607 69,318 59,385 57,043 59,730 65,206 65,533 69,728 70,777Hunter Days 300,272 241,059 424,779 378,641 352,476 372,552 403,636 399,111 417,531 413,568White-tailed Harvest Total 21,629 22,186 19,903 17,983 19,106 21,057 24,583 23,145 28,041 30,344
Male 14,264 14,885 13,607 12,980 13,876 13,649 15,820 15,034 18,135 18,868Female 6,978 7,159 6,147 4,989 5,231 7,381 8,650 8,061 9,904 11,476
Success Rate 45% 39% 29% 30% 33% 35% 38% 35% 40% 43%Antlered: % 5+ points 18% 23% 24% 25% 25% 23% 22% 22% 20% 20%
0%
10%
20%
30%
40%
50%
2006
2007
2008
2009
2010
2011
2012
2013
2014
2015
Per
cent
White-tailed Harvest Success Rate
0%
10%
20%
30%
40%
2006
2007
2008
2009
2010
2011
2012
2013
2014
2015
Per
cent
Antlered: % 5+ points
Figure 2. Statewide White-tailed Deer Harvest.

White-Tail Deer Statewide 6
Northern Forest DAU 1 (GMUs 1, 2, 3, 4, 4A, 6)
Summary Hunter densities in Northern Forest (DAU 1) are relatively high, success rates are moderate, and the opportunity to harvest a mature buck white-tailed deer is high (Figure 3). The 2014 and 2015 general hunting season for antlered deer in the Northern Forest opened 10 October for both the Regular and White-tailed Deer Tag and 10 October for antlerless white-tailed deer. General season length varied from 23 to 53 days for antlered deer, and was 53 days for antlerless deer. Four hundred and fifty extra antlerless tags were offered in portions of GMU 1 and 3 in 2014 and 700 extra antlerless tags were offered during 2015 in these same units. Extra antlerless tags were issued to take advantage of high deer densities and address complaints from some agricultural landowners, an increase from the 350 extra tags offered in 2013. The harvest success rate in 2014 and 2015 for hunters indicating they were hunting whitetails was 41% and 40% respectively, higher than the previous three year average of 33%. The management criteria for hunters, hunter-days and buck harvest are well above minimum objectives. Management Objectives White-tailed deer are substantially more abundant than mule deer in this DAU. Management emphasis is to maintain white-tailed deer populations that support hunting recreation and hunter satisfaction at recent or higher levels. In this DAU, hunters holding either the Regular Deer Tag or the White-tailed Deer Tag may pursue white-tailed deer from 10 October through 1 December. Successive severe winter during 2007-2008 and 2008-2009 decreased white-tailed deer numbers in this DAU and hunting seasons were shortened to 9 days for antlerless deer during the 2009 and 2010 hunting seasons. A mild winter in 2010-2011 resulted in high deer survival and traditional antlerless harvest seasons were restored (10 Oct -9 Nov in GMU 4; 1 Nov – 1 Dec in all other GMUs). The winters of 2014 and 2015 were once again mild and resulted in high deer survival throughout the DAU, therefore traditional antlerless harvest season were maintained. Harvest under the new management plan was as expected, and management objectives were easily met in this DAU. Criteria Minimum Three-year average
(2013-2015) Hunters 14,000 256,050 Hunter-days of recreation 85,000 161,162 Hunter Harvest ND 9,746 Buck harvest 2,700 6,256 %5+ points in the harvest 17% 19%

White-Tail Deer Statewide 7
Population Monitoring Personnel from the Panhandle Region have attempted to collect data on white-tailed deer incidentally while conducting past aerial surveys for elk. The results of this effort were not encouraging and the information has not been utilized in management decisions. Personnel from the Panhandle Region have also conducted spot-light surveys in an attempt to evaluate doe:fawn ratios, however, inconsistencies in the results were determined to be unreliable. Habitat Monitoring Habitat in this DAU is nearly ideal for white-tailed deer. The mixture of agricultural crops and coniferous forest stands has resulted in a high-density whitetail population. This land-use pattern is naturally resistant to certain large-scale habitat changes such as large wildfires. Logging activities in some areas of this DAU have improved white-tailed deer habitat. Urban sprawl has decreased available white-tailed deer winter ranges and limited hunter access in some areas. Weather The winters of 2014 and2015 were considered milder than average winters for most areas of this DAU. There were no indications of significant impacts to white-tailed deer during this period. Habitat Management No specific habitat management actions were undertaken for white-tailed deer management in this DAU. Depredation Management The primary complaint regarding white-tailed deer was too many deer in towns or urban areas. Areas at the periphery of Coeur d’Alene and Hayden produced the most calls. During 2013-2014, the city of Dalton Gardens passed a city ordinance to disallow feeding of deer within city limits and instituted a pilot deer trapping and relocation program. The trapping program was unsuccessful at removing the target number of deer throughout the city and the trapping program ceased after 2014. Increases in extra white-tailed deer antlerless permits reflect the high densities of deer in GMUs 1 and 3 and an attempt to prevent depredation claims. Disease Monitoring Since 2001, over 363 white-tailed deer have been tested for CWD in this DAU. None have had the disease. Emergency Winter Feeding Department sponsored winter feeding was not conducted during this reporting period.

White-Tail Deer Statewide 8
DAU 1: Northern ForestGMUs 1, 2, 3, 4, 4A, 6
3-Year Averages Hunters per square mile: 4.14Harvest per square mile: 1.55
Square Miles: 6,299 Success Rate: 37%Hunters 26,050 Hunter-days/Harvest 18Hunter Days 161,162 Antlered: % 5+ points 19%
Regular Deer Tags 2006 2007 2008 2009 2010 2011 2012 2013 2014 2015Hunters 17,547 16,711 22,564 20,046 17,980 17,668 22,437 20,535 21,168 21,362Hunter Days 115,806 79,431 157,657 135,346 114,964 130,375 146,461 132,807 134,262 131,550White-tailed Harvest Total 6,879 6,332 5,922 4,665 5,035 6,424 7,663 6,414 7,809 8,789
Male 4,599 4,443 4,190 3,860 4,249 4,271 5,146 4,366 5,159 5,735Female 2,174 1,867 1,704 802 787 2,152 2,504 2,045 2,650 3,054
White-tailed Success Rate 39% 38% 26% 23% 28% 36% 34% 31% 37% 41%Antlered: % 5+ points 20% 26% 25% 25% 27% 26% 23% 20% 21% 19%White-tailed Deer Tags 2006 2007 2008 2009 2010 2011 2012 2013 2014 2015Hunters 3,121 3,803 4,333 3,423 2,857 3,059 3,805 4,026 4,516 4,743Hunter Days 17,742 15,811 26,699 20,536 16,082 19,037 22,032 22,098 26,210 25,792Harvest Total 1,472 1,392 1,112 757 694 965 1,253 1,346 1,838 1,896
Male 1,021 949 743 620 581 623 770 928 1,212 1,299Female 426 436 353 137 113 333 476 413 626 597
White-tailed Success Rate 47% 37% 26% 22% 24% 32% 33% 33% 41% 40%Antlered: % 5+ points 23% 21% 24% 24% 31% 20% 21% 15% 17% 18%
Controlled Hunt Tags 2006 2007 2008 2009 2010 2011 2012 2013 2014 2015Permits Issued 50 379 99 56 84 156 346 375 478 946Hunter Days 210 2,488 636 550 648 968 2,224 2,299 2,898 5,569Harvest Total 11 294 48 32 42 108 246 223 323 597
Male 11 20 11 10 12 19 22 20 27 21Female 0 274 36 21 30 87 234 204 296 576
Success Rate 22% 78% 48% 57% 50% 69% 71% 59% 68% 63%Antlered: % 5+ points 55% 15% 44% 50% 73% 26% 41% 31% 50% 42%
All Deer Tags 2006 2007 2008 2009 2010 2011 2012 2013 2014 2015Hunters 20,718 20,893 26,996 23,525 20,916 20,883 26,588 24,936 26,162 27,051Hunter Days 133,758 97,730 184,992 156,432 131,696 150,380 170,717 157,204 163,370 162,911White-tailed Harvest Total 8,362 8,018 7,082 5,454 5,772 7,497 9,163 7,986 9,970 11,282
Male 5,631 5,412 4,944 4,490 4,842 4,913 5,938 5,314 6,398 7,055Female 2,600 2,577 2,093 960 930 2,572 3,204 2,662 3,572 4,227
Success Rate 40% 38% 26% 23% 28% 36% 34% 32% 38% 42%Antlered: % 5+ points 21% 25% 25% 25% 27% 25% 23% 19% 20% 19%
0%
10%
20%
30%
40%
50%
2006
2007
2008
2009
2010
2011
2012
2013
2014
2015
Perc
ent
White-tailed Harvest Success Rate
0%
10%
20%
30%
40%
2006
2007
2008
2009
2010
2011
2012
2013
2014
2015
Perc
ent
Antlered: % 5+ points
Figure 3. Northern Forest White-tailed DAU Status and Objectives

White-Tail Deer Statewide 9
Central Forest DAU 2 (GMUs 7, 9, 10, 12, 14, 15, 16, 18, 23, 24)
Summary Most of Central Forest (DAU 2, Figure 4) consists of coniferous forest habitat with moderate to high road densities. A large percentage of the land in this DAU is under U.S. Forest Service (USFS) ownership. In general, the northern and western portions of the DAU provide good white-tailed deer habitat, while the heavily forested and higher elevation eastern portion supports whitetails at much lower densities. Hunter densities, success rates, and the opportunity to harvest a mature buck white-tailed deer are all moderate. Current general any-weapon deer hunting seasons for antlered whitetails run from 10 October to 20 November (42 days) for most areas in this DAU (GMUs 10, 12, 14, 15, 16, 18, and 23) and are open for antlerless whitetails either season long (GMUs 10, 12, 14, 15, 16, and 18) or 10-16 October (GMU 23; Appendix A). The antlerless season in GMUs 14 and 18 was lengthened from 7 days to its current level (42 days) in 2015. GMUs 7 and 9 have a 31-day (10 Oct - 9 Nov) season for either-sex white-tailed deer. GMU 24 season runs from 10-31 October (27 days) for either-sex white-tailed deer. Additionally, an extra antlerless controlled hunt is held in portions of GMUs 15 and 16 to address crop depredations. The Clearwater Deer Tag was required to hunt in the majority of the GMUs (all but GMUs 7, 9, 23, and 24) in this DAU between 1998 and 2004. This tag was implemented to address trespass complaints on private property by forcing hunters to choose between hunting mule deer in southern Idaho or whitetails and mule deer in the Clearwater Region. Implementation of the Clearwater Tag resulted in a substantial reduction of trespass complaints. Starting in 2005, the Clearwater Deer Tag was replaced by the White-tailed Deer Tag. Under this strategy, more flexibility was given to Idaho hunters by relaxing restrictions on the Regular Deer Tag and allowing it to again be used in the Clearwater Region through 3 November and by allowing White-tailed Deer Tag holders to hunt whitetails throughout the state, including the late portion of the whitetail hunt in the Clearwater Region. This change has been met by little resistance from hunters in the Clearwater Region. In GMUs 7 and 9, hunters holding either the Regular Deer Tag or the White-tailed Deer Tag may pursue white-tailed deer from 10 October through 9 November. Management Objectives An opinion survey conducted during the development of the 2005-2014 White-tailed Deer Management Plan revealed that hunter satisfaction was high for the number of days of white-tailed deer hunting opportunity offered under existing hunting seasons, the opportunity to harvest a white-tailed deer, and the opportunity to harvest a mature white-tailed deer buck. Therefore, management emphasis will be to maintain white-tailed deer populations that support hunting recreation and hunter satisfaction at recent or higher levels. Additionally, management actions designed to maintain adequate harvest pressure on antlerless whitetails will be a priority in order to address depredation concerns. Objectives for minimum hunter numbers, hunter-days of recreation, buck harvest, and percent ≥5 points in the buck harvest were easily met during this reporting period as illustrated in the table below.

White-Tail Deer Statewide 10
Criteria Minimum Three-year average
(2013-2015) Hunters 5,200 8,330 Hunter-days of recreation 25,500 41,512 Hunter harvest ND 3,428 Buck harvest 1,500 2,370 %5+ points in the harvest 10% 16%
Population Monitoring Personnel from the Clearwater Region have attempted to collect sightability data on white-tailed deer incidentally while conducting past elk and mule deer surveys. This data was analyzed with the mule deer sightability model to evaluate if it would provide any useful index to whitetail population status. The results of this effort were not encouraging and the practice has been discontinued. Staff from the Panhandle Region reached a similar conclusion. Habitat Monitoring Coniferous forest (primarily under USFS ownership) is the predominant habitat type for this DAU, especially in the eastern portion. Timber harvest, wildfires, and recent prescribed fires (conducted primarily to enhance elk habitat) help provide a mixture of successional stages to the benefit of whitetails. Loss of low-elevation, closed canopy stands important during deep-snow winters is the primary habitat concern in GMUs 7 and 9. The southern and western portions of the DAU are of mixed ownership with more open rangeland and private property located at lower elevations along the Salmon River and USFS-owned coniferous forest at higher elevations. Noxious weeds, such as yellow starthistle and spotted knapweed, are out-competing native vegetation on lower elevation spring and winter ranges. Additionally, construction of new home-sites has impacted whitetail habitats and limited hunter access. Habitat Management No mapping of whitetail habitats was undertaken during this reporting period. Depredation Management Depredation complaints involving white-tailed deer occur in the privately-owned portions of this DAU. Cash crops that receive damage from whitetails include wheat, barley, oats, peas, lentils, rapeseed, and irrigated alfalfa. Unfenced fruit orchards along the Salmon River also experience damage caused by whitetails. Standard depredation control techniques are employed, beginning with hazing techniques and often culminating with depredation hunts as a last resort. Additionally, a controlled hunt for extra antlerless deer is conducted in portions of GMUs 15 and 16 as a population control measure.

White-Tail Deer Statewide 11
Disease Monitoring Although some deer were lost to Epizootic Hemorrhagic Disease (EHD) in 2003, this DAU was not impacted as heavily as DAU 3. No significant EHD outbreaks have been detected since 2003. A research project overseen by the Wildlife Health Laboratory was conducted during the 2003-2005 field seasons to evaluate the prevalence of Culicoides spp. gnats around the Clearwater Region and to perform virus isolation on these gnats. Culicoides spp. gnats can serve as vectors for a variety of wildlife diseases including EHD and bluetongue virus (BTV). While no major outbreaks have been detected since the study was completed, isolated reports have been documented intermittently throughout the region. An outbreak of BTV (type 17) occurred in 2015 with infected animals seen along the South Fork of the Clearwater River and lower Salmon River. This outbreak drew particular attention from Washington Animal Diagnostic Lab veterinarians because BTV is rarely reported to cause disease in wildlife, generally affecting domestic sheep, cattle, and goats. Additionally, a statewide program to monitor for CWD is ongoing. Samples are collected at big game check stations and from road-killed carcasses. To date, no positive samples have been detected in Idaho. Emergency Winter Feeding Emergency feeding of white-tailed deer by the Department has not occurred in recent years.

White-Tail Deer Statewide 12
DAU 2: Central ForestGMUs 7, 9, 10, 12, 14, 15, 16, 18, 23, 24
3-Year Averages Hunters per square mile: 1.21Harvest per square mile: 0.50
Square Miles: 6,879 Success Rate: 41%Hunters 8,330 Hunter-days/Harvest 12Hunter Days 41,512 Antlered: % 5+ points 16%
Regular Deer Tags 2006 2007 2008 2009 2010 2011 2012 2013 2014 2015Hunters 1,652 1,555 1,903 1,733 1,421 1,394 1,558 1,508 1,526 1,589Hunter Days 9,806 6,321 10,302 9,226 7,996 7,257 8,439 7,627 8,067 7,547White-tailed Harvest Total 442 508 380 469 378 394 491 441 531 599
Male 268 316 225 284 258 230 276 232 246 275Female 161 191 143 183 120 156 215 209 285 324
White-tailed Success Rate 27% 33% 20% 27% 27% 28% 32% 29% 35% 38%Antlered: % 5+ points 7% 22% 12% 16% 8% 13% 12% 10% 10% 6%White-tailed Deer Tags 2006 2007 2008 2009 2010 2011 2012 2013 2014 2015
Hunters 4,571 6,177 6,559 5,671 6,247 5,387 5,943 5,946 6,824 6,913Hunter Days 23,600 23,090 35,009 31,202 34,022 30,402 31,180 30,220 33,318 34,569Harvest Total 2,157 2,333 2,116 1,967 2,181 2,111 2,232 2,236 2,714 3,324
Male 1,605 1,846 1,635 1,510 1,763 1,619 1,652 1,760 2,005 2,586Female 500 473 462 456 417 487 576 477 709 738
White-tailed Success Rate 47% 38% 32% 35% 35% 39% 38% 38% 40% 48%Antlered: % 5+ points 20% 18% 19% 17% 18% 19% 18% 21% 17% 17%
Controlled Hunt Tags 2006 2007 2008 2009 2010 2011 2012 2013 2014 2015Permits Issued 255 281 298 280 283 248 207 206 169 309Hunter Days 1,466 766 1,420 1,236 1,261 1,260 995 955 860 1,373Harvest Total 184 130 142 157 171 147 123 123 115 203
Male 9 7 13 10 17 3 2 4 1 3Female 174 120 126 147 154 144 121 119 114 200
Success Rate 72% 46% 48% 56% 60% 59% 59% 60% 68% 66%Antlered: % 5+ points 0% 0% 15% 0% 17% 33% 0% 0% 0% 0%
All Deer Tags 2006 2007 2008 2009 2010 2011 2012 2013 2014 2015Hunters 6,478 8,013 8,760 7,684 7,951 7,029 7,707 7,660 8,520 8,811Hunter Days 34,872 30,177 46,731 41,664 43,278 38,919 40,614 38,801 42,245 43,489White-tailed Harvest Total 2,783 2,971 2,638 2,593 2,730 2,652 2,846 2,800 3,359 4,125
Male 1,882 2,169 1,873 1,804 2,039 1,852 1,930 1,995 2,252 2,863Female 835 784 731 786 691 787 913 805 1,107 1,262
Success Rate 43% 37% 30% 34% 34% 38% 37% 37% 39% 47%Antlered: % 5+ points 15% 19% 19% 17% 17% 18% 17% 19% 16% 15%
0%
10%
20%
30%
40%
50%
2006
2007
2008
2009
2010
2011
2012
2013
2014
2015
Perc
ent
White-tailed HarvestSuccess Rate
0%
10%
20%
30%
40%
2006
2007
2008
2009
2010
2011
2012
2013
2014
2015
Perc
ent
Antlered: % 5+ points
Figure 4. Central Forest White-tailed DAU Status and Objectives
White-Tail Deer Statewide 13
Northern Agriculture DAU 3 (GMUs 5, 8, 8A, 10A, 11, 11A, 13)
Summary Most of Northern Agriculture (DAU 3, Figure 5) consists of private property (approximately 74%) and is nearly equally split between dryland agriculture and coniferous forest habitats. Hunter densities, success rates, and the opportunity to harvest a mature buck white-tailed deer are amongst the highest in the state. The large private property component of this DAU has led to a number of management challenges including: depredations on agricultural crops, achieving adequate antlerless harvest, and tensions between landowners and sportsmen over access/trespass issues. A significant portion of GMU 5 includes the Coeur d’Alene Indian Reservation, comprised of private and trust properties, some of which require an additional reservation hunting license. Current hunting seasons for white-tailed deer range from a 53-day either-sex season in GMUs 5, 8, 8A, 10A, 11, and 11A (10 Oct-1 Dec), down to a 25-day either-sex season (10 Oct-3 Nov) in GMU 13 (Appendix A). The GMU 13 antlerless season was increased by 18 days to its current length in 2015. Additionally, there is a 13-day antlerless muzzleloader season in units 8A and 10A (2 Dec-14 Dec). Seasons in GMU 5 include a 53-day season for antlered whitetails (10 Oct-1 Dec) and a 53-day (10 Oct-1 Dec) antlerless season which was lengthened by 23 days in 2014. Additionally, controlled hunts for extra antlerless deer are held in GMUs 8, 8A, 10A, 11, and 11A as a population control measure. Controlled hunts for white-tailed deer include an 83-day either-sex youth hunt in 11A and a 66-day either-sex muzzleloader hunt in GMUs 8A and 10A. The Clearwater Deer Tag was required to hunt in most of the GMUs (all but GMU 5) in this DAU between 1998 and 2004. This tag was implemented to address trespass complaints on private property by forcing hunters to choose between hunting mule deer in southern Idaho or whitetails and mule deer in the Clearwater Region. Implementation of the Clearwater Tag resulted in a substantial reduction of trespass complaints. The Clearwater Deer Tag was replaced by the White-tailed Deer Tag in 2005. Under this strategy, more flexibility was given to hunters by relaxing restrictions on the Regular Deer Tag by allowing it to again be used in the Clearwater Region through 3 November and by allowing White-tailed Deer Tag holders to hunt whitetails throughout the state, including the late portion of the whitetail hunt in the Clearwater Region. This change has been met by little resistance from hunters in the Clearwater Region. In GMU 5, hunters holding either the Regular Deer Tag or the White-tailed Deer Tag may pursue white-tailed deer from 10 October through 1 December. Management Objectives An opinion survey conducted during the development of the 2005-2014 White-tailed Deer Management Plan revealed that hunter satisfaction was high for the number of days of white-tailed deer hunting opportunity offered under existing hunting seasons, the opportunity to harvest a white-tailed deer, and the opportunity to harvest a mature white-tailed deer buck. Therefore, management emphasis will be to maintain white-tailed deer populations that support hunting recreation and hunter satisfaction at recent or higher levels. Additionally, management actions

White-Tail Deer Statewide 14
designed to maintain adequate harvest pressure on antlerless whitetails will be a priority in order to address depredation concerns. Objectives for minimum hunter numbers, hunter-days of recreation, buck harvest, and percent ≥5 points in the buck harvest were easily met during this reporting period as illustrated in the table below. Criteria Minimum Three-year average
(2013-2015) Hunters 12,700 26,461 Hunter-days of recreation 81,000 166,948 Hunter harvest ND 11,881 Buck harvest 4,300 7,463 %5+ points in the harvest 10% 23%
Population Monitoring Personnel from the Clearwater Region have attempted to collect sightability data on white-tailed deer incidentally while conducting past elk and mule deer surveys. This data was analyzed with the mule deer sightability model to evaluate if it would provide any useful index to whitetail population status. The results of this effort were not encouraging and the practice has been discontinued. Staff from the Panhandle Region reached a similar conclusion. Habitat Monitoring Habitat in this DAU is nearly ideal for white-tailed deer. The mixture of agricultural crops and coniferous forest stands has resulted in a high-density whitetail population. This land-use pattern is naturally resistant to certain large-scale habitat changes such as large wildfires. However, the construction of new home-sites has decreased available white-tailed deer winter ranges and limited hunter access. Habitat Management No mapping of whitetail habitats was undertaken during this reporting period. Depredation Management Depredation complaints involving white-tailed deer are common in this DAU. Cash crops that receive damage from whitetails include wheat, barley, oats, peas, lentils, garbanzo beans, rapeseed, organic vegetables, bluegrass, and hay. Landowners establishing tree plantations, tree farms, and orchards also experience damage by white-tailed deer. The most chronic depredation complaints in this DAU involve whitetail damage to legumes in GMUs 8, 8A, 11, and 11A. These complaints intensify as the legumes near harvest time. Standard depredation control techniques are employed, beginning with hazing techniques and often culminating with depredation hunts as a last resort. Additionally, controlled hunts for extra antlerless deer are conducted in GMUs 8, 8A, 10A, 11, 11A, 15, and 16 as a population control measure. Disease Monitoring A large-scale Epizootic Hemorrhagic Disease (EHD) outbreak started in the Kamiah area in late July 2003. Previously, EHD had been confirmed only once in the region, when there was a

White-Tail Deer Statewide 15
small-scale outbreak near Peck in 2000. The 2003 outbreak ended with a hard frost that interrupted the Culicoides spp. gnat life cycle in October. While centered on the Kamiah and Kooskia area, whitetail deaths caused by EHD were observed at lower elevations along the Clearwater, South Fork Clearwater, and Salmon Rivers. While actual losses will never be known, localized losses were high (likely 20-80% in some areas). It is likely that several thousand white-tailed deer died. No major EHD outbreaks have been detected since 2003. A research project overseen by the Wildlife Health Laboratory was conducted during the 2003-2005 field seasons to evaluate the prevalence of Culicoides spp. gnats around the Clearwater Region and to perform virus isolation on these gnats. Culicoides spp. gnats can serve a vector for a variety of wildlife diseases including EHD and bluetongue virus (BTV). While no major hemorrhagic disease outbreaks have been detected since the study was completed, isolated reports have been documented intermittently throughout the region. Most recently, an outbreak of BTV (type 17) occurred in 2015 with infected animals seen at low elevation portions of the Clearwater Region, including the lower Salmon, lower South Fork Clearwater and lower Main Clearwater Rivers, and tributaries. Mortalities were also documented in the vicinity of Moscow and Troy. While exact numbers are not known, it is likely that several hundred to a couple of thousand deer died from BTV during this outbreak. Populations did not appear to be significantly affected as the 2015 white-tailed deer harvest was well above the 3 year average. Additionally, a statewide program to monitor for CWD is ongoing. Samples for testing are collected at big game check stations and from road-killed carcasses. To date, no positive samples have been detected in Idaho. Emergency Winter Feeding Emergency feeding of white-tailed deer by the Department has not occurred in recent years.

White-Tail Deer Statewide 16
DAU 3: Northern AgricultureGMUs 5, 8, 8A, 10A, 11, 11A, 13
3-Year Averages Hunters per square mile: 4.64Harvest per square mile: 2.09
Square Miles: 5,698 Success Rate: 45%Hunters 26,461 Hunter-days/Harvest 14Hunter Days 166,948 Antlered: % 5+ points 23%
Regular Deer Tags 2006 2007 2008 2009 2010 2011 2012 2013 2014 2015Hunters 2,801 2,954 3,412 2,939 2,751 2,743 3,716 3,521 3,839 3,861Hunter Days 16,800 12,659 19,509 18,476 17,506 18,310 22,400 21,585 23,115 23,970White-tailed Harvest Total 1,257 1,299 1,108 1,006 981 1,163 1,589 1,359 2,000 1,741
Male 821 877 808 789 763 796 1,046 882 1,275 1,112Female 419 407 295 216 217 368 542 473 725 629
White-tailed Success Rate 45% 44% 32% 34% 36% 42% 43% 39% 52% 45%Antlered: % 5+ points 19% 23% 24% 27% 32% 23% 25% 19% 23% 23%White-tailed Deer Tags 2006 2007 2008 2009 2010 2011 2012 2013 2014 2015Hunters 12,190 17,298 20,583 17,641 16,858 17,071 19,081 19,790 21,578 20,569Hunter Days 75,958 71,261 124,267 118,815 112,677 115,789 122,848 129,643 137,091 131,020Harvest Total 6,790 7,311 6,755 6,586 6,806 7,138 8,226 8,078 9,504 9,285
Male 4,779 5,350 5,061 4,738 5,047 4,996 5,860 5,734 6,884 6,430Female 1,875 1,904 1,659 1,844 1,759 2,141 2,341 2,332 2,620 2,855
White-tailed Success Rate 56% 42% 33% 37% 40% 42% 43% 41% 44% 45%Antlered: % 5+ points 20% 24% 28% 28% 30% 26% 24% 25% 24% 23%
Controlled Hunt Tags 2006 2007 2008 2009 2010 2011 2012 2013 2014 2015Permits Issued 889 1,404 1,337 1,349 1,561 1,426 1,501 1,757 1,802 2,666Hunter Days 4,449 5,435 9,046 7,224 8,411 8,530 8,205 9,564 9,565 15,289Harvest Total 724 806 813 753 895 880 890 1,028 1,037 1,609
Male 64 40 52 46 65 21 17 17 12 41Female 656 756 757 753 830 859 873 1,010 1,024 1,568
Success Rate 81% 57% 61% 56% 57% 62% 59% 59% 58% 60%Antlered: % 5+ points 2% 3% 8% 2% 31% 5% 15% 12% 36% 25%
All Deer Tags 2006 2007 2008 2009 2010 2011 2012 2013 2014 2015Hunters 15,880 21,656 25,332 21,929 21,170 21,240 24,298 25,068 27,220 27,095Hunter Days 97,207 89,355 152,822 144,515 138,594 142,629 153,452 160,793 169,772 170,279White-tailed Harvest Total 8,771 9,416 8,676 8,345 8,681 9,181 10,705 10,465 12,542 12,636
Male 5,664 6,267 5,921 5,573 5,875 5,813 6,923 6,633 8,171 7,584Female 2,950 3,067 2,711 2,813 2,806 3,368 3,756 3,815 4,370 5,052
Success Rate 55% 43% 34% 38% 41% 43% 44% 42% 46% 47%Antlered: % 5+ points 18% 24% 27% 28% 30% 25% 24% 24% 23% 23%
0%
20%
40%
60%
80%
2006
2007
2008
2009
2010
2011
2012
2013
2014
2015
Perc
ent
White-tailed HarvestSuccess Rate
0%
10%
20%
30%
40%
2006
2007
2008
2009
2010
2011
2012
2013
2014
2015
Perc
ent
Antlered: % 5+ points
Figure 5. Northern Agriculture White-tailed DAU Status and Objectives

White-Tail Deer Statewide 17
Backcountry DAU 4 (GMUs 16A, 17, 19, 19A, 20, 20A, 26, 27)
Summary Most of Back Country (DAU 4, Figure 6) is classified as wilderness. Land ownership is over 99% USFS. Road densities are extremely low, with most roads acting as peripheral access to the Selway-Bitterroot, Gospel Hump, and Frank Church River-of-No-Return wilderness areas. This low road density contributes to relatively low deer vulnerability in the area. Habitat varies from mesic forest conditions in the Selway River drainage to dry, open pine/grassland habitat in the Salmon River drainage. Hunter densities are low and any-weapon seasons are long in this DAU (Appendix A). Current general any-weapon deer hunting seasons for either-sex whitetails run from 15 September to 18 November (65 days) for most areas in this DAU (GMUs 16A, 17, 19, 20, 20A, 26, and 27). In GMU 19A, current general any-weapon deer hunting season for either sex whitetails runs from 10-31 October (22 days). Little quantifiable information exists on present or historic white-tailed deer populations in this DAU. In the late 1980s and early 1990s, white-tailed deer and mule deer were managed as a “single species” with a single, general, either-sex season framework that ran from 15 September to 18 November. In 1997, the bag limit in this DAU south of the Salmon River was changed to bucks-only in response to deer herd (primarily mule deer) declines from the severe winter 1992-1993. The Clearwater Deer Tag was established in 1998 for hunting deer in the Clearwater Region, which affected lands in this DAU north of Salmon River. Further management changes in 2000 included converting general seasons to controlled hunts for deer south of Salmon River during the more vulnerable periods in late October and November. The rugged and remote nature of this area will continue to limit the impacts of humans on white-tailed deer and habitat. Management Objectives Mule deer are more abundant than white-tailed deer in this DAU. Management emphasis will be to maintain the “single species” approach. White-tailed deer populations will be maintained to support hunting recreation and hunter satisfaction at recent or higher levels. The harvest survey system was modified in 2005, in conjunction with adoption of a separate whitetail tag, so that species-specific hunter effort could be quantified. Based on data from the 2014 and 2015 seasons, harvest objectives were nearly met or exceeded in DAU 4. However, the prevalence of whitetail hunter effort and harvest may be overestimated in GMUs south of Salmon River where whitetails are extremely rare or nonexistent. Based on data from the 2010 season, the number of hunters and hunter-days were below objective in DAU 4 (See table below). Since 2010, harvest data indicates a continued decrease in hunter effort and overall harvest, although success has remained high. This reduction in hunter participation is a direct result of a decrease in elk and elk hunters in these backcountry GMUs. Most of the deer harvest has historically been of an incidental nature by elk hunters.

White-Tail Deer Statewide 18
Criteria Minimum Three-year average
(2013-2015) Hunters 700 443 Hunter-days of recreation 3,500 2,401 Hunter harvest ND 133 Buck harvest ND 92 %5+ points in the harvest 10% 26%
Population Monitoring Because of the low whitetail density and hunter participation, no population monitoring or modeling is conducted for this DAU. Habitat Monitoring Because the area is predominately designated wilderness, very little intentional habitat management occurs. Habitat trend is largely determined by wildfire occurrence and extent. Within occupied whitetail range in this DAU, fires have been sporadic in recent years, affecting relatively small portions of occupied habitat. Perhaps the most significant recent habitat trend in portions of the DAU has been increasing infestations of noxious weeds. Habitat Management The Department has been involved with weed control projects in parts of the DAU, but management actions are limited by wilderness designation as well as logistical considerations. Depredation Management Depredations are not an issue in this wilderness DAU. Disease Monitoring Opportunities for disease monitoring in this DAU are limited by several factors: remote, rugged terrain; low number of whitetails; and the fact that few whole carcasses or even heads are brought out by hunters. Nevertheless, biological samples (primarily for CWD testing) are collected opportunistically at check stations. Emergency Winter Feeding Emergency winter feeding is not a consideration in this wilderness DAU.

White-Tail Deer Statewide 19
DAU 4: BackcountryGMUs 16A, 17, 19, 19A, 20, 20A, 26, 27
3-Year Averages Hunters per square mile: 0.08Harvest per square mile: 0.02
Square Miles: 5,873 Success Rate: 30%Hunters 443 Hunter-days/Harvest 18Hunter Days 2,401 Antlered: % 5+ points 26%
Regular Deer Tags 2006 2007 2008 2009 2010 2011 2012 2013 2014 2015Hunters 460 352 378 225 301 242 240 246 218 244Hunter Days 3,493 1,485 2,258 1,286 1,929 1,387 1,587 1,485 1,226 1,269White-tailed Harvest Total 184 161 105 95 106 100 91 99 87 60
Male 161 129 76 66 78 73 77 77 57 34Female 20 32 26 29 28 26 14 21 30 26
White-tailed Success Rate 40% 46% 28% 42% 35% 41% 38% 40% 40% 25%Antlered: % 5+ points 20% 16% 36% 37% 23% 32% 41% 19% 29% 27%White-tailed Deer Tags 2006 2007 2008 2009 2010 2011 2012 2013 2014 2015Hunters 245 274 352 226 221 209 193 191 314 104Hunter Days 1,543 1,218 1,937 1,348 1,260 1,082 961 974 1,818 394Harvest Total 85 91 97 54 61 63 49 54 65 27
Male 43 65 74 43 56 52 33 34 50 18Female 41 24 20 11 5 11 16 21 15 9
White-tailed Success Rate 35% 33% 28% 24% 28% 30% 25% 28% 21% 26%Antlered: % 5+ points 12% 38% 11% 9% 5% 25% 19% 24% 38% 30%
Controlled Hunt Tags 2006 2007 2008 2009 2010 2011 2012 2013 2014 2015Permits Issued 3 16 11 8 9 1 1 5 2 4Hunter Days 13 39 58 56 48 4 4 13 7 16Harvest Total 12 5 4 3 2 0 1 2 1 4
Male 12 5 4 2 2 0 1 2 1 4Female 0 0 0 1 0 0 0 0 0 0
Success Rate 400% 31% 36% 38% 22% 0% 100% 40% 50% 100%Antlered: % 5+ points 33% 0% 25% 0% 50% 0% 100% 0% 100% 33%
All Deer Tags 2006 2007 2008 2009 2010 2011 2012 2013 2014 2015Hunters 708 642 741 459 531 452 435 442 535 351Hunter Days 5,049 2,742 4,253 2,690 3,237 2,473 2,552 2,472 3,051 1,679White-tailed Harvest Total 281 257 206 152 169 163 141 155 154 91
Male 216 199 154 111 136 125 111 113 108 56Female 61 56 46 41 33 37 30 42 46 35
Success Rate 40% 40% 28% 33% 32% 36% 32% 35% 29% 26%Antlered: % 5+ points 17% 23% 24% 26% 16% 29% 35% 20% 32% 28%
0%
10%
20%
30%
40%
50%
2006
2007
2008
2009
2010
2011
2012
2013
2014
2015
Perc
ent
White-tailed Success Rate
0%
10%
20%
30%
40%
2006
2007
2008
2009
2010
2011
2012
2013
2014
2015
Perc
ent
Antlered: % 5+ points
Figure 6. Backcountry White-tailed Deer DAU Status and Objectives

White-Tail Deer Statewide 20
Rangeland Riparian Habitat DAU 5 (GMUs 21, 21A, 28, 29, 30, 30A, 36A, 36B, 37, 37A, 38, 39, 50, 51
58, 59, 59A, 60, 60A, 62, 63A, 64, 65, 67, 68A) Summary Historical accounts for Rangeland-Riparian Habitat (DAU 5, Figure 7) indicate that white-tailed deer were native to the area. At the turn of the century, white-tailed deer were relatively scarce, most likely over-hunted by early settlers. In 1957, white-tailed deer were apparently reintroduced in the river bottoms of the South Fork and North Fork of the Snake River. Since the early 1980s, white-tailed deer have expanded in distribution and grown in number. They have moved farther up the South Fork and Henrys Fork of the Snake River. Currently, they exist along rivers and creeks and have spread into thick conifer and aspen stands in some areas. Area residents are reporting that more white-tailed deer inhabit the area. There is no survey data on white-tailed deer and harvest data could be misleading due to inconsistent seasons and an increased popularity of white-tailed deer hunting. It does, however, appear that populations have increased. Although local hunters were not traditionally white-tailed deer hunters, the sport is gaining popularity. This could be due to restricted mule deer seasons, decreased numbers of mule deer in some areas, and increases in white-tailed deer populations. White-tailed deer hunter densities are relatively low, success rates are low, and the opportunity to harvest a mature buck is moderate. Past general hunting seasons for white-tailed deer were structured mainly for mule deer. New seasons with the white-tailed deer tag are better suited for hunting white-tailed deer. Management Objectives White-tailed deer in this area are being managed relative to goals outlined in the current state plan. White-tailed deer are managed with extensive either-sex and/or antlerless-only harvest to reduce depredation occurrence, disease issues, and expansion of populations into mule deer ranges. The white-tailed deer tag structure has allowed the Department to more effectively manage hunters and harvest. The area has a diversity of white-tailed deer hunting opportunities with long general season structures under two general tag formats, and liberal either-sex general hunting seasons available while maintaining minimum harvest objectives for mature bucks. The wide range of hunting opportunities minimizes hunter crowding and increases flexibility. Improvement of disease monitoring has occurred with multiple CWD collection programs in place for early detection of the disease. White-tailed deer are managed in appropriate habitats in this DAU. Buck survival is managed to maintain a range of 10-30% of bucks with ≥5 antler points per side. In the past, this objective has easily been met for this DAU and was met for this reporting period.
White-Tail Deer Statewide 21
Criteria Minimum Three-year average (2013-2015)
Hunters 900 4,380 Hunter-days of recreation 4,700 25,431 Hunter harvest ND 1,333 Buck harvest ND 826 %5+ points in the harvest 10% 24%
Population Monitoring Population monitoring is difficult in the broken habitats found in this DAU. Deer abundance and density are difficult to sample due to the isolated and dispersed habitats and the difficulty of estimating white-tailed deer numbers. Research activities on white-tailed deer are a low priority in southern Idaho and no work was done during this reporting period. Only harvest data is currently available for white-tailed deer management in DAU 5. Success rates could be used to index population trend, but the inconsistent seasons and variable weather influence makes interpretation difficult. Antler-point summaries from harvested bucks can be used to index adult buck survival. Spotlight surveys could be conducted in this DAU to assess herd composition but are of low priority. Harvest data and season structure is becoming standardized and will likely produce good information in the future. Habitat Monitoring The rangeland-riparian habitat of this DAU does not commonly see dramatic natural large-scale habitat changes. The area has, however, experienced extensive housing development. In some cases, this development may reduce habitat but may actually increase white-tailed deer use due to habitat changes brought on by the housing developments. Farming practices have also changed substantially in the last 20 years with a switch to center-pivot irrigation systems that may have reduced habitat effectiveness for white-tailed deer. Habitat Management This DAU can be broadly described as mostly river bottom, with large amounts of agricultural land and some forested aspen and conifer areas. Habitat security is moderate, with patchy vegetative cover and very easy access to most white-tailed deer habitat. White-tailed deer are starting to expand out of riparian areas into forested draws and hills. This is likely due to natural and human-induced habitat changes creating habitats more conducive to white-tailed deer. Little has been done on mapping white-tailed deer habitat in this DAU. The majority of the white-tailed deer habitat is on private lands making habitat conservation and improvement difficult. Depredation Management White-tailed deer habitat in this DAU is almost entirely private land. White-tailed deer frequently cause damage to vegetable gardens, orchards, nurseries, haystacks, and field crops. Depredation control is, therefore, an important aspect of managing white-tailed deer in this DAU. In the winter months, a common problem in the area is white-tailed deer frequenting

White-Tail Deer Statewide 22
haystacks which results in haystack paneling. The below moderate to bad winter of 2015-2016 resulted in an increase in whitetail depredations, particularly to stored forage crops (hay stacks). Disease Monitoring Disease has not been a major issue in this DAU due to relatively low deer densities. Testing for CWD is done on roadkilled deer and on harvested deer at check stations. At this point, this area does not appear to have high enough densities of white-tailed deer to result in large winterkills or disease die-offs. Emergency Winter Feeding Winter feeding has not been a large issue for white-tailed deer in this DAU. The only place the Department has undertaken emergency winter feeding for white-tailed deer in the area was in the Teton Basin. During winter 2006-2007, white-tailed deer were fed at 3 sites in GMU 62. Winter feeding is discouraged except for when emergency winter feeding criteria are met. No winter feeding occurred during this reporting period

White-Tail Deer Statewide 23
DAU 5: Rangeland-Riparian HabitatGMUs 21, 21A, 28, 29, 30, 30A, 36A, 36B, 37, 37A, 38, 39, 50, 51, 58,
59, 59A, 60, 60A, 62, 63A, 64, 65, 67, 68A3-Year Averages Hunters per square mile: 0.25
Harvest per square mile: 0.07Square Miles: 17,859 Success Rate: 30%Hunters 4,380 Hunter-days/Harvest 60Hunter Days 25,431 Antlered: % 5+ points 24%
Regular Deer Tags 2006 2007 2008 2009 2010 2011 2012 2013 2014 2015Hunters 1,424 1,300 1,893 959 1,078 936 954 1,100 1,344 1,052Hunter Days 10,281 4,514 7,178 4,960 5,534 5,278 4,303 6,045 5,618 4,414White-tailed Harvest Total 476 392 256 249 326 304 282 298 334 433
Male 402 291 222 209 240 259 230 239 244 358Female 65 100 33 39 86 45 47 58 90 75
White-tailed Success Rate 33% 30% 14% 26% 30% 32% 30% 27% 25% 41%Antlered: % 5+ points 27% 19% 20% 29% 21% 25% 19% 20% 21% 19%White-tailed Deer Tags 2006 2007 2008 2009 2010 2011 2012 2013 2014 2015Hunters 755 1,258 1,706 1,647 1,559 1,695 1,812 2,172 1,823 1,887Hunter Days 4,491 5,601 9,869 12,192 9,972 12,716 12,163 13,327 11,109 9,364Harvest Total 298 433 381 456 482 535 560 583 622 705
Male 221 304 252 334 365 396 377 438 477 518Female 72 114 119 122 118 140 175 135 145 187
White-tailed Success Rate 39% 34% 22% 28% 31% 32% 31% 27% 34% 37%Antlered: % 5+ points 18% 25% 24% 21% 24% 27% 27% 21% 25% 31%
Controlled Hunt Tags 2006 2007 2008 2009 2010 2011 2012 2013 2014 2015Permits Issued 582 760 1,483 1,201 1,289 1,128 1,326 1,298 1,193 1,271Hunter Days 4,502 3,610 7,943 7,690 9,072 8,702 10,112 9,391 8,638 8,388Harvest Total 243 323 311 276 370 282 367 337 311 375
Male 45 47 39 237 71 54 75 58 64 81Female 192 271 266 38 298 229 292 279 247 294
Success Rate 42% 43% 21% 23% 29% 25% 28% 26% 26% 30%Antlered: % 5+ points 11% 18% 18% 22% 22% 41% 44% 24% 22% 25%
All Deer Tags 2006 2007 2008 2009 2010 2011 2012 2013 2014 2015Hunters 2,761 3,318 5,082 3,807 3,926 3,759 4,092 4,570 4,361 4,210Hunter Days 19,274 13,725 24,990 24,842 24,578 26,696 26,578 28,763 25,365 22,165White-tailed Harvest Total 1,017 1,148 948 981 1,178 1,121 1,208 1,218 1,268 1,513
Male 668 642 513 780 676 709 682 736 786 957Female 329 485 418 199 501 414 515 472 482 556
Success Rate 37% 35% 19% 26% 30% 30% 30% 27% 29% 36%Antlered: % 5+ points 18% 22% 22% 24% 23% 27% 26% 21% 23% 26%
0%
10%
20%
30%
40%
2006
2007
2008
2009
2010
2011
2012
2013
2014
2015
Perc
ent
White-tailed Harvest Success Rate
0%
10%
20%
30%
40%
2006
2007
2008
2009
2010
2011
2012
2013
2014
2015
Perc
ent
Antlered: % 5+ points
Figure 7. Rangeland-Riparian Habitat White-tailed Deer DAU Status and Objectives

White-Tail Deer Statewide 24
Dryland Forest DAU 6 (GMUs 22, 25, 31, 32, 32A, 33, 34, 35, 36, 43, 44, 48, 49, 61, 62A)
Summary Potential for increasing white-tailed deer populations in Dryland Forest (DAU 6, Figure 8) is limited because of habitat and elevation constraints. Mule deer will continue to receive primary management emphasis and white-tailed deer densities and harvest are expected to remain low. The statewide White-tailed Deer Tag was implemented in 2005. October hunting seasons were established for either-sex white-tailed deer in GMUs 22, 25, 31, 32, 32A, 33, 34, 35, 36, 43, 61, and 62A (Appendix A). November hunting opportunity is allowed in GMUs 61 and 62A. Controlled hunts for an extra antlerless deer are used to manage damage to agricultural crops in GMUs 61 and 62A. Some white-tailed deer encountered at big game check stations are sampled for CWD testing. Management Objectives Strategies outlined in the 2005-2014 White-tailed Deer Management Plan and pertinent to this DAU are establishing the statewide White-tailed Deer Tag, providing standardized white-tailed deer seasons; exploring additional opportunities to reduce deer numbers in areas sustaining high agricultural damage; and monitoring diseases in white-tailed deer populations. Habitat and elevation constraints limit opportunity for increasing white-tailed deer populations in this DAU. In most of the DAU, future increases in white-tailed deer numbers will be associated with riparian habitats along major drainages. Mule deer will continue to receive primary management emphasis and white-tailed deer densities and harvest are expected to remain low. Criteria Minimum Three-year average
(2013-2015) Hunters 1,000 1,530 Hunter-days of recreation 2,100 7,086 Hunter harvest ND 343 Buck harvest ND 172 %5+ Points in the harvest 10% 11%
Population Monitoring Currently, there is no reliable aerial or ground survey technique for estimating white-tailed deer populations. Field observations and increased harvest indicate white-tailed deer are expanding along some riparian areas such as the South Fork of the Payette. Habitat Monitoring White-tailed deer are distributed along riparian and agricultural habitat associations in this DAU. Some white-tailed deer extend into the drier ponderosa uplands and canyons in this area. Fire, farming, and development all affect white-tailed deer habitat in this DAU, but these changes are not monitored.

White-Tail Deer Statewide 25
Depredation Management Although white-tailed deer are considered low in numbers in this DAU, they are often found concentrated around agricultural fields. Damage to crops occurs in some cases. Areas with chronic white-tailed deer depredations are often managed with controlled hunts for an extra antlerless deer. No cases of white-tail deer depredation were reported for GMUs 61 and 62A despite severe drought conditions during the summer months. Disease Monitoring White-tailed deer are monitored for CWD in this DAU. Samples are collected at big game check stations during the Regular Deer Tag any-weapon seasons. To date, no positive samples have been found. Emergency Winter Feeding Occasionally, white-tailed deer are fed incidental to feeding implemented in severe winters to prevent catastrophic loss of mule deer.

White-Tail Deer Statewide 26
DAU 6: Dryland ForestGMUs: 22, 25, 31, 32, 32A, 33, 34, 35, 36, 43, 44, 48, 49, 61, 62A
3-Year Averages Hunters per square mile: 0.14Harvest per square mile: 0.03
Square Miles: 10,609 Success Rate: 22%Hunters 1,530 Hunter-days/Harvest 21Hunter Days 7,086 Antlered: % 5+ points 10%
Regular Deer Tags 2006 2007 2008 2009 2010 2011 2012 2013 2014 2015Hunters 625 596 485 426 550 516 459 567 677 652Hunter Days 3,707 2,130 2,453 1,776 2,181 2,128 1,987 2,333 3,306 2,141White-tailed Harvest Total 153 90 101 84 108 86 103 124 153 158
Male 82 67 61 72 68 60 58 76 100 93Female 66 22 29 12 40 25 45 48 53 65
White-tailed Success Rate 24% 15% 21% 20% 20% 12% 13% 13% 15% 14%Antlered: % 5+ points 3% 2% 7% 3% 3% 12% 3% 12% 10% 6%White-tailed Deer Tags 2006 2007 2008 2009 2010 2011 2012 2013 2014 2015Hunters 194 259 459 415 386 496 452 506 749 832Hunter Days 848 1,097 2,286 1,982 1,866 2,700 2,214 2,639 3,458 4,072Harvest Total 56 35 61 91 113 92 81 83 168 167
Male 37 6 40 41 64 62 40 42 88 84Female 17 28 19 50 49 29 41 41 80 83
White-tailed Success Rate 29% 14% 13% 22% 29% 19% 18% 16% 22% 20%Antlered: % 5+ points 4% 8% 28% 30% 5% 6% 24% 10% 8% 17%
Controlled Hunt Tags 2006 2007 2008 2009 2010 2011 2012 2013 2014 2015Permits Issued 84 89 58 201 255 143 200 154 215 237Hunter Days 300 284 305 902 1,338 1,008 1,123 920 1,224 1,162Harvest Total 49 35 25 59 86 34 50 59 52 64
Male 3 6 7 7 20 6 14 6 11 18Female 45 28 18 52 66 29 36 53 40 46
Success Rate 58% 39% 43% 29% 34% 24% 25% 38% 24% 27%Antlered: % 5+ points 0% 0% 31% 15% 5% 0% 40% 46% 0% 0%
All Deer Tags 2006 2007 2008 2009 2010 2011 2012 2013 2014 2015Hunters 903 944 1,002 1,042 1,192 1,155 1,111 1,227 1,641 1,721Hunter Days 4,855 3,511 5,044 4,660 5,386 5,836 5,324 5,892 7,989 7,376White-tailed Harvest Total 258 160 187 234 306 212 234 266 373 390
Male 122 79 108 120 151 128 111 123 199 195Female 128 78 66 114 91 83 122 142 173 195
Success Rate 29% 17% 19% 22% 26% 18% 21% 22% 23% 23%Antlered: % 5+ points 2% 3% 16% 13% 4% 9% 15% 13% 9% 10%
0%
10%
20%
30%
40%
2006
2007
2008
2009
2010
2011
2012
2013
2014
2015
Perc
ent
White-tailed Harvest Success Rate
0%
10%
20%
30%
40%
2006
2007
2008
2009
2010
2011
2012
2013
2014
2015
Perc
ent
Antlered: % 5+ points
Figure 8. Dryland Forest White-tailed Deer DAU Status and Objectives

White-Tail Deer Statewide 27
Southern Idaho DAU 7 (GMUs 40, 41, 42, 45, 46, 47, 52, 52A, 53, 54, 55, 56, 57, 63, 66, 66A,
69, 70, 71, 72, 73, 73A, 74, 75, 76, 77, and 78) Summary White-tailed deer populations in DAU 7 (Fig 9) have historically been low to nonexistent. There are no accounts of white-tailed deer in Osborne Russell’s (1914) “Journal of a Trapper” during the 1800s. White-tailed deer populations remained, for the most part, nonexistent until human settlement, which brought grazing and land clearing for agricultural purposes. These practices provided water and forage suitable for white-tailed deer. White-tailed deer and mule deer have historically been managed as a “single species.” For the most part, this DAU continues to be managed this way, with the exception of some controlled hunting opportunities specifically for white-tailed deer in the Upper Snake Region. Area residents are reporting that more white-tailed deer inhabit the area. There is no survey data on white-tailed deer and harvest data could be misleading due to inconsistent seasons and an increased popularity of white-tailed deer hunting. It does, however, appear that populations have increased. Management Objectives Currently, each GMU within DAU 7 provides long seasons and extra opportunity with minimal crowding. While the current season framework does not encourage the expansion of white-tailed deer within this DAU, field observations and increased harvest indicate white-tailed deer are expanding in some portions of DAU 7. Objectives for DAU 7 are to maintain opportunity for a minimum of 800 white-tailed deer hunters, provide a minimum of 1,600 hunter days of recreation, and maintain a minimum of 10% of the male harvest at ≥5 points. Criteria Minimum Three-year average
(2013-2015) Hunters 800 1,290 Hunter-days of recreation 1,600 5,445 Hunter harvest ND 305 Buck harvest ND 163 %5+ Points in the harvest 10% 12%
Population Monitoring Population monitoring for white-tailed deer has been minimal. There have been some attempts at green-field counts and camera census, but they have proved unpractical due to the low density of deer populations. Additionally, white-tailed deer select riparian cover, which occludes deer from the air, making aerial surveys extremely difficult. Most white-tailed deer data comes from field observations and incidentally during deer and elk population surveys.
White-Tail Deer Statewide 28
Habitat Monitoring Current habitat monitoring focuses on mule deer and elk wintering habitat within DAU 7. Riparian habitat monitoring has been done, to some extent, by land management agencies such as the BLM and USFS to monitor grazing. Habitat Management Currently, there is no habitat management ongoing within this DAU. However, some mule deer, turkey, and elk habitat projects can have positive impacts on portions of white-tailed deer range. Depredation Management There are very few depredation complaints regarding white-tailed deer in DAU 7. Disease Monitoring There is currently no disease monitoring program designed specifically for white-tailed deer. White-tailed deer are sampled on occasion at Department check stations incidental to mule deer and elk sampling. Emergency Winter Feeding Winter feeding operations have been focused on mule deer and elk within this DAU; there are no white-tailed deer-specific winter feeding operations. Literature Cited Russell, O. 1914. Journal of a Trapper, 1834-1843. Syms-York, Boise, Idaho.

White-Tail Deer Statewide 29
DAU 7: Southern IdahoGMUs: 40, 41, 42, 45, 46, 47, 52, 52A, 53, 54, 55, 56, 57, 63, 66,
66A, 68, 69, 70, 71, 72, 73, 73A, 74, 75, 76, 77, 783-Year Averages Hunters per square mile: 0.04
Harvest per square mile: 0.01Square Miles: 30,255 Success Rate: 24%Hunters 1,290 Hunter-days/Harvest 18Hunter Days 5,445 Antlered: % 5+ points 12%
Regular Deer Tags 2006 2007 2008 2009 2010 2011 2012 2013 2014 2015Hunters 644 721 804 510 598 535 484 626 708 871Hunter Days 3,115 2,557 2,845 2,086 2,594 2,293 1,925 2,262 3,041 3,174White-tailed Harvest Total 103 93 78 76 122 119 116 115 212 159
Male 65 81 63 51 90 73 81 59 161 103Female 27 7 11 23 32 45 35 52 51 56
White-tailed Success Rate 16% 13% 10% 15% 20% 22% 24% 18% 30% 18%Antlered: % 5+ points 6% 25% 23% 25% 16% 8% 11% 7% 11% 6%White-tailed Deer Tags 2006 2007 2008 2009 2010 2011 2012 2013 2014 2015Hunters 131 237 272 181 193 222 184 292 259 261Hunter Days 1,089 801 1,274 745 1,017 1,877 967 1,378 1,437 1,206Harvest Total 19 67 21 32 37 24 27 52 64 55
Male 7 28 18 25 26 11 14 37 31 28Female 10 38 3 7 10 13 14 16 33 27
White-tailed Success Rate 15% 28% 8% 18% 19% 11% 15% 18% 25% 21%Antlered: % 5+ points 11% 34% 17% 32% 8% 64% 51% 27% 23% 33%
Controlled Hunt Tags 2006 2007 2008 2009 2010 2011 2012 2013 2014 2015Permits Issued 209 183 329 248 241 261 269 276 297 278Hunter Days 1,053 461 1,828 1,007 1,475 1,448 1,369 1,302 1,246 1,289Harvest Total 49 75 83 72 83 86 83 66 97 92
Male 9 8 13 26 35 22 22 18 27 25Female 38 67 68 46 48 61 61 48 70 67
Success Rate 23% 41% 25% 29% 34% 33% 31% 24% 33% 33%Antlered: % 5+ points 0% 25% 0% 0% 13% 18% 9% 5% 13% 15%
All Deer Tags 2006 2007 2008 2009 2010 2011 2012 2013 2014 2015Hunters 984 1,141 1,405 939 1,032 1,018 937 1,194 1,264 1,411Hunter Days 5,257 3,819 5,947 3,838 5,086 5,618 4,261 4,943 5,724 5,669White-tailed Harvest Total 171 235 182 180 242 229 226 234 374 307
Male 81 117 94 102 151 106 116 113 220 157Female 75 112 82 76 91 119 110 116 154 150
Success Rate 17% 21% 13% 19% 23% 22% 24% 20% 30% 22%Antlered: % 5+ points 5% 26% 18% 21% 14% 16% 15% 13% 13% 11%
0%
10%
20%
30%
40%
2006
2007
2008
2009
2010
2011
2012
2013
Perc
ent
White-tailed Harvest Success Rate
0%
10%
20%
30%
40%
2006
2007
2008
2009
2010
2011
2012
2013
Perc
ent
Antlered: % 5+ points
Figure 9. Southern Idaho White-tailed Deer DAU Status and Objectives
White-Tail Deer Statewide 30
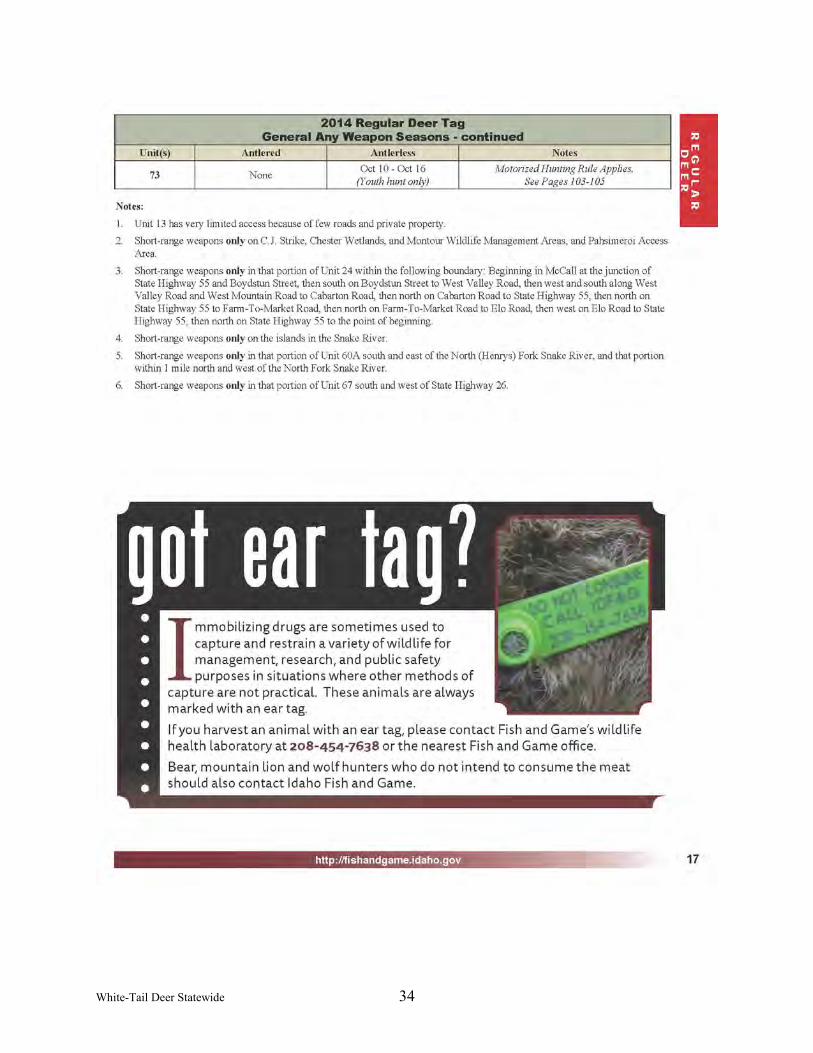
Appendix A IDAHO
2014/2015 SEASON
WHITE-TAILED DEER RULES

White-Tail Deer Statewide 31

White-Tail Deer Statewide 32

White-Tail Deer Statewide 33
White-Tail Deer Statewide 34

White-Tail Deer Statewide 35

White-Tail Deer Statewide 36

White-Tail Deer Statewide 37
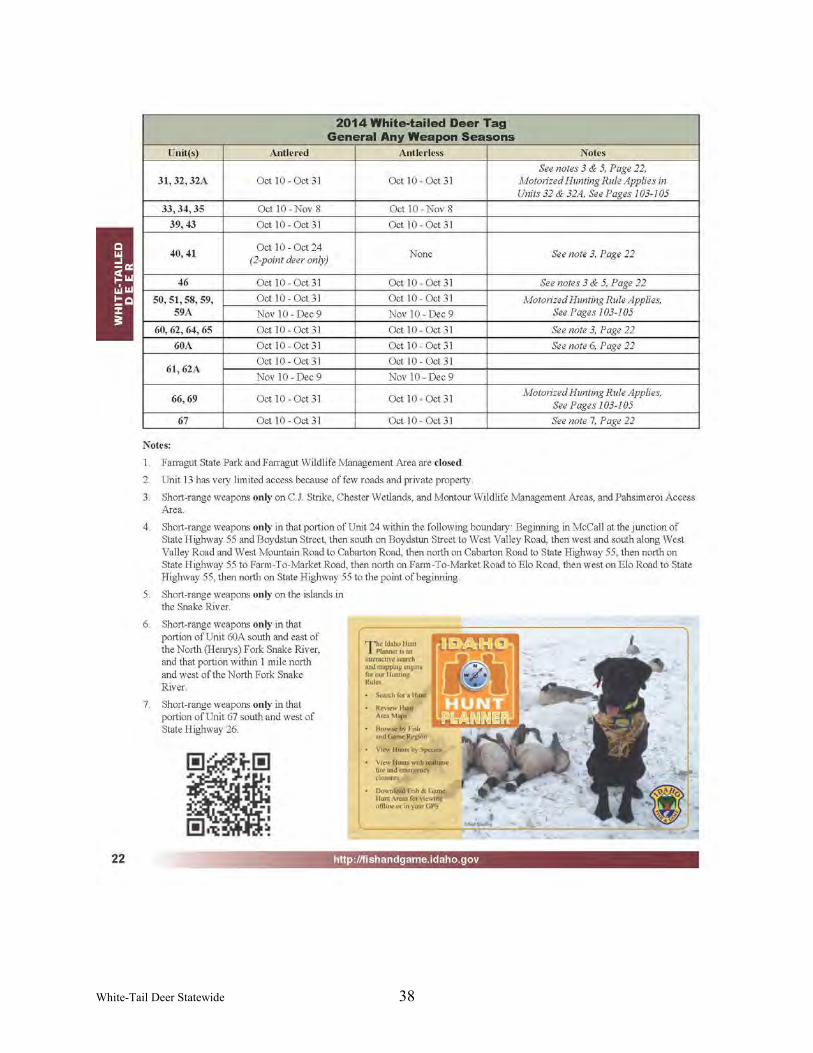
White-Tail Deer Statewide 38

White-Tail Deer Statewide 39
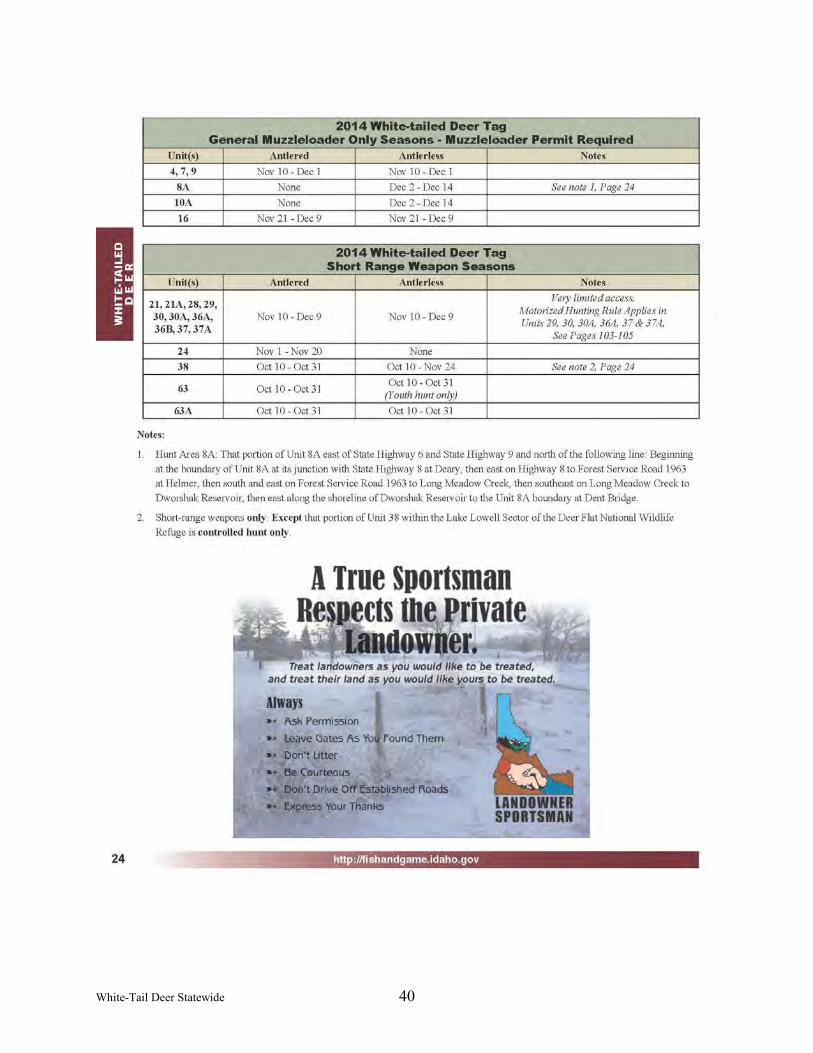
White-Tail Deer Statewide 40

White-Tail Deer Statewide 41

White-Tail Deer Statewide 42

White-Tail Deer Statewide 43

White-Tail Deer Statewide 44

White-Tail Deer Statewide 45
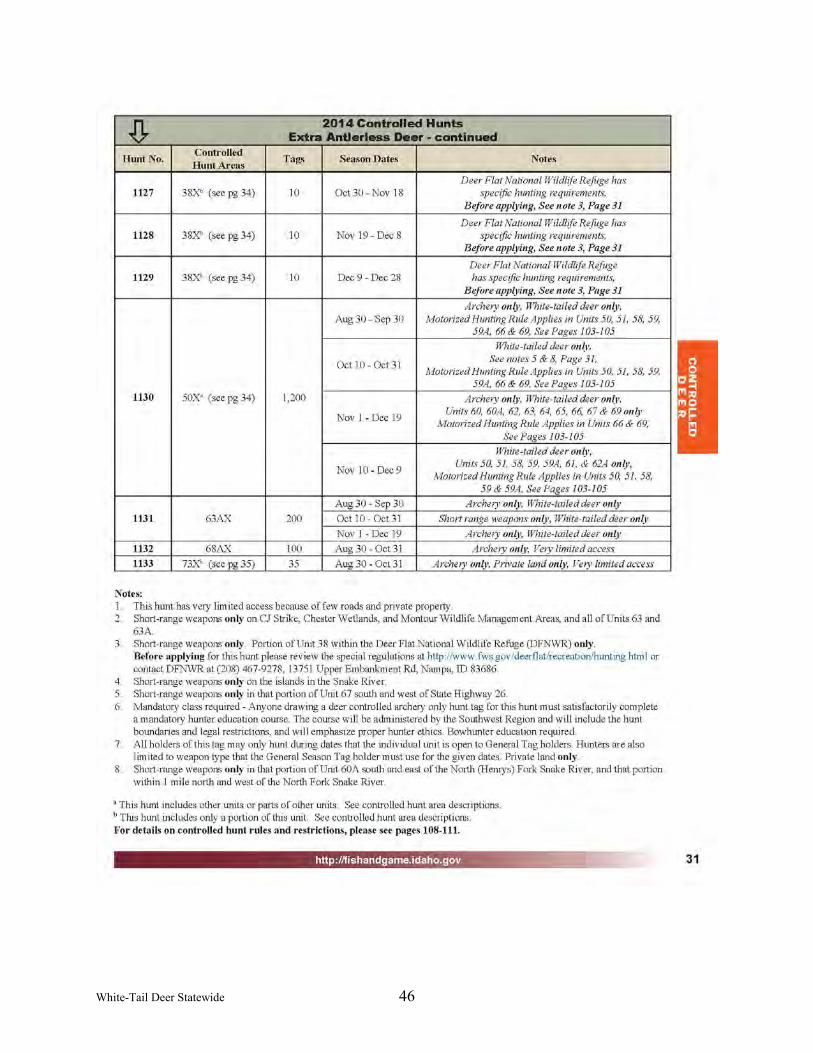
White-Tail Deer Statewide 46

White-Tail Deer Statewide 47

White-Tail Deer Statewide 48

White-Tail Deer Statewide 49
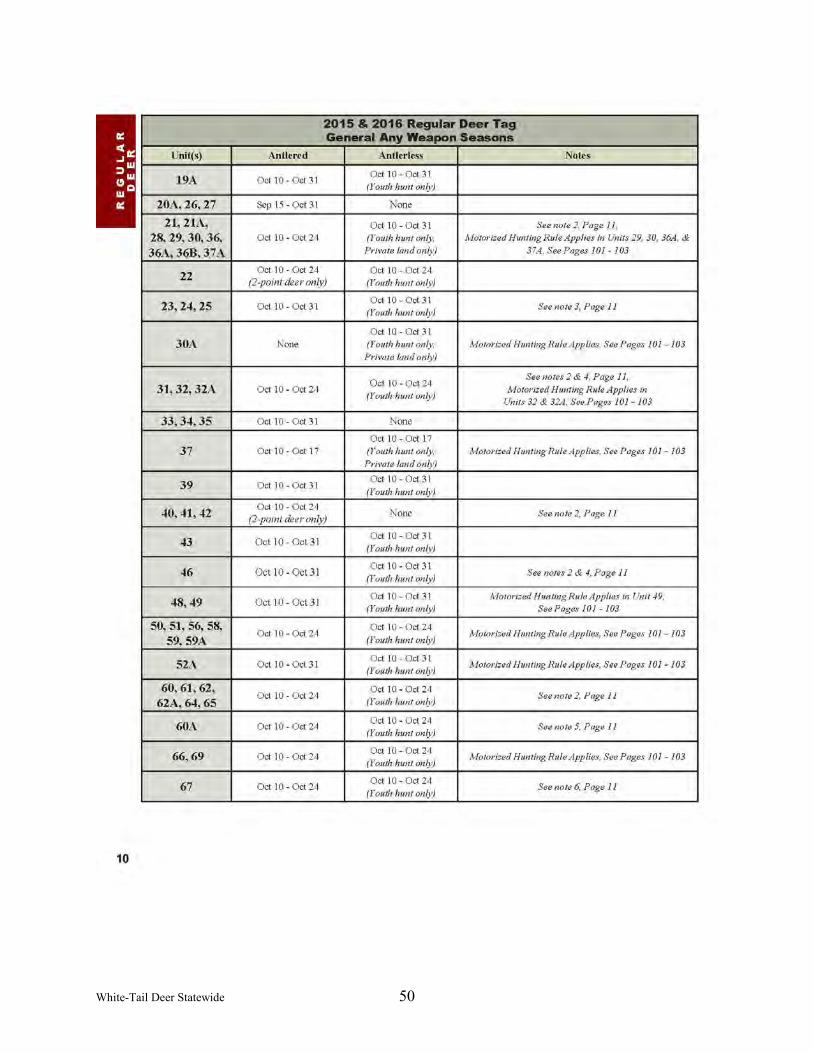
White-Tail Deer Statewide 50

White-Tail Deer Statewide 51
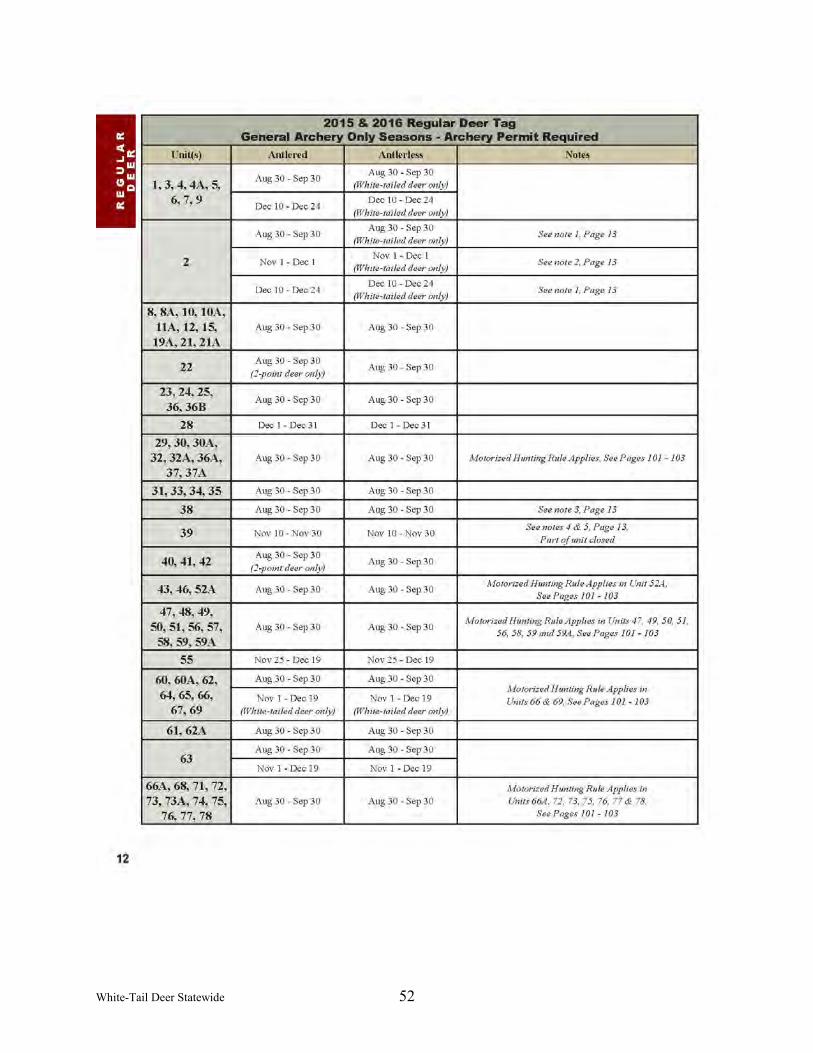
White-Tail Deer Statewide 52

White-Tail Deer Statewide 53

White-Tail Deer Statewide 54

White-Tail Deer Statewide 55

White-Tail Deer Statewide 56

White-Tail Deer Statewide 57

White-Tail Deer Statewide 58

White-Tail Deer Statewide 59

White-Tail Deer Statewide 60

White-Tail Deer Statewide 61
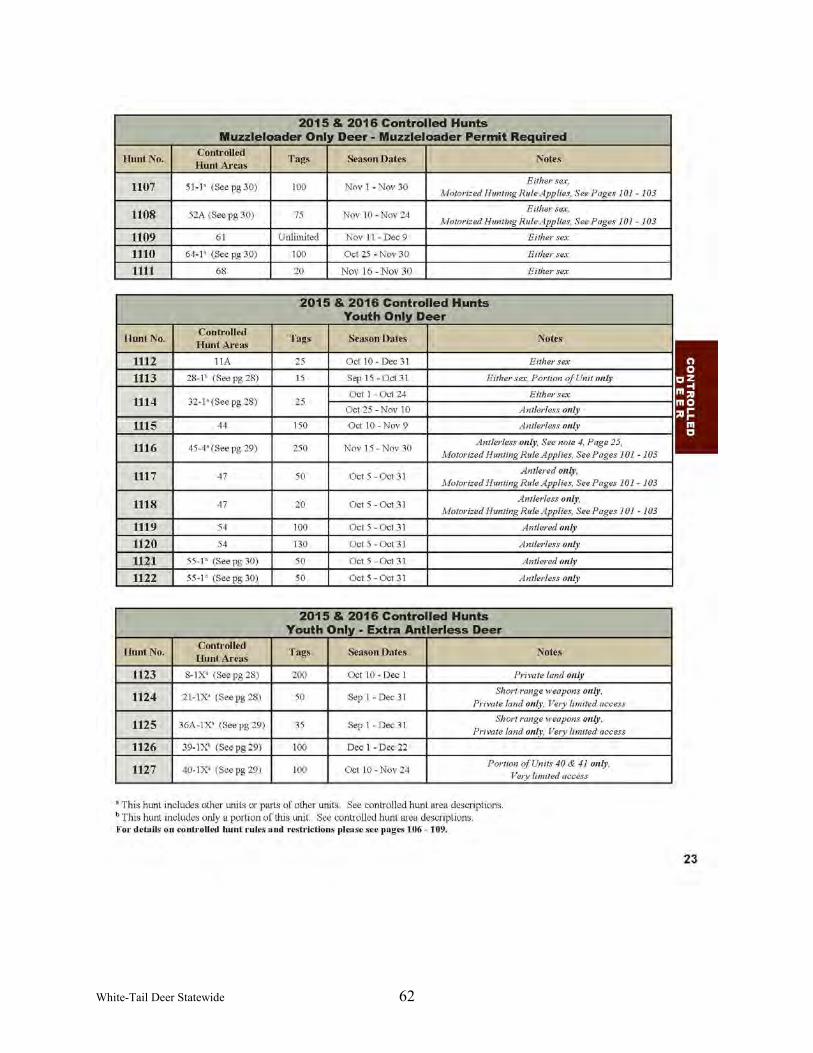
White-Tail Deer Statewide 62

White-Tail Deer Statewide 63
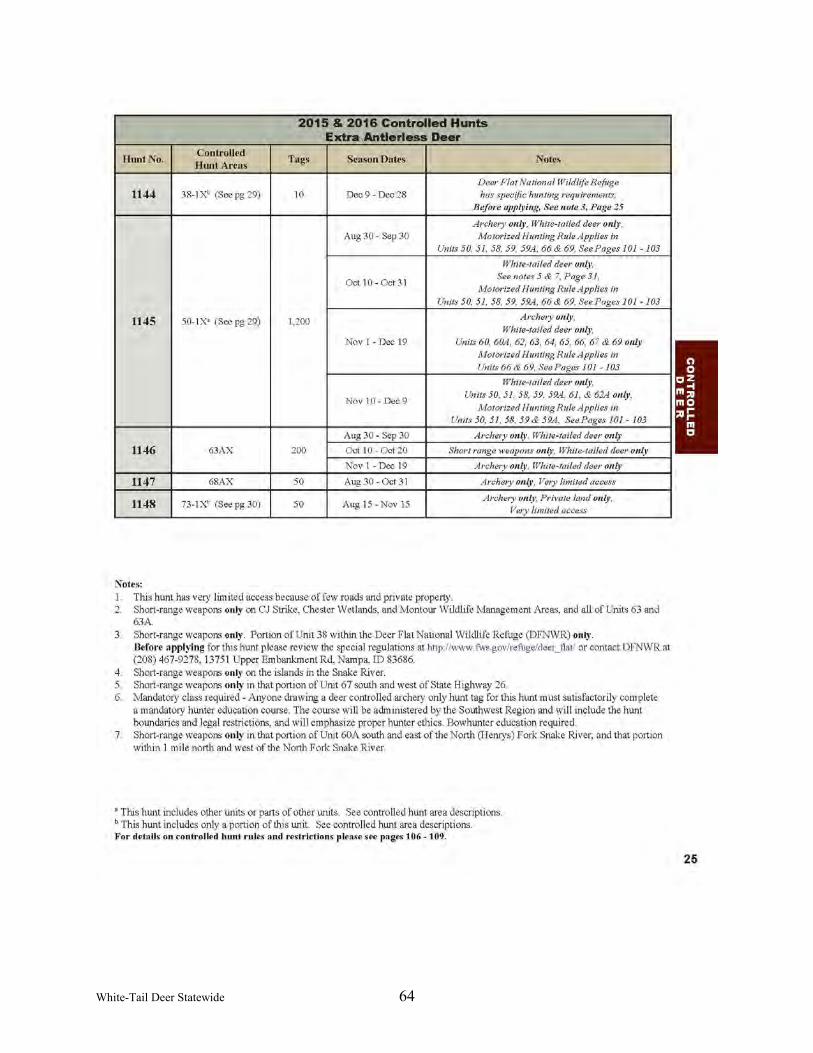
White-Tail Deer Statewide 64

White-Tail Deer Statewide 65
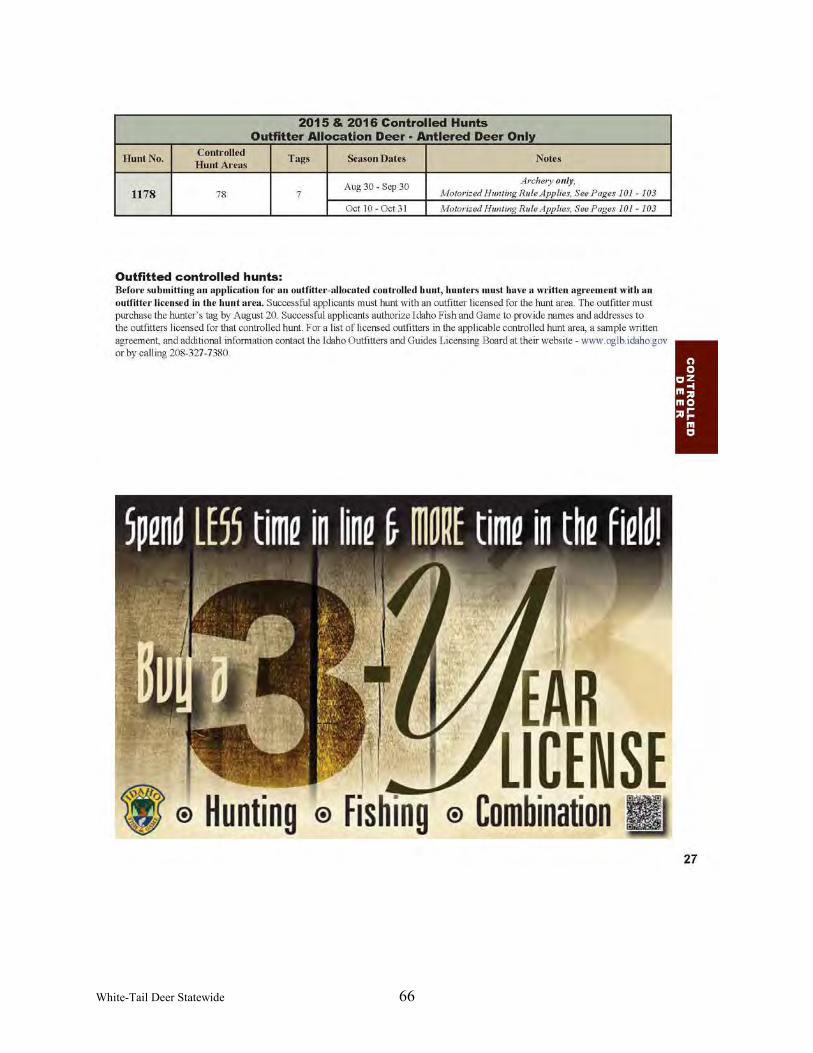
White-Tail Deer Statewide 66

White-Tail Deer Statewide 67
Submitted by: Wayne Wakkinen Clay Hickey Craig White Regional Wildlife Manager Regional Wildlife Manager Regional Wildlife Manager Regan Berkley Daryl Meints Zach Lockyer Regional Wildlife Manager Regional Wildlife Manager Regional Wildlife Manager Curtis Hendricks Greg Painter Regional Wildlife Manager Regional Wildlife Manager Approved by: IDAHO DEPARTMENT OF FISH AND GAME Brad Compton, Asst. Chief Jeff Gould, Chief Bureau of Wildlife Bureau of Wildlife