white paper wspr by joe taylor, k1jt for transmit and receive antenna comparison … ·...
TRANSCRIPT

1 | P a g e
White Paper
WSPR by Joe Taylor, K1JT
for transmit and receive antenna comparison
by Larry Plummer, W6LVP
January 10, 2017
EZNEC and other analytical tools are great for initial antenna design. Houses, metal objects, and
many other variables influence the real-world performance of any antenna. Once the general
specifications for an antenna are defined, I like to use on-air tests to measure and optimize antenna
performance. Getting objective, quantitative on-air measurement is the challenge and also the key to
useful antenna performance feedback.
Switching between two transmit antennas while counting from one to ten and then getting an on-air
report from another ham provides rough comparisons. Wouldn’t it be great if those A-B comparisons
were objective and quantitative? Good news is that there is such a tool and it is widely deployed. It
is called WSPR for Weak Signal Propagation Reporter. Although WSPR was developed by Joe
Taylor, K1JT, for propagation analysis, it turns out to be a great tool for antenna comparison. It’s just
a simple matter of repurposing WSPR for another application.
There are thousands of hams, SWLs, and other WSPR reporters worldwide with receivers waiting for
your transmitted signal. When these reporters’ receivers detect your signal, their computers running
WSJT-X software will automatically upload their received signal reports to the WSPRnet.org website
for your review and analysis. More than a half million reports are posted every day.
There is also a large number of hams (only hams because transmission requires a license) worldwide
transmitting WSPR beacon signals on every band from 2200 meters through VHF/UHF. WSPR
signals from a receiver and a computer running WSJT-X software displaying received signal quality is
a great way to evaluate receive antennas.
The key to accurate comparison of either transmit or receive antennas is simultaneous reception or
transmission. Even though WSPR beacons can be received or transmitted every two minutes, there
are too many changes possible from one test cycle to another. For receive testing, most hams
transmitting WSPR beacon signals don’t transmit every cycle so you may need to wait several
minutes to compare the received signal from the same transmitting station. During that delay,
propagation conditions will change making for inaccurate comparisons. The solution is two devices,
i.e. two transmitters/transceivers for simultaneous transmission from two antenna or two receivers for
simultaneous receive antenna comparison. Two devices are critical due rapid QSB and other signal
changes that can occur from one two minute WSPR cycle to the next. Alternating one transmitter
between two transmit antennas or alternating one receiver between two receive antennas doesn’t
provide accurate results.

2 | P a g e
Plus, I don’t know any ham that has just one rig. Any transmitter or transceiver can be used for
transmit antenna comparison particularly since power levels can be 5 watts or even much lower. You
just need to adjust the power output from the two transmitters to the same level.
Receivers are a bit more challenging because not all receivers are the same. However, there is an
easy solution to remove any differences in received signal levels due to receiver performance.
Simply run the test for a while with each antenna connected to a receiver and after a few WSPR test
cycles, reverse the antenna/receiver combinations and repeat the test. Then normalize any variation
due to receiver differences.
For either transmit or receive antenna comparison, I like to start with a simple antenna as my
reference standard – typically a half-wave dipole. For receive antenna comparison, I connect one
receiver to the dipole and a second receiver to the antenna being compared. For transmit antenna
comparison, I connect one transmitter/transceiver to the dipole and a second transmitter/transceiver
to the antenna under test.
There are a couple of options for transmitting WSPR test signals. One option is to use commercial
transceivers operating at very low power – typically less than 5 watts – getting audio modulation
signals from computers running WSJT-X software. Alternatively, custom designed WSPR
transmitters can be used to compare transmit antennas. The benefit of custom WSPR transmitters is
that they are completely self contained and don’t require a computer or any other support devices.
QRP-labs has a great yet inexpensive QRP WSPR transmitter kit. Using two of these transmitters or
any two transmitters will provide simultaneous, side-by-side comparison of the transmission capability
of any two antennas. There is another new standalone WSPR transmitter option from SOTABEAMS
in the UK called WSPRlite that not only includes a low-power WSPR transmitter but also web-based
DXplorer analysis tools for comparing the transmit received reports for two antennas.
http://www.sotabeams.co.uk/wsprlite
Regardless of the transmitters used, the only requirement is that the power output of the two
transmitters be set to the same power level.
Comparing two receive antennas is similar to transmit antenna comparison but in reverse. The audio
output from two receivers is connected to the audio input of a computer running two copies of WSJT-
X or two computers each running WSJT-X. Although more complex and beyond the scope of this
paper, it is possible to run two copies of WSJT-X on the same computer. A much easier approach is
simply to run WSJT-X on two computers and connect the received audio output of two
receivers/transceivers to the audio input of two computers. Many of the newer transceivers such as
the ICOM-7100 and 7300 have built-in digital CAT and audio interfaces. For other transceivers not
having these features, there are a number of easy to connect digital interface devices such as the
SignaLink USB that provide both audio interface between a computer and rig plus CAT for frequency
sync and PTT for transmitter control.

3 | P a g e
There is a new ARRL book called “Working the World with JT65 and JT9.” Although WSPR is a
slightly different protocol, WSPR, JT65, and JT9 are all supported by the WSJT-X program. The
book goes well beyond the scope of this white paper to provide detailed instructions on the
installation, setup, and operation of WSJT-X. With WSJT-X operating, selecting from among these
three protocols and even others is as simple as picking from a drop down menu. For anyone wanting
to use these protocols for propagation testing, antenna comparison, or just QSOs, this book is a great
resource.
A benefit of getting your rig(s) setup to work with WSJT-X is that you now can use the JT-9 and JT-65
digital protocols that are part of the WSJT-X suite. In addition, other digital software programs like
FLDIGI use very similar audio and CAT setup.
Very soon after each transmission cycle completes, you can check the received results. Each WSPR
transmission cycle starts 2 seconds after each even number minute and lasts one minute and 50
seconds. Typically, within 30 seconds after the end of each cycle, the reports of your signal are
posted and available for review. Go to http://wsprnet.org/drupal/wsprnet/spots to check for your
reports. You can optionally create a login but one is not required to view or download the signal
reports.
I set the transmit frequency in WSJT-X slightly differently for each transmitter so that the two
antennas can be differentiated. Even for reporters who don’t have precise frequency accuracy, the
spread between the two transmitters will always be the same, i.e antenna #1 is the higher frequency
reported and antenna #2 is lower.
To view your transmission comparison results, go to WSPRnet.org and enter the band, count of
reports you want to review, your call, time frame of interest, and sort. Leaving the Reporter box
empty, will show all received reports. I like to sort by Timestamp in Reverse order which shows the
most recent reports at the top of the list.

4 | P a g e
Look for the received reports from the same reporter. Notice that there is a frequency difference
between the two reports which you can correlate to a specific antenna. Sometimes reports from a
station are not next to each other so you may have to scan the list within a 2 minute time window a bit
to match up the stations.
Look at the reports near the middle of the screen for W7KVI. He hears antenna #2 (the one on the
higher frequency) better by 5 dB (+2 dB versus -3 dB S/N). You can focus on stations at different
distances or different azimuths.

5 | P a g e
Using WSPR to compare receive antennas is very similar, just in reverse. If supported by your model
transceiver, connect it to your computer running WSJT-X . If your transceiver doesn’t have direct
computer connection integrated, use a digital interface like SignaLink USB to connect your computer
to WSJT-X. One of the key features of the WSPR system is the automatic ability for WSJT-X to
upload signal reports to the WSPRnet.org website for review by you or anyone. Since during receive,
you are not transmitting, you can alter your call sign a bit to differentiate between your two antennas
being tested. I normally append a letter or two on the end of my call to identify the specific antenna
reports. In this example, I use W6LVP/A1 and W6LVP/A2 to display the received results for two
antennas.

6 | P a g e
I can either immediately see the received signal reports for the two antennas using the WSJT-X
display. Like transmit antenna comparison, I can also access the data from WSPRnet.org.
Setup for receive reports is very similar to transmit. Notice that I used my modified call to display the
results for each of the two antennas. I need to do this twice using each of the two modified calls.

7 | P a g e
For receive, WSPRnet.org reports are very useful but I normally prefer using the WSJT-X displays to
compare received signal reports.
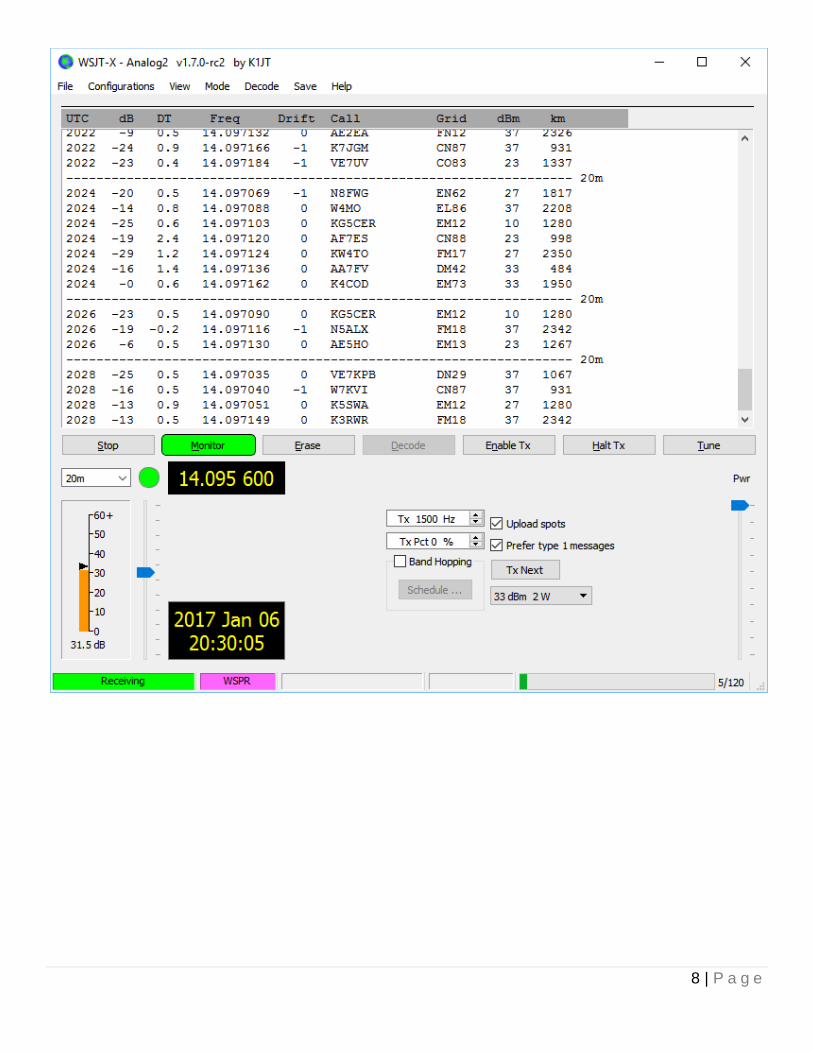
8 | P a g e

9 | P a g e
Notice the received signal report difference for just two examples at 2028 for VE7KPB and K5SWA.
For these two antennas being compared, the antenna in the first report hears VE7KPB stronger by 12
dB (-25 dB versus -13 dB S/N) but K5SWA stronger by 3 dB (-13 dB versus -10 dB S/N). The first
antenna is more directional than the second and in better line with K5SWA.
For receive antenna comparison testing, JT65 and JT9 modes can also be used. Again two receivers
and two copies of WSJT-X running on one or two computers is also required. For comparing
received signals using these modes, the WSJT-X data display works best for me. Although there
tend to be fewer stations using JT9, it has S/N dynamic range of -30 to +30 dB similar to WSPR.
JT65 reported S/N ranges from about -26 to -1 dB with all stronger signals, regardless of their actual
signal strength, reported as -1 dB S/N. Due to this compression of JT65 S/N reports, all stronger
signals should not be included.

10 | P a g e
I hope you have found this paper useful to setup and operate WSPR as a great tool for evaluating
both transmit and receive antennas.