white paper key issues scaling elk stack - sumo logic · pdf fileelk stack is short for...
TRANSCRIPT
WHITE PAPER
Key Issues Scaling ELK StackBy Vijay UpadhyayaDirector, Competitive Intelligence
Building an ELK Stack can be expensive and requires lot of time
and resources to make it production ready. This technical paper
will highlight the efforts involved in building an ELK Stack. We
will follow the journey of a DevOps engineer moving Elastic
Stack from development into the production and the challenges
faced during this migration. We will also highlight typical
efforts involved in managing and scaling ELK Stack or Elastic
stack in the production. This journey will demonstrate how
building a log management solution doesn’t always produce value and why leveraging a secure, cloud-native machine data analytics service can provide instant value by delivering the real-time insights and continuous intelligence needed to build, run and secure today’s modern applications.
WHITEPAPER | Key Issues Scaling ELK Stack
3
Journey of an engineer in creating production ready ELK StackELK Stack is a very popular open source log management tool. IT operations and security teams use ELK stack for application performance monitoring, troubleshooting, and security monitoring. ELK Stack is short for Elasticsearch, Kibana, and Logstash. These are three separate projects. In addition to ELK stack, the Elastic company has six additional products for customers with paid support. The six additional products are Alerting, Security, Monitoring, Reporting, Graph and Machine Learning (Beta).
However, this whitepaper will focus on the ELK Stack offering, considering any additional product on top of ELK stack will only add to the complexity and cost.
ELK Stack can be used for aggregating logs from your application and infrastructure. There is tremendous value in aggregating and analyzing your logs. Bringing innovative products and features faster is one of the key objectives in the new world of cloud applications. To achieve faster innovation in the data-driven digital economy, it is essential to extract value out of the machine data by aggregating and analyzing logs, metrics, and events. In this section, we will go through the hypothetical scenario and explore a day in a life of a DevOps engineer responsible for managing ELK Stack. The story is hypothetical but the learnings are based on working closely with more than 40 customers. You will be able to identify yourself in this story and even better, will be able to predict the next phase of your ELK Stack evaluation.
Stage 0: No Logging SolutionHere is how the story starts. Meet Mike our DevOps engineer. Mike is very bright and entrusted to solve some of the most complicated application and infrastructure problems for his organization. Currently, he is tasked with troubleshooting a critical issue in one of their microservices. He cannot reproduce the issue so he needs to rely on the log data from the production server captured around the same time when the issue was observed. This process is extremely reactive and took too much time to troubleshoot, identify root cause and resulting in a poor customer experience.
Summary: Extremely reactive troubleshooting process. Takes too much time to identify root cause resulting in a poor customer experience.
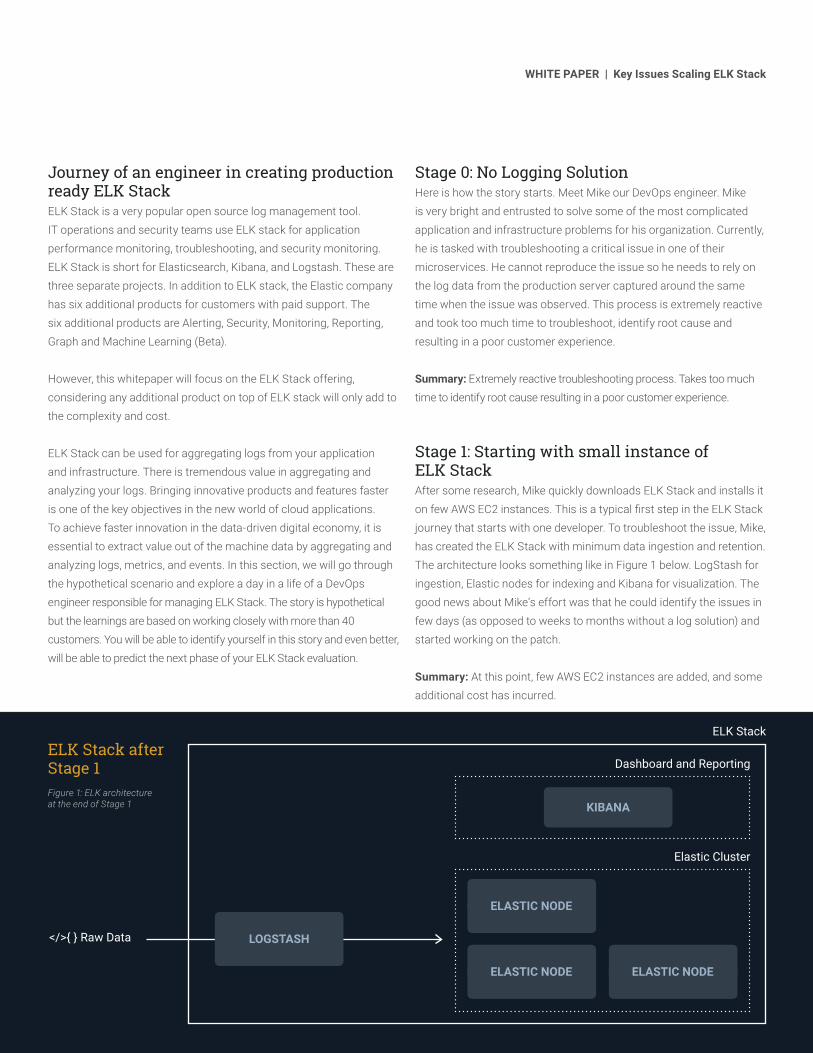
Stage 1: Starting with small instance of ELK StackAfter some research, Mike quickly downloads ELK Stack and installs it on few AWS EC2 instances. This is a typical first step in the ELK Stack journey that starts with one developer. To troubleshoot the issue, Mike, has created the ELK Stack with minimum data ingestion and retention. The architecture looks something like in Figure 1 below. LogStash for ingestion, Elastic nodes for indexing and Kibana for visualization. The good news about Mike’s effort was that he could identify the issues in few days (as opposed to weeks to months without a log solution) and started working on the patch.
Summary: At this point, few AWS EC2 instances are added, and some additional cost has incurred.
WHITE PAPER | Key Issues Scaling ELK Stack
</>{ } Raw Data
ELASTIC NODE
Elastic Cluster
Dashboard and Reporting
ELASTIC NODE ELASTIC NODE
ELK Stack
KIBANA
LOGSTASH
ELK Stack after Stage 1 Figure 1: ELK architecture at the end of Stage 1
4
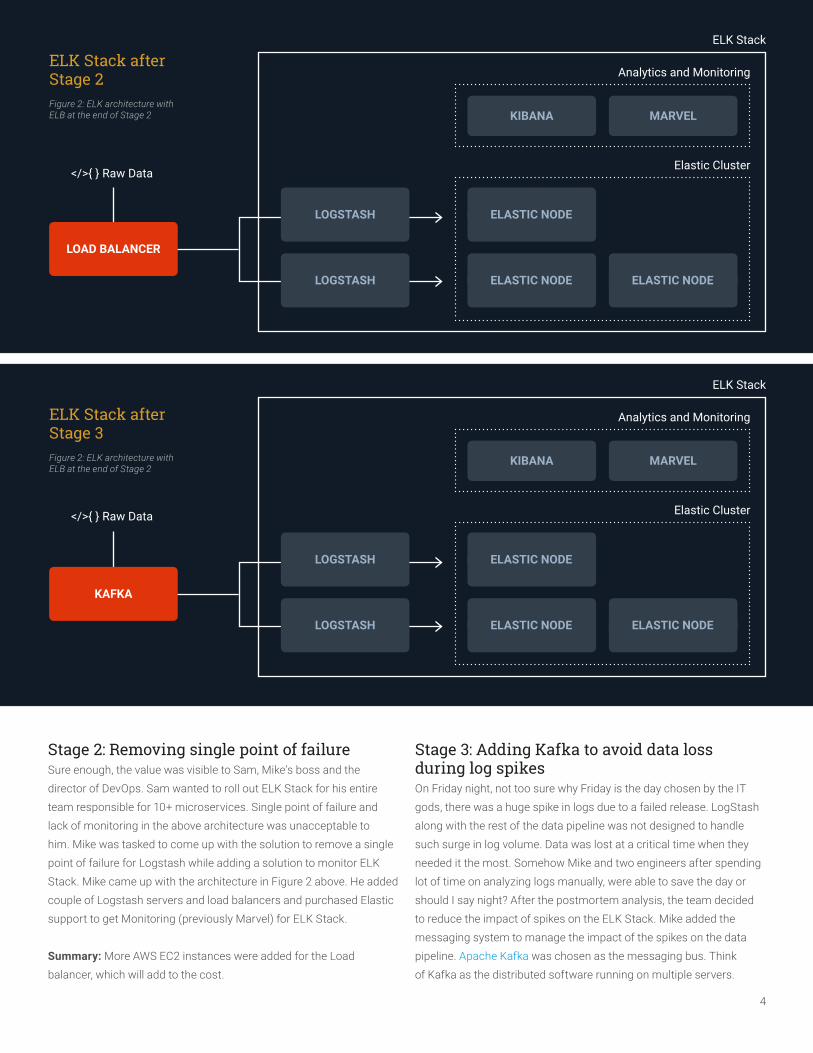
Stage 2: Removing single point of failureSure enough, the value was visible to Sam, Mike’s boss and the director of DevOps. Sam wanted to roll out ELK Stack for his entire team responsible for 10+ microservices. Single point of failure and lack of monitoring in the above architecture was unacceptable to him. Mike was tasked to come up with the solution to remove a single point of failure for Logstash while adding a solution to monitor ELK Stack. Mike came up with the architecture in Figure 2 above. He added couple of Logstash servers and load balancers and purchased Elastic support to get Monitoring (previously Marvel) for ELK Stack.
Summary: More AWS EC2 instances were added for the Load balancer, which will add to the cost.
Stage 3: Adding Kafka to avoid data loss during log spikesOn Friday night, not too sure why Friday is the day chosen by the IT gods, there was a huge spike in logs due to a failed release. LogStash along with the rest of the data pipeline was not designed to handle such surge in log volume. Data was lost at a critical time when they needed it the most. Somehow Mike and two engineers after spending lot of time on analyzing logs manually, were able to save the day or should I say night? After the postmortem analysis, the team decided to reduce the impact of spikes on the ELK Stack. Mike added the messaging system to manage the impact of the spikes on the data pipeline. Apache Kafka was chosen as the messaging bus. Think of Kafka as the distributed software running on multiple servers.
</>{ } Raw Data
ELASTIC NODE
Elastic Cluster
Analytics and Monitoring
ELASTIC NODE ELASTIC NODE
ELK Stack
KIBANA
LOGSTASH
LOGSTASH
MARVEL
LOAD BALANCER
ELK Stack after Stage 2 Figure 2: ELK architecture with ELB at the end of Stage 2
WHITE PAPER | Elk Stack vs. Sumo Logic: Building or Buying Value?
</>{ } Raw Data
ELASTIC NODE
Elastic Cluster
Analytics and Monitoring
ELASTIC NODE ELASTIC NODE
ELK Stack
KIBANA
LOGSTASH
LOGSTASH
MARVEL
KAFKA
ELK Stack after Stage 3 Figure 2: ELK architecture with ELB at the end of Stage 2
5
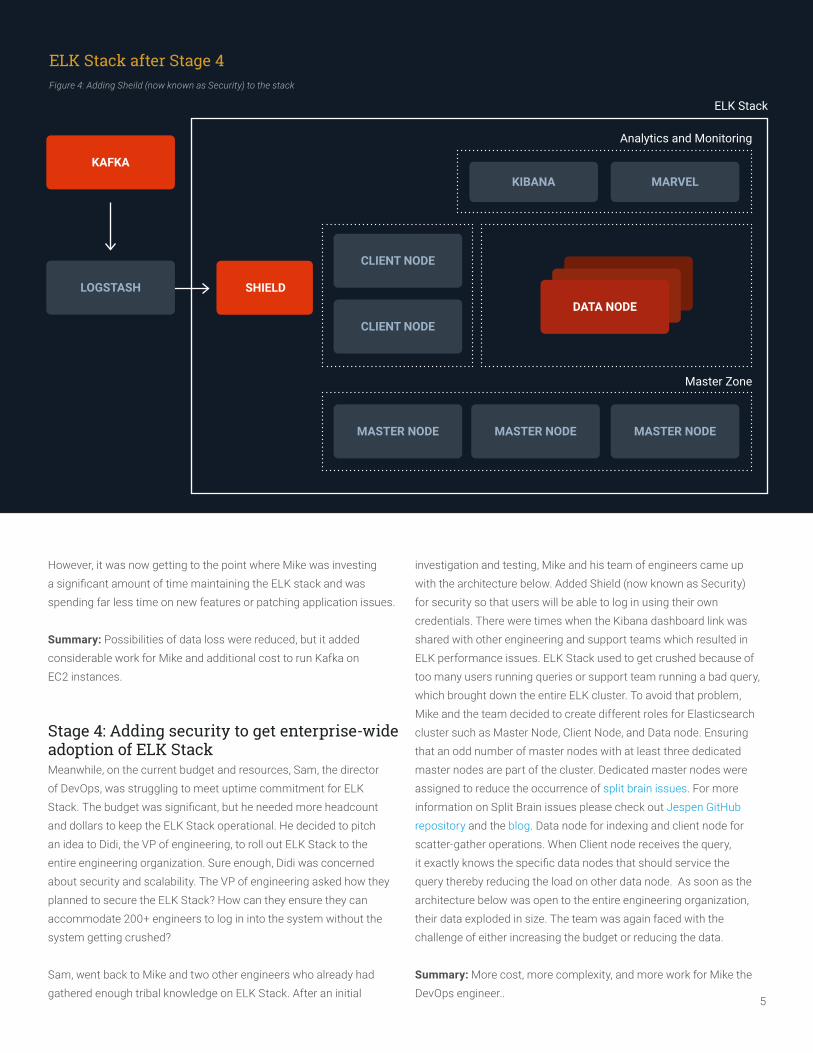
However, it was now getting to the point where Mike was investing a significant amount of time maintaining the ELK stack and was spending far less time on new features or patching application issues.
Summary: Possibilities of data loss were reduced, but it added considerable work for Mike and additional cost to run Kafka on EC2 instances.
Stage 4: Adding security to get enterprise-wide adoption of ELK StackMeanwhile, on the current budget and resources, Sam, the director of DevOps, was struggling to meet uptime commitment for ELK Stack. The budget was significant, but he needed more headcount and dollars to keep the ELK Stack operational. He decided to pitch an idea to Didi, the VP of engineering, to roll out ELK Stack to the entire engineering organization. Sure enough, Didi was concerned about security and scalability. The VP of engineering asked how they planned to secure the ELK Stack? How can they ensure they can accommodate 200+ engineers to log in into the system without the system getting crushed?
Sam, went back to Mike and two other engineers who already had gathered enough tribal knowledge on ELK Stack. After an initial
investigation and testing, Mike and his team of engineers came up with the architecture below. Added Shield (now known as Security) for security so that users will be able to log in using their own credentials. There were times when the Kibana dashboard link was shared with other engineering and support teams which resulted in ELK performance issues. ELK Stack used to get crushed because of too many users running queries or support team running a bad query, which brought down the entire ELK cluster. To avoid that problem, Mike and the team decided to create different roles for Elasticsearch cluster such as Master Node, Client Node, and Data node. Ensuring that an odd number of master nodes with at least three dedicated master nodes are part of the cluster. Dedicated master nodes were assigned to reduce the occurrence of split brain issues. For more information on Split Brain issues please check out Jespen GitHub repository and the blog. Data node for indexing and client node for scatter-gather operations. When Client node receives the query, it exactly knows the specific data nodes that should service the query thereby reducing the load on other data node. As soon as the architecture below was open to the entire engineering organization, their data exploded in size. The team was again faced with the challenge of either increasing the budget or reducing the data.
Summary: More cost, more complexity, and more work for Mike the DevOps engineer..
WHITE PAPER | Elk Stack vs. Sumo Logic: Building or Buying Value?WHITE PAPER | Elk Stack vs. Sumo Logic: Building or Buying Value?
Analytics and Monitoring
ELK Stack
KIBANA
CLIENT NODE
CLIENT NODE
MARVEL
LOGSTASH
KAFKA
MASTER NODE MASTER NODE MASTER NODE
DATA NODESHIELD
Master Zone
ELK Stack after Stage 4 Figure 4: Adding Sheild (now known as Security) to the stack
6
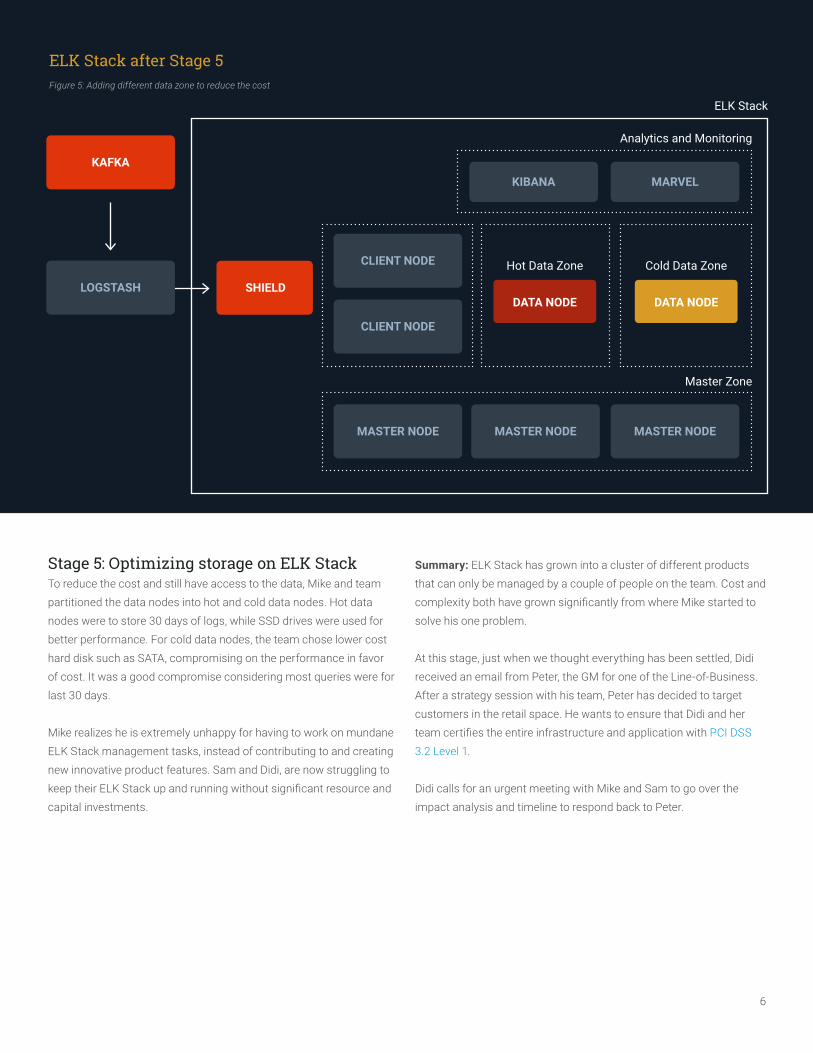
Stage 5: Optimizing storage on ELK StackTo reduce the cost and still have access to the data, Mike and team partitioned the data nodes into hot and cold data nodes. Hot data nodes were to store 30 days of logs, while SSD drives were used for better performance. For cold data nodes, the team chose lower cost hard disk such as SATA, compromising on the performance in favor of cost. It was a good compromise considering most queries were for last 30 days.
Mike realizes he is extremely unhappy for having to work on mundane ELK Stack management tasks, instead of contributing to and creating new innovative product features. Sam and Didi, are now struggling to keep their ELK Stack up and running without significant resource and capital investments.
Summary: ELK Stack has grown into a cluster of different products that can only be managed by a couple of people on the team. Cost and complexity both have grown significantly from where Mike started to solve his one problem.
At this stage, just when we thought everything has been settled, Didi received an email from Peter, the GM for one of the Line-of-Business. After a strategy session with his team, Peter has decided to target customers in the retail space. He wants to ensure that Didi and her team certifies the entire infrastructure and application with PCI DSS 3.2 Level 1.
Didi calls for an urgent meeting with Mike and Sam to go over the impact analysis and timeline to respond back to Peter.
WHITE PAPER | Elk Stack vs. Sumo Logic: Building or Buying Value?WHITE PAPER | Elk Stack vs. Sumo Logic: Building or Buying Value?
Analytics and Monitoring
ELK Stack
KIBANA
CLIENT NODE
CLIENT NODE
MARVEL
LOGSTASH
KAFKA
MASTER NODE MASTER NODE MASTER NODE
SHIELD
Master Zone
ELK Stack after Stage 5Figure 5: Adding different data zone to reduce the cost
DATA NODE
Hot Data Zone
DATA NODE
Cold Data Zone
7
Toll-Free: 1.855.LOG.SUMO | Int’l: 1.650.810.8700305 Main Street, Redwood City, CA 94603
www.sumologic.com
© Copyright 2017 Sumo Logic, Inc. All rights reserved. Sumo Logic, Elastic Log Processing,
LogReduce, Push Analytics and Big Data for Real-Time IT are trademarks of Sumo Logic, Inc.
All other company and product names mentioned herein may be trademarks of their respective
owners. WP-0517. Updated 05/17
0 0.5 1 1.5 2 2.5 3 3.5 4
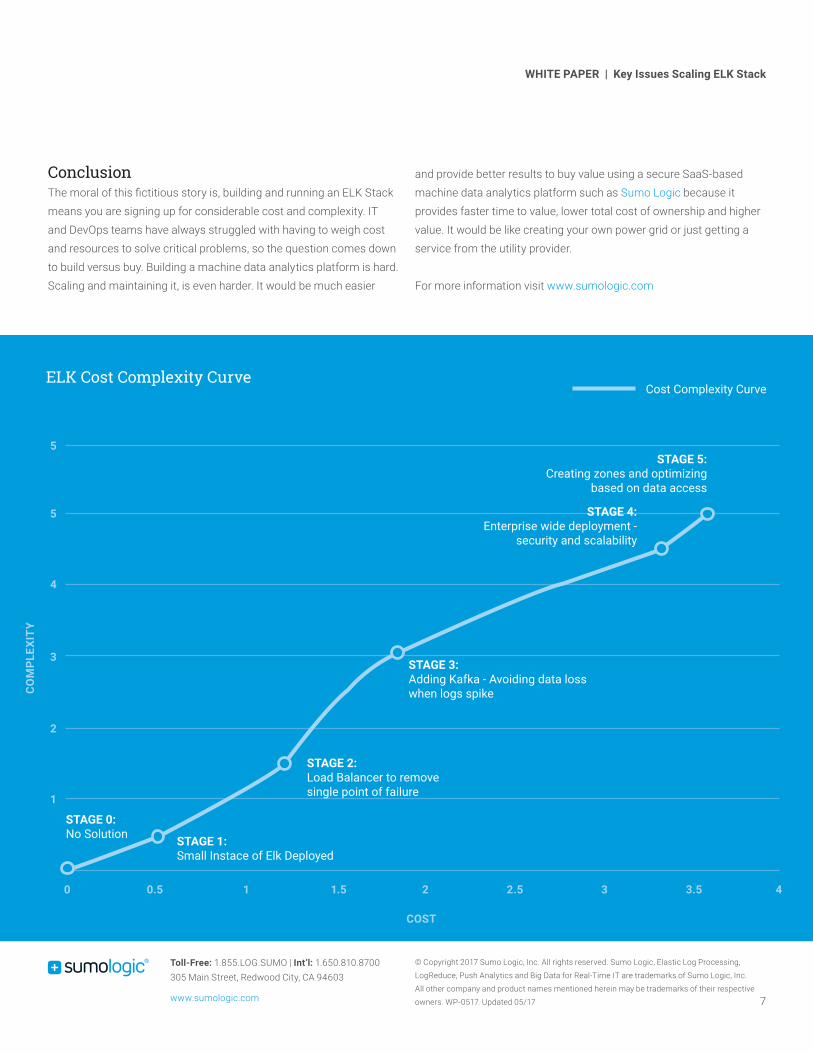
STAGE 1: Small Instace of Elk Deployed
1
2
3
4
5
5
STAGE 2: Load Balancer to remove single point of failure
STAGE 0:No Solution
STAGE 3: Adding Kafka - Avoiding data loss when logs spike
STAGE 4: Enterprise wide deployment -
security and scalability
STAGE 5: Creating zones and optimizing
based on data access
COST
CO
MPL
EXIT
Y
Cost Complexity CurveELK Cost Complexity Curve
WHITE PAPER | Key Issues Scaling ELK Stack
ConclusionThe moral of this fictitious story is, building and running an ELK Stack means you are signing up for considerable cost and complexity. IT and DevOps teams have always struggled with having to weigh cost and resources to solve critical problems, so the question comes down to build versus buy. Building a machine data analytics platform is hard. Scaling and maintaining it, is even harder. It would be much easier
and provide better results to buy value using a secure SaaS-based machine data analytics platform such as Sumo Logic because it provides faster time to value, lower total cost of ownership and higher value. It would be like creating your own power grid or just getting a service from the utility provider.
For more information visit www.sumologic.com