which fuel cs1 turkey - sails project ·...
TRANSCRIPT

SAILS UNIT 1
4.1 Case study 1 (CS1 Turkey) Concept focus Heat of combustion of fuels
The meaning of “best” can change depending on context Activities implemented Activities A-‐D Inquiry skills Developing hypotheses
Planning investigations Working collaboratively
Scientific reasoning and literacy Scientific reasoning (collection of scientific data) Scientific literacy (analysis and interpretation of scientific data)
Assessment methods Classroom dialogue Teacher observation Peer-‐assessment Worksheets
Student group Grade: Pre-‐service science teachers, upper second level Age: 17-‐18 years Group composition: mixed ability and gender (22 students; 4-‐5 male students) Prior experience with inquiry: Students had some prior experience with inquiry. The teacher had some experience of teaching through inquiry
In this implementation with pre-‐service teachers, ages 17-‐18 years, a six-‐phase “research cycle” was used to guide the inquiry process – ask questions, develop hypothesis, plan investigations, carry out experiment, interpret results and discuss/reflect on outcomes. Developing hypotheses and planning investigations were assessed during the lesson, through classroom dialogue. Scientific reasoning and literacy (collection and evaluation of results, interpretation of data) and working collaboratively were assessed at the end of this activity by evaluating students’ worksheets.
(i) How was the learning sequence adapted? The Which is the best fuel? SAILS unit was implemented with 22 first-‐year pre-‐service science teachers (around 17-‐18 years of age) working in groups over a double lesson period lasting 90 minutes (two 45 minute lessons). At the beginning of the lesson, the teacher explained how the students would do an experiment. Then the teacher asked some questions related to their prior knowledge about fuels. For example, “What comes to your mind about when you hear “best” fuel? What do you think is the definition of “best”? Why did we change our main fuel from coal to natural gas?” These questions were used for students’ motivation about the activity because it helped them to recognise what they already knew and be ready to develop this understanding. Students were only focused on the amount of energy produced and economical issues in their answer. When students provided an answer to the teacher’s questions, the teacher gave feedback that elaborated on the inquiry process such as “most of you mentioned that amount of energy is important factor to decide which fuel is the best. Why don’t we use chemical energy in Turkey?” After the discussion with the class, the teacher explained that they had ethyl alcohol and methyl alcohol and they were to investigate the following research question: “Which fuel is the best?” A worksheet was given to students, to help structure their approach to the investigation (Figure 1). This activity was applied in a general chemistry laboratory lesson and all lessons were conducted using teacher-‐allocated students’ groups. The laboratory teams were allocated at the start of the school years – some of the groups were mixed gender, while some of them had only girls because there are only 4 or 5 boys in the class. These were formed at the beginning of the semester, and consisted of mixed ability students. All students read the worksheet and completed it on their own,

2 SAILS UNIT
and then they carried out the experimental process in groups of 4-‐6 students. At the end of the lesson, each groups’ results were written on the board and a whole group discussion followed.
Figure 1: Student worksheet for CS1 Turkey
As detailed in Figure 1, the students used six different steps in this research cycle:
1. Writing a research question, 2. Formulating a hypothesis, 3. Planning the investigation/experiment, 4. Conducting the experiment (Figure 2), and evaluating results, 5. Interpreting the data/generate knowledge, 6. Discussing the results, presenting the results/refection.
Figure 2: Carrying out the investigation
(ii) Which skills were to be assessed? Developing hypotheses and planning investigations were assessed during the lesson, while the teacher talked to each group. Scientific reasoning (collection of data), scientific literacy (evaluation of
Which%is%the%best%fuel?%Names:% % % % ,%% % % % ,"% % % % %!Research%cycle:%
!
1.!! Ask!a!question!about!the!phenomenon!
.................................................................................................................................!
.................................................................................................................................!
2.!! Formulate!a!hypothesis.!
1).....................................................................................................................!
2).....................................................................................................................!! !
3.!! Plan!the!experiment.!
What%experiments%do%you%want%to%conduct%in%order%to%prove%your%hypothesis%and%convince%others%that%it%is%true?%".................................................................................................................................!
.................................................................................................................................!
.................................................................................................................................!
.................................................................................................................................!
.................................................................................................................................!
4.!! Conduct!the!experiment!–!collect!data.!
Conduct%the%experiment%exactly%as%you%planned%it%and%carefully%note%down%your%observations.%.................................................................................................................................!
.................................................................................................................................!
.................................................................................................................................!
.................................................................................................................................!
5.!! Analyse!and!reflect!upon!the!data.!
Does%your%data%support%the%hypothesis?%Have%you%proven%the%hypothesis?%".................................................................................................................................!
.................................................................................................................................!
.................................................................................................................................!
.................................................................................................................................!
6.!! Discuss,!present!and!reflect.!
How%will%you%present%your%experiment?%Who%will%present%what?%Which%data%and%conclusions%are%suitable%for%the%plenary%discussion?%What%can%be%improved%upon%the%next%time%you%work%through%the%research%cycle?%%
.................................................................................................................................!
.................................................................................................................................!
.................................................................................................................................!
.................................................................................................................................!
SAILS UNIT 3
results, interpretation of data) and working collaboratively were assessed mainly at the end of this activity by looking at the students’ worksheets. The teacher used the checklist from the original unit to assess some key objectives and students’ inquiry skills (Table 1). The teacher did not explain criteria of assessment further. Each group read their hypotheses and investigation plan to the class. These were preliminary working and did not have much detail. The teacher wanted to check which groups would have managed the whole process without teacher intervention. The teacher evaluated all hypotheses and plans in terms of being feasible or investigable during the lesson and gave feedback about those plans so they could be changed before conducting the investigation. Students developed or reshaped their hypotheses and plans after the teacher’s verbal feedback. For instance, students in one group had not considered which factors could be variables and which factor must be constant. To encourage them to consider this, the teacher asked a question, “Which factors will you change while you are working in your research process?” If a plan did not clearly identify evidence to be collected, the teacher asked, “What data will you collect?” The question influenced some groups’ plans because they had not considered this previously. The teacher did not continue in the same way for other research stages. During the investigation phase, the teacher acted as if he were a group member, not an instructor. The teacher observed students’ skill in working collaboratively as they worked with their peers. The checklist was used at the group level (not for every student) and if the teacher observed a problem or conflict about the research cycle, he gave feedback or some clues so that the students could reflect on their research as they were working. At the end of the lesson, the teacher wrote all the experimental results on the board for further discussion with all students. Then the teacher explained to the class why all group results were different from each other. This explanation was related to experimental errors that were formed in measurement, calculations, amount of substances, etc.
(iii) Criteria for judging assessment data Inquiry skills that were targeted in this activity were measured by evaluating the student responses written on the worksheet. The teacher used the checklist for assessment of targeted inquiry skills (Table 1). This checklist identifies three performance levels – poor/NA, needs improvement and acceptable – for each objective. However, this dimension does not provide detailed criteria for each achievement point. The teacher filled in the checklist after students answered questions and gave feedback to the students according to objectives in the checklist (e.g. “your conclusions don’t explain your hypothesis,” “yours group did not work like a team,” “if you defined variables well, you would be more successful”). The teacher used a formative assessment approach when observing the students working in the session and asked them questions during the developing hypotheses and planning investigations stages to help form their final assessment judgment. At the end of the lesson, the teacher collected all the student’s worksheets with their hypothesis and plans and evaluated their written work using the checklist. At this stage the checklist was used as a summative assessment tools and a record of student attainment. These students’ worksheets have an important role as they show their investigation process and show their understanding. Worksheets were used to both observe what the students were thinking and as a way to give guidance to the students during the activity by teacher. The teachers wrote the group’s results on the blackboard and the whole class critiqued each other’s results. The teacher used peer-‐assessment by giving other students a chance to evaluate their peers’

4 SAILS UNIT
results. This evaluation process was not based on any criteria and they only evaluated which groups’ results were more accurate.
Figure 3: Students results presented on the board for peer-‐assessment.
Table 1: Checklist used to evaluate skills in the Which is the best fuel? SAILS unit
Objectives Acceptable Needs improvement Poor/NA
1. Formulate a hypothesis
2. Design and conduct an experiment
3. Identify and define variables operationally
4. Collect meaningful data, organise, analyse data accurately and precisely and draw appropriate conclusions
5. Explain any unexpected results
6. Support conclusions, using reasoned arguments and evidence
7. Collaborate with others to work towards common goals
8. Report and discuss results, get feedback and deal positively with with praise, setbacks and criticism
(iv) Evidence collected Teacher’s opinion
At the beginning of the activity, the hypotheses formulated by students were not appropriate because they were not testable in the laboratory. When the teacher recognised this problem, the teacher then asked the students to reconsider their hypotheses with a view to actually testing it out at a later stage. As a class they discussed all hypotheses formed within the groups. Afterwards students redesigned their investigation to test their hypotheses. Not all the groups measured the starting weight of the container at the beginning of their investigation processes. This is an important point because at the end of the inquiry activity they had to do some mathematical calculations to find out the heat of combustion. Some follow-‐up questions were used by the teacher to direct the students and help them reconsider their plans. In general the students had difficulties formulating hypotheses that could be investigated and interpreting the collected data during the activity. The teacher had expected students to generate appropriate hypotheses and also to add different criteria to decide on the best fuel, such as “hottest flame” or “easiest to use.”
The best fuel 1/2 3 4 5 methyl-‐alcohol
CH3OH 27980J 178.92J 28400J 3.04kJ
ethyl alcohol
C2H5OH 26980J 164.72J 14200J 1.589kJ

SAILS UNIT 5
Figure 4: Students engaged in the inquiry activities
Observer notes
At the beginning of the activity the teacher used prompts and questions/preparation questions and because of that the quality of discussion was enhanced. Here are some sample questions that were used by the teacher: “What comes to your mind about when you hear “best” fuel? Why do you think that is the best fuel? You said, eco-‐friendly and cost are main criteria to evaluate the best fuel – is it really, or we should use these criteria to evaluate quality of fuel? Which evidence do you use for demonstrating your results?” This process of teacher questioning was helpful and dynamic and it helped shaped students’ reflections. Due to the teacher’s appropriate feedback, students developed testable hypotheses and designed an experiment to address the hypotheses. The teacher used some referential questions to make the students think about their process, for instance: “Is it testable or not? What was your motivation while you were planning? Would your evidence explain your hypothesis if you finished your research?” The teacher did not give answers to these questions. At the beginning of the activity the diagnostic questions used by the teacher and the feedback given was used very effectively. Some students had difficulties in formulating hypotheses that were investigable within the lab setting. The teacher soon realised this situation and asked all groups to reread their hypotheses to check they could be tested. Then the teacher gave feedback on students’ hypotheses to help them recognise their problems. Thus students formulated some new hypotheses that were more testable than previous ones. The teacher mainly used formative assessment to encourage students to reconsider their plans and improve these during the lesson. Some student groups were not successful, because they could not produce an appropriate plan that would help them to investigate their hypothesis. However the teacher was able to ask questions to guide them towards a more successful planning approach. An example of such questioning is, “How do you calculate the total heat from the fuel?” Most of the groups correctly calculated enthalpy for each fuel at the end of the experiment. Thus they had some quantitative results to help them decide which was the best fuel. Sample student artefacts
At the start of the lesson, the students were given the research cycle worksheet, which details the six steps in the inquiry process (Figure 1). The first step in this cycle – the inquiry question – was provided by the teacher, thus the first task that the students addressed was point 2 – developing hypotheses.
6 SAILS UNIT
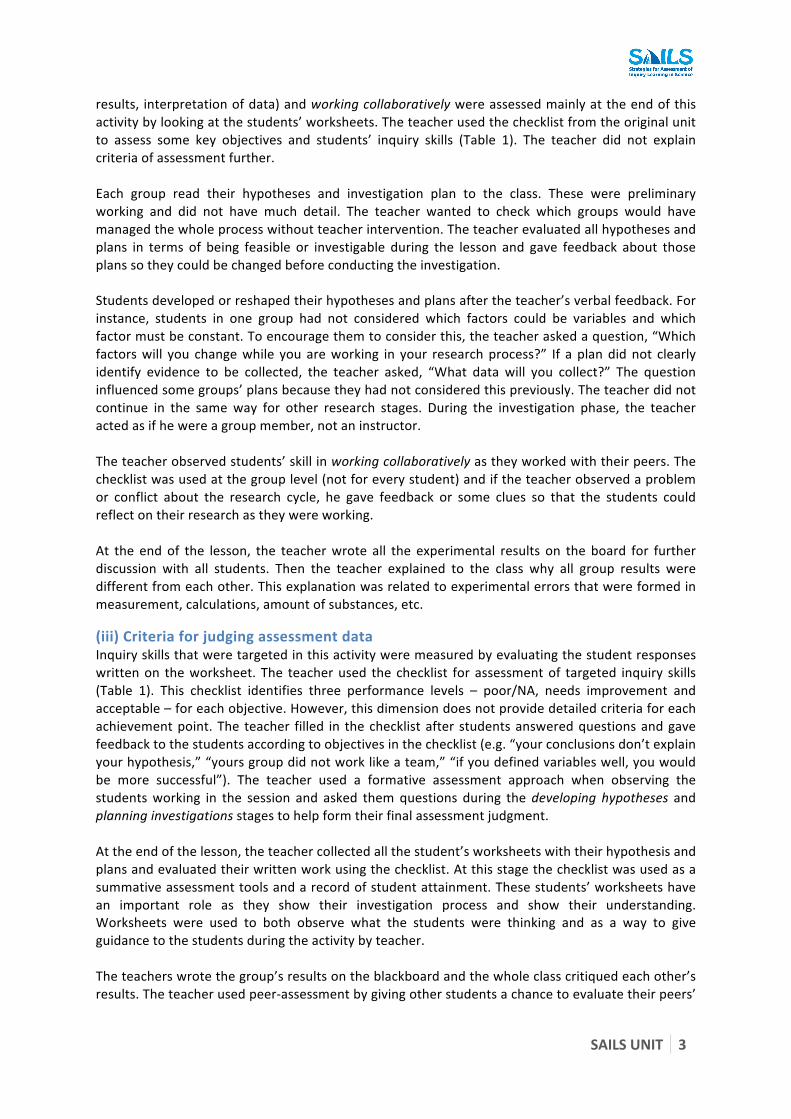
Formulating a hypothesis Some of the groups formulated just one main hypothesis but some groups formulated a main and an alternative hypothesis. The hypothesis shown in Figure 5 is testable in the lab and is a good example of an appropriate hypothesis.
Figure 5: Developing hypotheses, example 1.
For the example shown in Figure 6, the group formulated two hypotheses, but the first hypothesis was not appropriate. As it could not be tested in the lab, they were not able to write a plan for the investigation. However, their other hypothesis is a good one because it can be tested in the lab and a plan can be written for this investigation.
Figure 6: Developing hypotheses, example 2.
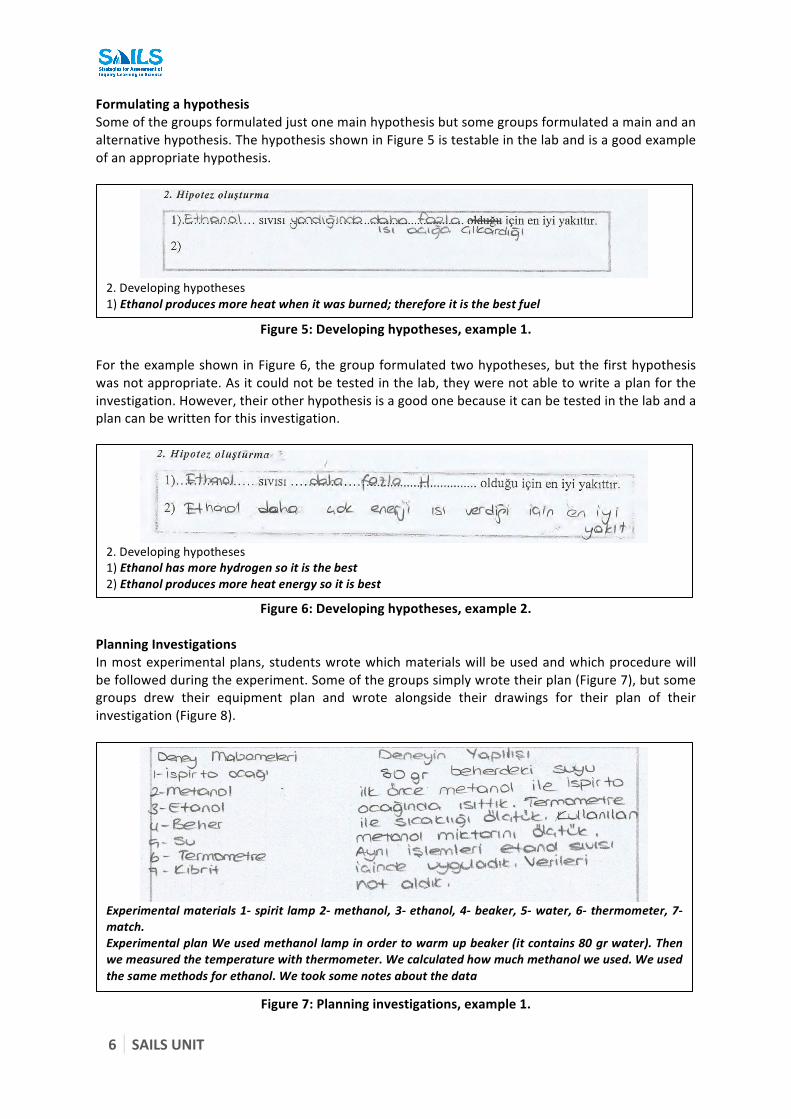
Planning Investigations In most experimental plans, students wrote which materials will be used and which procedure will be followed during the experiment. Some of the groups simply wrote their plan (Figure 7), but some groups drew their equipment plan and wrote alongside their drawings for their plan of their investigation (Figure 8).
Figure 7: Planning investigations, example 1.
2. Developing hypotheses 1) Ethanol produces more heat when it was burned; therefore it is the best fuel
2. Developing hypotheses 1) Ethanol has more hydrogen so it is the best 2) Ethanol produces more heat energy so it is best
Experimental materials 1-‐ spirit lamp 2-‐ methanol, 3-‐ ethanol, 4-‐ beaker, 5-‐ water, 6-‐ thermometer, 7-‐ match. Experimental plan We used methanol lamp in order to warm up beaker (it contains 80 gr water). Then we measured the temperature with thermometer. We calculated how much methanol we used. We used the same methods for ethanol. We took some notes about the data

SAILS UNIT 7
Figure 8: Planning investigations, example 2.
Collecting data and recording observations (scientific reasoning) In this part, students were asked to record their observations while they conducted their experiments as planned. Some of the groups wrote about their experimental process. In the example shown in Figure 9, students used qualitative detail to explain the experimental process using a narrative.
Figure 9: Collecting data and recording observations, example 1.
In the second example for conducting the experiment, the students used mathematical explanation to describe their experimental process (Figure 10). This example is not a good way to show experimental process. The students only focused on showing their data for this stage and they did not provide any explanations.
Diagrams show spirit lamp, water, thermometer and choice of fuel. After we measure ethyl alcohol and methyl alcohol, set up the apparatus as shown in the picture. After that, we heat it up for 3 minutes and then the firebox is turned off. We record the temperature at the end of the process. Finally alcohol is measured.
First we measured the quantity of methyl alcohol (16.75). Then we accurately measured 20 ml of water into a beaker and we started to boil the water by burning the methyl alcohol. After 2 minutes, we measured the temperature of the water. The temperature was 6.4 °C. After that we measured the amount of the methyl alcohol. It was 16.70 g. We measured the amount of ethyl alcohol. It was 12.10 g. We burned the ethyl alcohol and filled water into the beaker and then we started to boil. After 2 minutes, we measured the water temperature that was 5.8 °C. We measured the ethyl alcohol quantity that was 12.05 g.

8 SAILS UNIT
Figure 10: Collecting data and recording observations, example 2.
The analysis of data and reflection (scientific literacy) In this stage the teacher asked students following questions: “Does your data support the hypothesis you formulated in step 2? Did the data support your hypothesis?” Groups compared their results and hypotheses. Figure 11 shows a good example of how the data has been used to answer the question using their stated criteria for what “best” means.
Figure 11: Interpretation and analysis of results
Beginning Result Methanol liquid 338 g à 30 °C, 80 g waterà heated 2.20 min 336 g methanolà 41 °C Ethanol liquid 289 g à 30 °C, 80 g waterà heated 2.20 min 288 g ethanolà 42 °C Methanol liquid Q = m.cwater.Δt cwater= 1.42 J/g.°C
Q = 80 x 1.42 x 11 Q = 1249.6 J (for 2 g)
For 1 g: 624.8 J
Ethanol liquid Q = m.cwater.Δt Q = 80 x 1.42 x 12 Q = 1363.2 J (for 1 g)
For 1 g: 1363.2 J
If you use 1 g methanol, you acquire 624.8 J energy and when you use the same amount of ethanol acquire 1363.2 J. So our hypothesis was confirmed by data. As a result ethanol is the best.