which form of venture capital is most supportive …ftp.zew.de/pub/zew-docs/dp/dp12018.pdfal. (2011)...
TRANSCRIPT
Dis cus si on Paper No. 12-018
Which Form of Venture Capital is Most Supportive of Innovation?
Fabio Bertoni and Tereza Tykvová

Dis cus si on Paper No. 12-018
Which Form of Venture Capital is Most Supportive of Innovation?
Fabio Bertoni and Tereza Tykvová
Download this ZEW Discussion Paper from our ftp server:
http://ftp.zew.de/pub/zew-docs/dp/dp12018.pdf
Die Dis cus si on Pape rs die nen einer mög lichst schnel len Ver brei tung von neue ren For schungs arbei ten des ZEW. Die Bei trä ge lie gen in allei ni ger Ver ant wor tung
der Auto ren und stel len nicht not wen di ger wei se die Mei nung des ZEW dar.
Dis cus si on Papers are inten ded to make results of ZEW research prompt ly avai la ble to other eco no mists in order to encou ra ge dis cus si on and sug gesti ons for revi si ons. The aut hors are sole ly
respon si ble for the con tents which do not neces sa ri ly repre sent the opi ni on of the ZEW.

Non-technical summary
There is a substantial body of literature on the extent to which firms that receive venture
capital financing generate more innovation than non-venture-backed companies. Most studies
find that, on average, venture capital leads to increased innovation. However, this average
impact is likely to be the result of the aggregation of very diverse cases. Venture capital
investors are different from one another, and their deals may be based on different transaction
structures. Both the characteristics of the investor and the structure of the deal are likely to
moderate the relationship between venture capital financing and innovation. This paper is an
attempt to shed light on this issue.
First, we distinguish between two fundamentally different types of investors: governmental
and private venture capitalists. These two types of investors have different objectives, skills,
and investment horizons. Second, we differentiate between two transaction structures:
syndicated and stand-alone deals. We further distinguish between syndicated deals led by
private investors and those led by governmental investors, and between syndicated deals that
are homogeneous (i.e., composed of investors of the same type) and those that are
heterogeneous (i.e., composed of both private and governmental investors).
By combining existing theories with empirical evidence on venture capital, we expect (i)
firms backed by private investors to outperform firms backed by governmental investors, (ii)
firms backed by a syndicate to outperform firms backed by a stand-alone investor and (iii)
firms backed by a heterogeneous syndicate to outperform firms backed by a homogeneous
syndicate. We hypothesize that private-led heterogeneous syndicates should be the form of
venture capital that is most effective at promoting innovation in portfolio companies.
We perform an empirical analysis on a sample of 865 young biotech and pharmaceutical
companies from seven European countries and measure innovation output based on each
firm’s patent stock. Our results, which are robust to alternative measures of patent stock,
alternative econometric specifications and other alterations, confirm our hypotheses as
follows: companies financed by syndicates and by private venture capital investors have a
greater increase in innovation output than comparable non-venture-backed companies, and the
form most supportive of innovation is a heterogeneous syndicate led by a private investor.

Das Wichtigste in Kürze
Eine breite Literatur untersucht, ob Venture-Capital-finanzierte Unternehmen im Vergleich zu
Unternehmen ohne Venture-Capital-Finanzierung innovativer sind. Ein Großteil der Studien
kommt zu dem Ergebnis, dass Venture Capital Innovationen fördert. Es gibt jedoch
unterschiedliche Typen von Venture-Capital-Investoren, deren Finanzierungen divergierende
Strukturen aufweisen. Sowohl Investorentypen als auch Finanzierungstrukturen bedingen die
Beziehung zwischen Venture-Capital-Finanzierung und Innovation. Die vorliegende Studie
soll diesen Umstand genauer untersuchen.
Zunächst wird zwischen zwei unterschiedlichen Investorentypen unterschieden: zwischen
öffentlichen und privaten Venture-Capital-Investoren. Sie haben verschiedene Ziele,
verschiedene Fähigkeiten und Investitionshorizonte. Darüber hinaus wird zwischen zwei
Finanzierungsstrukturen, der syndizierten und der alleinigen Finanzierung, unterschieden. Bei
syndizierter Venture-Capital-Finanzierung wird nicht nur differenziert, ob das Syndikat von
einem privaten oder öffentlichen Investor angeführt wird. Es wird außerdem zwischen
homogenen (bestehend aus Investoren des gleichen Typs) und heterogenen (bestehend aus
öffentlichen und privaten Investoren) Syndikaten unterschieden.
Ausgehend von bestehenden Theorien wird erwartet, dass (i) von privaten Investoren
finanzierte Unternehmen innovativer sind als von öffentlichen Investoren finanzierte
Unternehmen, (ii) von einem Syndikat finanzierte Unternehmen innovativer sind als von
alleinigen Investoren finanzierte Unternehmen und, dass (iii) von einem heterogenen Syndikat
finanzierte Unternehmen innovativer sind als Unternehmen, die von einem homogenen
Syndikat finanziert werden. Dies führt zu der Hypothese, dass heterogene Syndikate, die von
einem privaten Venture-Capital-Investor angeführt werden, die effektivste Art von Venture
Capital in Innovationsförderung ist.
Um dies zu untersuchen, wird das Innovations-Output von 865 jungen Biotechnologie- und
Pharmaunternehmen aus sieben europäischen Ländern untersucht. Ihr Innovations-Output
wird anhand ihrer angemeldeten Patente gemessen. Die Ergebnisse bestätigen, dass
Unternehmen, die von Syndikaten oder von privaten Investoren finanziert werden, einen
höheren Innovations-Output aufweisen als vergleichbare Unternehmen ohne Venture-Capital-
Finanzierung. Die geeignetste Venture-Capital-Form für Innovation ist ein heterogenes
Syndikat, das von einem privaten Investor angeführt wird.
Which form of venture capital is most supportive of innovation?
Fabio Bertonia, Tereza Tykvováb Abstract: Although there seems to be consensus in the literature that venture capital investors
increase the innovation output of their portfolio companies, there is little evidence about how
investor type (governmental vs. private) and transaction structure (syndicated vs. non-
syndicated) moderate this impact. Using a sample of 865 young biotech and pharmaceutical
companies from seven European countries, we investigate which form of venture capital is
most supportive of innovation. Our results suggest that in companies financed by syndicates
and by private venture capital investors, the innovation output increases significantly faster
than in non-venture-backed companies. The most supportive form is a heterogeneous
syndicate (i.e., consisting of both types of venture capital investors) led by a private investor.
JEL Codes: G24, H0, O3
Keywords: Innovation, patents, private venture capital investors, governmental venture capital
investors, syndication, biotech and pharmaceutical companies, Europe Acknowledgements: We thank Massimo Colombo, Frédéric Delmar, Gary Dushnitsky, Hans Landström, Marianna Mazzucato, Miguel Meuleman, Frédéric Perdreau, Thomas Åstebro, and all of the participants at the VICO conference in Stresa (Italy), the XXV RENT Conference in Bodø (Norway), and the 12th Symposium on Finance, Banking, and Insurance in Karlsruhe (Germany) for their helpful comments. All errors in the manuscript are our own. Support from the 7th European Framework Program (Grant Agreement no. 217485) is gratefully acknowledged.
a Department of Management, Economics and Industrial Engineering, Politecnico di Milano-Piazza Leonardo da Vinci 32, Milan 20133, Italy. E-mail: [email protected]
b Department International Finance and Financial Management, Centre for European Economic Research (ZEW), L7,1, 68161 Mannheim, Germany; Chair of Corporate Finance, Hohenheim University, Wollgrasweg 23, 70593 Stuttgart, Germany. E-mail: [email protected]; [email protected]

1
1 Introduction
The development of innovation faces a significant funding gap which may hamper long-term
economic growth and recovery (Hall and Lerner, 2010). This scenario may be particularly
true in Europe, whose market is fragmented and insufficiently innovator friendly (European
Commission, 2009). Moreover, in Europe, venture capital investors (VCs), which are one of
the most appropriate candidates for financing young, innovative companies (Carpenter and
Petersen, 2002), are disproportionately involved in late-stage and low-tech deals (Lawton,
2002; Da Rin et al., 2006). Aware of these circumstances, European policymakers have
repeatedly stressed the importance of developing a viable venture capital industry that would
serve as the bedrock for future growth and economic stability (e.g., European Commission,
2010).
Another aspect of venture capital in Europe that is an interesting subject for academic
research is the heterogeneity in the VCs’ governance structures, which often deviate from the
classic Silicon-valley paradigm of independent venture capital funds (Bottazzi et al., 2004;
Bottazzi et al., 2008). In many European countries, governmental venture capital funds have
been established at the national or regional level; a few of the most active include The Biotech
Fonds Vlaanderen in Belgium, SITRA in Finland, CDC Innovation in France, High-Tech
Gründerfonds in Germany, Piemontech in Italy, and Scottish Enterprise in the UK. Bertoni et
al. (2011) estimate that between 1994 and 2004, governmental venture capital investors were
responsible for 19.3% of all high-tech investments in Europe; however, this figure is much
higher in early stages and in sectors that have been specifically targeted by public policy. In
our sample, at least one governmental VC is involved in as many as 43.1% of the investments.
Whether governmental VCs are effective in fostering the innovative output of portfolio
companies (which is one of the main reasons why they were set up in the first place) is a
question that has received surprisingly little attention from academics. However, this is an
important issue given the large importance of these investors in Europe and the hopes that
European governments have for them. Do governmental VCs justify these hopes?
In this work, we explore this question. Specifically, we investigate the extent to which private
and governmental VCs differ in their impact on firms’ innovation output. In one respect,
private VCs, as a result of their governance structure and profit-oriented behavior
(Jääskeläinen et al., 2007), may possess better skills and incentives to spur innovation than
governmental VCs. At the same time, private VCs may suffer from short-termism (Gompers,
1996), which could hamper R&D spending and innovation (Lerner, 2002). A second aspect
that deserves closer scrutiny is the effectiveness of syndicates between private and

2
governmental VCs. The literature shows that, in general, transaction structure (i.e., syndicated
vs. non-syndicated investments) matters. Syndicates may lead to a better selection of
investments and a higher value-added through the combination of complementary resources
(e.g., Bygrave, 1987; Manigart et al., 2004). However, because several parties must
coordinate within a syndicate, syndication gives rise to agency and transaction costs (e.g.,
Wright and Lockett, 2003), which may offset the positive effects. Both effects are potentially
moderated by the type of VCs that are involved in the syndicate, although the empirical
evidence supporting this potential is scarce. To investigate these issues, we rely upon a novel
and extensive dataset of 865 young European biotech and pharmaceutical companies. We
identify 159 first-round venture capital investments in sample companies between 1994 and
2004.
Our results confirm the view that, on average, VCs increase firms’ innovation output. We
highlight significant differences in the impact of VCs on innovation with regard to both the
VC type and the transaction structure. The innovation output of companies financed by
private VCs increases significantly faster than that of companies financed by governmental
VCs, and the innovation output of syndicates outpaces that of stand-alone investors as well.
Heterogeneous syndicates led by private VCs (i.e., syndicates in which a private VC takes the
lead but in which a governmental VC is also involved) seem to produce the economically and
statistically most significant effect. These results are in line with the conjecture that
syndication gives rise to both benefits and costs. The benefits that come from the combination
of complementary resources within a syndicate are particularly pronounced in heterogeneous
syndicates combining private and governmental VCs. Only in this case, and only under the
leadership of a private VC, do these benefits seem to outweigh syndicate costs. These results
are robust to the endogenous choice of VCs’ targets, which we control for with the use of
different matching techniques, and to several alterations.
This paper contributes to three strands of the existing literature. The first strand addresses the
impact of VCs on innovativeness. In their seminal contribution, Kortum and Lerner (2000)
find that venture capital is associated with a substantial increase in innovations in US
manufacturing industries. The approach taken by Kortum and Lerner (2000) has often been
replicated by later studies focusing on different samples and different levels of analysis. For
example, Hirukawa and Ueda (2011) choose the same approach as Kortum and Lerner (2000)
but include more recent data in their sample. Popov and Rosenboom (2009) carry out a
country-level analysis across Europe. Bertoni et al. (2010) employ firm-level data of Italian
new-technology-based firms. These studies confirm that venture capital spurs innovations.

3
However, VCs are also attracted by innovative companies (e.g., Haeussler et al., 2009; Cao
and Hsu, 2011). Some studies find that this selection effect dominates and, once it is
controlled for, VCs do not increase innovation (e.g., Engel and Keilbach, 2007). The present
paper, which benefits from a large sample of European biotech and pharmaceutical
companies, contributes to this literature and provides evidence on how venture capital is
related to innovativeness.
Second, the findings of this study contribute to the literature regarding the heterogeneity of
VCs, particularly on the different impacts of governmental vs. private VCs on innovativeness.
The empirical literature describes mixed results, and, therefore, additional research is needed
in this area. For example, Brander et al. (2008) conclude that companies funded by
governmental VCs generate fewer innovations, whereas Brander et al.’s (2010) results
indicate the opposite. Our paper adds to this literature in that it shows whether, and under
what circumstances, the governmental VCs are beneficial.
Third, our research contributes to the literature on syndication. There is an extensive literature
documenting the benefits and costs associated with syndication (see, e.g., Tykvová and
Schertler, 2011, for a recent discussion). However, research analyzing the consequences of
different syndicate structures on innovations is rare. To the best of our knowledge, there is
only one study that addresses the impact of syndicate structure on innovative activity, namely,
the study by Brander et al. (2010). They show that companies financed by syndicates
consisting of private and governmental VCs outperform control companies when a substantial
fraction of funding comes from the private VC. In accordance with this result, we find that
companies backed by heterogeneous syndicates outperform control companies only when a
private VC takes the lead. Our paper makes two original contributions beyond the state of the
art. Brander et al. (2010) only include VC-backed companies, whereas our sample also
contains a matched control group of non-VC-backed companies. Thus, to Brander et al.’s
(2010) findings on the differences between governmental and private VCs, we add new
findings related to the forms of venture capital that are more beneficial to innovation when
compared to non-VC-backed companies. It is important not only to know how governmental
VCs (and different forms thereof) perform when compared to private VCs, but – to justify
public policy actions – it is also crucial to know whether, and under what circumstances,
governmental VC support is beneficial at all, i.e., in generating a higher innovative output
than we observe with non-VC-backed companies. The second major contribution to this
emerging research is that we not only focus on different forms of governmental support but
also include different forms of private VC activities (private stand-alone vs. private

4
syndicates) in our analysis and find important differences that contribute to our understanding
of the role different VC forms have on the innovative output of their portfolio companies.
Specifically, our results suggest that private VCs are better at increasing innovative output
only in heterogeneous syndicates and in stand-alone transactions but not in homogeneous
private syndicates.
The rest of the paper is structured as follows. In Section 2, we review the related literature and
describe our research hypotheses. In Section 3, we present and describe our sample. In
Section 4, we report the results of our analyses. In Section 5, we present concluding remarks.
2 Theoretical background and hypothesis development
VCs are financial intermediaries able to efficiently screen investment proposals in knowledge-
based firms (Chan, 1983; Tyebjee and Bruno, 1984; Amit et al., 1998). The selected portfolio
firms receive long-term equity funding and are closely monitored (Sahlman, 1990; Lerner,
1995; Kaplan and Strömberg, 2003). Additionally, VCs provide value-added services
(Hellmann and Puri, 2000; Sørensen, 2007; Luukkonen and Maunula, 2007a), such as
coaching or mentoring. Investee firms also benefit from the network of contacts provided by
reputable, well-connected VCs (Colombo et al., 2006; Hsu, 2006; Lindsey, 2008), which may,
for instance, result in improved access to investment bankers. All of these activities could
result in certification effects throughout the investment period up to the IPO phase
(Megginson and Weiss, 1991). Consequently, VCs can have a positive impact on the
innovation and performance of portfolio firms.
Several studies link venture capital to innovation, in general, and to patenting activity, in
particular. In their seminal contribution, Kortum and Lerner (2000) establish a stylized model
of R&D expenditures, venture capital and innovation. By testing various specifications of a
patent production function with US manufacturing industry-level data from 1965-1992, these
authors find that venture capital is associated with a substantial increase in patenting. There is
further evidence of the positive relation between venture capital financing and innovations at
the country (Popov and Roosenboom, 2009), industry (Hirukawa and Ueda, 2011) and
portfolio firm levels (Hellmann and Puri, 2000; Baum and Silverman, 2004; Bertoni et al.,
2010). Based on these findings, we formulate the first hypothesis:
H1: VCs increase the innovation output of their portfolio companies.
VCs are far from being homogeneous and, especially in Europe, there is a significant
involvement of governmental investors (e.g., Bottazzi et al., 2004; Tykvová, 2006). The role
5
of governmental VCs in supporting knowledge-based companies is heavily discussed both in
the academic literature and among practitioners, with a particular focus on the extent to which
governmental VCs attract or crowd out private VCs (Leleux and Surlemont, 2003; Cumming
and MacIntosh, 2006; Cumming, 2007; Brander et al., 2008; Cumming and Johan, 2009).1
Private and governmental VCs differ in terms of their objectives, skills, and governance
structures, and these differences affect the innovative output of their companies. First,
whereas the primary objective of private VCs is to generate profits, which result from
successful innovations, governmental VCs often focus on a broader set of goals, including
building links between universities and the private sector, supporting the development of the
venture capital industry, and increasing local employment levels (see, e.g., Cumming and
MacIntosh, 2004; Cumming and Johan, 2009). Second, private VCs may have better skills
than governmental VCs in selecting promising portfolio companies and in coaching and
monitoring these companies (Leleux and Surlemont, 2003; Luukkonen and Maunula, 2007b;
Luukkonen et al., 2011), which, again, may lead to a greater innovative output of these
companies. Third, in general, private VCs have more performance-sensitive contracts than
governmental VCs (Jääskeläinen et al., 2007). Therefore, private VCs posses increased
incentives to provide their portfolio firms with the financial and non-financial resources they
need to pursue the development of innovations. For all these reasons, we would expect a
higher increase of innovative activities associated with the involvement of private VCs
compared to the involvement of governmental VC. We summarize this discussion in our
second hypothesis:
H2: Private VCs increase the innovation output of their portfolio companies more than
governmental VCs.
VCs may either invest alone or form a syndicate. Syndication is beneficial because it
combines the financial and non-financial resources of syndicate members (e.g., Bygrave,
1987; Manigart et al., 2004). A syndicate partner delivers an alternative opinion on company
future prospects during the screening and selection phase (see Casamatta and Haritcahbalet,
2007; Lerner, 1994). During the investment phase, the combination of complementary non-
financial resources may provide companies with better coaching and monitoring (e.g.,
Cumming and Walz, 2010; Brander et al., 2002; Tian, 2012). In addition, syndicates are able
1 See, more generally, Lerner (2009) for a comprehensive survey of how governments have supported
entrepreneurs and VCs across decades and continents.

6
to provide more financial resources for costly R&D than stand-alone investors. For all these
reasons, we would expect a higher innovative output in companies backed by syndicates
compared to those backed stand-alone investors:
H3: Syndicates increase the innovation output of their portfolio companies more than stand-
alone VCs.
The complementarities in resources, which we expect to be beneficial in increasing patenting
activity, will be particularly pronounced when syndicates are heterogeneous. As argued
above, private VCs may be better at fostering innovative activity due to their objectives,
skills, and governance structures. However, private VCs, at least those that invest via closed-
end funds, may follow short-term goals (e.g., Gompers, 1996) and have tight budget
constraints that may deter innovative projects (Lerner, 2002). Governmental VCs are typically
not under pressure to generate fast returns as private VCs do and may therefore more easily
implement long-term projects. This is likely to be particularly relevant in sectors such as
biotechnology and pharmaceuticals, where R&D requires a long time to market and
substantial resources (Di Masi et al., 1991; Di Masi and Grabowski, 2007). Syndication
between more efficient and better-skilled private VCs and long-term-oriented governmental
VCs (i.e., heterogeneous syndicates) may therefore be more successful in increasing
innovative output than homogeneous (private or governmental) syndicates. Moreover,
governmental financing is most successful when it attracts additional money from private
investors (Takalo and Tanayama, 2010), consistently with what Lerner (1999) finds about the
Small Business Innovation Research (SBIR) program in the US. We therefore expect the
following:
H4: Syndicates consisting of private and governmental VCs (heterogeneous syndicates)
increase the innovation output of their portfolio companies more than homogeneous
syndicates.
Finally, we expect that heterogeneous syndicates may differ markedly in their effects
depending upon which part leads. The lead investor is the most actively involved in the
management of the company (Wright and Lockett, 2003). Because we expect private VCs to
be more successful than governmental VCs at increasing innovative output, we also expect
syndicates led by private VCs to dominate those led by governmental VCs:

7
H5: When a private VC leads a heterogeneous syndicate, the innovation output of the
portfolio companies increases more than when a governmental VC leads the heterogeneous
syndicate.
In the preceding paragraphs, we have gradually introduced the dimensions that describe
venture capital transactions: the type of investors, the presence of a syndicate, and the
syndicate characteristics. By combining these dimensions, we obtain six different transaction
forms: private stand-alone, governmental stand-alone, homogenous private syndicate,
homogeneous governmental syndicate, government-led heterogeneous syndicate, and private-
led heterogeneous syndicate. The above discussion suggests that the latter transaction form
should dominate the others in terms of its impact on innovation output because it combines all
the beneficial features discussed above: the presence of a private VC (H2), syndication (H3),
and a heterogeneous syndicate (H4) led by a private VC (H5). We therefore expect the
following:
H6: Private-led heterogeneous syndicates increase the innovation output of their portfolio
companies more than other forms of venture capital.
3 Data and descriptive statistics
Our sample includes 865 European VC-backed (159) and non-VC-backed (706) companies
from the biotechnology (673) and pharmaceutical (192) industries from seven countries (see
Table 1). All VC-backed and non-VC-backed companies included in this sample were
founded after 1984 and were independent at foundation. All VC-backed companies received
their first round of venture capital financing between 1994 and 2004 and were less than 10
years old at that time. The sample is extracted from the VICO database, a large-scale dataset
on European high-tech entrepreneurial companies that was created with the support of the EC
Seventh Framework Programme. The sampling process and the overall structure of the VICO
database are described by Bertoni and Martí (2011).
We use patent stock to measure innovation output. We obtain information on patenting
activity from the PATSTAT database. PATSTAT provides detailed information on patent
applications and grants (over 70 million records) in more than 80 countries worldwide,
including patent assignee names, citations, publications, application and grant years, industry
patent classes, priority countries, and other information. This database allows us to analyze
the evolution of the patenting activity of sample firms as reflected in their patent stock. We
are also able to compute quality-weighted measures of patent stock that may more effectively
8
capture the value of innovative output (see, e.g., Griliches, 1998; van Pottelsberghe and van
Zeebroeck, 2011). The main dependent variable of our analysis is the increase in (log) patent
stock between the investment year t and year t+τ. As is customary, we compute the patent
stock of sample companies based on the number of granted patents (since the application
year) and depreciated at 15% (see, e.g., Griliches, 1998).2 Our main dependent variable,
therefore, equals [log(1+patent stockt+τ)-log(1+0.85τ patent stockt)] with τ=1,…,5.3 This
variable, which has a lower bound of zero, captures the extent to which the patent stock of a
company in year t+τ exceeds the patent stock in year t (discounted τ years).
Biotechnology and pharmaceutical industries provide an attractive setting for investigating
how different forms of venture capital financing affect innovation output reflected in patent
stock changes. In these industries, patents are considered most important as a device for
protecting innovation (see, e.g., Hall, 2009), which makes patents a reasonably reliable
measure of innovation. The more patenting is considered to be an important means of
intellectual property rights protection, the less an increase in patenting after a venture capital
investment is due to reverse causality. This reverse causality would be an issue when
companies change their protection mechanism after receiving venture capital. For example,
firms that based their intellectual property rights protection mostly on secrecy before
receiving venture capital would most likely shift toward a different protection mechanism,
such as patenting, because secrecy may be jeopardized for firms that receive venture capital
financing (Ueda, 2004). Accordingly, we would expect to observe an increase in patenting
activity after venture capital investments even without any real increase in innovative activity.
In other words, if measures of intellectual property rights protection other than patents are
most important, patenting, as a proxy for innovation, would be affected by a measurement
error that is correlated with venture capital investments. Another benefit of focusing on these
industries is that this focus helps to reduce the heterogeneity that may arise not only in
response to the different use and valuation of patents across technological regimes (e.g.,
2 A variety of depreciation rates are used in the literature: Griliches (1998), Hall et al. (2000) and Bertoni et al.
(2010) use 15%; Henderson and Cockburn (1996) and Ahuja and Katila (2001) use 20%; Blundell et al. (1995)
and Dushnitsky and Lenox (2005) use 30%. Each of these authors verify the robustness of their results using
different depreciation rates, and, to the best of our knowledge, in no case do they find any substantial difference
in the results. We also estimate our models using alternative discounting rates and a non-discounted measure of
patent stock as robustness checks and obtain qualitatively identical results. 3 The use of a log transformation to address the skewness of patent stock is customary in the literature (e.g.,
Chemmanur et al., 2011). In our sample, the skewness of untransformed patent stock is 5.94, which drops to 2.89
after the log transformation.
9
Cohen et al., 2000) but also as a result of the different likelihoods of venture capital financing
across industries, which would be difficult to control for in a multi-industry setting.
Table 1 provides an overview of our dataset (all companies, VC-backed companies, non-VC-
backed companies) composition by country, sector, and foundation period. Table 1 also
reports some descriptive statistics. The UK, Germany and France represent a large portion of
the population (accounting for 70% of the total). The ranking is broadly consistent with the
relative size of biotechnology industries in Europe (OECD, 2006). With regard to the number
of VC-backed companies in our sample, Germany is the most represented country, followed
by the UK. Again, this finding is comparable to OECD (2006) statistics pertaining to venture
capital activity in biotech. Germany and the UK have the second and third highest number of
VC-backed biotech companies, respectively, after the US (German venture capital
investments in biotech account for 23% of all non-US investments; UK venture capital
investments in biotech account for 15%).
Overall, the distribution of companies in our sample by foundation period exhibits an
increasing trend over time, with 204 companies (23.6%) founded between 1984 and 1995,
292 (33.8%) between 1995 and 1999 and 369 (42.7%) between 2000 and 2004. The time
trend is much more pronounced for VC-backed companies: only 9 VC-backed companies
(5.7%) were founded before 1995, 65 (40.9%) between 1995 and 1999 and 85 (53.5%)
between 2000 and 2004. This trend can be explained by the relatively young history of
venture capitalism in Europe. The number and amounts invested increased substantially in the
late 1990s and early 2000s (see EVCA Yearbook, different issues). As a result, companies
founded during this period had a much higher chance, other things being equal, of obtaining
venture capital than companies founded in the 1980s and early 1990s. Consequently, VC-
backed firms were significantly younger than non-VC-backed firms. The average age of the
two groups in 2008 was 8.86 and 10.94 years, respectively, with the difference significant at
the 1% level. On average, companies in our sample had 3.8 million Euro net annual sales and
23.5 employees when the company is at median age (5 years), with no significant difference
between VC-backed and non-VC-backed companies.
Our descriptive statistics highlights whether VC-backed and non-VC-backed companies
differ, on average, in terms of their patent stock. For this, we compute the average level of
patent stock of VC-backed and non-VC-backed companies at median age. We find a very
large and statistically highly significant difference in the average patent stock, which was 1.13
for VC-backed companies and 0.28 for non-VC-backed companies.
[Insert Table 1 about here]
10
To understand whether the difference in the patent stock is driven by selection (i.e., by VCs
selecting more innovative companies) or treatment (i.e., by VCs unlocking firms’ innovation
potential), we extract a matched control sample from the group of non-VC-backed companies.
The rationale for this extraction is that we want to compare the post-investment evolution of a
VC-backed company with a company that, at the time of financing, exhibits similar
characteristics. In particular, VC-backed firms may already have an above-average patent
stock at the time of first investment because VCs normally select firms with larger patent
stocks (e.g., Haeussler et al., 2009).
To build the matched control sample, we rely on propensity-score matching. For every VC-
backed (i.e., treated) company, we select (without replacement) the non-VC-backed (i.e., non-
treated) company that, in the same year in which the investment occurs, has the most similar
propensity score (i.e., the estimated likelihood of receiving venture capital). The panel
structure of our dataset makes it possible to estimate propensity scores using a survival model.
We compute the probability that a company receives its first round of VC financing in any
given year conditional upon not having received it before. In computing the propensity score,
we control for company stage, number of employees, and patent stock and include a full set of
country and year dummies. We are able to compute the propensity score (at the time of
financing) for 153 VC-backed companies.
In the robustness section, we perform an alternative matching process because the selection
criteria for VCs can differ depending upon their typology. Accordingly, we employ two
separate survival models, one for private and one for governmental VCs, to estimate the
probability that a company will receive its first round of private or governmental venture
capital financing in any given year. In computing the two propensity scores, we control for
company age, sales and entry patent stock and include a full set of country and year dummies.
We then build the estimation sample by matching any private VC-backed company with a
non-VC-backed company with the closest probability (propensity score) of receiving
investment from a private VC. We then repeat the same procedure for governmental VC-
backed firms. A detailed description of the matching procedures is reported in the Appendix.
The result of the primary matching process is reported in Table 2. As expected, the matched
control sample exhibits a distribution that is much closer to the VC-backed sample than that
of the non-VC-backed sample presented in Table 1. The distribution across countries and
industries is not significantly different between the VC-backed and the matched control
samples ( ( ) 88.162 =χ and ( ) 51.012 =χ , respectively). However, VC-backed companies
were, on average, still significantly younger than their counterparts in the matched control

11
sample (t-statistic = -3.18). Despite its statistical significance, this difference is limited in
magnitude: VC-backed companies had an average age (at 2008) of 8.86 years compared to an
average of 10.32 years in the matched control sample. At the time of the matching, the sales
and employment of VC-backed and matched control companies did not statistically differ.
More interestingly, as a result of the matching procedure, VC-backed and matched control
companies had a similar patent stock at the time of the match, equal to 0.78 and 0.53,
respectively.4
[Insert Table 2 about here]
As a first, illustrative, example of the progress of innovation output after venture capital
investments, we report in Figure 1 the average increase in log patent stock of VC-backed and
matched control companies over a five-year period after the first investment. Consistently
with Hypothesis 1, the patent stock of VC-backed companies grows at a faster rate than that
of the matched control sample in each of the five years after the investment event, and this
difference is highly statistically significant. Five years after the investment event, the increase
in log patent stock is 2.7 times greater for VC-backed companies than for the matched control
sample (0.236 vs. 0.086).
[Insert Figure 1 about here]
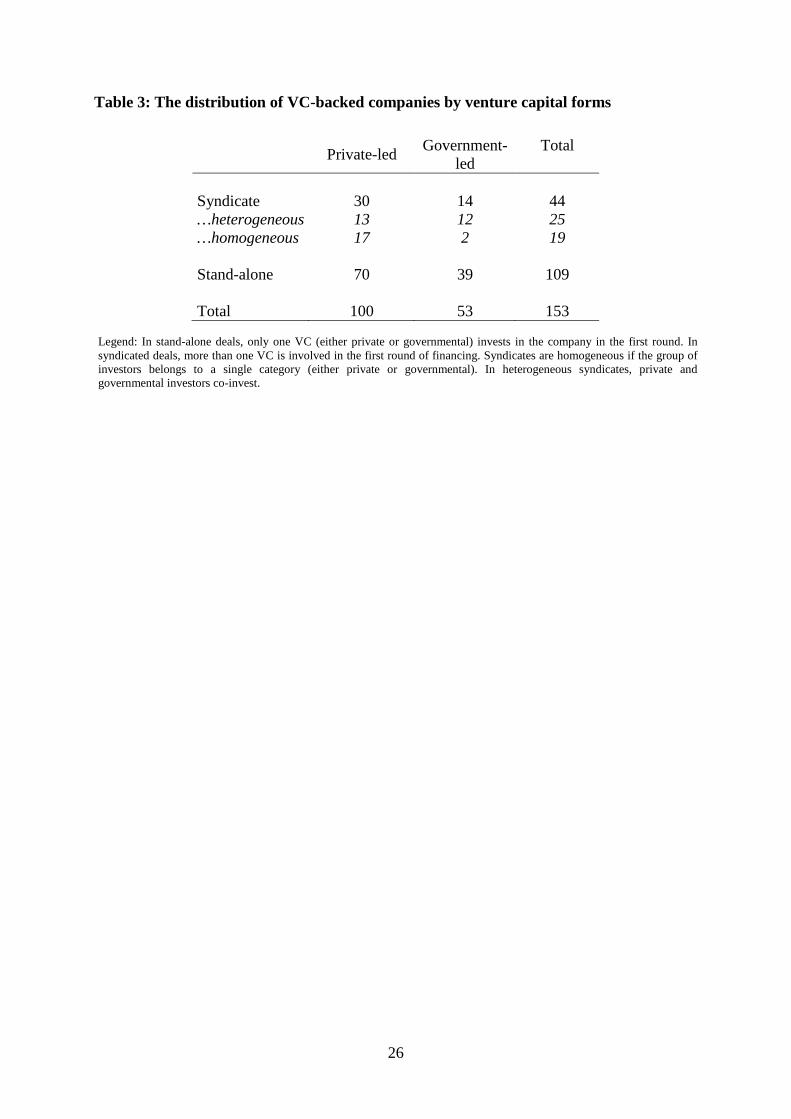
In Table 3, we report the breakdown of the VC-backed sample according venture capital
form. Of the 153 investments, 109 (71.2%) are stand-alone, and 44 (28.8%) are syndicated.
These numbers confirm the low syndication rates in Europe found in previous studies (e.g.,
Manigart et al. (2004) report a syndication rate of 28.7% in Europe). Out of the 109 stand-
alone deals, 70 (64.2%) are conducted by a private VC and 39 (35.8%) by a governmental
VC. Out of the 44 syndicated deals, 30 (68.2%) are led by a private VC and 14 (31.8%) by a
governmental VC. Overall, governmental VCs are involved in 66 of the 153 deals (43.1%),
confirming the importance of governmental VCs in the European biotech and pharmaceutical
sectors. Of the 25 heterogeneous syndicates, 13 are led by private VCs and 12 by
governmental VCs. Homogeneous governmental syndicates, in contrast, are represented by
only two observations in our sample: governmental VCs seem either to invest in stand-alone
4 The values of sales, employment and patent stock are much lower than in Table 1 because in Table 1, the
values are measured at the company age of five years, and in Table 2, they are measured at the time of matching
(with an average of one year).

12
deals or together with private VCs but very rarely form syndicates with other governmental
VCs.
[Insert Table 3 about here]
Figure 2 provides some preliminary insights on the evolution of the log patent stock across
different forms of venture capital. For reference, we also depict, in each panel, the
development of the log patent stock for the matched control sample. The vertical axis shows
the increase in log patent stock in t+τ over the discounted level of log patent stock in t. Panel
A of Figure 2 compares the evolution of firms backed by private VCs with those backed by
governmental VCs (in case of a heterogeneous syndicate, the firm is assigned to the category
of the syndicate leader). The increase in patent stock is only slightly higher for firms backed
by governmental VCs than it is for the matched control sample. The increase is much higher
for companies backed by private VCs, in line with Hypothesis 2. Panel B of Figure 2
compares the increase in patent stock of syndicated and stand-alone deals. We observe that
both transaction types lead to a steady increase in firms’ patent stocks over the matched
control sample but that the pace seems to be more sizeable for syndicated than for stand-alone
investments (in line with Hypothesis 3). Panel C compares different forms of syndicated
deals. The patent stock development in firms backed by homogeneous syndicates is similar to
that of firms backed by stand-alone VCs. The increase in patent stock in heterogeneous
syndicates, in contrast, seems to be much greater, consistent with Hypothesis 4. Finally, in
Panel D, we compare private- and government-led heterogeneous syndicates. Private-led
heterogeneous syndicates seem to outperform not only government-led heterogeneous
syndicates, consistent with Hypothesis 5, but also all other forms of venture capital, consistent
with Hypothesis 6.
[Insert Figure 2 about here]
4 Empirical analyses
4.1 The role of VCs, VC type and syndication
4.1.1 Specifications
Table 4 presents our regression results for the increase in patent stock one to five years after
the investment in the sample of VC-backed and matched control companies. We regress the
increase in log patent stock on the VC dummy (Model 1) as well as on different variables
related to venture capital forms (Models 2-5). With these regressions, we test Hypotheses 1 to

13
5. We control for patent stock at the time of the investment. Blundell et al. (1995) show that,
due to path dependence in innovation activity, the “entry patent stock” adequately controls for
fixed effects. Essentially, including the entry patent stock allows us to partially control for the
unobservable “innovativeness” of companies (see also Ahuja and Katila, 2001; Dushnitsky
and Lenox, 2005; Bertoni et al., 2010).
We also add company age to account for the influence of maturity on patenting. We estimate
alternative specifications in which company size is used instead of company age (both
variables cannot be included simultaneously due to their high correlation) as a robustness
check. We include country dummies to capture country-specific time-invariant characteristics
that may affect patenting. As a robustness check, we exclude countries one by one to
determine whether a single country dominates the results. In another robustness check, we
estimate the models excluding pharmaceuticals. Finally, we employ year dummies to account
for effects that are caused by changing environments over time.
We employ OLS regressions (with standard errors corrected for heteroscedasticity) in this
main analysis. In the robustness section, we use Tobit models to take into account the fact that
the majority of companies do not patent, and, as a result, their patent stock and, consequently,
their patent stock increase is equal zero. Although the Tobit model is appropriate for censored
data such as ours, it is susceptible to misspecification (see, e.g., Nelson, 1981), which
prevents us from using it for the main analysis.
4.1.2 Results
Panel A of Table 4 depicts the results for the patent stock in t+3. Panel B of Table 4 presents
the results for years t+1, t+2, t+4, and t+5 (only coefficients on the VC-related variables are
reported for the sake of readability).
Model 1 suggests that venture capital financing is positively related to the post-VC patent
stock increase two to five years after the venture capital investment. For example, three years
after the investment, the increase in patent stock is higher in VC-backed than in matched
control companies by a factor of 0.064. The difference is significant at the 10% level and
lends support to our Hypothesis 1. The size of the effect is better understood by looking at its
absolute level. The expected patent stock for an average non-VC-backed company in year t+3
is 0.276.5 If the same company received funding from a VC in year t, we would expect instead
a patent stock of 0.360. Interestingly, Panel B of Table 4 shows that, as suggested by Figure 1,
5 The expected patent stock of an “average company” is computed by incorporating population averages of
company age and initial patent stock. Country and year fixed effects are also population averaged.
14
the difference between VC-backed companies and the matched control sample widens over
time and becomes more statistically significant.
In Models 2-5, we look into the group of VC-backed companies in more detail and compare
different VC forms by testing for differences in their coefficients. In addition, by determining
whether a coefficient is significant, we compare the different forms of VC to the matched
control group. This latter comparison provides important information on how the different VC
forms contribute to increased innovation output when compared to that of the matched control
firms. In Model 2, we compare two groups of companies: those whose lead investor is a
private VC and those whose lead investor is a governmental VC. The first group includes
stand-alone deals made by private VCs, homogenous syndicates of private VCs and
heterogeneous syndicates led by private VCs; the latter group consists of stand-alone deals of
governmental VCs, homogeneous syndicates of governmental VCs and government-led
heterogeneous syndicates. Model 2 reveals that companies in which a private VC takes the
lead exhibit a significantly higher increase in patent stock than the matched control group in
years t+2 to t+5. In absolute terms, an average company backed in year t by a private VC
would have, in year t+3, an expected patent stock of 0.405. In contrast, companies with a lead
governmental VC do not increase their patent stock more than the matched control group in
any of the five years after the investment. The difference between the coefficients for the
private and governmental lead dummies is significant at the 10% level in years t+2 to t+5.
These results are in line with our Hypothesis 2.
Model 3 compares syndicated to stand-alone transactions. Syndicated transactions include
homogeneous private syndicates, homogeneous governmental syndicates, private-led
heterogeneous syndicates, and government-led heterogeneous syndicates. Stand-alone
transactions consist of governmental and private stand-alone deals. In years t+1 to t+5, the
coefficient of the syndicate dummy is highly statistically significant, indicating that
syndicates realize a greater increase in patent stock than the matched control group. In
absolute terms, an average company backed in year t by a syndicate of VCs would have, in
year t+3, an expected patent stock of 0.490. The coefficient of the stand-alone dummy is
always insignificant. The difference between the coefficients of the syndicated and stand-
alone dummies is statistically significant in years t+3 to t+5. These results lend support to our
Hypothesis 3.
Model 4 examines the impact of the syndicate structure. The question is how VC
heterogeneity within a syndicate affects the evolution of the patent stock. To address this
question, syndicated transactions are divided into two further subgroups: heterogeneous and

15
homogeneous syndicates. In all five years, the coefficient of the heterogeneous syndicate
dummy is highly statistically and economically significant, whereas the coefficient of the
homogenous syndicate dummy is always insignificant. In absolute terms, an average company
backed in year t by a heterogeneous syndicate would have, in year t+3, an expected patent
stock of 0.617. These results suggest that only companies financed by heterogeneous, but not
by homogeneous, syndicates increase their patent stock more than matched control
companies. The difference between the coefficients of the heterogeneous and homogeneous
syndicate dummies is statistically significant at the 5% level in years t+1 to t+5. These results
are in line with Hypothesis 4.
Finally, Model 5 examines the effects of heterogeneous syndicates in more detail and
investigates whether the leader of the syndicate has an effect. To analyze this issue, we
interact the lead private dummy with the heterogeneous syndicate dummy. The coefficient of
this interaction term is statistically significant and positive, whereas the effect of the
heterogeneous syndicate dummy and the effect of the lead private dummy remain statistically
insignificant. In absolute terms, an average company backed in year t by a heterogeneous
syndicate led by a private VC would have, in year t+3, an expected patent stock of 0.896.
These results suggest that a significant increase in patent stock is observed when VCs
combine complementary resources (in a heterogeneous syndicate) with an efficient syndicate
structure (under a private-led VC). The difference between the coefficients of the
heterogeneous syndicate dummy and the interaction term is statistically significant at the 5%
level in years t+1, t+2, t+4 and t+5, giving support to our Hypothesis 5.
[Insert Table 4 about here]
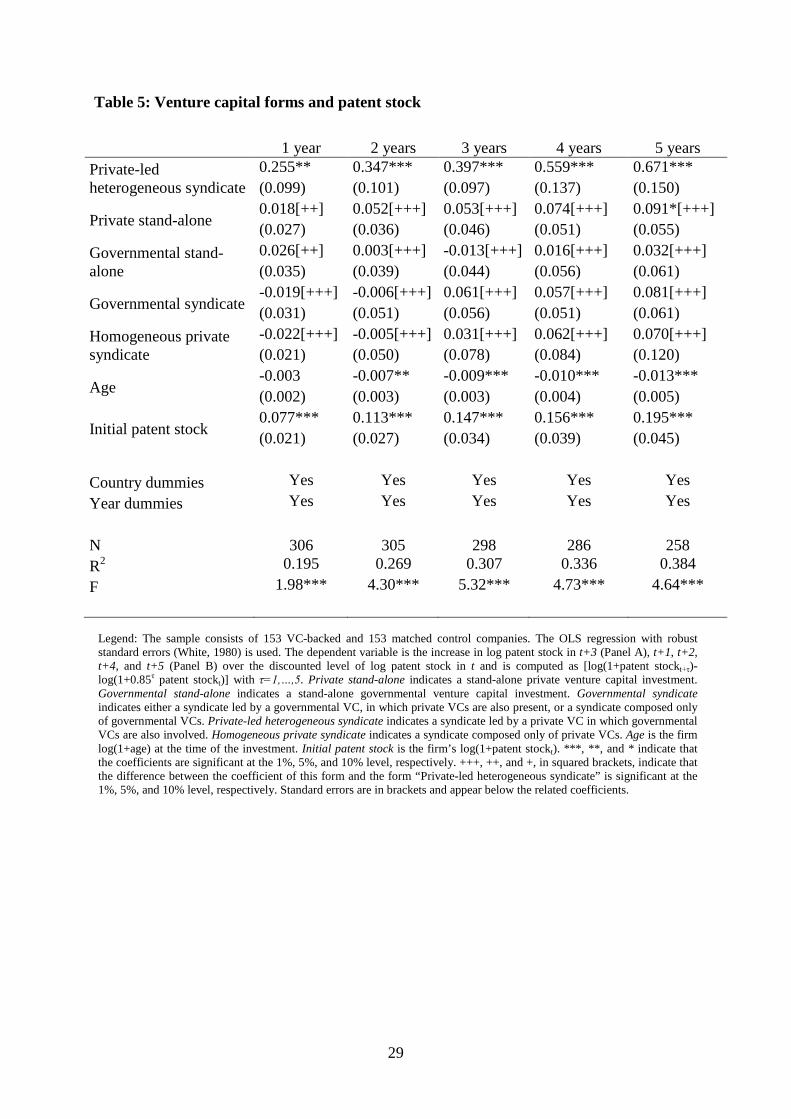
4.2 Transaction forms
4.2.1 Specifications
In this section, we compare transaction structures directly by studying the innovation output
associated with each of them. Table 5 examines this issue by regressing the increase in log
patent stock, 1 to 5 years after the venture capital investment, on a dummy for five transaction
forms: private stand-alone, governmental stand-alone, homogeneous private syndicate,
private-led heterogeneous syndicate and governmental syndicate. This latter form is a
combination of two forms that do not have a sufficient number of observations to justify
keeping them separate: the homogeneous governmental syndicate and government-led
heterogeneous syndicate. (The results are, however, robust toward their separate inclusion.)
16
The reference category is again the matched control group. With these regressions, we test
Hypothesis 6. The control variables and regression approach remain the same as in Table 4.
We perform the same robustness checks as for the regressions in Table 4.
4.2.2 Results
The results presented in Table 5 indicate that in each of the years 1 to 5 after the transaction,
firms backed by private-led heterogeneous syndicates increase the patent stock substantially
more than the matched control companies. The gap increases over time, is economically
sizeable and is statistically significant. More interestingly, private-led heterogeneous
syndicates dominate all other forms in all other years in terms of their effect on the innovation
output. From year t+2 onward, the difference between the coefficient of the private-led
heterogeneous syndicate dummy and any of the other forms’ dummies is always economically
and statistically highly significant at the 1% level (in year t+1, the dummy is also significant,
albeit at a lower level). Thus, even if other venture capital forms (such as private stand-alone)
may be beneficial to innovative output (as compared to matched control companies), private-
led heterogeneous syndicates are the most beneficial form of venture capital for promoting
innovation in biotech and pharmaceuticals. These results strongly support our Hypothesis 6.
[Insert Table 5 about here]
4.3 Robustness
We perform various checks, which we mentioned in previous sections, to verify that our
results from Tables 4 and 5 are robust. In particular, we employ (i) alternative econometric
approaches, (ii) alternative patenting variables, (iii) alternative control variables, (iv)
alternative sample specifications, and (v) an alternative matching technique. We also re-
estimate all models on a balanced sample including 258 companies (for which we have
observations in all years t+1 to t+5). Our main outcomes remain robust toward these checks.
We present selected results (for the model from Table 5 and year t+3) in Table 6. In all these
alternative models, companies backed by private-led heterogeneous syndicates have a
significantly greater increase in patent stock after the venture capital investment compared to
matched control firms. In addition, in all specifications, private-led heterogeneous syndicates
have a much larger effect on the increase in patent stock than any other venture capital form.
This difference is (with one exception) always highly statistically significant, in most cases at
the 1% significance level. We present results from the following specifications: (i) in Column
1, we employ Tobit models instead of the multivariate regression models; (ii) in Columns 2

17
and 3, we use as dependent variables patent stock weighted by family size (i.e., the
geographical scope of the patent) and non-discounted patent stock, respectively; (iii) in
Column 4, we estimate an alternative specification in which company size is used instead of
company age; (iv) in Columns 5 and 6, we report the results of estimates excluding the UK
(i.e., the country with the largest venture capital activity) and pharmaceutical companies,
respectively; and (v) in Column 7, we present results based on an alternative matching process
based on a separate matching equation for private and governmental VCs.
[Insert Table 6 about here]
5 Conclusion
Our paper contributes to a better understanding of the effects of venture capital on portfolio
companies. Using a novel sample of young European companies from the biotechnology and
pharmaceutical sectors, we investigate how venture capital financing, in its different forms,
affects the innovation output of portfolio companies as measured by the increase in their
patent stock. Our results indicate that venture capital investments encourage patenting, as the
existing literature has suggested, but that this effect is only present for certain forms of
venture capital. Specifically, private venture capital investors and syndicates seem to be the
forms that increase innovative output. Our findings lend support to the conclusion that
syndicates between private and governmental venture capital investors, in which the private
investor takes the lead, are the most efficient form in terms of innovation production that
outperforms all other forms. These results contribute to recent discussions in the literature (i)
on the impact of venture capital on patenting, (ii) on the consequences of venture capital
heterogeneity and (iii) on syndication.
Because our results help to better understand the role of governmental venture capital
investors in the process of generating innovations, they provide not only a contribution to the
academic literature but also have important implications for public policies that aim at
fostering innovation. Whereas most of the literature has focused on the extent to which
governmental venture capital attracts or crowds out private investors, in this work, we show
that the mode of investment used by governmental venture capital investors is also a key
variable in the design of effective innovation policies. Specifically, to support innovation,
governmental venture capital investors should not invest alone but should syndicate with
private partners. In addition, private venture capital investors should be allowed by their
governmental partners to lead the syndicate.
18
References
Ahuja, G. and R. Katila (2001). Technological acquisitions and the innovation performance of
acquiring firms: a longitudinal study. Strategic Management Journal, 21: 267-294.
Amit, R., Brander, J. and C. Zott (1998). Why do venture capital firms exist? Theory and
Canadian evidence. Journal of Business Venturing, 13: 441-466.
Baum, J.A.C. and B.S. Silverman (2004). Picking winners or building them? Alliance,
intellectual, and human capital as selection criteria in venture financing and performance
of biotechnology start-ups. Journal of Business Venturing, 19(3): 411-436.
Bertoni, F., Colombo, M.G. and A. Quas (2011). Patterns of venture capital investments in
Europe. SSRN Working paper No. 1920351.
Bertoni, F., Croce, A. and D. D’Adda (2010). Venture capital investments and patenting
activity of high-tech start-ups: a micro-econometric firm-level analysis. Venture Capital:
An International Journal of Entrepreneurial Finance, 12(4): 307-326.
Bertoni F. and J. Martí (2011). Financing entrepreneurial ventures in Europe: description of
the dataset developed by the VICO project. SSRN Working paper No. 1904297.
Blundell, R., Griffith, R. and J. Van Reenen (1995). Dynamic count data models of
technological innovation. Economic Journal, 5: 333-344.
Bottazzi, L., Da Rin, M. and T. Hellmann (2004). The changing face of the European venture
capital industry: facts and analysis. The Journal of Private Equity: 26-53.
Bottazzi, L., Da Rin, M. and T. Hellmann (2008). Who are the active investors?: Evidence
from venture capital. Journal of Financial Economics, 89: 488-512.
Brander, J., Amit, R. and W. Antweiler (2002). Venture capital syndication: improved venture
selection versus value-added hypothesis. Journal of Economics and Management Strategy,
11(3): 423-452.
Brander, J., Du, Q. and T. Hellmann (2010). Governments as venture capitalists: striking the
right balance. The Global Economic Impact of Private Equity Report 2010: 27-52.
Brander, J., Egan, E. and T. Hellmann (2008): Government sponsored versus private venture
capital: Canadian evidence. NBER Working Paper No. 14029.
Bygrave, W.D. (1987). Syndicated investments by venture capital firms: a networking
perspective. Journal of Business Venturing 2: 139-154.

19
Cao, J.X. and P.H. Hsu (2011). The informational role of patents in venture capital Financing.
SSRN Working paper No. 1678809.
Carptenter, R.E. and B. Petersen (2002). Capital market imperfections, high-tech investment,
and new equity financing. The Economic Journal, 112(February): F54-F72.
Casamatta, C. and C. Haritchabalet (2007). Experience, screening and syndication in venture
capital investments. Journal of Financial Intermediation, 16(3): 368-398.
Chan, Y.S. (1983). On the positive role of financial intermediation in allocation of venture
capital in market with imperfect information. Journal of Finance, 35: 1543-1568.
Chemmanur, T., Loutskina, E. and X. Tian (2011). Corporate venture capital, value creation,
and innovation. SSRN Working paper No. 1364213.
Cohen, W.M., Nelson, R.R. and J.P. Walsh (2000). Protecting their intellectual assets:
appropriability conditions and why U.S. manufacturing firms patent (or not). NBER
working paper No. 7552.
Colombo, M.G., Grilli, L. and E. Piva (2006). In search for complementary assets: the
determinants of alliance formation of high-tech start-ups. Research Policy, 35: 1166-1199.
Cumming, D.J. (2007). Government policy towards entrepreneurial finance: innovation
investment funds. Journal of Business Venturing, 22: 193-235.
Cumming, D.J. and S. Johan (2009). Pre-seed government venture capital funds. Journal of
International Entrepreneurship, 7: 26-56.
Cumming, D.J. and J.G. MacIntosh (2004). Canadian labour sponsored venture capital
corporations: bane or boon? In: Ginsberg, A., Hasan, I. (Eds.), New venture investment:
choices and consequences. Elsevier Science Academic Press: 169-200.
Cumming, D.J. and J.G. MacIntosh (2006). Crowding out private equity: Canadian evidence.
Journal of Business Venturing, 21: 569-609.
Cumming, D.J. and U. Walz (2010). Private equity returns and disclosure around the world.
Journal of International Business Studies, 41: 727-754.
Da Rin, M., Nicodano, G. and A. Sembenelli (2006). Public policy and the creation of active
venture capital markets. Journal of Public Economics, 90(8-9): 1699-1723.
Di Masi, J.A. and H.G. Grabowski (2007). The cost of biopharmaceutical R&D: is biotech
different? Managerial and Decision Economics, 28(4-5): 469-479.
20
Di Masi, J.A., Hansen, R.W., Grabowski, H.G. and L. Lasagna (1991). Cost of innovation in
the pharmaceutical industry. Journal of Health Economics, 10(2): 107-142.
Dushnitsky, G., and M.J. Lenox (2005). When do incumbents learn from entrepreneurial
ventures? Corporate venture capital and investing firm innovation rates. Research Policy,
34: 615-639.
Engel, D. and M. Keilbach (2007). Firm level implications of early stage venture capital
investment – an empirical investigation. Journal of Empirical Finance, 14(2): 150-167.
European Commission (2009). European innovation scoreboard. Pro Inno Europe Paper No.
15.
European Commission (2010). Europe 2020: A strategy for smart, sustainable and inclusive
growth. Policy Report of the European Commission.
EVCA Yearbook, different issues.
Gompers, P. (1996). Grandstanding in the venture capital industry. Journal of Financial
Economics, 42: 133-156.
Griliches, Z. (1998). Patent statistics as economic indicators: a survey. In: Z. Griliches. R&D
and productivity: the econometric evidence. Chapter 13. University of Chicago Press.
Haeussler, C., Harhoff, D. and E. Mueller (2009). To be financed or not… - the role of patents
for venture capital financing. ZEW Discussion Paper No. 09-003.
Hall, B.H. (2009). The use and value of IP rights. Working paper presented at the UK IP
ministerial forum on the economic value of intellectual property. London, UK, 10 June
2009.
Hall, B.H., Jaffe, A.B. and M. Trajtenberg (2000). Market value and patent citations: a first
look. NBER Working Paper No. 7741.
Hall, B.H. and J. Lerner (2010). The financing of R&D and innovation. In Hall, B. H. and N.
Rosenberg (eds.), Handbook of the economics of innovation, Elsevier-North Holland.
Heckman, I.J., Ichimura, H., and P. Todd (1998). Matching as an econometric evaluation
estimator. The Review of Economic Studies, 65: 261-294.
Hellmann, T. and M. Puri (2000). The interaction between product market and financing
strategy: the role of venture capital. The Review of Financial Studies, 13(4): 959-984.

21
Henderson, R. and I. Cockburn (1996). Scale, scope, and spillovers: the determinants of
research productivity in drug discovery. RAND Journal of Economics, 27(1): 32-59.
Hirukawa, M. and M. Ueda (2011). Venture capital and innovation: which is first? Pacific
Economic Review, 16(4): 421-465.
Hsu, D.H., (2006). Venture capitalists and cooperative start-up commercialization strategy.
Management Science, 52: 204-219.
Jääskeläinen, M., Maula, M. and G. Murray (2007). Profit distribution and compensation
structures in publicly and privately funded hybrid venture capital funds. Research Policy,
36: 913-929.
Kaplan, S.N. and P. Strömberg (2003). Financial contracting theory meets the real world: an
empirical analysis of venture capital contracts. The Review of Economic Studies, 70(2):
281-315.
Kortum, S. and J. Lerner (2000). Assessing the contribution of venture capital to innovation.
RAND Journal of Economics, 31(4): 674-692.
Lawton, T.C. (2002). Missing the target: assessing the role of government in bridging the
European equity gap and enhancing economic growth. Venture Capital: An International
Journal of Entrepreneurial Finance, 4(1): 7-23.
Leleux, B. and B. Surlemont (2003). Public versus private venture capital: seeding or
crowding out? A pan-European analysis. Journal of Business Venturing, 18: 81-104.
Lerner, J. (1994). The syndication of venture capital investments. Financial Management,
23(3): 16-27.
Lerner, J. (1995). Venture capitalists and the oversight of private firms. The Journal of
Finance, 50(1): 301-318.
Lerner, J. (1999). The government as venture capitalist: the long-run effects of the SBIR
program. Journal of Business, 72(3): 285-318.
Lerner, J. (2002). Boom and bust in the venture capital industry and the impact on innovation.
Harvard NOM Research Paper No. 03-13.
Lerner, J. (2009). Boulevard of broken dreams: why public efforts to boost entrepreneurship
and venture capital have failed – and what to do about it. Princeton University Press.
Lindsey, L. (2008). Blurring firm boundaries: the role of venture capital in strategic alliances.
The Journal of Finance, 63(3): 1137–1168.

22
Luukkonen, T., Deschryvere, M., Bertoni, F. and T. Nikulainen (2011). Importance of the
non-financial value added of government and independent venture capitalists. ETLA
Discussion paper No. 1257.
Luukkonen, T. and M. Maunula (2007a). ’Coaching’ small biotech companies into success.
International Journal of Biotechnology 9(6): 548-568.
Luukkonen, T. and M. Maunula (2007b). Non-financial value-added of venture capital: a
comparative study of different venture capital investors. ETLA Discussion paper No. 1067.
Manigart, S., Wright, M., Lockett, A., Meuleman, M., Landström, H., Bruining, H.,
Desbrières, P. and U. Hommel (2004). Why do venture capital companies syndicate? SSRN
Working Paper No. 371048.
Megginson, W.L. and K.A. Weiss (1991). Venture capitalist certification in initial public
offerings. Journal of Finance, 46(3): 879-903.
Nelson, F.D. (1981). A test for misspecification in the censored normal model. Econometrica,
49(5): 1317-1329.
OECD (2006). Biotechnology statistics. Organisation for Economic Co-operation and
Development.
Popov, A.A. and P. Roosenboom (2009). Does private equity investment spur innovation?
Evidence from Europe. ECB Working Paper No. 1063.
Rosenbaum, P.R. and D.B. Rubin (1983). The central role of the propensity score in
observational studies for causal effects. Biometrika, 70: 41-55.
Sahlman, W.A. (1990). The structure and governance of venture capital organizations.
Journal of Financial Economics, 27(2): 473-521.
Sørensen, M. (2007). How smart is smart money? A two-sided matching model of venture
capital. Journal of Finance, 62(6): 2725-2762.
Takalo, T. and T. Tanayama (2010). Adverse selection and financing of innovation: is there a
need for R&D subsidies? The Journal of Technology Transfer, 35(1): 16-41.
Tian, X. (2012). The role of venture capital syndication in value creation for entrepreneurial
firms. Review of Finance, 16(1): 245-283.Tyebjee, T. and A. Bruno (1984). A model of
venture capitalist investment activity. Management Science, 30(9): 1051-1066.

23
Tykvová T. (2006). How do investment patterns of independent and captive private equity
funds differ? Evidence from Germany. Financial Markets and Portfolio Management,
20(4): 399-418.
Tykvová, T. and A. Schertler (2011). Does syndication with local venture capitalists moderate
the negative effects of geographical and institutional distances and low experience?
Working Paper.
Ueda, M. (2004). Banks versus venture capital: project evaluation, screening, and
expropriation. Journal of Finance, 59(2): 601-621.
van Pottelsberghe, B. and N. van Zeebroeck (2011). Filing strategies and patent value.
Economics of Innovation and New Technology, 20(6): 539-561.
White, H. (1980). A heteroscedasticity-consistent covariance matrix estimator and a direct test
for heteroscedasticity. Econometrica, 48: 817-833.
Wright, M. and A. Lockett (2003). The structure and management of alliances: syndication in
the venture capital industry. Journal of Management Studies, 40: 2073-2102.

24
Tables and Figures
Table 1: Distribution and descriptive statistics on the population of companies
VC-backed Non-VC-backed All
No. of companies 159 706 865
Distribution Belgium 18 48 66 Finland 14 45 59 France 14 111 125 Germany 55 148 203 Italy 7 38 45 Spain 15 77 92 United Kingdom 36 239 275 Biotechnology 133 540 673 Pharmaceuticals 26 166 192 Founded 1984-1995 9 195 204 Founded 1995-1999 65 227 292 Founded 2000-2004 85 284 369
Mean Age in 2008 8.86 10.94 10.56 [-4.79]*** Sales at median age 3,782 3,845 3,835 [-0.03] Employees at median age 25.76 22.96 23.49 [0.36] Patent stock at median age 1.13 0.28 0.43 [4.85]***
Legend: Sales are expressed in thousands of Euros (deflated using CPI and expressed at the real 2008 level). Patent stock is the number of granted patents since the application year depreciated at 15%. ***, ** and * indicate differences in means significant at the 1%, 5%, and 10% level, respectively. The value of the t-test (on VC-backed and non-VC-backed group equality) is shown in square brackets. The median age is 5 years.

25
Table 2: Distribution and descriptive statistics on VC-backed companies and the
matched control sample
VC-backed Matched All No. of companies 153 153 306
Distribution Belgium 18 17 35 Finland 14 12 26 France 13 14 27 Germany 54 45 99 Italy 7 14 21 Spain 15 14 29 United Kingdom 32 37 69 Biotechnology 127 120 247 Pharmaceuticals 26 33 59 Founded 1984-1995 9 30 39 Founded 1995-1999 62 49 111 Founded 2000-2004 82 74 156
Mean Age in 2008 8.86 10.32 9.59 [-3.18]*** Sales at time of matching 2,183 1,514 1,860 [0.46] Employees at time of matching 10.80 13.35 12.02 [-0.37] Patent stock at time of matching 0.78 0.53 0.66 [0.84]
Legend: Sales are expressed in thousands of Euros (deflated using CPI and expressed at the real 2008 level). Patent stock is the number of granted patents since the application year depreciated at 15%. ***, ** and * indicate differences in means significant at the 1%, 5%, and 10% level, respectively. The value of the t-test (on VC-backed and matched control group equality) is shown in square brackets.
26
Table 3: The distribution of VC-backed companies by venture capital forms
Private-led Government-led
Total
Syndicate 30 14 44 …heterogeneous 13 12 25 …homogeneous 17 2 19 Stand-alone 70 39 109 Total 100 53 153
Legend: In stand-alone deals, only one VC (either private or governmental) invests in the company in the first round. In syndicated deals, more than one VC is involved in the first round of financing. Syndicates are homogeneous if the group of investors belongs to a single category (either private or governmental). In heterogeneous syndicates, private and governmental investors co-invest.

27
Table 4: Venture capital, VC type, syndication and patent stock
Panel A: 3 years after VC involvement
Model 1 Model 2 Model 3 Model 4 Model 5 VC dummy 0.064* (0.032) Private-led 0.097**[+] 0.061 (0.041) (0.051) Government-led 0.005 (0.037) Syndicate 0.155***[++] (0.054) Stand-alone 0.027 0.028 -0.009 (0.037) (0.037) (0.044) Heterogeneous syndicate 0.237***[++] 0.064 (0.069) (0.064) Homogenous syndicate 0.035 -0.020 (0.069) (0.077) (Heterogeneous)x(Private-led) 0.273** (0.121) Age -0.010*** -0.010*** -0.010*** -0.010*** -0.009*** (0.003) (0.003) (0.003) (0.003) (0.003) Initial patent stock 0.145*** 0.141*** 0.140*** 0.146*** 0.147*** (0.034) (0.034) (0.033) (0.034) (0.034) Country dummies Yes Yes Yes Yes Yes Year dummies Yes Yes Yes Yes Yes N 298 298 298 298 298 R2 0.245 0.255 0.262 0.278 0.307 F 4.76*** 4.41*** 4.88*** 5.04*** 5.29***

28
Panel B:
VC dummy Private-led Syndicate Heterogeneous
syndicate (Heterogeneous) x (Private-led)
1 year 0.032 0.042 0.063* 0.125**[++] 0.282**[++]
2 years 0.051* 0.080**[+] 0.099** 0.176**[++] 0.313**[++]
4 years 0.093** 0.135***[+] 0.210***[++] 0.297***[++] 0.452***[++]
5 years 0.118*** 0.164***[+] 0.250***[++] 0.350***[++] 0.543***[++]
Governmental lead Stand-alone Homogenous
syndicate
1 year 0.012 0.019 -0.019
2 years -0.002 0.032 -0.002
4 years 0.025 0.049 0.065
5 years 0.045 0.066 0.079
Legend: The sample consists of 153 VC-backed and 153 matched control companies. An OLS regression with robust standard errors (White, 1980) is used. The number of observations for the 1-year, 2-year, 4-year and 5-year model is 306, 305, 286, and 258, respectively. The dependent variable is the increase in log patent stock in t+3 (Panel A), t+1, t+2, t+4, and t+5 (Panel B) over the discounted level of log patent stock in t and is computed as [log(1+patent stockt+τ)-log(1+0.85τ patent stockt)] with τ=1,…,5. VC dummy is equal to one for the companies from the VC-backed sample. Private-led is equal to 1 for deals led by a private VC. Government-led is equal to 1 for deals led by a governmental VC. Syndicate is equal to 1 if multiple VCs are involved in the transaction. Stand-alone is equal to 1 if only one investor is involved in the deal. Heterogeneous syndicate is equal to 1 when both private and governmental VCs participate. Homogenous syndicate is equal to one for syndicates in which only one type of investor participates (i.e., governmental homogeneous syndicates and private homogeneous syndicates). (Heterogeneous) x (Private-led) is the interaction between Heterogeneous syndicate and Private-led. Age is the firm log(1+age) at time of the investment. Initial patent stock is the firm’s log(1+patent stockt). Panel B shows only coefficients on VC-related variables. ***, **, and * indicate that the coefficients are significant at the 1%, 5%, and 10% level, respectively. ++ and + in squared brackets indicate that the difference between the coefficients of interest (i.e., Private-led and Government-led in Model 2, Syndicate and Stand-alone in Model 3, Heterogeneous syndicate and Homogeneous syndicate in Model 4, Heterogeneous syndicate and (Heterogeneous) x (Private-led) in Model 5) is significant at the 5% and 10% level, respectively. Standard errors are in brackets and appear below the related coefficients (Panel A).
29
Table 5: Venture capital forms and patent stock
1 year 2 years 3 years 4 years 5 years Private-led heterogeneous syndicate
0.255** 0.347*** 0.397*** 0.559*** 0.671*** (0.099) (0.101) (0.097) (0.137) (0.150)
Private stand-alone 0.018[++] 0.052[+++] 0.053[+++] 0.074[+++] 0.091*[+++] (0.027) (0.036) (0.046) (0.051) (0.055)
Governmental stand-alone
0.026[++] 0.003[+++] -0.013[+++] 0.016[+++] 0.032[+++] (0.035) (0.039) (0.044) (0.056) (0.061)
Governmental syndicate -0.019[+++] -0.006[+++] 0.061[+++] 0.057[+++] 0.081[+++] (0.031) (0.051) (0.056) (0.051) (0.061)
Homogeneous private syndicate
-0.022[+++] -0.005[+++] 0.031[+++] 0.062[+++] 0.070[+++] (0.021) (0.050) (0.078) (0.084) (0.120)
Age -0.003 -0.007** -0.009*** -0.010*** -0.013*** (0.002) (0.003) (0.003) (0.004) (0.005)
Initial patent stock 0.077*** 0.113*** 0.147*** 0.156*** 0.195*** (0.021) (0.027) (0.034) (0.039) (0.045)
Country dummies Yes Yes Yes Yes Yes Year dummies Yes Yes Yes Yes Yes N 306 305 298 286 258 R2 0.195 0.269 0.307 0.336 0.384 F 1.98*** 4.30*** 5.32*** 4.73*** 4.64***
Legend: The sample consists of 153 VC-backed and 153 matched control companies. The OLS regression with robust standard errors (White, 1980) is used. The dependent variable is the increase in log patent stock in t+3 (Panel A), t+1, t+2, t+4, and t+5 (Panel B) over the discounted level of log patent stock in t and is computed as [log(1+patent stockt+τ)-log(1+0.85τ patent stockt)] with τ=1,…,5. Private stand-alone indicates a stand-alone private venture capital investment. Governmental stand-alone indicates a stand-alone governmental venture capital investment. Governmental syndicate indicates either a syndicate led by a governmental VC, in which private VCs are also present, or a syndicate composed only of governmental VCs. Private-led heterogeneous syndicate indicates a syndicate led by a private VC in which governmental VCs are also involved. Homogeneous private syndicate indicates a syndicate composed only of private VCs. Age is the firm log(1+age) at the time of the investment. Initial patent stock is the firm’s log(1+patent stockt). ***, **, and * indicate that the coefficients are significant at the 1%, 5%, and 10% level, respectively. +++, ++, and +, in squared brackets, indicate that the difference between the coefficient of this form and the form “Private-led heterogeneous syndicate” is significant at the 1%, 5%, and 10% level, respectively. Standard errors are in brackets and appear below the related coefficients.
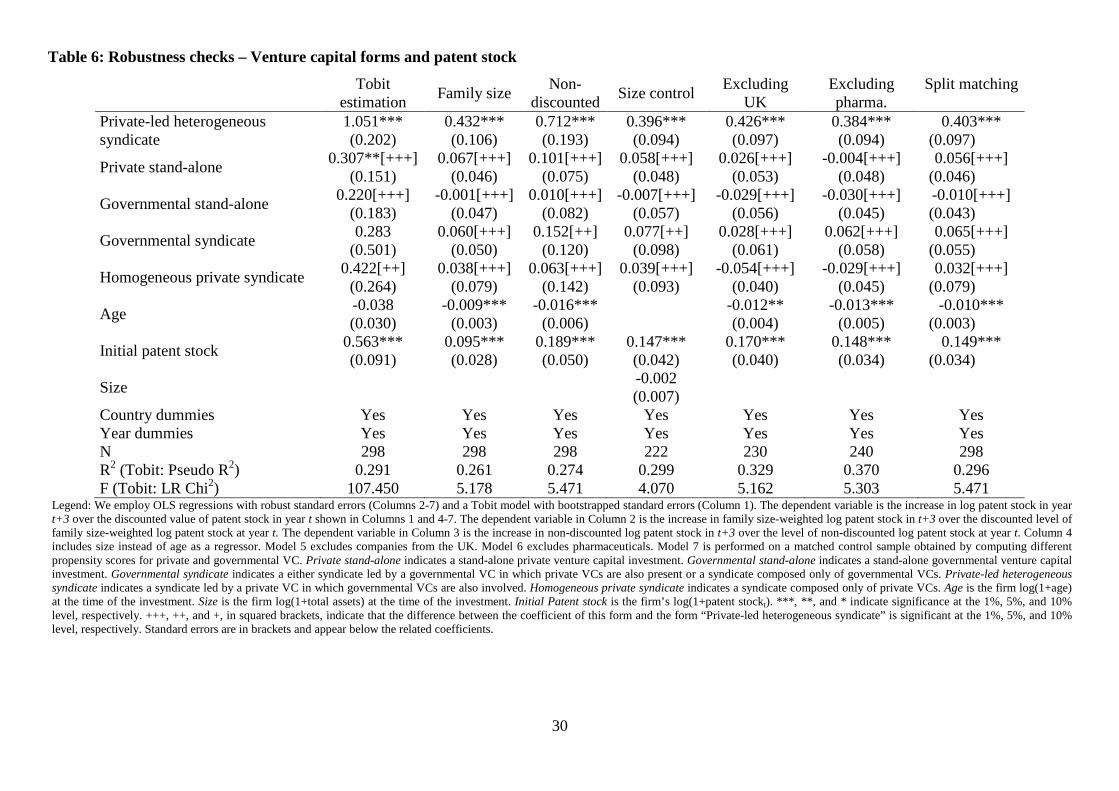
30
Table 6: Robustness checks – Venture capital forms and patent stock
Tobit estimation Family size Non-
discounted Size control Excluding UK
Excluding pharma.
Split matching
Private-led heterogeneous syndicate
1.051*** 0.432*** 0.712*** 0.396*** 0.426*** 0.384*** 0.403*** (0.202) (0.106) (0.193) (0.094) (0.097) (0.094) (0.097)
Private stand-alone 0.307**[+++] 0.067[+++] 0.101[+++] 0.058[+++] 0.026[+++] -0.004[+++] 0.056[+++] (0.151) (0.046) (0.075) (0.048) (0.053) (0.048) (0.046)
Governmental stand-alone 0.220[+++] -0.001[+++] 0.010[+++] -0.007[+++] -0.029[+++] -0.030[+++] -0.010[+++] (0.183) (0.047) (0.082) (0.057) (0.056) (0.045) (0.043)
Governmental syndicate 0.283 0.060[+++] 0.152[++] 0.077[++] 0.028[+++] 0.062[+++] 0.065[+++] (0.501) (0.050) (0.120) (0.098) (0.061) (0.058) (0.055)
Homogeneous private syndicate 0.422[++] 0.038[+++] 0.063[+++] 0.039[+++] -0.054[+++] -0.029[+++] 0.032[+++] (0.264) (0.079) (0.142) (0.093) (0.040) (0.045) (0.079)
Age -0.038 -0.009*** -0.016*** -0.012** -0.013*** -0.010*** (0.030) (0.003) (0.006) (0.004) (0.005) (0.003)
Initial patent stock 0.563*** 0.095*** 0.189*** 0.147*** 0.170*** 0.148*** 0.149*** (0.091) (0.028) (0.050) (0.042) (0.040) (0.034) (0.034)
Size -0.002 (0.007)
Country dummies Yes Yes Yes Yes Yes Yes Yes Year dummies Yes Yes Yes Yes Yes Yes Yes N 298 298 298 222 230 240 298 R2 (Tobit: Pseudo R2) 0.291 0.261 0.274 0.299 0.329 0.370 0.296 F (Tobit: LR Chi2) 107.450 5.178 5.471 4.070 5.162 5.303 5.471
Legend: We employ OLS regressions with robust standard errors (Columns 2-7) and a Tobit model with bootstrapped standard errors (Column 1). The dependent variable is the increase in log patent stock in year t+3 over the discounted value of patent stock in year t shown in Columns 1 and 4-7. The dependent variable in Column 2 is the increase in family size-weighted log patent stock in t+3 over the discounted level of family size-weighted log patent stock at year t. The dependent variable in Column 3 is the increase in non-discounted log patent stock in t+3 over the level of non-discounted log patent stock at year t. Column 4 includes size instead of age as a regressor. Model 5 excludes companies from the UK. Model 6 excludes pharmaceuticals. Model 7 is performed on a matched control sample obtained by computing different propensity scores for private and governmental VC. Private stand-alone indicates a stand-alone private venture capital investment. Governmental stand-alone indicates a stand-alone governmental venture capital investment. Governmental syndicate indicates a either syndicate led by a governmental VC in which private VCs are also present or a syndicate composed only of governmental VCs. Private-led heterogeneous syndicate indicates a syndicate led by a private VC in which governmental VCs are also involved. Homogeneous private syndicate indicates a syndicate composed only of private VCs. Age is the firm log(1+age) at the time of the investment. Size is the firm log(1+total assets) at the time of the investment. Initial Patent stock is the firm’s log(1+patent stockt). ***, **, and * indicate significance at the 1%, 5%, and 10% level, respectively. +++, ++, and +, in squared brackets, indicate that the difference between the coefficient of this form and the form “Private-led heterogeneous syndicate” is significant at the 1%, 5%, and 10% level, respectively. Standard errors are in brackets and appear below the related coefficients.

31
Figure 1 – The evolution of patent stock: VC-backed companies vs. the matched control
sample
0
0.1
0.2
0.3
0 1 2 3 4 5
VC-backed Matched
Legend: The vertical axis reports the increase in log patent stock over the discounted level of the beginning-of-period log patent stock and is computed as [log(1+patent stockt+τ)-log(1+0.85τ patent stockt)]. The horizontal axis represents the years since the initial venture capital investment, τ=1,…,5.
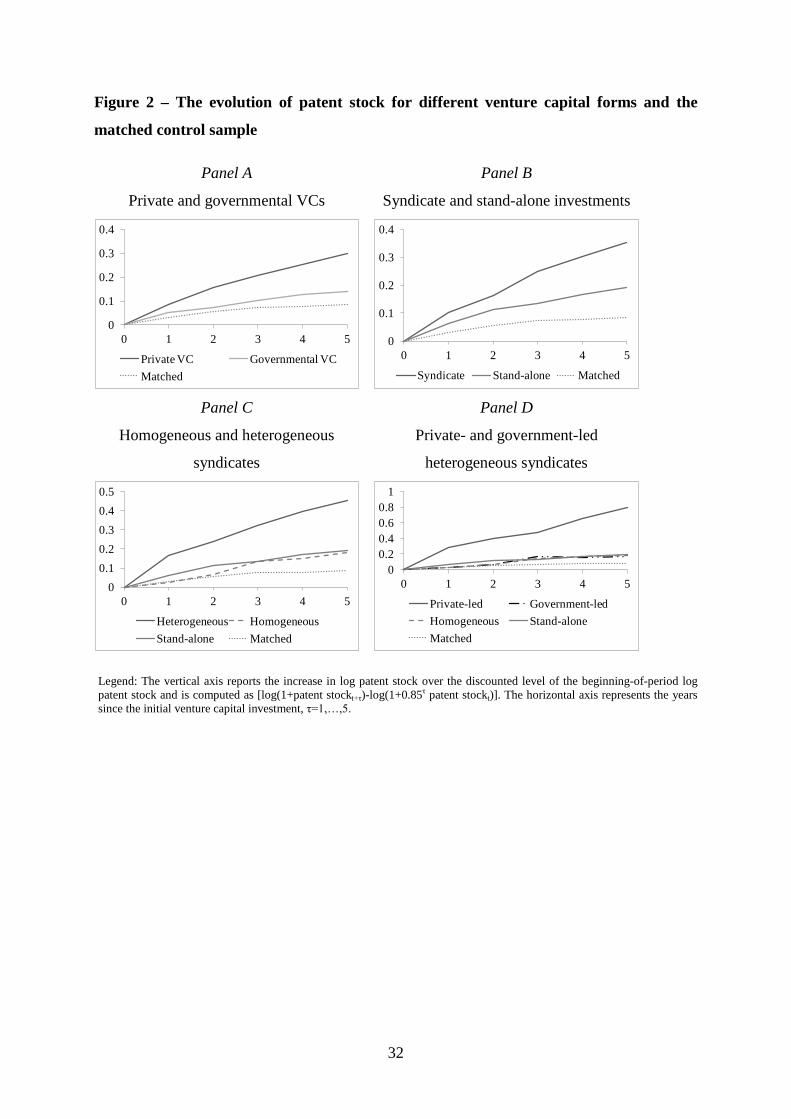
32
Figure 2 – The evolution of patent stock for different venture capital forms and the
matched control sample
Panel A
Private and governmental VCs
Panel B
Syndicate and stand-alone investments
0
0.1
0.2
0.3
0.4
0 1 2 3 4 5
Private VC Governmental VCMatched
0
0.1
0.2
0.3
0.4
0 1 2 3 4 5
Syndicate Stand-alone Matched Panel C
Homogeneous and heterogeneous
syndicates
Panel D
Private- and government-led
heterogeneous syndicates
00.10.20.30.40.5
0 1 2 3 4 5
Heterogeneous HomogeneousStand-alone Matched
00.20.40.60.8
1
0 1 2 3 4 5
Private-led Government-ledHomogeneous Stand-aloneMatched
Legend: The vertical axis reports the increase in log patent stock over the discounted level of the beginning-of-period log patent stock and is computed as [log(1+patent stockt+τ)-log(1+0.85τ patent stockt)]. The horizontal axis represents the years since the initial venture capital investment, τ=1,…,5.
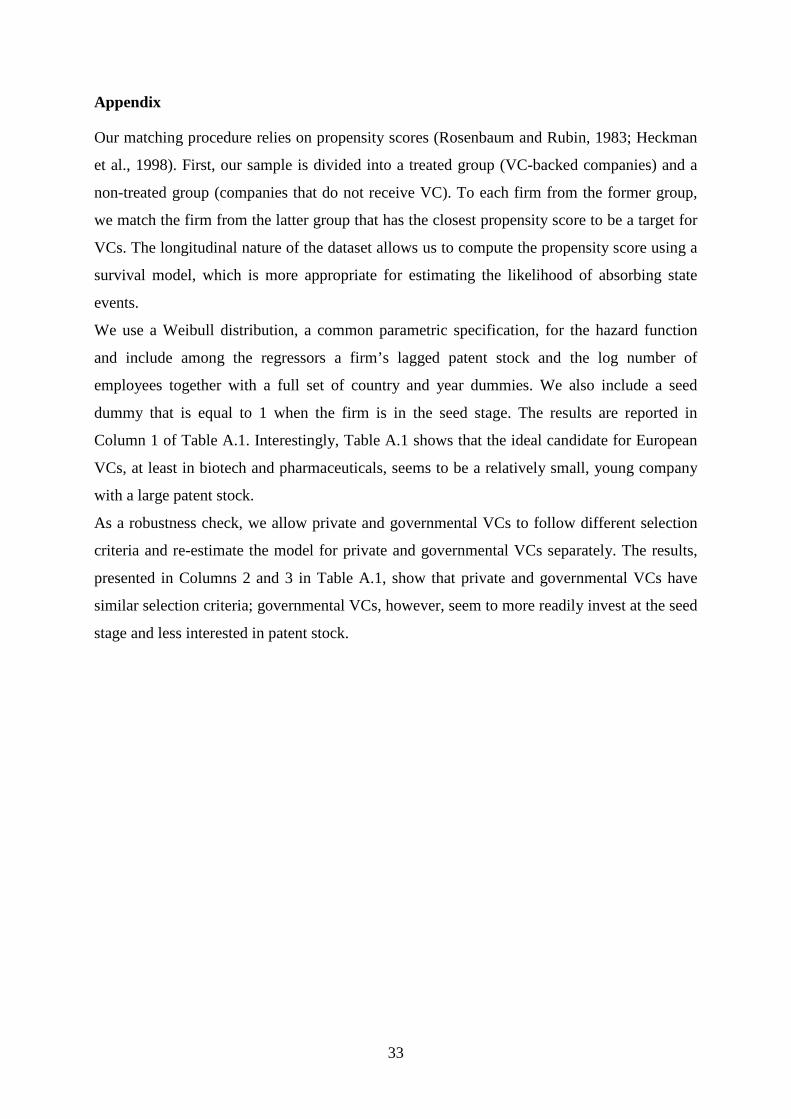
33
Appendix
Our matching procedure relies on propensity scores (Rosenbaum and Rubin, 1983; Heckman
et al., 1998). First, our sample is divided into a treated group (VC-backed companies) and a
non-treated group (companies that do not receive VC). To each firm from the former group,
we match the firm from the latter group that has the closest propensity score to be a target for
VCs. The longitudinal nature of the dataset allows us to compute the propensity score using a
survival model, which is more appropriate for estimating the likelihood of absorbing state
events.
We use a Weibull distribution, a common parametric specification, for the hazard function
and include among the regressors a firm’s lagged patent stock and the log number of
employees together with a full set of country and year dummies. We also include a seed
dummy that is equal to 1 when the firm is in the seed stage. The results are reported in
Column 1 of Table A.1. Interestingly, Table A.1 shows that the ideal candidate for European
VCs, at least in biotech and pharmaceuticals, seems to be a relatively small, young company
with a large patent stock.
As a robustness check, we allow private and governmental VCs to follow different selection
criteria and re-estimate the model for private and governmental VCs separately. The results,
presented in Columns 2 and 3 in Table A.1, show that private and governmental VCs have
similar selection criteria; governmental VCs, however, seem to more readily invest at the seed
stage and less interested in patent stock.

34
Table A.1: VC survival estimates
VC Private VC Governmental VC Patent stock 0.872*** 0.898*** 0.732*** (0.154) (0.154) (0.213) Employees -1.128*** -1.211*** -0.956*** (0.240) (0.313) (0.334) Seed 2.566*** 2.199*** 3.773*** (0.356) (0.420) (0.740) Constant -8.106*** -9.408*** -9.412*** (0.520) (1.013) (0.826) Country dummies Yes Yes Yes Year dummies Yes Yes Yes N observations 7,520 7,854 8,103 N companies 859 859 859 Legend: The sample (panel) consists of the biotech and pharmaceutical portion of the VICO dataset. The dependent variable is the hazard ratio of obtaining a first-round investment from a VC (Column 1), from a private VC (Column 2) or from a governmental VC (Column 3) in a given year t. Estimations are performed using a Weibull regression. Patent stock is the log (1+patent stock) in year t-1. Employees is the log(1+employees) in year t-1. Seed is a dummy equal to 1 if a firm is at the seed stage in year t. ***, **, and * indicate significance at the 1%, 5%, and 10% level, respectively. Robust standard errors are in brackets below the related coefficients.