where next to reduce uncertainties in qmra of drinking ... · where next to reduce uncertainties in...
TRANSCRIPT
Where next to reduce uncertainties in QMRA of drinking water systems?
Disclaimer: This presentation does not necessarily reflect official U.S. EPA policy
Assessing Pathogen Fate, Transport and Risk in Natural & Engineered Water Treatment
Banff Conference Centre, Alberta, September 25th, 2012
Nicholas J. Ashbolt ([email protected]) U.S. EPA/ORD/Cincinnati

Key Points • Assumptions drive estimated risks
– So standardized approach needed • Source of pathogens & indicators critical
– Fecal and environmental pathogens • However, the more important role of QMRA is to
better understand a system – Hence, iterative approach as required: reduce
uncertainties & identify target control levels 2

2012 US Government Microbial Risk Assessment
Guidelines • Focus on pathogens in food and water • Prepared by the Interagency
Microbiological Risk Assessment Guideline Workgroup – Co-led by USDA & U.S. EPA
Released July, 2012 3

QMRA role in WSP
PUBLIC HEALTH STATUS
HEALTH TARGETS
Tolerable risk goal
Risk management
(WSP)
Risk
Ch
arac
teris
ation
Risk characterisation Integration into risk estimate for each pathogen under baseline and event conditions. Uncertainty analysis.
Prob
lem
Form
ulatio
n
Hazard identification Catchment to tap system description, selection of index pathogens and identification of hazardous events
Effe
ct As
sess
men
t
Dose response Selection of appropriate models for index pathogens and population exposed
Expo
sure
As
sess
men
t
Source water Pathogen concentration
Treatment Pathogen removal/inactivation
Distribution Pathogen ingress and inactivation
Consumption Volume of water consumed
Medema et al. 2006 4

Source: EPA 600-1-84-004
Total Coliform Rule (1989, 2012) E. coli
< 1 cfu/100 mL
LT2 Enhanced Surface Water Treatment Rule (2006) Cryptosporidium bins: e.g.
< 1 oocyt/10,000 L; 3-log 4-log viruses by treatment
Microbial criteria: Drinking waters
5
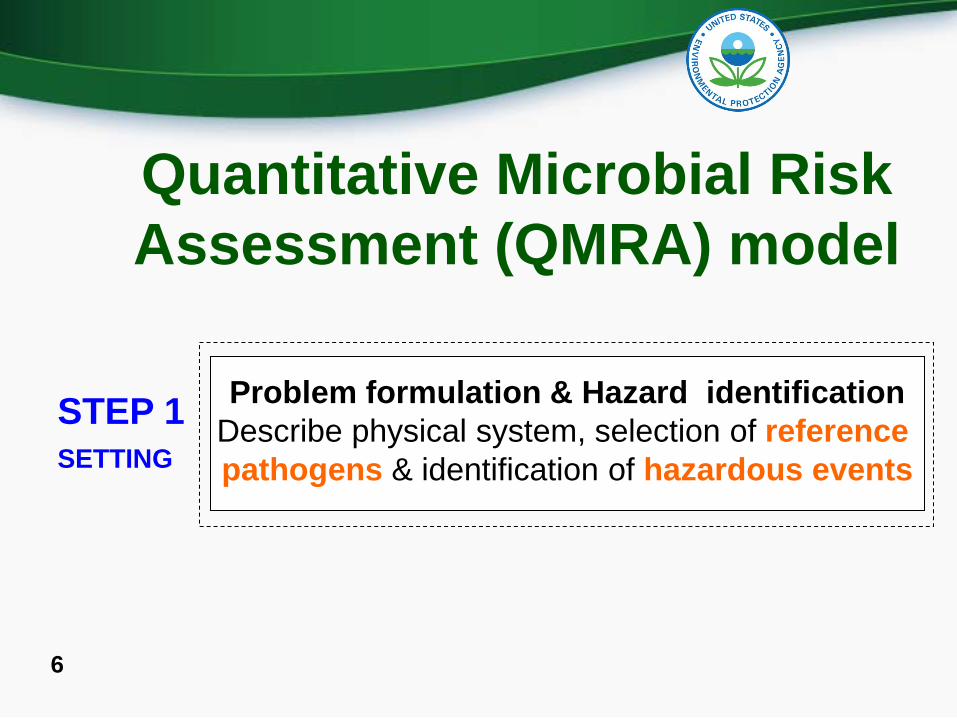
Quantitative Microbial Risk Assessment (QMRA) model
Problem formulation & Hazard identification Describe physical system, selection of reference pathogens & identification of hazardous events
STEP 1 SETTING
6
8 reference pathogens accounts for >97% of non-foodborne GI illness from known pathogens in US
Soller et al. (2010) Wat Res 44:4736-4747
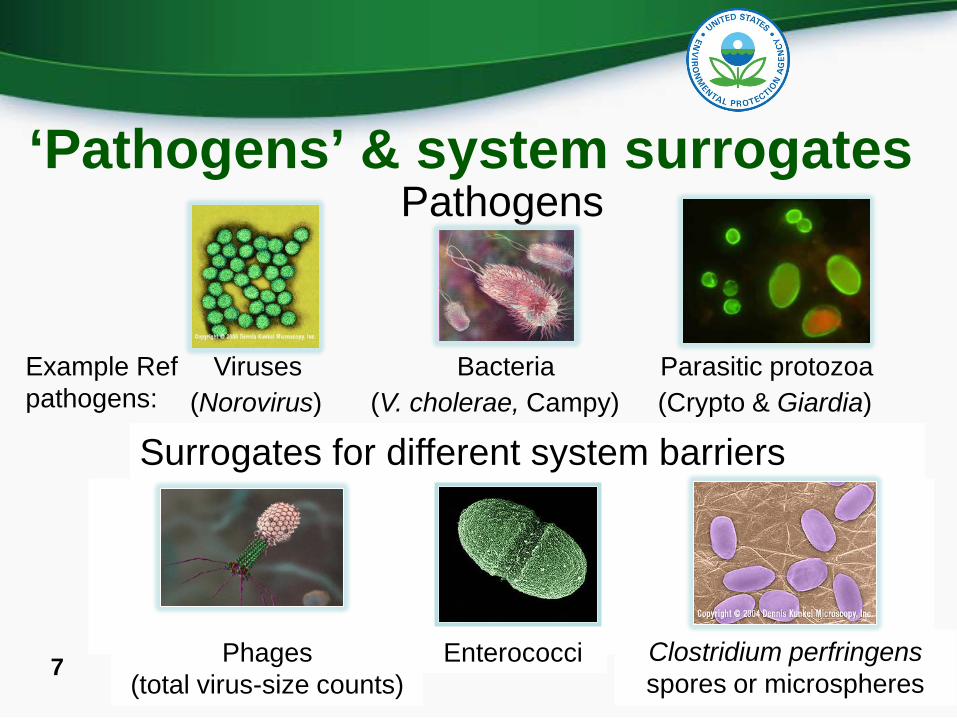
‘Pathogens’ & system surrogates Pathogens
Viruses Bacteria Parasitic protozoa (Norovirus) (V. cholerae, Campy) (Crypto & Giardia)
Example Ref pathogens:
7
Surrogates for different system barriers
Phages (total virus-size counts)
Enterococci Clostridium perfringens spores or microspheres

Epi-indicator data available
8

GM > 35 cfu GM > 33 cfu enterococci cfu/100 mL
NEEAR studies* (Wade et al., 2008, 2010)
Log10 Enterococci density / 100mL0.0 0.5 1.0 1.5 2.0 2.5 3.0 3.5
HC
GI ra
te / 1
000 s
wim
mers
-5
0
5
10
15
20
25
8 HCGI / 1000
NEEAR marine data
NEEAR fresh data
33-35 cfu/100mL
Bacterial criteria: Recreational waters
*National Epidemiological & Environmental Assessment Recreational Water (NEEAR)
Bather GI risks
9
Poorer relationship with E. coli: time to move on for freshwater/drinking water indicator?

Importance of minor human impact • Key uncertainty here
is qPCR precision? • <20% Ent. from
humans maybe sig, but qPCR MST probably not that precise
• CFU vs qPCR enterococci differ
Schoen & Ashbolt (2010) Environ. Sci. Tech. 44:2286-91 % of 35 ent /100 mL from gulls
Prob
. GI I
llnes
s
10
Risk from sewage
Risk from gulls
5-95%ile
10

GullCattle Pigs
Poultry
Raw Sewage
Secon. Efflu
ent
Prob
abilt
y of
Illn
ess
10-6
10-5
10-4
10-3
10-2
10-1
100
Fecal source matters
Wastewater Raw Treated Gull Poultry
Cattle Pig
Prob
abili
ty o
f illn
ess
For 35 enterococci/100mL
Benchmark Risk (~ 3%)
11 Soller et al. (2010) Wat Res 44: 4674-4691

Public health costs from water • CDC estimate waterborne disease costs > $970 m/y
– Addressing giardiasis, cryptosporidiosis, Legionnaires’ disease, otitis externa, and non-tuberculous mycobacterial infections, causing over 40 000 hospitalizations year-1 vs $780 m/y total GI pathogens
Collier et al. (2012) Epi Inf
Hazard identification & characterization Describe physical system, selection of reference pathogens and identification of hazardous events
STEP 1 SETTING
Disease $ / hospitalization Total cost Cryptosporidiosis $16 797 $45 770 572 Giardiasis $9 607 $34 401 449 Legionnaires’ disease $33 366 $433 752 020 NTM infection/Pulmonary $25 985 / $25 409 $425 788 469/ $194 597 422
12

DW-QMRA
Hazard identification & characterization Describe physical system, selection of reference pathogens and identification of hazardous events
STEP 1 SETTING
STEP 2 EXPOSURE
For each reference pathogen:
Source water Pathogen density (PDF)
Treatment Pathogen removal
Ingress/Growth Fecal ingress &
growth of opportunistic path’s
In-premise plumbing versus DS Consumption
Volume water inhaled/ingested
(Pingress) Distribution
Pathogen loss (biofilm/death)
13
Pathogen recovery estimates • Most important to include recoveries for waters
with ~2-10% pathogen recovery; – As 10-100 fold underestimations of path densities
• Recoveries generally not necessary in every sample if able to collect ~20 recovery samples to describe uncertainty
• Recoveries (as for all likely variables impacting results: infectivity, D-R etc.) need uncertainties to be included in reporting QMRA estimates
14 Petterson et al. 2007 J Wat Health 5(S1):51-65
Pathogens scaled over orders of magnitude in environmental waters
• Theoretically pathogen counts in drinking and source waters shown to have discrete Weibull (DW) or related discrete growth distribution (DGD) – DW & DGD offer theoretical basis for extrapolation to
important high count events, unlikely in typical pathogen datasets
– 500–1,000 random samples required for reliable assessment of mean ±10%, though 50–100 samples estimate within one log
Englehardt et al. (2012) J Wat Health 10:197–208 15
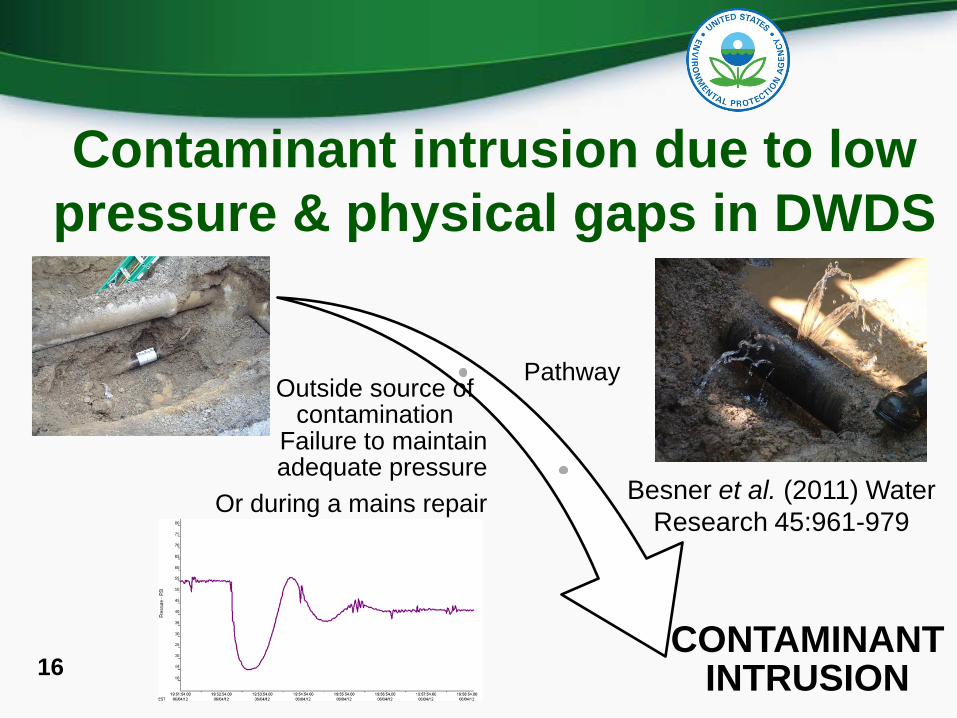
Contaminant intrusion due to low pressure & physical gaps in DWDS
Outside source of contamination
Pathway
Failure to maintain adequate pressure
Or during a mains repair
CONTAMINANT INTRUSION
Besner et al. (2011) Water Research 45:961-979
16

Distribution system biofilms • Yet to account for biofilm-sequestered fecal pathogens (intruders), let alone opportunistic pathogens (residents, e.g. Legionella, MAC, Pseudomonas aeruginosa, amoebae)
17

• Current model shows that: – For WW intrusion, Pinf Giardia > Pinf from Crypto – Starting time of intrusion greatly influences the level of
risk to which population is exposed • Increasing Cl2 residual will not necessarily reduce the
exposure, alternative strategies may be needed (i.e. booster chlorination for Giardia cysts)
– A chloramine residual does not provide significant protection against oo/cyst exposure
Intrusion model DWDS risks*
*Besner et al. (2011) Water Res 45:961-979 18
DWDS Norovirus risk* • Maintaining a chloramine residual did not
appear to significantly reduce viral risk • Effectiveness of ensuring separation distances
from sewer mains to reduce risk may be system-specific
• Leak detection/repair and cross-connection control should be prioritized in areas vulnerable to negative pressure transients
*Yang et al. (2011) J Water Health 9:291–305 19
WSP

So what next for DWDS pathogen risks?
• Intrusion risks seem real (epi & QMRA) and current chlorine residual not very effective
• While engineering vulnerabilities known, they need to be addressed as GTR & TCR-related monitoring inadequate for short-term intrusion management – Need for inexpensive ‘on-line’ intrusion monitoring
• So what analytes / target values? 20
low press. GI RR 1.6 Nygård et al (2007) Int J Epi 36:873-880

Rationale for indicator qPCR vs pathogen detection – a numbers game (~ 100-fold)
• Target pathogen density (rec water 0.03 GI risk swim-1) – e.g. for one of the most numerous known pathogens: 9 Norovrius genomes L-1 of rec water 0.03 GI risk Changing Norovirus morbidity based on infection from best estimate
0.6 to 0.1 increases target density to 80 Norovrius genomes L-1 (half to a tenth if recovery accounted for)
• Bacteroides HF183 target for same level of contamination from sewage to cause the benchmark (0.03 GI) illness: – 8600 Bacteroides HF183 genome copies L-1
Ashbolt et al. (2010) Wat Res 44:4692-4703 21

Biofilm colonization and
detachment
Inhalation
Deposition 1-1,000 CFU in lung for potential illness
QMRA for critical Legionella densities
Schoen & Ashbolt (2011) Water Res 45: 5826-5836
Critical # in DW 106 – 108 CFU L-1
based on QMRA model Needs hosts to reach that
22
Aerosolization Critical # 35 – 3,500 CFU m-3 based on QMRA model

23
Legionella risk parameter sensitivity Deposited dose
Partitioning coef.
Inhalation rate Fraction microbes aerosolized Fraction respirable aerosols
Schoen & Ashbolt (2011) Water Res 45(18): 5826-5836 23 Log Legionella density in shower water (‘cfu’ L-1)

In-situ biofilm inactivation: Legionella • Using a whole genome Legionella microarray*
• RT-qPCR assays (developed with Faucher**) • We have seen a high proportion of genes involved
in metabolism, transcription, translation, replication-repair and tRNA expressed
• Using RT-qPCR to understand biofilm & intra-amoeba stress for Legionella during drinking water disinfection & metagenomics (16 & 18 S rDNA)
24 *Hovel-Miner et al., 2009 J. Bact. 91:2461-2473
**Lu et al. (submitted)

U.S. Environmental Protection Agency 25
Single-hit D-R model: too simplistic for a range of sequelae
25 Need to understand the interactions with the human microbiome
and novel genogroup human change tests
Further research gaps Zoonotic pathogens & indicators ? • Known pathogens (Sal, Campy, EcO157 etc.):
– Source attributions? (human>cattle>pig/poultry) • Emerging pathogens & what surrogates?
– HEV, T. gondii, P. aeruginosa, amoeba-resisting bacteria…
• Antibiotic-resistant bacteria/genes from animal feeding operations & environment
26

Conclusions: what next • General treatment understood, short-term treat.
variation not – need on-line assessment &/or much larger datasets to include distribution ‘tails’ – Target levels based on QMRA to aid WSP
• Need qPCR targets correlated to actual fecal & environmental pathogens for F&T modeling – Linking pathogen densities/behavior with surrogates – Emerging roles for omics-ID/chemical markers – Emergence of ARG and antibiotic-resistant pathogens
• Dose-response models for various sequelae 27

Acknowledgements Helen Buse, Jingrang Lu, Ian Struewing,
Jorge Santo Domingo, Randy Revetta, Jacquie Thomas, Michael Storey, Eunice Chern & Dawn King
28

QMRA within risk management Explore system risks (QMRA)
Prioritize system risks
(harmonize)
Identify control surrogates & control levels
Research knowledge gaps
Reassess system
• Pathogens in sources • Surrogate fate & transport
QMRA (inputs)
• Vulnerability assessment & better SOP
validated for mains repairs & on/off of pumps to reduce pressure waves
• ‘On-line’ detection systems
Management
• Novel pathogens in sources • Molecular & physical surrogates • Source impacts/role native microbes &
as ‘new’ surrogates Research
29