where is the energy spent inside my app? fine grained ... is the energy spent inside my app? fine...
TRANSCRIPT
Where is the energy spent inside my app?
Fine Grained Energy Accounting on Smartphones with Eprof
Abhinav Pathak
Purdue University
Y. Charlie Hu
Purdue University
Ming Zhang
Microsoft Research
Abstract
Where is the energy spent inside my app? Despite the im-mense popularity of smartphones and the fact that energyis the most crucial aspect in smartphone programming, theanswer to the above question remains elusive. This paperfirst presents eprof, the first fine-grained energy profiler forsmartphone apps. Compared to profiling the runtime of ap-plications running on conventional computers, profiling en-ergy consumption of applications running on smartphonesfaces a unique challenge, asynchronous power behavior,where the effect on a component’s power state due to a pro-gram entity lasts beyond the end of that program entity. Wepresent the design, implementation and evaluation of eprofon two mobile OSes, Android and Windows Mobile.
We then present an in-depth case study, the first of itskind, of six popular smartphones apps (including Angry-Birds, Facebook and Browser). Eprof sheds lights on inter-nal energy dissipation of these apps and exposes surprisingfindings like 65%-75% of energy in free apps is spent inthird-party advertisement modules. Eprof also reveals sev-eral “wakelock bugs”, a family of “energy bugs” in smart-phone apps, and effectively pinpoints their location in thesource code. The case study highlights the fact that most ofthe energy in smartphone apps is spent in I/O, and I/O eventsare clustered, often due to a few routines. This motivates usto propose bundles, a new accounting presentation of app I/Oenergy, which helps the developer to quickly understand andoptimize the energy drain of her app. Using the bundle pre-sentation, we reduced the energy consumption of four appsby 20% to 65%.
Categories and Subject Descriptors D.4.8 [OperatingSystems]: Performance–Modeling and Prediction.General Terms Design, Experimentation, Measurement.Keywords Smartphones, Mobile, Energy, Eprof.
Permission to make digital or hard copies of all or part of this work for personal orclassroom use is granted without fee provided that copies are not made or distributedfor profit or commercial advantage and that copies bear this notice and the full citationon the first page. To copy otherwise, to republish, to post on servers or to redistributeto lists, requires prior specific permission and/or a fee.
EuroSys’12, April 10–13, 2012, Bern, Switzerland.Copyright c© 2012 ACM 978-1-4503-1223-3/12/04. . . $10.00
1. Introduction
Smartphones run complete OSes which provide full-fledged“app” development platforms, and coupled with “exotic”components such as Camera and GPS, have unleashed theimagination of app developers. According to a new re-port [1], the app market will explode exponentially to a $38billion industry by 2015, riding the huge growth in popular-ity of smartphones. Despite the incredible market penetra-tion of smartphones and exponential growth of the app mar-ket, their utility has been and will remain severely limitedby the battery life. As such, optimizing the energy consump-tion of millions of smartphone apps is of critical importance.However, the quarter million apps [2] developed so far werelargely developed in an energy oblivious manner. The keyenabler for energy-aware smartphone app development is anenergy profiler, that can answer the fundamental question ofwhere is the energy spent inside an app? Such a tool can beused by an app developer to profile and consequently opti-mize the energy consumption of smartphone apps, much likehow performance profiling enabled by gprof [3] has facili-tated performance optimization in the past several decades.
Designing an energy profiler for modern smartphonesfaces three challenges. First, it needs to track the activitiesof program entities at the granularity that a developer is in-terested in. For example, some developers may be interestedin energy drain at the level of threads, while others may de-sire to understand the energy breakdown of an app at thegranularity of routines, which are the natural building blocksfollowing the modular programming design principle.
Second, energy accounting requires tracking of powerdraw activities of various smartphone hardware components.Third, the power draw and consequently energy consump-tion activities need to be mapped to the program entitiesresponsible for them. Performing the above two tasks forsmartphones faces several major challenges. First, modernsmartphones do not come with built-in power meters. Sec-ond, and more importantly, smartphone components exhibitasynchronous power behavior, i.e., the instantaneous powerdraw of a component may not be related to the currentutilization of that component. Such asynchronous behaviorinclude: (a) Tail power state: Several components (GPS,WiFi, SDCard, 3G) have tail power states [4, 5]; (b) Per-

sistent power state wakelocks: Smartphone OSes employaggressive CPU/Screen sleeping policies and export wake-lock APIs for use by apps to prevent them from sleeping.In a typical usage, the power drain due to a wakelock per-sists beyond a program entity (e.g., a routine); (c) Exoticcomponents: Newer components like camera and GPS startconsuming high power once switched on in one entity, andoften continue till switched off by some other entity [4, 6].Such asynchronous power behavior pose challenges to cor-rectly attributing the energy consumption of the whole phoneto individual program entities.
In this paper, we study the problem of energy profilingand accounting of smartphone apps and make three concretecontributions towards enabling energy-aware app develop-
ment on smartphones. First, we present the design of eprof,the first (to the best of our knowledge) fine-grained energyprofiler for modern smartphones, and its implementation ontwo popular mobile OSes, Android and Windows Mobile.Our design leverages a recently proposed fine-grained onlinepower modeling technique [4], which accurately capturescomplicated power behavior of modern smartphone compo-nents in a system-call-driven Finite State Machine (FSM).Eprof design focuses on energy accounting policies: how tomap the power draw and energy consumption back to pro-gram entities. We explore alternate accounting policies andadopt in eprof the last-trigger policy which attributes lin-gering energy drain (e.g., tail) to the last trigger, as it moreintuitively reflects asynchronous power behavior in mappingenergy activities to the responsible program entities.
Second, we report on our experience with using eprof toanalyze, for the first time, the energy consumption of six ofthe top 10most popular apps fromAndroidMarket includingAngryBirds, Android Browser, and Facebook.Eprof exposesmany surprising findings about these popular apps: (a) third-party advertisement modules in free apps could consume65-75% of the total app energy (e.g., AngryBirds, popularchess app); (b) clean termination of long lived TCP socketscould consume 10-50% of the total energy (e.g., browserdoing google search, CNN surfing, AngryBirds, NYTimesapp, mapquest app), (c) tracking user data (e.g., location,phone stats) consumes 20-30% of the total energy (e.g.,NYTimes). In a nut shell, eprof shows that, in most popularfree apps, performing the task related to the purpose of theapp (e.g., chess algorithms in chess apps) consumes only asmall fraction (10-30%) of the total app energy.
Our experience with profiling these popular apps usingeprof revealed several key observations. (1) Our experi-ence confirms with ample evidence that smartphone appsspend a major portion of energy in I/O components such as3G, WiFi, and GPS. This suggests that compared to desk-top apps, optimizing the energy consumption of smartphoneapps should have a new focus: the I/O energy. This is espe-cially true since CPU energy optimization techniques havebeen well studied and mature techniques like frequency scal-ing have already been incorporated in smartphones. (2) Theasynchronous power behavior of smartphone I/O compo-
nents is indeed triggered often in smartphone apps, in fact inall 21 apps we tested, including popular ones such as Angry-birds and the Android browser. (3) Over the duration of anapp execution, there are typically a few, long periods of timewhen I/O components continuously stay in some high powerstate, which we term as I/O energy bundles. (4) Further, theI/O energy of an app is often due to just a few routines thatare called by different callers in the app source code, mostintuitively a consequence of modular programming practicefor I/O operations. This is in stark contrast with CPU timeprofiling (e.g., using gprof) where all routines in the appconsume some CPU time. Together observations (3) and (4)suggest that there are often only a few routines that are re-sponsible for I/O bundles.
The above observations suggest that a flat per-entity en-ergy split presentation (similar to time split reported bygprof) does not immediately help the programmer to curtailthe app energy. A presentation that is more informative andconstructive, which aims to reduce I/O energy consumption,is to identify each I/O energy bundle and present its I/O en-ergy profile. In the third part of the paper, we develop such anenergy accounting presentation which captures the routinesand their causal execution order within each energy bundle.We show how such a bundle-oriented presentation facilitatesquick understanding of the energy consumption of an appbeyond individual routines and exposes ways of programrestructuring to optimize the app’s energy consumption. Us-ing the bundle accounting information, we restructured afew apps running on the two OSes, reducing their energyconsumption by 20-65%.
2. Accounting Granularity
Energy accounting for smartphone apps answers the essen-tial question for energy optimization and debugging: whereis the energy spent inside an app? In answering this ques-tion, we need to (1) break an app into energy accountingentities, (2) track the power draw and energy activities ofeach hardware component, and (3) map the energy activitiesto the entities responsible for them. We discuss the first taskof how to track entities in this section.Granularity of Energy Accounting. The granularity of ac-counting entities depends on the level at which a developerdesires to isolate the energy bottleneck and optimize en-ergy drain, e.g., by restructuring the source code. An entitycould be one of the four conventional, well-understood pro-gram entities, a process, a thread, a subroutine, and a systemcall. In principle, an entity can be made more elaborate bythe programmer, e.g., a collection of above program entities(e.g., all routines doing networking). In this paper, we focuson the four conventional program entities and leave account-ing for more general entity definitions as future work.
Energy accounting at the system call or routine granular-ity directly exposes the root causes for energy consumptionto the developer. Splitting energy among various threads ofa process is also important as modern smartphone apps oftenconsist of a collection of code written by third-party service

providers (e.g., AngryBirds runs the third-party Flurry [7]program as a separate thread for data aggregation and ad-vertisement.) Finally, per-process accounting is relevant asall new smartphone OSes support multitasking and concur-rently running apps affect each other’s energy consumption.
Tracking Program Entities. Since system calls are whattrigger I/O components into different power states, the keyto tracking all four program entities for energy accountingis to log I/O system calls (which is already done by the on-line power modeling scheme [4]) and their call stacks whichallow us to map a system call to the calling routine, thread,and process during postprocessing. To enable accounting forCPU energy drain at the routine level, we use instrumen-tation to either log the exact routine boundaries or samplethe stack periodically to estimate CPU utilization per rou-tine [3]. Finally, we need to log the process and thread idsat each CPU context switch to enable CPU accounting perthread and per process.
3. Asynchronous Power Behavior
Modern smartphones come with a wide variety of I/O hard-ware components embedded in them. Typical componentsinclude CPU, memory, Secure Digital card (sdcard forshort), WiFi NIC, cellular (3G), bluetooth, GPS, camera(may be multiple), accelerometer, digital compass, LCD,touch sensors, microphone, and speakers. It is common forapps to utilize several components simultaneously to offerricher user experience. Unlike in desktops and servers, insmartphones, the power consumed by each I/O componentis often comparable to or higher than that by the CPU.
Each component can be in several operating modes,known as power states for that component, each draininga different amount of power. Each component has its ownbase state which is the power state where that particularcomponent consumes zero power (irrespective of other com-ponents). A component can have one or more levels of pro-ductive power states (e.g., low and high for WiFi NIC), andthe tail power state, which typically consumes less powerthan a productive power state, e.g.,WiFi, sdcard, 3G radio.1
Finally, the idle power state corresponds to the system-widepower state where the phone drains near zero power: theCPU is shut off, the screen is off, and all other componentsare turned down, except the network components which re-spond to periodic beacons.
Modern smartphones exhibit asynchronous power behav-ior where an entity’s impact on the power consumption ofthe phonemay persist until long after the entity is completed.
Tail energy. Several components, e.g., disk, WiFi, 3G, GPS,in smartphones exhibit the tail power behavior [4–6], whereactivities in one entity, e.g., a routine, can trigger a compo-nent to enter a high power state and stay in that power statelong beyond the end of the routine. This is in stark contrast
1 Special cases such as CPU frequency scaling and wireless signal strengthare handled by altering the magnitude of the power consumed in the respec-tive states as a function of these state parameter values.
with the execution time metric profiled by gprof which endspromptly when the routine returns.
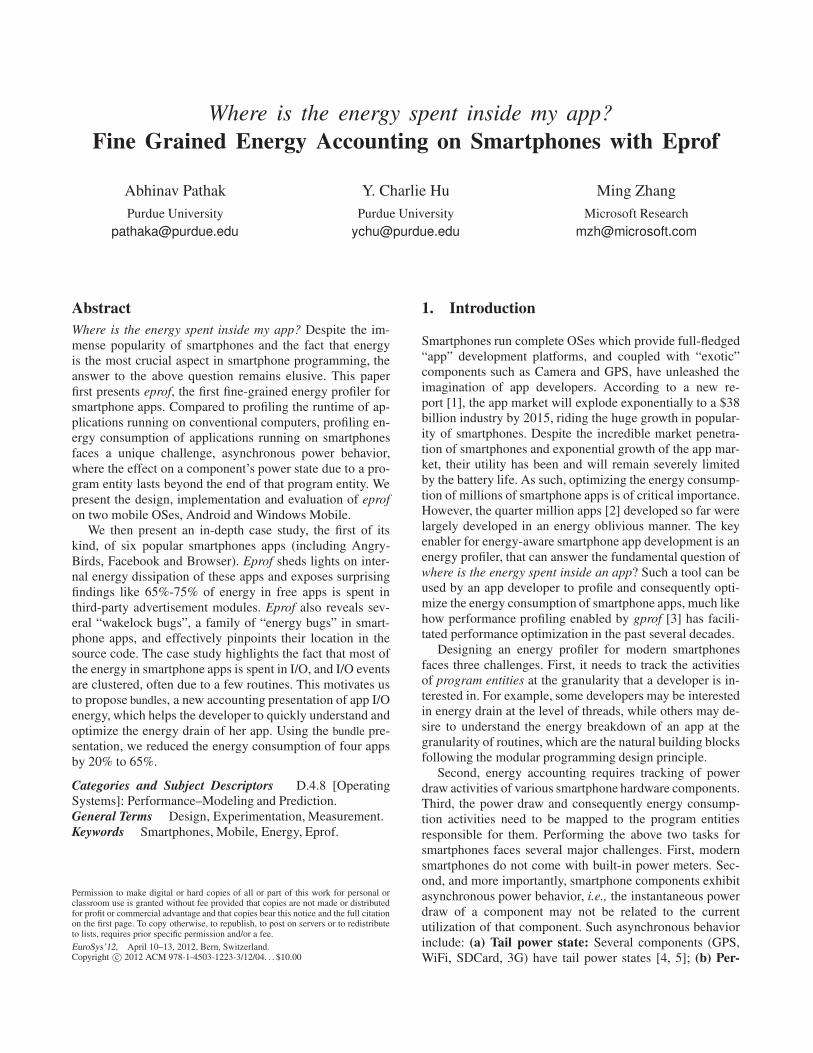
Wakelocks. Smartphone OSes apply aggressive sleepingpolicies which make smartphones sleep after a brief periodof user inactivity, and export APIs which apps need to use toensure the components stay awake, irrespective of user ac-tivities, so that apps can perform their intermittent activitiesin the background (e.g., network sync). Figure 1 shows thepower state changes due to wakelocks [8] on Android on pas-
sion (Table 1 lists the mobile phones we use throughout thepaper). For example, when wakelock PARTIAL WAKE LOCK
exported by the PowerManager class in Android is acquired,the CPU is turned on, consuming 25mA.2
Wakelocks thus present another example of asynchronouspower behavior of smartphones. A wakelock acquired bya caller entity,3 e.g., a routine, triggers a component intoa high power state. The component continues to consumepower after the entity is completed and other entities startusing the component. The component is returned back tothe idle power state when the wakelock is released, possiblyby another entity. Correctly accounting energy due to wake-locks is particularly important as it can help to track downwakelock bugs [9] (e.g., Facebook bug [10], Android eMailbug [11, 12], and Location Listener bug [13]).
Exotic components. Today’s smartphones contain severalexotic components, such as GPS, camera, accelerometer, andsensors, which consume energy differently than traditionalcomponents like CPU [4, 6]. Once these components areswitched on by an entity, they continue to drain power untilthe moment they are switched off, often by another entity.
The above asynchronous power behavior pose challengesto the second task of developing an energy accounting tool,i.e., tracking energy activities of the components. We over-come these challenges by leveraging a recently proposedonline power model for smartphones [4], which capturesthe above intricate asynchronous power behavior of mod-ern smartphones in a finite state machine (FSM). The FSMconsists of power states as the nodes and system calls as thetriggers for transitions among the power states. Using theFSM power model, system calls issued during the app exe-cution drive the FSM to different power states. For a produc-tive power state, linear regression is used to correlate the du-ration the component stays in that state with the parameters(workload) of the system call that drove the FSM to the state,and energy consumption at that state is deduced [4]. The du-ration and hence the energy consumed at tail states and statesdue to wakelock acquires and releases are straight-forward.
2 In this paper, for power measurement we directly report the current drawnin milli-Amperes (mA). The actual power consumed would be the currentdrawn multiplied by 3.7V, the voltage supply of the battery. Similarly, forenergy we directly report micro Ampere Hours (µAH); the actual energywould be the µAH value multiplied by 3.7V. The smartphone batteries arerated using these metrics and hence are easy to cross reference.3Usually wakelocks are held by framework entities in Android, whichcontrol the inactivity timeouts, based on user level policies.
Fig. 1: Wakelock FSM
(passion /Android).
Fig. 2: Send happens right after connect. Fig. 3: Send happens 5 seconds after connect.
Table 1: Mobile handsets used throughout the paper.
Name HTC- MHz OS (kernel)
magic Magic 528 Android 2.0 (Linux 2.6.34)
tytn2 Tytn II 400 WM6.5 (CE5.2)
passion Passion 1024 Android 2.3 (Linux 2.6.38)
4. Accounting Policies on Smartphones
In this section, we first use an example to show how theabove asynchronous power behavior of smartphones posesunique challenges to the third task of energy accounting, i.e.,how to attribute energy activities to the responsible programentities. We discuss alternate accounting policies and thenpresent the energy accounting policy used in eprof.
4.1 Accounting Policy Challenge: A Simple Example
The accounting policy complications due to the three asyn-chronous power behavior share the same nature: how to at-tribute an energy activity that persists beyond the triggeringprogram entity or entities. We focus on the tail energy be-havior, to illustrate the complication and design choices.
Consider a simple app that connects (in routine net
connect()), and uploads data via five sends with 10KBeach (in routine netsend()), to a server over the 3G net-work. Figure 2 plots the current draw of passion runningAndroid during the app execution. The app consumes a to-tal of 314 µAH of energy. The moment the connect systemcall is issued, the 3G radio ramps up [5, 14] power draw for2.5 seconds before the TCP handshake is started. The ram-pup consumes 61 µAH (19.5% of the entire app energy).After the handshake which consumes 11 µAH (3.5%), rou-tine netconnect() is completed, netsend() starts andperforms the five sends (which together consumes 55 µAH(17.5%)), and the app is completed. However, even after theapp completion, the device continues to draw high powerdue to the 3G radio staying in the tail power state for 6 sec-onds, consuming 187 µAH, 59.6% of the total app energy.
Figure 3 plots the power draw of the same app excepta single difference, the netsend() routine is performed5 seconds after netconnect(). This program consumes520 µAH (65% more than the original version) with thefollowing energy breakdown: rampup (60 µAH, 11.53%),connect (15 µAH, 2.88%), tail 1 (183 µAH, 35.19%), send(60 µAH, 11.53%), and tail 2 (200 µAH, 38.46%).
The above examples show that the tail energy in Figure 2would have existed even if the second routine did not ex-ist, and hence intuitively the first routine should be held ac-countable for the tail energy somehow. One simple policy isto split the tail energy among the two routines either equallyor weighted based on the workload generated. Such a pol-icy faces several problems: (1) It is not always easy to de-fine the weights based on the workload generated, e.g., inthis app, should the weight assigned to netconnect() be 3handshake packets and to netsend() be 5*10KB of pack-ets? (2) This splitting policy becomes more complicated toimplement and more obscure in understanding the profilingoutput in the presence of intermittent component accesseswhich result in interleaved productive states and tail states.(3) Splitting the tail energy may misinform the developerthat if a certain entity, e.g., netsend(), is removed, its partof tail energy could be saved.
An alternative accounting policy, termed last-trigger pol-icy, is to account the tail energy to the last entity, out ofall the entities, each of which would have triggered the tail,i.e., routine netsend() in the case of Figure 2. This ap-proach avoids the first two problems above, which makes itnot only easier to implement, but more importantly, mucheasier to understand by the programmer. However, this ap-proach still may misinform the developer that if the last trig-ger, e.g., netsend(), is removed, the tail energy would beremoved. In reality, the same amount of tail energy wouldhave been consumed irrespective of whether the last trig-ger existed. For example, in Figure 2 if netsend() did notexist, netconnect() would have also been followed by asimilar 3G tail.
We also considered other possible policies such as first-trigger, which accounts the tail energy to the first entity,out of all the consecutive entities, each of which would
have triggered the tail. Such a policy shares with last-triggerin encouraging triggers to draft behind each other to saveenergy, and in misleading developers that removing the firsttrigger would remove the tail. Out of the two, last-triggerappears slightly more intuitive; the developer can start withoptimizing the last trigger.
Finally, we argue this last “misinforming” problem existsno matter what accounting policy is used. Hence ultimately,for an accounting tool to be informative to the developer,the profiling output needs to make explicit how the energydue to asynchronous power behavior such as tail energy

Fig. 4: Sdcard FSM for
tytn2 on WM6.
Fig. 5: Assign energy to last sys-
tem call.
is accounted, and the developer needs to understand suchasynchronous power behavior to make meaningful use ofsuch energy accounting tools.
4.2 Accounting Policies for Asynchronous Power
Following the above discussion, we adopt the last-triggerpolicy in eprof: always account the energy lingering beyonda program entity due to asynchronous power behavior (e.g.,tail energy) to the last entity, out of all the entities that wouldhave triggered the power behavior. The policy will be statedexplicitly in the profiling output.
4.2.1 Tail Power State
Since tail energy is wasted as the component is not doing anyproductive work, many potential optimizations (e.g., aggre-gation [5]) are being studied to reduce tail energy. For thisreason, eprof explicitly separates tail energy from the rest,and reports an “energy tuple” (u, n), where u and n repre-sent the utilization energy and the tail energy consumption,respectively, in its profiling output.
We illustrate how the accounting policy is applied tothe tail power state behavior using an example. Figure 4shows an example of the tail power state in the FSM powermodel of sdcard on the tytn2 phone. Any file operation sendssdcard into a high power state d1 followed by a tail state d2which continues until 3 seconds of disk inactivity and thensdcard returns to the base state. Figure 5 shows an examplecontaining two entities f1 and f2. Entity f1 invokes the firstread call which sends the component to state d1, consumingu1 energy, followed by a tail consuming n1 which is cutshort by a read call, which again sends the component tod1, consuming u2. Right after entity f1 ends, f2 starts andinvokes a write call, causing the component to stay in stated1, consuming u3, followed by a tail state consuming n2.The tail state lasts beyond the completion of f2.
It is clear (u1, n1), u2 and u3 should be accounted tothe first read call, second read call and the write call,respectively. Following the last-trigger policy, n2 is chargedto the last system call before the tail state, i.e., write. Insummary, the three system calls get energy tuples (u1, n1),(u2, 0) and (u3, n2), respectively.
4.2.2 Wakelocks and Exotic Components
WakeLocks and exotic components exhibit similar asyn-chronous energy drain patterns. Each of them has an on/off
Fig. 6: Splitting energy of a component among concurrent sys-
tem calls.
switch which when turned on (a wakelock is acquired orGPS/camera is started) starts draining energy and the energydrain stops only when it is switched off (e.g., the wakelock isreleased). We discuss accounting for wakelocks below. Ac-counting for exotic components is similar.
Figure 1 shows the FSM that models the power statetransitions due to wakelocks on passion running Android. Anentity that acquires a wakelock triggers a component intoa high power state, which can persist after the entity exitsand another entity starts, until the wakelock is released bythis other entity. Following the last-trigger policy, the energyconsumed by the component during the period when thewakelock was held is attributed to the entity that acquiredthe wakelock. Accounting this way helps the developer totrack “wakelock bugs”, an important class of energy bugs inmobile apps [9] due to missing wakelock releases (§7.3).
4.3 Concurrent Accesses
When multiple threads access a component, there can beconcurrent system calls issued to the component. Figure 6shows an example where three threads simultaneously ac-cess sdcard for reading and writing files. diskread1 triggersa power state change from base to d1. While the componentis serving this request, two other threads invoke two morerequests diskwrite and diskread2.
To perform energy accounting, we first apply linear re-gression inside each productive power state to estimate thetotal duration that component stays in that state based on thetotal workload of all system calls. We then divide up the totalenergy in that state among the multiple system calls as fol-lows: we first estimate the completion time of each systemcall assuming they have the same rate of making progress,then split the whole duration into intervals, each with a dif-ferent number of concurrent system calls, and then split theenergy consumed in each interval evenly among those sys-tem calls. Such a policy is justified as follows. First, we ob-served using microbenchmarking that the time to completeI/O system calls are roughly proportional to their workload,suggesting the hardware component is mostly fair in carry-ing out concurrent system calls. Second, smartphone hard-ware does not export internal information about workloadprocessing order and hence it is difficult to develop a morerefined policy.

Fig. 7: Eprof architecture overview.
Following the above split policy, the duration while inpower state d1 is split into five intervals with varying num-bers of active system calls, and d1 is split evenly within eachinterval. The tail energy is charged to the last system callserved by the component. The final accounting of sdcard en-ergy consumption for the three calls is shown in Figure 6.
4.4 Accounting for High Rate Components
The FSM power model [4] does not cover RAM and OrganicLED screen (OLED) since these components are accessed atmuch higher rates (and hence called high rate components)resulting in high overheads in event based modeling. Tra-ditionally RAM power is modeled using LLC (Last LevelCache) Misses [15, 16], periodically polled from hardware(CPU registers). Power draw of OLED screens is dictated bypixel colors and hence can be modeled by periodically scrap-ping the screen buffer and computing the energy using sam-pled pixels [17]. However, the HTC magic does not exportLLC Misses information to the kernel, and perf events [18],the Linux performance counter system which is still new onARM architectures, does not yet support the HTC passion
handset. Also, Google stopped shipping developer phoneswith OLED screen in 2011 due to a supply shortage [19].Hence, we leave RAM/OLED accounting as future work.
5. Eprof Implementation
We describe eprof implementation at the routine granularity.Accounting at the thread and process granularities followsnaturally.
5.1 Eprof Operations
Figure 7 shows the three components of eprof: (1) codeinstrumentation and logging, (2) power modeling and energyaccounting, and (3) profile presentation. In the first phase,the app source code is instrumented for system-call tracingand routine tracing. We also discuss in §5.2 how apps builton top of the Android SDK can be logged without sourcecode. The instrumented binary is then run on the smartphoneOS/framework with system call logging enabled, to gatherboth detailed routine invocation trace and system call traceat runtime. During the second phase, the routine invocationtrace is played back while at the same time the system calltrace is used to drive the FSM power model to replay the
energy activities. The energy activities are mapped to theroutines according to the accounting policy described in §4.Finally, eprof outputs the energy profile.
5.2 Implementation
We have implemented eprof on two smartphone OSes: An-droid and Windows Mobile 6.5 (WM6). Due to page limit,we only describe our implementation on Android below.SDK Routine Tracing. Routing tracing logs routing invo-cations and the time spent per invocation. Apps written withthe Android SDK run inside the Dalvik VM. For such apps,Android provides a routine profiling framework [20] whichat runtime marks routine boundaries with timestamps andcalculates the runtime of each routine. To reduce the over-head of retrieving timestamps, we modified the current pro-filing framework to only count all caller-callee invocations,and perform periodic sampling to log the routine call stackand the time at each sampled interval, just as in gprof [3].NDK Routine Tracing. Android also provides developerswith Native Development Kit (NDK) using which they canrun performance critical parts of their apps outside the VM.For the NDK part of apps, we used the gprof port of NDKprofiler [21] to perform routine tracing, which requires link-ing with the Android gprof library.System-Call Tracing. System-call tracing logs the time andthe call stack of each system call. This is performed in theframework, the bionic C library, and the kernel. First, appswritten with SDK invoke both traditional system calls suchas network and disk and special framework events, e.g., sen-sors, location tracking, and camera.We log such system callsby inserting ADB (Android Debugger) logging APIs wherethey are implemented in the framework code [22] to log thecalls (time and parameters) and call stacks. Second, appswritten with NDK only use traditional system calls. How-ever, since Arm Linux does not support userspace backtrac-ing from inside the kernel [23], we log the calls and callstacks at the bionic C library interface. Finally, for both SDKand NDK apps, we log CPU (sched.switch) scheduling eventsin the kernel using Systemtap [24].Logging without Source Code. In general, a recompile isrequired after instrumentation for routing tracing. For theevaluation in this paper, we modified the framework to au-tomatically start and stop eprof routine and system-call trac-ing for the SDK part of all apps. This allows us to performenergy profiling without needing a recompile and hence thesource code which is often not available (e.g., the Angrybirdsapp). The source code is still required for the NDK part ofapps.Accounting. The logs collected during an app run are post-processed for accounting. We extended Traceview [25] inAndroid SDK, which currently performs runtime account-ing, to perform energy accounting and data presentation. Weadded 3K LOC to the existing 5K LOC in Traceview.Data Presentation. Eprof outputs energy tuple per entity inthe sorted order (with inclusive/exclusive energy for hier-archical entities). When routines are the entities, eprof be-

Table 2: Apps used throughout the paper.
App Description App Description
Windows Mobile (on tytn2) Android (on magic)
sd Skin Detection [26] syncdroid Mobile file synclchess Local Chess [27] streamer Photo streaming
pup Upload photo albums andoku Sudoku game [28]
cchess Cloud Chess (offload) goOut Location apppdf2txt PDF to text [29] k9mail Email Client
pslide Photo Slide show wordsrc Game [28]fft speech recog. [30] andtweet Twitter client [28]
Android (on passion )
browser Google on Browser cnn CNN on Browser
fb Facebook pup Photo uploading
ab AngryBirds mq MapQuest
nyt New York Times app fchess Free Chess [31]
comes a call-graph energy profiler; it mimics the output ofgprof [3] by replacing each time value with a (time, energy)value tuple. It also outputs a breakdown of the total energyconsumed into per-component energy consumption.
6. Evaluation
In this section, we compare eprof’s accuracy with previousaccounting approaches and measure its overhead.
Applications. Table 2 lists the set of 21 apps used in the restof the paper. Some of them are among the top 10 most pop-ular apps in Android Market while others were downloadedfrom several open-source projects [26–30].
6.1 Related Work: Previous Accounting Approaches
The energy accounting problem has been previously stud-ied in different context. We summarize the two best knownpolicies proposed: split-time and utilization-based.
The split-time energy accounting scheme simply splitsthe time into fine-grained time bins, and accounts the energyspent (typically obtained directly from a power meter) in abin to the sampled running entity (process/thread/routine) inthat bin. Powerscope [32, 33] measures power using an ex-ternal power meter and accounts energy for mobile systemslike laptops at the routine granularity using split-time ac-counting. Li et al. [34] use split-time to account OS energyon commodity hardware, using a system-wide cycle accu-rate power model to estimate instantaneous power consump-tion. Quanto [35] also uses the split-time policy to measureand account system-wide energy in sensor networks for pro-grammer defined entities.
The recently proposed Cinder [36] and PowerTutor [6,37] also perform smartphone energy accounting. They differfrom eprof in several aspects. First, they support processesas the finest accounting granularity. Second, both systemsuse utilization-based power models to model and accountenergy of each component to the processes. As shown in [4],utilization-based power models do not capture asynchronouspower behavior found in modern smartphones.
Fig. 8: Accuracy of different accounting policies.
Fig. 9: Accuracy of utilization-based model at different
granularities.
6.2 Accounting Accuracy
It is difficult to measure per-entity accounting accuracy sincethere is no easy way to measure the ground truth in thepresence of asynchronous power behavior. We expect theper-entity accounting accuracy of eprof to be the same asthat of the system-call-based power model it is based on,since the triggers for the power model, system calls, alsoform the finest granularity among the four program entitiesthat eprof profiles (§2). To compare different accountingschemes, we compare their aggregate accounting accuracy:how does the sum of per-entity energy breakdown underdifferent accounting schemes approximate that of the groundtruth, i.e., the total energy spent as measured using a powermeter [38]? We define accounting “error” as the percentagedifference of the sum of all entity energies except process 0(which does not use any hardware component) with groundtruth energy measured.
Figure 8 plots the accounting error of the three schemes,at the process granularity, for a few apps from Table 2 onAndroid on passion (results are similar for others). We seethat the error in eprof is under 6% for all apps while thatof utilization-based accounting ranges from 3% to 50% andof split-time ranges from 15% to 80%. The higher error forutilization-based accounting is a direct consequence of theerror in utilization-based power models [4]. Split-time ac-counting, which though utilizes direct power meter read-ings, performs the worst since it accounts most of the energydue to asynchronous power behavior to PID 0 (the null pro-cess), which performs no hardware activity and should beattributed zero energy.
For system-wide energy accounting at the thread and theroutine granularities, split-time and eprof report the same

errors as at the process granularity, because split-time islargely oblivious to the accounting granularity as it dividesthe time into fixed-sized bins and accounts each bin en-ergy to the sampled entity, and eprof accounts energy atthe system-call level, which is finer-grained than at the rou-tine/thread level. In contrast, utilization-based accountingshows larger error when estimating energy at finer granu-larities, as shown in Figure 9, since utilization-based powermodels incur larger errors in finer-grained estimation [4].
6.3 Logging Overhead
Measuring the logging overhead of eprof on the smartphoneapp runtime and energy consumption is tricky since smart-phone apps are interactive, i.e., their execution involve pe-riods of inactivities waiting for human input. To preventsuch inactivity periods from diluting the measured over-head, for each app in Table 2, we isolated its core partperformed in-between human interactions in calculating thelogging overhead, e.g., the code in lchess that corresponds tocomputing each computer move, in between the movesmade by the human. The logging overhead of eprof fallsbetween 2-15% for the apps on WM6 and between 4-11%for the apps on Android on the two handsets, out of whichabout 1-8% is due to system call tracing alone. Microbench-marking reveals that logging each entry in eprof (syscallor routine) consumes 2.5±0.5µs on passion (1GHz CPU),including 1.5±0.2µs overhead of getClock(), and con-sumes 30µs on tytn2 (400MHz CPU) with 10µs for readingthe clock. Since the logging only incurs overhead on CPUand memory, the energy overhead for logging is the runtimeoverhead multiplied by the CPU power, which comes downto 0.69-12.99% for the apps on WM6 and between 0.40-7.35% for the apps on Android. Finally, the logging rate(including system call tracing) for the apps varies between60-70 KB/s.
7. Applications
We report on our experience with using eprof to understandthe energy consumption of the 21 apps in Table 2. Due topage limit, we first briefly summarize the energy bottleneckof all the apps identified by eprof, and then present an in-depth analysis of the most popular 5 apps.
7.1 Identifying Energy Hotspots
Figure 10 shows the percentage time and energy of the en-ergy hotspot routine in each of the 14 apps in Table 2, listedunder WM (tytn2) and Android (magic). Already, this sum-mary exposes several interesting observations about the en-ergy consumption of these apps. (1) There is a stark con-trast in the percentage runtime and the percentage energydrain for some of the hotspot routines, e.g., goOut spendsover 20% of its energy on GPS routine attachlistenerwhich runs for under 3% of runtime. (2) The energy con-sumption behavior of two versions of the same app differsignificantly. Specifically, lchess which runs purely on mo-bile consumes 30% of its energy in checking the human
Fig. 10: Percentage runtime and energy consumption of
energy hotspots.
Table 3: Session description for the apps used in case study.
App Session Description
browser User opens browser, performs a Google search,scrolls the HTML page and closes the app.
angrybirds User plays a full game of AngryBirds hitting all
three birds and then closes the app.
fchess User plays two moves of chess game with computer.
nytimes User opens the NYTimes app, app downloads anddisplays contents, user scrolls the front page.
mapquest User starts app, app finds location, fetches map tiles
and renders, user then clicks “gas station” button.
move, while cchess spends 27% energy packing and unpack-ing program state for offloading the computation to the cloud(as in [39, 40]). (3) The profiling results of andoku and word-search, each containing thousands of routines, reveal thattheir energy bottleneck routines are for building the UI, i.e.,setTextColorView() and AddRow(), respectively.
7.2 Case Studies
We now present an in-depth analysis of 5 popular appsrunning on Android on passion. All the apps were run on 3G;we skip the WiFi runs due to page limit. Table 3 describesthe session scenario of each app used in the case study.Table 4 summarizes the statistics of the profiling runs andwhere most of the energy is spent in these apps as identifiedby eprof. It shows that running these apps for about half aminute can invoke 29–47 threads, many of which are third-party modules, and 200K–6M routine calls. The complexityof these apps is daunting; without eprof, it would be difficultto understand their energy profile. Overall, the about 30-second run of these apps drain 0.35%-0.75%of a full batterycharge, a rate which could discharge the entire battery in acouple of hours.
7.2.1 Android Browser – Google Search vs. CNN
Google search. The Android browser comes with Androidand is arguably one of the most frequently used apps onAndroid.We first profiled a 30-second run of the browser forone dominant usage: Google search, where the user opensthe browser, performs a Google search over 3G, and closes

Table 4: Summary of energy drain of 5 popular apps.
App Run- #Routine calls % 3rd-Party Modules Where is the energy spent inside an app?
time (#Threads) Battery Used
browser 30s 1M (34) 0.35% - 38% HTTP; 5% GUI; 16% user tracking; 25% TCP cond.
angrybirds 28s 200K (47) 0.37% Flurry[7],Khronos[41] 20% game rendering; 45% user tracking; 28% TCP cond.
fchess 33s 742K (37) 0.60% AdWhirl[42] 50% advertisement; 20% GUI; 20% AI; 2% screen touch
nytimes 41s 7.4M (29) 0.75% Flurry[7],JSON[43] 65% database building; 15% user tracking; 18% TCP cond.
mapquest 29s 6M (43) 0.60% SHW[44],AOL,JSON[43] 28% map tracking; 20% map download; 27% rendering
the browser. The Google search page triggers the GPS todetermine user location. The browser process consumes atotal of 2000 µAH out of which about 53%, 31%, and 16%are spent in CPU, 3G, and GPS, respectively.
The browser forks a total of 34 threads, including 4 httpworker threads, a main thread, and a Webviewcore threadbesides GC (garbage collector), DNS resolver, and otherthreads. Less than 500KB of data is transfered over 3G. Fig-ure 11(a) plots the split of the total browser energy amongdifferent threads with each thread’s energy consumptionfurther split by phone components. We gain the follow-ing insight into how the energy is spent in the browser.(1) Thread http0 consumes the most energy (28%), 24%of which is spent in 3G tail. This thread performs the bulkof http I/O (request and response). Thread http1 consumesanother 10% energy. Together, the two http threads consume38% energy. (2) Two generic Android threads, HeapWorkerand IdleReaper, consume 14% and 10% energy respec-tively. Most of their energy are spent in 3G tails as follows.IdleReaper reaps idle TCP connections after a configuredtimeout, each of which leads to a 3G tail. HeapWorker cleansup each network connection upon app exit by sending a TCPFIN packet, which also often leads to an isolated 3G tail. Thetwo threads are used in any apps that access the web, and weterm them TCP conditioning utilities. (3) Threads main andWebviewcore are responsible for loading the browser andbuilding its GUI. The main thread consumes 10% energywhich is entirely CPU. Webviewcore, which also starts GPSto track user location, consumes 24% of the total energy,with 11% and 5% spent in GPS and GPS tails, respectively.Webviewcore spends most of its energy (24%) in routineJavaWebCoreJavaBridge.handleMsg() (18%).
To understand where the energy is spent at the routinelevel, we plot in Figure 11(b) per-routine energy break-down for a few selected routines. The energy includesthat of callee routines to better capture the whole func-tion performed by the routine. The per-routine profilingclearly shows the energy breakdown among the 3 ma-jor steps of a Google search. (1) Routine android/net
/http/Connection.processRequests() which pro-cesses network requests on behalf of the browser and henceinvolves networking, consumes 35% of the browser energy(7% in CPU for processing http). (2) Processing compressedhttp response after downloading consumes 15% energy, outof which 5% is spent in decompressing the compressed htmlresponse (routine java/util/zip/GZIPInputStream
.read()). (3) Routines from class android/view/ViewRoot.javawhich renders GUI consume about 5% energy.Browsing a CNN page. When the user surfs CNN, thebrowser spawns 30 threads, and consumes a total of 2400µAH out of which about 40%, 60%, and 0% are spent inCPU, 3G and GPS, respectively. Figures 12(a)-12(b) againplot the per-thread and per-routine energy split, which drawcontrast with the Google search scenario. (1) Surfing theCNN page results in higher data download (1200 KB) andinvokes four different http threads to share downloading andparsing, which consume 26%, 9%, 11% and 8% energy, re-spectively, for a total of 54%, higher than the 38% by http0and http1 in Google search. (2) Thread IdleReaper, whichreaps idle TCP connections through routine IdleCache
.IdleReaper.run(), consumes more energy (15%) thanin Google search due to reaping more sockets. (3) Webview-core consumes only 10% energy in CPU, as it no longerstarts GPS to track user location.
These profiling results of the Android browser suggestthat TCP conditioning (reaping and proper shutdown) over3G can waste significant energy in 3G tails. We discussstrategies to reduce this energy drain in §8.3.
7.2.2 AngryBirds
We next profiled one of the most popular smartphone games,downloaded over 50M times from Android Market, angry-birds. In the profile run, the user plays a single instanceof the game over 3G, and the app spawns 35 threads. The“GLThread” thread handles gameplay and the touch events,and invokes the third-party Khronos EGL interface [41] topaint the screen for game events. It also comes bundled withFlurry [7], a third-partymobile data aggregator and ad gener-ator. Flurry runs as a separate thread, collects various statis-tics about the phone including its location, OS, and softwareversion, and uploads the data to its server. Later, it down-loads and renders ads during gameplay.
Figures 13(a)-13(b) show the energy breakdown of thetop 5 threads and routines, which provides the following in-sight. (1) The core part of the app, thread GLThread, thoughCPU intensive, consumes only 18% of the total app energy.Within the thread, the Khronos API consumes 9% energyover 1K calls made to the API routine, and the rovio ren-derer spends another 9% energy in over 1K calls. Renderingthe ad consumes 1% energy. (2) The Flurry thread consumesmost of the energy (45%). Within the thread, GPS locationtracking consumes 15% energy and its tail consumes addi-

(a) Per-thread
(b) Per-routine
Fig. 11: Google search on browser.
(a) Per-thread
(b) Per-routine
Fig. 12: CNN on browser.
(a) Per-thread
(b) Per-routine
Fig. 13: AngryBirds.
(a) Per-thread
(b) Per-routine
Fig. 14: Free Chess.
(a) Per-thread
(b) Per-routine
Fig. 15: NYTimes.
(a) Per-thread
(b) Per-routine
Fig. 16: MapQuest.
tional 4% energy; collecting the handset information con-sumes less than 1% energy (CPU only); uploading the infor-mation and downloading the ads consume 1% energy withonly under 2KB data transfered over 3G; but the 3G tailconsumes 24% energy. (3) When the app is closed, threadHeapWorker performs cleanup, closing an unclosed socketas part of the finalize method (Figure 13(b)), which createsa 3G tail consuming 28% of the app energy.
7.2.3 Free Chess
We next profiled the most popular free chess game [31] onAndroid Market, downloaded over 10M times. Like angry-birds, this app downloads ads over 3G which consumes mostof its energy. It spawns 37 threads during the 33-second
profile run. The main thread is responsible for the game-play, AdThread fetches ads over the network, and IdleReaperreaps remote server TCP connections after timeout.
Figures 14(a)-14(b) show a clear four-way energy break-down. (1) AdThread which runs third-party AdLibraryAdWhirl [42] through routine com/adwhirl/PingUrl
.run(), consumes 50% energy, almost entirely spent in 3Gtail. (2) The main thread which paints the board consumesonly 20% energy entirely in CPU through routines android/view/ViewRoot.draw() and uk/co/aifactory/fireballUI/GridBaseView.onDraw(). The user plays 2 moveswhichare responded by the computer’s AIMoves. (3) The AIMovesare computed through two different threads (AIMove1 andAIMove2), each calling routine uk/co/aifactory/chessfree
/ChessGridView.Eng.AIMove(), consuming a total of10% energy. (4) IdleReaper consumes 18% energy, againalmost entirely in 3G tail.
The above energy profiling provides an important insight:free apps like fchess and angrybirds spend under 25-35% oftheir energy on gameplay, but over 65-75% on user tracking,uploading user information, and downloading ads.
7.2.4 NYTimes
We next profiled the Android app nytimes which has beendownloaded over 10M times and is representative of thefamily of publisher provided viewing apps. The app spawns29 threads during the profile run to fetch news and displaythe news. It uses Proguard [45] to obfuscate its class andmethod names. As a result, understanding eprof output wasslightly complicated.
Figure 15(a) shows a clear four-way energy breakdown.(1) The main thread which activates GUI and displays thenews downloaded, consumes only 5.2% energy. (2) TheDownloadManager thread consumes the bulk of the appenergy (65%). It downloads about 1MB of data over 3Gand stores it in a local SQL database. Interestingly, we ob-serve after the main thread finished displaying the news,until when the app consumed only 25% of its total energy,DownloadManager continues to utilize CPU and network,draining the remaining 75% energy. (3) Like angrybirds, ny-times also runs Flurry consuming 16% of the app energy. (4)Heapworker consumes 15% energy, again mostly in 3G tail.
Figure 15(b) shows the energy split for the top 3 en-ergy consuming routines inside DownloadManager. The appspends 30% of its energy in routine task.w.a(), whichhas an obfuscated name and hence we could not infer itsfunction, 24% in deserializing the fetched content (JacksonJSON library), and 7% in the SQL database.
7.2.5 MapQuest
Finally we profiled the MapQuest location tracking app,which is representative of the family of location-orientedsearch apps. Upon starting, the app locates user location us-ing the third-party SkyhookWireless (SHW) [44] engine,downloads and deserializes (using Jackson JSON [43])map tiles, and renders the map. The user then searchesfor gas stations nearby. The app consumes a total of 3600µAH energy, split as 28%, 42%, and 30% among CPU,3G and GPS, respectively. Figures 16(a)-16(b) show thatSHW consumes 29% energy via two threads through routineSkyHook.run(), the main thread consumes 18% energyperformingGUI andmap rendering (via routine MapView.OnDraw()and JSON parsing), and routine search.gas(), invokedwhen the user clicks the gas station search button, consumes8% of the app energy, 4% of which is spent in its own 3Gtail.
The energy breakdown reveals that the ratios of 3G andGPS energy over their tails differ drastically: 3G spends 82%in its tail while GPS spends only 15% in its tail. The causeof such different tail energy footprint is the way these com-ponents are used. GPS is used for continuous tracking and
is typically turned on once to start tracking, and turned offto stop tracking, generating one GPS tail. Network transfersare often performed via intermittent sending/receiving smallamount of data, incurring many tail periods in between.
7.3 Detecting Energy Bugs
We show how eprof helps to find an instance of the class ofwakelock energy bugs [9] in FaceBook (FB). As discussedin §3, apps with background services typically use the wake-lock acquire/release APIs exposed by the smartphone OS tokeep the phone awake, e.g., to perform intermittent I/O ac-tivities. A wakelock energy bug happens when a wakelock isheld longer than necessary due to a missing lock release.
facebook.katana.HomeActivity is one of the mainactivities of the FB app. In a typical run of the app, the userlaunches the app, HomeActivity downloads and displays theFB home page, while the user navigates. When using eprof
to profile a 30-second run of the FB app (v1.3.0, released Oct2010), which spawned 50 threads, including background ser-vices, with over 2M routing calls, and consumed a total of1200 µAH energy, we observed from the per-routine pro-filing output of eprof that routine com/facebook/katana/service/FacebookService.onStart() which startsthe background service consumed 25% of the app energy,out of which 18% was attributed to routine com/facebook/katana/binding/AppSession.acquireWakeLock().This much energy due to a wakelock is suspiciously highand is typically a symptom of wakelock bugs. A close lookat the call-graph output of eprof shows the service routinenever called the release API to release the wakelock untilthe app completion. Apparently the wakelock held by theapp continued to drain power even after the app termination,by not allowing the CPU to sleep.
We decompiled the FB installer to Java source code usingded [46], and confirmed that indeed the said routine acquiredthe wakelock and never released the wakelock due to aprogramming error. FB fixed the bug in its next release(v1.3.1) which we verified as by inserting a release call ofthe wakelock as indicated by eprof.
8. Optimizing I/O Energy using Bundles
Our experience with profiling popular apps using eprof re-veals several key observations about the energy consumptionof modern smartphone apps. The observationsmotivate us topropose a new, aggregate accounting presentation called I/Oenergy bundle, which is at a higher level than the default per-entity output of eprof, yet more concisely captures where theenergy is spent in a smartphone app and more importantly,
why? Such a presentation offers more direct help to the de-veloper in optimizing the app energy.
8.1 Observations
Our extensive experience with profiling popular apps usingeprof in §7 reveals the following key observations.(1) I/O consumes the most energy. Most of the energy inan app is spent in accessing I/O components, and tail energy

Table 5: Energy breakdown summary per app.
App Total I/O Bundles #I/O Routines
Energy /total routines
Handset:tytn2 running WM6.5
pslide 92% 3 (3 Disk) 2/21
pup 57% 3 (3 NET) 3/32
Handset:magic running Android
syncdroid 50% 4 (1 NET, 3 DISK) 8/0.9K
streamer 31% 3 (3 NET) 4/1.1K
Handset:passion running Android
browser 69% 3 (2 Net, 1 GPS) 5/3.4K
angrybirds 80% 4 (3 NET, 1 GPS) 5/2.2K
fchess 75% 2 (2 NET) 7/3.7K
nytimes 67% 2 (1 NET, 1 GPS) 16/6.8K
mapquest 72% 3 (2 NET, 1 GPS) 14/7.1K
pup 70% 1 (1 NET) 3/1.1K
typically accounts for the largest fraction of the I/O energy.CPU consumes a small fraction of the app energy, most ofwhich is spent in building up the GUI of the app. The secondcolumn of Table 5 shows that most apps spend 50-90% oftheir energy in I/O.(2) I/O energy is spent in a few bundles. We observethat apps typically consume I/O energy in a few, distinctlumps. Within each lump, an I/O component actively andcontinuously consumes power, i.e., it stays in a high powerstate or the tail power state. For example, Figure 2 shows alump which consists of several network events – a connectand 5 sends which together drive the 3G FSM from the basestate to active states, and back to the base state. The 3Genergy spent in the lump consists of ramp-up energy (forconnect), energy consumed for TCP handshake and sends,and tail energy. Similarly, in browser performing a Googlesearch (§7.2), there are two overlapping I/O lumps, one of3G consisting of network connects and sends by the httpthreads, and the other of GPS consisting of GPS start/stop.
We define an I/O energy bundle as a continuous periodof an I/O component actively consuming power, which cor-responds to the duration in traversing from one instance ofthe base power state to the next in the component’s powerFSM. Table 5 (third column) shows that the high I/O energyof apps is typically spread across very few (1 to 4) bundles.(3) Very few routines perform I/O. We further observe astark contrast between the way the CPU and I/O compo-nents are utilized by smartphone apps: CPU usage is typi-cally split between thousands of routines of an app, thoughwith varying amount, whereas I/O activities arise from veryfew routines, called by many callers. The intuition behindthis finding is that modular programming dictates imple-menting a few generic routines to perform I/O activities,rather than dispersing them throughout the code. For exam-ple, in event based I/O programming with select(), the rou-tine containing the select loop performs nearly all the net-work I/O of the app. In MapQuest, routine runRequest()in com/mapquest/android/util/HttpUtil.java per-
forms all the HTTP requests. Table 5 (last column) showsthat the number of routines performing I/O versus the to-tal number of routines called by each app (on Android thisincludes framework routines called by the app). We ob-serve that very few routines, between 4 to 8, are responsiblefor driving I/O components. MapQuest and NYTimes showhigher numbers as third-party threads perform their own I/O.
8.2 Bundle Presentation
The above three observations reveal a key insight into howenergy is spent in an app: I/O energy accounts for the bulk ofan app’s energy, and it arises in a few bundles, each of whichinvolves a few I/O performing routines. This insight suggeststhat a more direct way of helping a developer to understandand optimize the energy consumption of an app is to focuson its I/O energy bundles. We thus propose a bundle-centricaccounting presentation which consists of an FSM of theI/O component for each bundle during the app execution,annotated with the relevant routines triggered during thatbundle.We show in our case study below that one FSM oftencaptures multiple occurrences of identical bundles.
The bundle presentation is generated as follows. For eachbundle captured during the app execution, the productivepower states of the FSM of the component are first anno-tated with the syscall events and hence routines that drovethe FSM to those states. Since very few routines are respon-sible for I/O activities, it is easy to visualize this small setof routines in the annotated FSM. Next, for each instancethe component spends in the tail state, we annotate the tailstate with the routines called by the app during that period,including routines that use other components, usually CPU.Since the app can call several (possibly thousands) routinesduring a tail state, we only include the top three most time-consuming routines during the tail state.
8.3 Case Studies
Now understanding the I/O energy of an app boils down totwo questions: why are there so many bundles and why iseach bundle so long? We have used the bundle accountingpresentation to quickly gain insights to these questions andconsequently hints on how to optimize the I/O energy ofnearly all the apps in Table 5. Due to page limit, we presentour experience with four apps below.
8.3.1 Why is a bundle Long?
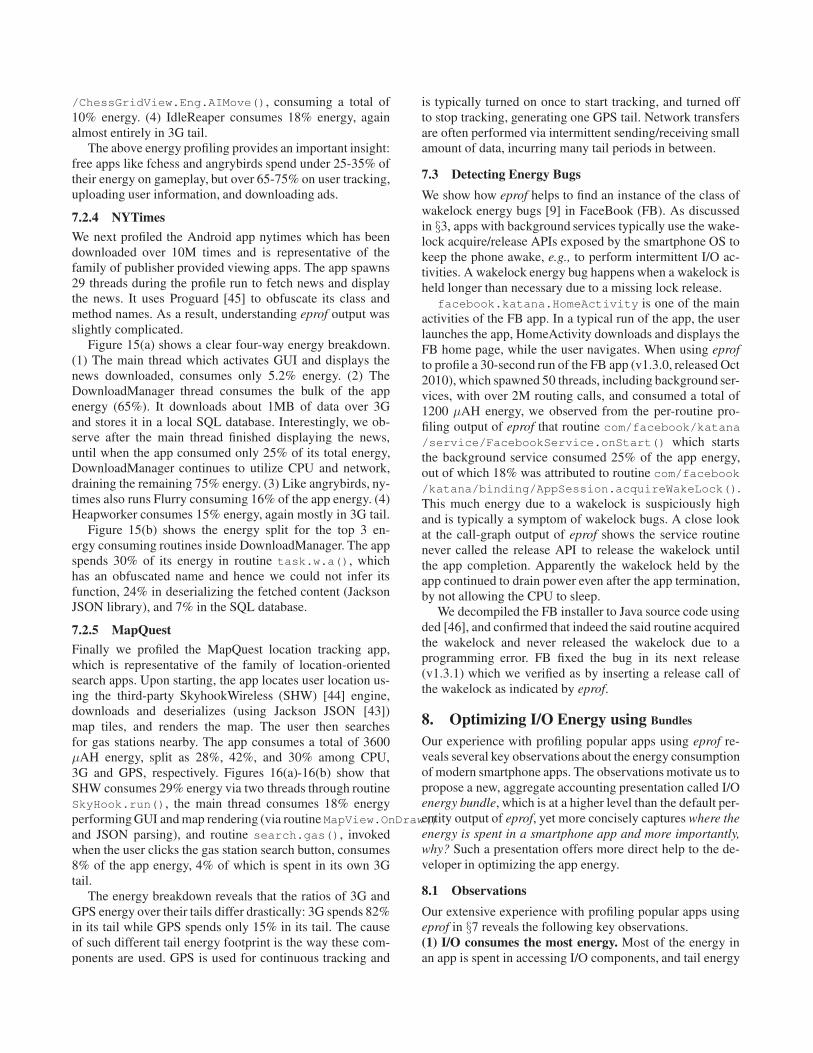
Pup. Figure 17 shows the bundle presentation for pup dur-ing a 30-second app run, which consists of a single 3G bun-
dle that lasts 25 seconds, consuming 70% of the app energy.The bundle presentation clearly shows why the bundle con-sumes 70% energy. It shows that once one photo is sent (inNet High state), the FSM returns to the 3G tail state, dur-ing which time it reads the next photo, computes a hash forit, and again uploads it over the network. The app performsCPU computation during the 3G tail which elongates the 3Gtail; the tail could have been shorter if the app uploaded thenext photo sooner. Further, the above interleaving of net-work and computation activities happens three times. Such
Fig. 17: Bundles in Pup. Fig. 18: Bundles in NYTimes. Fig. 19: Bundles in PSlide. Fig. 20: A bundle in FChess.
information gives the programmer the hint that the app’s I/Oenergy can be cut down by aggregating network activitieswhich would reduce the three 3G tails into one.NYTimes. Figure 18 shows the single 3G bundle of Down-loadManager thread. Similarly as pup, this bundle performsperiodic I/O and computation 18 times to build its database.In each iteration, it reads one chunk of data and stores it intoits database after deserializing.
8.3.2 Why Are There So Many bundles ?
Pslide. Figure 19 shows three similar looking bundles duringthe app run. Routine ReadPic() reads a photo from sdcardwhich triggers sdcard into a high power state followed by thetail state consuming 75mA. During the tail state, the app dis-plays the photo and sleeps for 5 seconds, during which (after3 seconds) the FSM returns to the base state. This processis repeated three times. The bundle presentation shows thatthe three separate bundleswaste three tail energies. The threebundles could be merged into one which incurs only one tailby aggregating the reading of sdcard photos.FChess. Figure 20 shows the first bundle where app com-ponent Adwhirl [42] fetches ads over 3G. Once the ad isfetched and displayed, the thread goes to sleep and the 3GFSM returns to tail. The second bundle (not shown) involv-ing IdleReaper and its 3G tail (§7.2.3) can be avoided if thisthread cleans up its TCP connections.
8.3.3 Optimizing I/O Energy
The case studies above show how bundle analysis gives hintson restructuring the source code to minimize the numberof bundles and the length of each bundles. For the apps forwhich we had source code, we reorganized the code structureby following these hints. Rerunning the restructured appsshows pslide, pup, streamer, and syncdroid reduced theirtotal energy by 65%, 27%, 23% and 20%, respectively,
9. Related Work
Application profilers. Performance profiling is a long stud-ied topic. Running time profiling has been proposed at theapplication level [3, 47, 48] to monitor the call graph traceand estimate the running time of routines, for object orientedlanguages [49, 50], and at the kernel level [51]. Eprof is con-cerned with profiling energy consumption which is not lin-ear as time. Several energy profiling schemes have been pro-posed for desktops [34], for mobile devices [52], and for sen-sor networks [53]. These schemes estimate the energy con-sumption of a routine based on strict time boundaries of the
routines and hence can incur significant error when appliedto profiling smartphone apps (§6).Characterizing smartphone energy consumption. Carrolland Heiser [54] measured the power consumed by differentphone components under different application loads by hard-wiring individual power meters to different phone compo-nents. Shye et al. [55] and Zhang et al. [6] built linear regres-sion based models for modeling app level power consump-tion and profiled several apps including Google Map andBrowser. All these work measure per-app or per-componentenergy drain on smartphones. Eprof is capable of measuringintra-app energy consumption and gives insights into energybreakdown per thread and per routine of the app.Mobile energy optimization. Finally, a number of special-ized energy saving techniques on mobiles have been pro-posed, e.g., for specific applications on mobile systems [56,57], for a specific protocol [58, 59], via offloading [39, 40],and via delaying communication [60]. Eprof is a general-purpose fine-grained energy profiler that directly assists anapp developer in the app energy optimization cycle.
10. Conclusion
This paper makes three contributions towards answering theultimate question faced by millions of smartphone users anddevelopers today: Where is the energy spent inside my app?
We first present eprof, the first fine-grained energy profilerfor smartphone apps and its implementation on Android andWindows Mobile. Eprof adopts the last-trigger accountingpolicy to most intuitively capture asynchronous power be-havior of modern smartphone components in mapping en-ergy activities to the responsible program entities. We thenpresent an extensive, in-depth study using eprof to gain in-sight of energy usage of smartphone apps using a suite of21 apps. Finally, we propose bundles, a new presentation ofenergy accounting, that helps app developers to quickly un-derstand and optimize the I/O energy drain of their apps.
Eprof opens up new avenues for studying smartphone en-ergy consumption. It can be readily used to compare the en-ergy efficiency of different implementations of the same app(e.g., Firefox vs. the Android browser). The energy account-ing engine of eprof can be combined with compiler tech-niques such as static analysis to develop energy optimizersthat automate the process of restructuring app source code toreduce their energy footprint, and with the OS scheduler todevelop energy-aware process scheduling algorithms.

Acknowledgments
We thank the reviewers for their helpful comments, and es-pecially our shepherd, George Candea, whose detailed feed-back significantly improved the paper and its presentation.Abhinav Pathak was supported in part by a 2011 Intel PhDFellowship.
References[1] “Mobile app internet recasts the software and services
landscape.” URL: http://tinyurl.com/5s3hhx6[2] “Apples app store downloads top 10 billion.” URL: http://
www.apple.com/pr/library/2011/01/22appstore.html[3] S. L. Graham, P. B. Kessler, and M. K. McKusick, “gprof: A
call graph execution profiler,” in Proc. of PLDI, 1982.[4] A. Pathak, Y. C. Hu, M. Zhang, P. Bahl, and Y.-M. Wang,
“Fine-grained power modeling for smartphones using system-call tracing,” in Proc. of EuroSys, 2011.
[5] N. Balasubramanian and et.al., “Energy consumption in mo-bile phones: a measurement study and implications for net-work applications,” in Proc of IMC, 2009.
[6] L. Zhang and et.al., “Accurate Online Power Estimation andAutomatic Battery Behavior Based Power Model Generationfor Smartphones,” in Proc. of CODES+ISSS, 2010.
[7] “Flurry: Mobile analytics.” URL: http://www.flurry.com/[8] “Android powermanager: Wakelocks.” URL: http://developer.
android.com/reference/android/os/PowerManager.html[9] A. Pathak, Y. C. Hu, and M. Zhang, “Bootstrapping energy
debugging for smartphones: A first look at energy bugs inmobile devices,” in Proc. of Hotnets, 2011.
[10] “Facebook 1.3 not releasing partial wake lock.” URL: http://geekfor.me/news/facebook-1-3-wakelock/
[11] “Email 2.3 app keeps awake when no data connectionis available.” URL: http://www.google.com/support/forum/p/Google+Mobile/thread?tid=53bfe134321358e8
[12] “Email application partial wake lock.” URL: http://code.google.com/p/android/issues/detail?id=9307
[13] “Using a locationlistener is generally unsafe for leaving apermanent partial wake lock.” URL: http://code.google.com/p/android/issues/detail?id=4333
[14] F. Qian, Z. Wang, A. Gerber, Z. Mao, S. Sen, andO. Spatscheck, “Characterizing radio resource allocation for3g networks,” in Proc of IMC, 2010.
[15] A. Kansal, F. Zhao, J. Liu, N. Kothari, and A. Bhattacharya,“Virtual machine power metering and provisioning,” in Proc.of SOCC, 2010.
[16] F. Rawson, “MEMPOWER: A simple memory power analysistool set,” IBM Austin Research Laboratory, 2004.
[17] M. Dong, Y. Choi, and L. Zhong, “Power modeling of graphi-cal user interfaces on OLED displays,” in Proc. of DAC, 2009.
[18] “perf: Linux profiling with performance counters.” URL:https://perf.wiki.kernel.org/
[19] “Android debug class.” URL: http://en.wikipedia.org/wiki/Nexus One#Hardware
[20] “Android debug class.” URL: http://developer.android.com/reference/android/os/Debug.html
[21] “Android ndk profiler.” URL: http://code.google.com/p/android-ndk-profiler/
[22] “Cyanogenmod.” URL: http://www.cyanogenmod.com/[23] “Introducing utrace.” URL: http://lwn.net/Articles/224772/[24] “System tap.” URL: http://sourceware.org/systemtap/[25] “Profiling with traceview.” URL: http://developer.android.
com/guide/developing/debugging/debugging-tracing.html[26] “Skin recognition in c#.” URL: http://www.codeproject.com/
KB/cs/Skin RecC .aspx[27] “C# micro chess (huo chess).” URL: http://archive.msdn.
microsoft.com/cshuochess[28] “Open source Android app.” URL: http://en.wikipedia.org/
wiki/List of open source Android applications[29] “itextsharp.” URL: http://itextsharp.sourceforge.net/
[30] “Exocortex.dsp: C# complex number and fft library formicrosoft .net.” URL: http://www.exocortex.org/dsp/
[31] “Chess free: Ai factory limited.” URL: https://market.android.com/details?id=uk.co.aifactory.chessfree
[32] J. Flinn and M. Satyanarayanan, “Powerscope: A tool forprofiling the energy usage of mobile applications,” in Proc.of WMCSA, 1999.
[33] F. Jason and S. Mahadev, “Energy-aware adaptation for mo-bile applications,” in Proc. of SOSP, 1999.
[34] T. Li and L. John, “Run-time modeling and estimation ofoperating system power consumption,” SIGMETRICS, 2003.
[35] R. Fonseca, P. Dutta, P. Levis, and I. Stoica, “Quanto: Track-ing energy in networked embedded systems,” in OSDI, 2008.
[36] A. Roy, S. M. Rumble, R. Stutsman, P. Levis, D. Mazieres,and N. Zeldovich, “Energy management in mobile deviceswith the Cinder operating system,” in Proc. of EuroSys, 2011.
[37] “Power monitor for Android.” URL: http://powertutor.org/[38] “Monsoon power monitor.” URL: http://www.msoon.com/
LabEquipment/PowerMonitor/[39] E. Cuervo, B. Aruna, D. ki Cho, A. Wolman, S. Saroiu,
R. Chandra, and P. Bahl, “Maui: Making smartphones lastlonger with code offload,” inMobiSys, 2010.
[40] B.-G. Chun and P. Maniatis, “Augmented Smartphone Appli-cations Through Clone Cloud Execution ,” in HotOs, 2009.
[41] “Khronos: Egl interface.” URL: http://www.khronos.org/[42] “Adwhirl by admod.” URL: https://www.adwhirl.com/[43] “Jackson: Json processor.” URL: http://jackson.codehaus.org/[44] “Skyhook: Location positioning, context and intelligence.”
URL: http://www.skyhookwireless.com/[45] “Android proguard.” URL: http://developer.android.com/
guide/developing/tools/proguard.html[46] “Decompiling apps.” URL: http://siis.cse.psu.edu/ded/[47] G. C. Murphy, D. Notkin, W. G. Griswold, and E. S. Lan, “An
empirical study of static call graph extractors,” ACM Trans.Softw. Eng. Methodol., vol. 7, April 1998.
[48] J. Spivey, “Fast, accurate call graph profiling,” Software:Practice and Experience, 2004.
[49] M. Dmitriev, “Profiling Java applications using code hotswap-ping and dynamic call graph revelation,” in Proceedings ofthe 4th International Workshop on Software and Performance.ACM, 2004, pp. 139–150.
[50] D. Grove, G. DeFouw, J. Dean, and C. Chambers, “Call graphconstruction in object-oriented languages,” ACM SIGPLANNotices, vol. 32, no. 10, pp. 108–124, 1997.
[51] “Oprofile.” URL: http://oprofile.sourceforge.net/news/[52] K. Asanovic and K. Koskelin, “EProf: an energy profiler for
the iPAQ,” MS Thesis, MIT 2004.[53] T. Stathopoulos, D. McIntire, and W. Kaiser, “The energy
endoscope: Real-time detailed energy accounting for wirelesssensor nodes,” in IPSN, 2008.
[54] A. Carroll and G. Heiser, “An analysis of power consumptionin a smartphone,” in Proc. of USENIX ATC, 2010.
[55] A. Shye, B. Scholbrock, and G. Memik, “Into the wild: study-ing real user activity patterns to guide power optimizations formobile architectures,” in Proc. of MICRO, 2009.
[56] Y. Wang, J. Lin, M. Annavaram, Q. Jacobson, J. Hong, B. Kr-ishnamachari, and N. Sadeh, “A framework of energy efficientmobile sensing for automatic user state recognition,” in Proc.of Mobisys, 2009.
[57] S. Kang, J. Lee, H. Jang, H. Lee, Y. Lee, S. Park, T. Park,and J. Song, “Seemon: scalable and energy-efficient contextmonitoring framework for sensor-rich mobile environments,”in Proc. of Mobisys, 2008.
[58] Y. Agarwal, R. Chandra, A. Wolman, P. Bahl, K. Chin, andR. Gupta, “Wireless wakeups revisited: energy managementfor voip over wi-fi smartphones,” in Proc. of Mobisys, 2007.
[59] F. Qian, Z. Wang, A. Gerber, Z. Mao, S. Sen, andO. Spatscheck, “Profiling resource usage for mobile applica-tions: a cross-layer approach,” in Proc. of Mobisys, 2011.
[60] M. Ra, J. Paek, A. Sharma, R. Govindan, M. Krieger, andM. Neely, “Energy-delay tradeoffs in smartphone applica-tions,” in Proc. of Mobisys, 2010.