where does the future of singapore lie? - jesus...
TRANSCRIPT

Industrial Policy, Capabilities, and Growth:
Where does the Future of Singapore lie?
Jesus FelipeAsian Development Bank

Purpose of the talk
•
Understand the economic challenges that Singapore faces
•
Discuss policy options for Singapore during the next 20 years
•
Question: Where do you want to be as a nation in 2030?
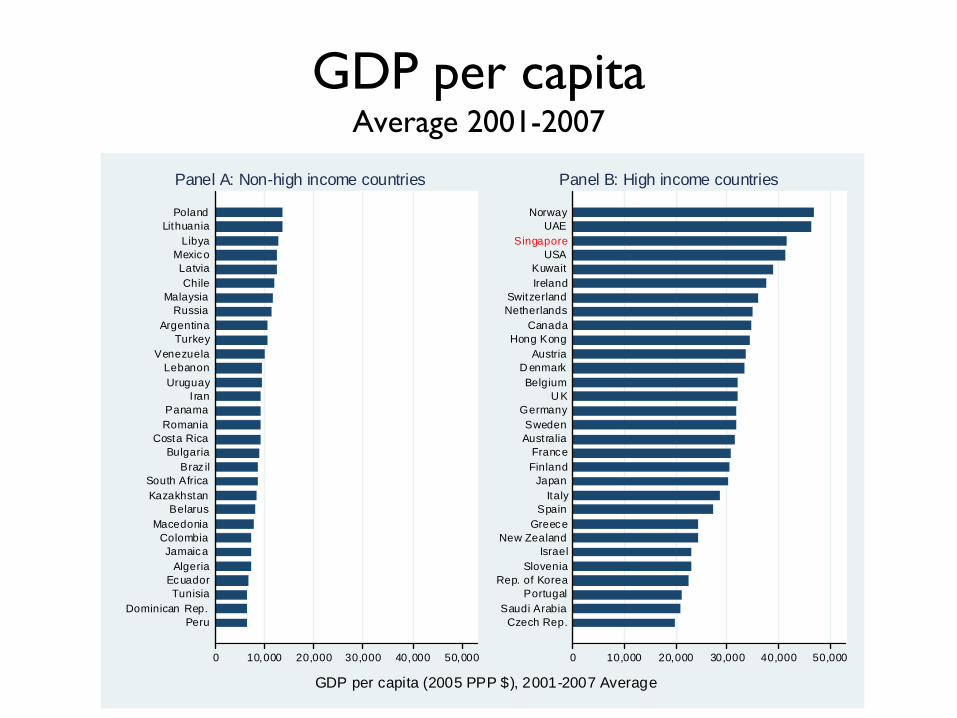
GDP per capita Average 2001-2007
0 10,000 20,000 30,000 40,000 50,000
PeruDominican Rep.
TunisiaEcuador
AlgeriaJamaica
ColombiaMacedonia
BelarusKazakhstanSouth Africa
Braz ilBulgaria
Costa RicaRomaniaPanama
IranUruguayLebanon
VenezuelaTurkey
ArgentinaRussia
MalaysiaChile
LatviaMexico
LibyaLithuania
Poland
Panel A: Non-high income countries
0 10,000 20,000 30,000 40,000 50,000
Czech Rep.Saudi Arabia
PortugalRep. of Korea
SloveniaIsrael
New ZealandGreece
SpainItaly
JapanFinlandFrance
AustraliaSweden
GermanyU K
BelgiumD enmark
AustriaHong Kong
CanadaNetherlandsSwitzerland
IrelandKuwait
USASingapore
UAENorway
Panel B: High income countries
GDP per capita (2005 PPP $), 2001-2007 Average

Presentation (1)
•
Productivity and Long-Run Growth
•
Structural Change: Export Sophistication and Diversification in Singapore
•
The Product Space–
Singapore’s Product Space

Presentation (2)
•
What to do? –
Constraints
–
What determines productivity?–
What new areas?
–
The role of Industrial Policy
•
What does the future of Singapore lie?

GDP per capita, labor productivity, and employment
100
200
300
400
500
Con
stan
t 200
0 U
S$
1975 1980 1985 1990 1995 2000 2005 2008
GDP per capita
Labor productivity
Total employed-Population ratio
Data source: World Development Indicators and ADB Stati stical Database.

Long-run growth is about
–
Structural change: transformation of the production and export structures (what and how); technological upgrading
–
Intra (S’pore:
50% each ind. and serv.) vs. Inter (S’pore:
nothing) sector productivity
growth–
Structural change is policy induced (comparative advantage is manufactured) and requires planning

Export sophistication
of the top 20 exports in 2007: a single product represents 15% of total exports
Description Sophistication 1962 1965 1975 1985 1995 2005 2007Electronic microcircuits 17,281 4.6 11.7 19.8 14.6Peripheral units, including control and adapting units 18,229 1.1 2.8 9.4 3.7Parts, nes of and accessories for machines of headings 7512 and 752
18,885 5.4 7.8 7.4 2.9
Crystals, and parts, nes of electronic components of heading 776
23,284 1.0 0.7 2.1 2.4
Oxygen-function amino-compounds 26,407 0.2 0.1 2.0 2.4Medicaments (including veterinary medicaments) 23,588 0.3 0.2 0.5 0.8 0.2 1.4 2.0Television, radio-broadcasting; transmitters, etc 21,744 0.0 0.1 0.3 2.5 1.6Organo-sulphur compounds 27,575 0.0 0.0 1.3 1.2Cyclic hydrocarbons 19,825 0.3 0.6 1.4 1.0Heterocyclic compound; nucleic acids 29,365 0.6 0.9 1.4 1.0Switches, relays, fuses, etc; switchboards and control panels, nes
17,255 0.0 0.8 1.1 1.0 0.8
Parts, nes of and accessories for apparatus falling in heading 76
18,887 0.7 2.0 2.8 1.5 0.8
Complete digital central processing units; digital processors
23,685 0.1 3.1 0.9 0.7
Machinery for specialized industries and parts thereof, nes
23,948 0.3 0.5 0.6 0.7
Other electrical machinery and equipment, nes 17,468 0.1 0.0 1.5 1.2 1.4 1.1 0.7Diodes, transistors, photocells, etc 15,271 0.0 0.8 0.8 1.3 0.7Polyethylene 20,811 0.6 0.4 0.8 0.7Other polymerization and copolymarization products 24,342 0.0 0.2 0.8 0.6Tugs, special purpose vessels and floating structures 8,070 0.0 0.0 0.6 1.1 0.8 0.6 0.6Chemical products and preparations, nes 22,738 0.2 0.1 0.2 0.3 0.3 0.6 0.5
0.5 0.3 3.7 21.0 36.4 58.0 39.78,369 7,756 13,674 15,922 18,937 18,840 18,050
Note: "Special transactions, commodity not classified according to class" excluded.
SubotalSophistication at the country level

Trend in export sophistication
5,000
10,000
15,000
20,000
EXP
Y 20
05 P
PP
$
1962 1967 1972 1977 1982 1987 1992 1997 2002 2007
China Germany Rep. of Korea Japan
Malaysia Singapore Thailand USA
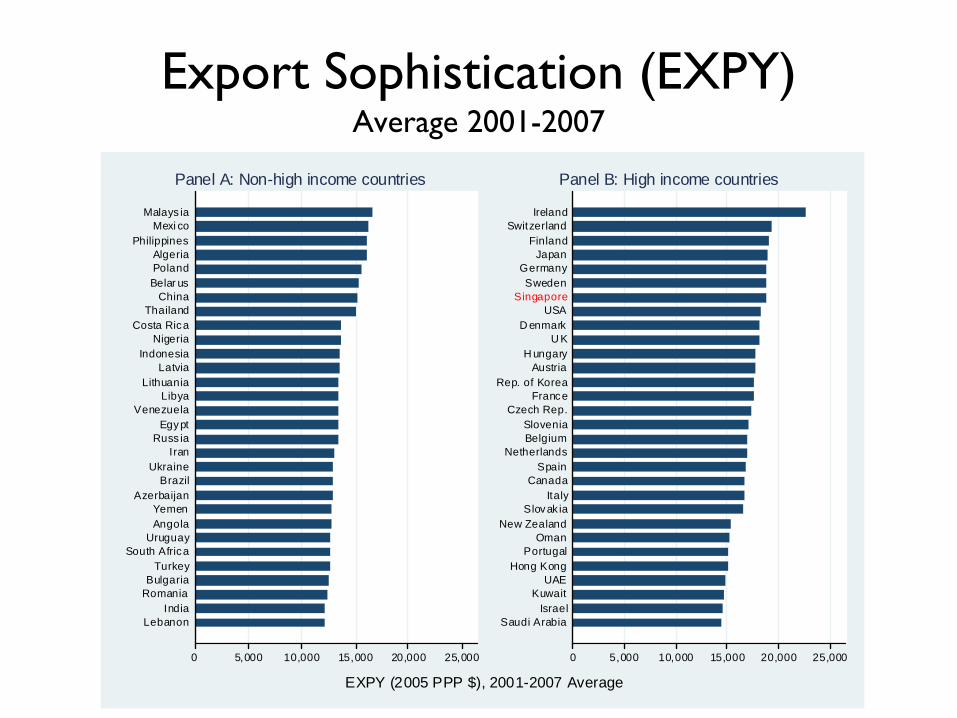
Export Sophistication (EXPY) Average 2001-2007
0 5,000 10,000 15,000 20,000 25,000
LebanonIndia
RomaniaBulgaria
TurkeySouth Africa
UruguayAngolaYemen
AzerbaijanBrazil
UkraineIran
Russ iaEgypt
VenezuelaLibya
LithuaniaLatvia
IndonesiaNigeria
Costa RicaThailand
ChinaBelar usPolandAlgeria
PhilippinesMexi co
Malays ia
Panel A: Non-high income countries
0 5,000 10,000 15,000 20,000 25,000
Saudi ArabiaIsrael
KuwaitUAE
Hong KongPortugal
OmanNew Zealand
Slovak iaItaly
CanadaSpain
NetherlandsBelgiumSlovenia
Czech Rep.France
Rep. of KoreaAustria
H ungaryU K
D enmarkUSA
SingaporeSweden
GermanyJapan
FinlandSwitzerland
Ireland
Panel B: High income countries
EXPY (2005 PPP $), 2001-2007 Average

Export diversification
according to Leamer’s
Classification
1962 1965 1975 1985 1995 2005 2007
Petroleum 4 6 7 8 8 3 2
Raw materials 7 4 7 8 5 5 6
Forest products 8 6 10 9 3 1 1
Tropical agriculture 8 9 10 8 6 5 4
Animal products 11 10 14 11 5 5 3
Cereals 12 14 13 13 8 6 4
Labor intensive 12 11 19 17 6 12 9
Capital intensive (exc. Metals) 0 3 9 4 1 2 2
Core products:
Metal products 6 7 7 5 1 1 0
Machinery 6 3 28 42 44 43 37
Chemicals 5 3 7 12 13 32 25
Total 79 76 131 137 100 115 93
Note: No. products exported with RCA>1

Diversification Average 2001-2007
0 50 100 150 200 250 300 350
PeruUruguay
JordanMacedonia
PanamaKenya
PakistanGuatemala
BosniaColombia
TunisiaMexi co
Viet NamBelar us
EgyptLebanon
ArgentinaLatvia
UkraineBrazil
LithuaniaRomaniaThailand
South AfricaBulgaria
IndonesiaTurkey
IndiaChina
Poland
Panel A: Non-high income countries
0 50 100 150 200 250 300 350
IrelandNorway
SingaporeAustralia
New ZealandIsrael
Rep. of KoreaFinland
Hong KongH ungarySlovak ia
JapanPortugal
Croat iaCanada
SwitzerlandSwedenGreece
D enmarkSlovenia
NetherlandsU K
AustriaCzech Rep.
BelgiumSpain
FranceUSAItaly
Germany
Panel B: High income countries
Diversif ication, 2001-2007 Average

Diversification and GDP per capita
AGO
ALB
ARE
ARG
ARM
AUS
AUT
AZEBDI
BEL
BENBFABGD
BGR
BIHBLR
BOL
BRA
CAF
CANCHE
CHL
CHN
CIV
CMRCOG
COL
CRI
CZE
DEU
DNK
DOM
DZA
ECU
EGY
ESP
ETH
FIN
FRA
GBR
GEOGHA
GIN
GRC
GTM
HKG
HND
HRV
HTI
HUN
IDN
IND
IRLIRN
ISR
ITA
JAM
JOR
JPN
KAZ
KEN
KGZ
KHM
KOR
KWT
LAO
LBN
LBR LBY
LKA
LTULVA
MARMDA
MDG
MEXMKD
MLIMNG
MOZ
MRT
MWI
MYS
NER
NGA
NIC
NLD
NORNPL
NZL
OMN
PAK PANPERPHL
PNG
POL
PRT
PRY
ROM
RUS
RWA
SAUSDN
SENSGP
SLE
SLV
SVK
SVNSWE
SYR
TCD
TGO
THA
TJKTKM
TUN
TUR
TZA
UGA
UKR
URY
USA
UZBVEN
VNM
YEM
ZAF
ZMB
0
100
200
300
400
Div
ersi
ficat
ion,
200
1-20
07 A
vera
ge
0 10,000 20,000 30,000 40,000 50,000GDP per capita (2005 PPP $), 2001-2007 Average
Note: Countries with population less than 2 million were excluded.

Standardness
and Diversification
AGOALB
ARE
ARG
ARM
AUS
AUT
AZEBDI
BEL
BEN
BFA
BGD
BGR
BIH
BLR
BOL
BRA
CAF
CAN
CHE
CHL
CHN
CIV
CMRCOG
COLCRI
CZE
DEU
DNK
DOM
DZAECU
EGY
ESP
ETH
FIN FRAGBR
GEO
GHA
GIN
GRC
GTM
HKG
HND
HRV
HTI
HUNIDN
IND
IRL
IRN
ISR ITA
JAM
JOR
JPN
KAZ
KENKGZ
KHM
KOR
KWT
LAO
LBNLBRLBY LKA LTULVA
MARMDA
MDG
MEX
MKDMLI
MNGMOZ
MRTMWI
MYS
NERNGA
NIC
NLDNOR
NPLNZL
OMN PAK
PANPER
PHL
PNG
POLPRT
PRY
ROM
RUS
RWA
SAU
SDN
SEN
SGP
SLE
SLV
SVKSVN
SWE
SYRTCD
TGO
THA
TJKTKM
TUN
TUR
TZAUGA
UKRURY
USA
UZBVEN VNM
YEM
ZAF
ZMB
10
20
30
40
50
Sta
ndar
dnes
s, 2
001-
2007
Ave
rage
0 50 100 150 200 250 300 350Diversification, 2001-2007 Average
Note: Countries with population less than 2 million were excluded. Dashed lines correspond to the respective means of standardness and diversifcation.

Product space
Very difficult
Periphery to
center
Capabilities
Policy does matter

1962

1965

1975

1985

1995

2005

2007

AGO
ALB
ARG
ARM
AUS
AUT
AZE
BDI
BEL
BENBFA
BGD
BGR
BIH BLR
BOL
BRA
CAF
CANCHE
CHL
CHN
CIV
CMRCOD COG
COL
CRI
CZE
DEUDNK
DOM
DZA
ECU
EGY
ESP
ETH
FIN
FRA
GBR
GEOGHA
GIN
GRC
GTM
HKG
HND
HRV
HTI
HUNIDN
IND
IRL
IRN
ISR
ITA
JAM
JOR
JPN
KAZ
KEN
KGZ
KHM
KOR
LAO
LBN
LBR LBY
LKA
LTULVA
MARMDA
MDG
MEX
MKD
MLI MNGMOZ
MRT
MWI
MYS
NERNGA
NIC
NLD
NOR
NPL
NZL
PAK PANPER
PHL
PNG
POL
PRT
PRY
ROM
RUS
RWA
SAU
SDN
SEN SGP
SLE
SLV
SVKSVN
SWE
SYR
TCD
TGO
THA
TJK TKM
TUN
TUR
TZA
UGA
UKR
URY
USA
UZB VEN
VNM
YEM
ZAF
ZMB
0
500
1,000
1,500
2,000
2,500
3,000
Ope
n Fo
rest
200
7 ('0
00)
0 10,000 20,000 30,000 40,000 50,000Per capita GDP 2007 (2005 PPP $)
Armenia
Azerbaijan
GeorgiaKazakhstan
Kyrgyz Rep.
Tajikistan
Turkmenis tanUzbekistan
PRC
H ong Kong, China
Korea, Rep. ofMongolia
India
Pakistan
IndonesiaMalaysia
Philippines
Singapore
ThailandViet Nam
Open Forest and GDP per capita
The estimated regression is:OF = -534.30 + 0.06y - 0.00y2 + 16.43inv + 8.66ndes
t-stat: (-4.71) (5.12) (-4.99) (3.75) (10.61)
where OF=open forest; y=GDP per capita; inv=investment-output ratio; and ndes=no. of export destinations of products exported with comparative advantage. Predicted Open Forest is maximum at GDP per capita equal to PPP$ 24,254.

Open Forest Average 2001-2007
0 500 1,000 1,500 2,000 2,500 3,000
UruguayPakistan
KenyaBosnia
Malays iaRuss ia
PanamaGuatemala
LebanonViet Nam
JordanTunisia
EgyptColombiaArgentina
Belar usLatvia
Mexi coLithuaniaIndonesiaRomaniaThailandUkraine
BrazilBulgaria
South AfricaChina
TurkeyIndia
Poland
Panel A: Non-high income countries
0 500 1,000 1,500 2,000 2,500 3,000
IrelandNorway
SingaporeAustralia
New ZealandIsrael
Hong KongRep. of Korea
FinlandCroat iaJapan
GreeceCanada
SwitzerlandH ungaryPortugalSlovak iaSwedenSlovenia
D enmarkNetherlands
U KGermany
USAAustria
Czech Rep.Belgium
ItalyFranceSpain
Panel B: High income countries
Open Forest ('000, 2005 PPP $), 2001-2007 Average

Index of Opportunities
(1)Country Rank Country Rank Country Rank Country Rank
Germany 1 Brazil 18 Turkey 35 Uruguay 52
USA 2 Mexico 19 Israel 36 Lebanon 53
China 3 Indonesia 20 Ireland 37 Greece 54
Japan 4 Hungary 21 Croatia 38 Georgia 55
India 5 Rep. of Korea 22 Portugal 39 Panama 56
France 6 Slovakia 23 Argentina 40 Kenya 57
Italy 7 Denmark 24 Canada 41 Costa Rica 58
Switzerland 8 Ukraine 25 Jordan 42 Tunisia 59
Czech Rep. 9 Finland 26 Egypt 43 Pakistan 60
United Kingdom 10 Netherlands 27 Viet Nam 44 Nepal 61
Austria 11 South Africa 28 Russian Federation 45 Kyrgyzstan 62
Sweden 12 Malaysia 29 Latvia 46 New Zealand 63
Spain 13 Romania 30 China, Hong Kong SAR 47 Syria 64
Poland 14 Philippines 31 Bosnia Herzegovina 48 Rep. of Moldova 65
Thailand 15 Bulgaria 32 Lithuania 49 Guatemala 66
Belgium 16 Singapore 33 Sierra Leone 50 Sri Lanka 67
Slovenia 17 Belarus 34 Colombia 51 Venezuela 68

What to do?
•
Be aware of your constraints
•
Understanding productivity
•
What new areas can Singapore get into?
•
The role of Industrial Policy

–
City state (size) that depends on trade: vulnerable to external shocks and markets abroad•
As a small open economy, specialization makes Singapore vulnerable to market volatility
•
Sparseness of agglomeration economies
–
Mature economy: The aging problem requires a long-term approach•
Larger population? Immigration?
1. Constraints (1)

1. Constraints (2)
•
Is there a research base grounded in local universities and research institutions?
•
What is the quality of the technical workforce?
•
Are there Singaporean firms that can take the lead?

MNCs
and Domestic Firms(3)•
What do you know about MNCs’
spillovers?
•
Are there backward linkages, i.e., MNCs
transfer knowledge to their local suppliers; contacts between domestic suppliers of intermediate inputs and their MNC clients)
•
Or through horizontal channels, i.e., the effect of the MNC on domestic firms in the same sector?
•
What about countries like Ireland
or Switzerland?•
What is the typical Singaporean firm?
•
Needed:
policies to develop local capabilities

2. The determinants of productivity growth (1)
•
Factors that operate within businesses:–
Managerial Talent
–
Quality of general labor and capital inputs–
Information technology and R&D
–
Learning-by-Doing–
Product Innovation
–
Firm structure decisions

2. The determinants of productivity growth (2)
•
Elements external to the firm:–
Productivity spillovers
–
Competition–
Deregulation or proper regulation
–
Flexible input markets

The Productivity Dilemma• Imbalance between productivity growth and
demand growth: If productivity keeps increasing while the demand for new goods and services reaches a saturation point, an imbalance will arise
• Bottleneck for economic development: the consequence of the imbalance is the displacement of labor
• Solution: the economy has to continuously create new goods and services, i.e., a change in the composition leading to a growth in variety

3. What new areas?•
Out of electronics?....Need new knowledge
•
Find new “niches”, areas in manufacturing & services that:–
Are subject to increasing returns to scale
–
Have high income elasticity of demand–
Are produced under imperfect competition
•
Key: Capabilities
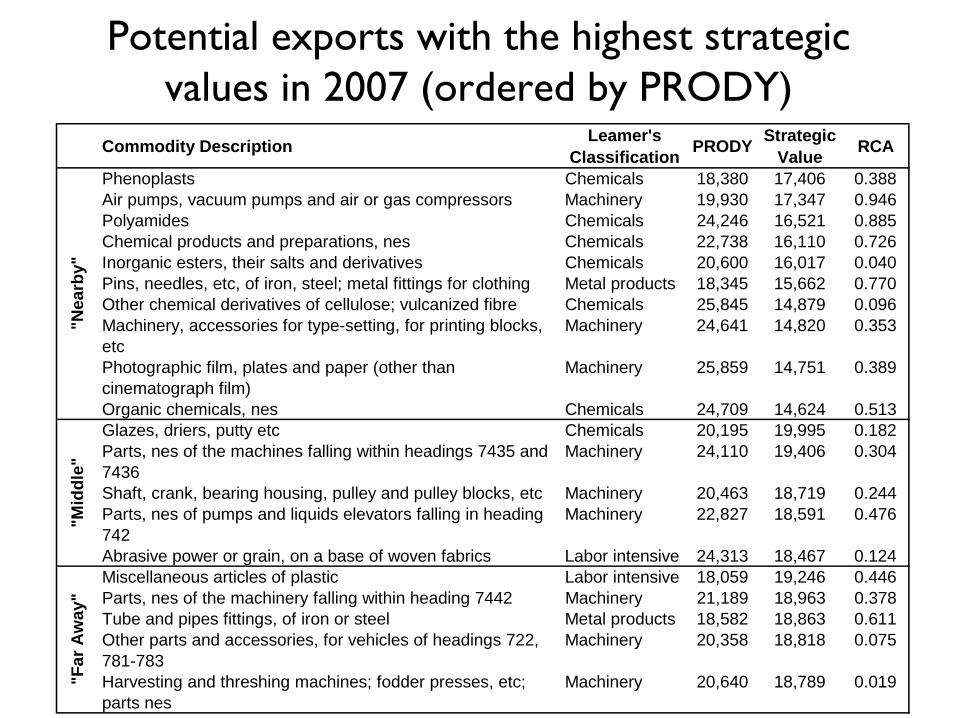
Potential exports with the highest strategic values in 2007 (ordered by PRODY)
Commodity Description Leamer's Classification PRODY Strategic
Value RCA
Phenoplasts Chemicals 18,380 17,406 0.388Air pumps, vacuum pumps and air or gas compressors Machinery 19,930 17,347 0.946Polyamides Chemicals 24,246 16,521 0.885Chemical products and preparations, nes Chemicals 22,738 16,110 0.726Inorganic esters, their salts and derivatives Chemicals 20,600 16,017 0.040Pins, needles, etc, of iron, steel; metal fittings for clothing Metal products 18,345 15,662 0.770Other chemical derivatives of cellulose; vulcanized fibre Chemicals 25,845 14,879 0.096Machinery, accessories for type-setting, for printing blocks, etc
Machinery 24,641 14,820 0.353
Photographic film, plates and paper (other than cinematograph film)
Machinery 25,859 14,751 0.389
Organic chemicals, nes Chemicals 24,709 14,624 0.513Glazes, driers, putty etc Chemicals 20,195 19,995 0.182Parts, nes of the machines falling within headings 7435 and 7436
Machinery 24,110 19,406 0.304
Shaft, crank, bearing housing, pulley and pulley blocks, etc Machinery 20,463 18,719 0.244Parts, nes of pumps and liquids elevators falling in heading 742
Machinery 22,827 18,591 0.476
Abrasive power or grain, on a base of woven fabrics Labor intensive 24,313 18,467 0.124Miscellaneous articles of plastic Labor intensive 18,059 19,246 0.446Parts, nes of the machinery falling within heading 7442 Machinery 21,189 18,963 0.378Tube and pipes fittings, of iron or steel Metal products 18,582 18,863 0.611Other parts and accessories, for vehicles of headings 722, 781-783
Machinery 20,358 18,818 0.075
Harvesting and threshing machines; fodder presses, etc; parts nes
Machinery 20,640 18,789 0.019
"Nea
rby"
"Mid
dle"
"Far
Aw
ay"

“Far away”
Products Singapore (2007)
Commodity Description Leamer's Classification PRODY Strategic
Value RCA
Miscellaneous articles of plastic Labor intensive 18,059 19,246 0.446Parts, nes of the machinery falling within heading 7442 Machinery 21,189 18,963 0.378Tube and pipes fittings, of iron or steel Metal products 18,582 18,863 0.611Other parts and accessories, for vehicles 722, 781-783 Machinery 20,358 18,818 0.075Harvesting and threshing machines; fodder presses, etc Machinery 20,640 18,789 0.019Cocks, valves and similar appliances, for pipes boiler shells, etc Machinery 21,910 18,728 0.393Felt, articles of felt, nes, whether or not impregnated or coated Capital intensive* 22,528 18,561 0.145Central heating equipment, not electrically heated, parts, nes Capital intensive* 19,293 18,528 0.026Engines and motors, nes (wind, hot air engines, water wheel) Machinery 21,198 18,391 0.412Other hand tools Metal products 20,662 18,150 0.260Lifting, handling, loading machinery, telphers and conveyors Machinery 20,702 18,018 0.454Wool; expanding or insulating mineral materials, nes Labor intensive 20,275 17,798 0.046Correspondence stationary Forest products 21,476 17,756 0.341Rolling mills, rolls therefor, and parts, nes of rolling mills Machinery 19,334 17,733 0.008Safety glass consisting of toughened or laminated glass Labor intensive 19,903 17,653 0.056Coated or impregnated textile fabrics and products, nes Capital intensive* 19,534 17,652 0.056Centrifugal pumps (other than those of heading 74281) Machinery 19,873 17,618 0.411Printing paper and writing paper, in rolls or sheets Forest products 27,779 17,285 0.029Locksmiths wares, safes, etc, and hardware, nes, of base metal Metal products 18,524 17,273 0.268Fabrics of glass fibre (including narrow, pile fabrics, lace, etc) Capital intensive* 20,242 17,269 0.064*excluding Metals
Far A
way

What else?•
Do not disregard services
(70% of the economy),
e.g., tourism: (i) numbers vs. spending; (ii) employment generation–
e.g., target the highest spending per tourist in the world
–
What package do you have to offer? Theme park catering to Asia’s new middle class?
–
What professionals do you have to train? Set up the best hotel management and hotel school in the world
•
Key: Capabilities

Singapore is a service economy with a large manufacturing sector
64.0
33.7
2.3
60.3
38.1
1.6
62.9
36.1
1.0
64.9
34.7
0.4
64.7
35.1
0.2
64.3
35.6
0.1
67.5
32.4
0.1
72.2
27.8
0.1
0
20
40
60
80
100
Val
ue A
dded
(% o
f GD
P)
1975 1980 1985 1990 1995 2000 2005 2008
Services Industry Agriculture

Singapore’s Service Sector
0 10 20 30Share in value added in Services, %
Wholesale Trade
Transport and Storage Services
Retail Trade
Real Estate and Business Services
Information and Communications Services
Financial and Insurancerelated Services
Community, Social and Personal Services
Accommodation and Food & Beverage Services
19982008
Source: Singapore’s Yearbook of Statistics, 2010

4. The role of Industrial Policy
•
IP is not about the provision of subsidies and rent- seeking
•
It is about facilitating structural transformation & developing internationally competitive sectors
•
IP deals with economic transformations that require the concerted action of multiple players, within and across sectors
•
Key: Coordination of firms and government to jointly build a “competitive industry”
(the rate of
return of individual investments is low. But the rate of return to coordinated
investments is high)

Where does the future of Singapore lie?
•
Deliver outstanding services to your citizens•
Avoid the misery that unemployment
brings
along (be the first country in the world to eliminate unemployment and brag about it!)
•
Innovate and be creative•
Question yourself constantly

WHAT SHOULD POLICY MAKERS CARE ABOUT? The role of public policy in promoting inclusive
growthToday most Governments are evaluated based on their performance,
not ideology
Objective of Public Policy: Inclusive growth, defined as “growth with equal opportunities”
Three components:
•
Effective delivery of public goods and services (market failures), e.g., health, education, water, power (under your control), especially
for the poor
•
Elimination of inequalities
•
Achievement of full (productive and decent) employment (under your control !). Be the first Government to target it and to achieve it
Future of Singapore• Bright…..provided:
– Understand constraints– Set clear and meaningful policy objectives (is
GDP growth what you want?; what about employment?)
– Yes, push yourself ahead, but be realistic about the new areas you can get into (your capabilities)
• Growth is about the gradual build-up in firms’ capabilities. This is what raises the economy-wide real wage rate

GDP growth 2010-2030Country Growth
projection 2010-
2030 (%)
Average growth rate
1990-2007 (%)
Country Growth projection
2010-
2030 (%)
Average growth rate
1990-2007 (%)
Australia 0.79-1.27 3.2 Malaysia 4.01-5.03 6.07
Austria 0.47-0.87 2.22 Netherlands 1.45-1.71 2.67
Belgium 1.65-2.17 1.93 New Zealand 1.97-2.29 3.01
Canada 1.38-2.01 2.78 Norway 0.5-1.32 3.09
China 4.15-5.12 10.34 Philippines 5.85-7.06 3.94
Denmark 1.65-1.99 2.24 Portugal 1.45-2.68 2.13
Finland 1.56-2.42 2.38 Russian Federation 1.04-1.23 0.28
France 1.98-2.26 1.95 Saudi Arabia 2.08-3.69 4.02
Germany 1.44-1.94 1.73 Singapore 0.63-2.72 6.62
Greece 0.92-1.76 2.89 Spain 1.87-2.83 2.35
Hong Kong, China 1.11-1.47 4.37 Sri Lanka 3.54-4.29 5.27
Hungary 0.93-1.51 1.94 Sudan 5.66-5.97 6.49
Indonesia 5.11-6.49 4.69 Suriname 2.45-4.09 2.25
Ireland 1.44-2.98 6.05 Sweden 1.66-2.64 2.23
Israel 2.67-3.87 4.67 Switzerland 0.38-1.26 1.28
Italy 1.83-2.12 1.25 Thailand 4.14-4.99 4.7
Japan 0.82-2.53 1.37 United Arab Emirates 1.01-1.64 5.65
Korea, Rep. 1.64-2.63 5.47 United Kingdom 1.82-2.53 2.46
Kuwait 0.22-2.53 6.31 United States 2.11-2.64 2.9

WHAT DO YOU WANT TO BE AS A NATION IN 2030?
What do you want to achieve?

THANK YOU