when will electric vehicles capture the german market? and ... when will electric vehicles capture...
TRANSCRIPT

EVS27 International Battery, Hybrid and Fuel Cell Electric Vehicle Symposium 1
EVS27 Barcelona, Spain, November 17-20, 2013
When Will Electric Vehicles Capture the German Market? And why?
Stefan Pfahl1, Patrick Jochem2, Wolf Fichtner2 1 (corresponding author) Daimler AG, W 050, HPC X981, 71059 Sindelfingen, Germany, [email protected]
2Institute for Industrial Production (IIP) and Karlsruhe Service Research Institute (KSRI) at the Karlsruhe Institute of Technology (KIT)
Abstract
Market development of electric vehicles in the coming years is a highly relevant issue for many stakeholders, e.g. automobile- and energy-industry, investors as well as policy makers and the public. The market forecasts, however, differ strongly and underlying assumptions are often hard to find. Furthermore, for stakeholders from such diverse fields it can be difficult to convey their own assumptions and views to each other. Therefore, we try to shed light on this debate in presenting a simple and clear forecast model which reduces the excessive complexity down to a coherent approach. The central aspect of this model is to work with two essential, widely accepted parameters: The Total Cost of Ownership (TCO) and Diffusion Factors (DIF). These two parameters are easily deduced and can be evaluated by all stakeholders. Based on them, a third element, the TCO demand function, leads to a forecast of xEV volumes. The PTD-model (Prognosis on TCO and Diffusion factor) thus allows a common view of diverse stakeholders by combining scientific accuracy with a plain and intelligible design. It has been already successfully applied for different groups, which all had in common that they were heterogeneous and interdisciplinary staffed. Examples are academic seminars, commercial strategy projects, and the German National Platform for Electric Mobility (NPE). This paper mainly refers to the process and the results of the NPE in which, based on the approach presented here, the need for subsidies of xEVs was discussed. In addition, we discuss how the approach can be utilized for a classification of boundary conditions in different countries.
Keywords: policy, cost, sales, simulation, subsidy
1 Introduction While worldwide sales of electric vehicles (xEVs)1 have almost doubled in 2012 a media debate on the end of the xEV-hype has begun. With market shares of 1 – 5 ‰ in almost all industrial countries xEVs are still lagging behind the immense expectations and the medium-term national goals. A prognosis of the market penetration of xEVs in the coming years seems to be challenging, since a market success of xEVs
1 We include in our analysis battery electric vehicles (BEVs), plug-in hybrid electric vehicles (PHEVs), range extender electric vehicles (REEVs).
depends on a varied range of stakeholders and developments. Hence, even extremely diverging scenarios [1] cannot be disproved today. Suggested values of market shares range from negligible to larger two-digit percentages (cf. figure 1).
However, xEVs require investments that are too large as to leave this issue to speculation. Electric cars promise benefits for policy makers and the car industry, as xEVs should contribute substantially to achieving the emission reduction targeted by national GHG-laws [2,3]. xEVs promise growth and innovation in the automotive value chain, and positive macroeconomic impulses [4]. A strong growth of xEV-market shares could even help reducing energy sector’s demand for fossil fuels and create new opportunities for electricity

EVS27 International Battery, Hybrid and Fuel Cell Electric Vehicle Symposium 2
markets, such as an integration of the end-consumer by Demand Side Management measures. Finally customers should benefit from declining mobility costs in the long term.
Car purchase decisions are complex and the underlying decision rules heterogeneous – sometimes even non-existent or at least irrational [5]. Therefore, a single forecasting methodology seems hard to find. Al-Alawi and Bradley [6] differentiate mainly between three different modeling methodologies: agent based modeling [7,8], consumer choice models [9] and a last group of methodologies with diffusion rate [10] and time series models. Further methodologies are e.g. optimization models [11], panel analysis, system dynamics [12], conjoint analysis [13] etc. Obviously, also a mixture of models is applied [e.g. 14].
However, as most models do forecast the purchase decision based on historical development, a probable breakthrough in mobility and social patterns might change the output of most of these approaches considerably. Therefore, we see a high uncertainty with regard to these scenarios for the next two decades (cf. figure 1).
Looking at these different results from sometimes very comprehensive methods, one might wonder whether easy and simplified models could deliver similar results – which might be more easily understood and therefore more convenient for dissemination outside the scientific community. Therefore, we focus in the following on a simplified model, where xEV
demand is mainly forecasted on total cost of ownership (TCO).
The proposed model approach has initially been developed from the strategic issues of an automobile manufacturer in cooperation with academic partners. Within the car industry it has been established as a useful instrument for the support of strategic planning processes. During continued application in cooperation with the KIT the model also turned out to be suitable for research on the xEV-specific interactions between the energy and the transport sector.
The model enables stakeholders from different backgrounds to form a common understanding of future development paths for xEVs. Whereas the model is already being used at a great range of events, such as during business strategy processes, political discussions and university seminars, the following sections focus on the methodology specified for the NPE. Within the NPE, the model-approach has been applied for credible quantity-prognoses and recommendations for policy instruments. It enabled a common understanding within the interdisciplinary Working Group 7, with members of four different federal ministries, local administration, automobile-companies, utilities, electricity providers, scientists, and NGOs representing the ecology movement and consumer interests. These results are documented in the latest reports of the NPE (2011 [16] and 2012 [17]). We present the main results and add further applications concerning a sensitivity analysis and a comparison between countries.
Figure 1: Overview on different scenarios of market penetration for advanced electric vehicles [15].
EVS27 International Battery, Hybrid and Fuel Cell Electric Vehicle Symposium 3
One target defined by the NPE is to increase the number of xEVs on the road in Germany to one million until the year 2020. Thereby the targeted scenario provides a market-share for xEVs of approx. 2.5 % in 2014 and 5 % in 2017 and 2020 [16]. It was the task of the NPE to give a realistic assessment to this scenario and identify a gap and – when indicated – options for action.
In the following sections we introduce our methodology and the German market situation, before presenting main results from the model application for Germany in section 4. Then, we identify the main factors influencing the xEVs market penetration. Section 5 concludes and gives an outlook on further potentials of the approach.
2 Methodology The basic idea of the presented approach is to create a coherent forecast model in a complex field. Therefore, we reduce the number of input parameters down to the smallest tolerable minimum of considered elements. Following the slogan “It’s better to be vaguely right than to be precisely wrong”, we accept some uncertainties, for example with regard to customers’ changing mobility patterns. Thus we obtain clarity and the ability of a comprehensive interdisciplinary communication. We use three basic elements:
1. The prognosis of market shares is calculated on the basis of a TCO demand function universally applicable for all drive trains.
2. The TCO calculation follows rules to which all participants must agree.
3. A diffusion factor includes constraining peculiarities of the xEV as the initial lack of loading infrastructure, the only slowly growing diversity of vehicle offers and principle concerns of customers regarding a new technology.
These three elements lead to the naming of the approach to PTD: (Prognosis on TCO and Diffusion Factor). They are depicted in the following.
2.1 Prognosis of market shares Core of the market model is the description of a segment-specific dependency between the relative TCO and the corresponding market shares of competing power trains. It is thus assumed that the market shares of the vehicle presented here depend on the TCO – the higher the TCO disadvantage of the electric car compared to conventional reference cars, the
smaller its market share. Due to the current small market shares, the exact relationship for xEVs cannot be proven with today’s empirical data set. Therefore, it is assumed that user reactions on xEVs vs. comparable conventional cars are equal to the reactions that are known for gasoline vs. diesel vehicles. This relationship will be referred to as TCO demand function subsequently.
In fact, a strong influence of TCO is detectable in the distribution of market shares of gasoline and diesel vehicles across different countries. We traced this coherence for numerous European countries with significant national tax differences. Countries like France or Sweden have a dominant diesel-share of more than two thirds of the whole market, the Netherlands or Switzerland have dominant gasoline-shares, while others are fairly balanced (Germany, UK, etc.). These variations are a definite result of different tax systems, which favor one or the other power train-technology on the TCO-side. Through the national comparison of single car pairs, equal in terms of technical performance, isolated interpolation points of the TCO demand functions can be derived.
Further insightful research conditions are offered by the German car market, where the TCO advantages of a gasoline or a diesel car distinctively depend on the respective distances travelled. Due to the lower vehicle price and the lower vehicle tax the gasoline is usually the cheaper option for a smaller annual mileage. With an increase in mileage, however, the better fuel economy and the lower energy tax on diesel comes into effect. In consequence, a diesel vehicle usually is cheaper than a gasoline vehicle when the mileage exceeds 10,000 to 25,000 km. When looking at the distribution of vehicle purchases as a function of the real mileages and the related TCOs, the hypothesis is validated: the maximum of the gasoline volumes is situated at significantly smaller mileage than the maximum of the diesel volumes.
From these values we derived the TCO-demand-function, which is illustrated in figure 2 for the example of a privately used car. For equal TCOs, a technical equivalence (and thus a uniform distribution of 50 %) for both drive trains is supposed. Small differences of up to 5 % of the total costs only change little in this regard. If one drive train alternative reaches a TCO-disadvantage of 10 %, however, its market share halves to 25 % and declines rapidly to small values.
In addition to this first part of the TCO demand function, which we derived from empirical data,

EVS27 International Battery, Hybrid and Fuel Cell Electric Vehicle Symposium 4
the expected purchase disposition of “Early Adopters” was included. Customer interviews and xEV user studies indicate that this small group of technophile users with strong ecological preference patterns is increasingly willing to accept higher TCOs for xEVs. This group of less than 5 % of all drivers is prepared to accept additional total annual costs of up to 3,000 € . However, this group’s willingness to pay for prestigious goods declines when xEVs become more common.
Figure 2: TCO-demand-function for powertrain-options, example of a privately used car [16, 18]
Combining the findings of the gasoline/diesel market shares, the customer surveys, and the first xEV user studies, we receive the TCO demand function as a characteristic S-function as shown in figure 2. It allows to derive the market expectation of the more expensive option. The market share of the cheaper option then follows on the basis of normalization.
To complete the simulation, it has to be considered that, according to our analysis, users of company cars react significantly more sensitive to TCO disadvantages than private customers. This is taken into account with a specific S-curve.
It is important to note that the empirical correlation between TCO rate and user decisions in gasoline and diesel vehicles does not run discretely but continuously and shows a characteristic uncertainty. This refers mainly to the biased purchase decision depicted above. In the ideal situation of TCOs being equal, market shares of gasoline- and diesel-cars will turn out balanced with a nearly 50/50-share. Starting from this point, an increasing TCO disadvantage will
not cause an immediate drop of market share but instead leads to a steady decrease. Explanations range from insufficient information of car users up to sophisticated assumptions about willingness to pay. As long as there is no final evidence for one of these explanations, we believe that – compared to discrete approaches – our method provides a superior way to explain actual market shares and to forecast market developments in the field of electric mobility.
2.2 TCO calculation The TCO calculation is performed as described in [18]. It refers to the first user of the car as the relevant decision maker for the car purchase. A holding period of four years and a segment-specific yearly mileage between 10,000 and 30,000 km are assumed. By including the TCO situation of following users into the residual value of the vehicle, the costs of the entire useful life are taken into account.
The TCO calculation includes all cost factors which accumulate during vehicle lifetime. These factors can be separated into two blocks:
- Initial costs including purchase taxes, incentives, depreciation, and interest.
- Operating (annual) costs including energy costs, vehicle taxes, maintenance, and insurance etc..
The essential political framework parameters were fixed on their levels in 2011: VAT: 19 % Energy tax gasoline: 0.6545 €/litre Energy tax diesel: 0.4704 €/litre Average income tax: 40 % Company tax: 35 % Company car tax: the benefit in kind tax is
calculated on a monthly basis as: gross list price * (1 % + 0.03 % * distance between home and place of work)
The prerequisites for the oil price development follow the “new policy scenario” of the International Energy Agency [19]. This leads to oil prices of 88 $/bbl. for 2014, 94 $/bbl. for 2017 and 100 $/bbl. for 2020. Furthermore, we assume a constant exchange rate of 1.25 $/€.
The German electricity price is assumed to persist at the current level of about 0.24 €/kWh for private households, including all taxes and charges. As the price for large companies is significantly smaller, we might even overestimate these electricity costs for company cars. Since predictions for the electricity price already include uncertainty, we neither take further financial risks (e.g. higher

EVS27 International Battery, Hybrid and Fuel Cell Electric Vehicle Symposium 5
costs for zero-emission electricity, allocation of infra-structure investment costs) nor financial opportunities (revenue from ancillary services by the xEV, etc.) into account.
While on this basis the respective steps of the TCO calculation are straightforward, there are also parameters for which the calculation approach needs to be discussed and described in more detail. These include:
- calculation of depreciation, - differentiation between certified and real
world fuel economy, - definition of parameter development over
time, - discounting of cost factors appearing at
different points in time, as well as - costs for maintenance and insurance.
A detailed description of the setting of these parameters within the NPE is given in [17,18].
Evidently it has to be distinguished between the TCOs of privately owned cars, business cars, and company cars. The business car user represents a special case, as here the TCOs are spread over two decision makers: the company which has to bring the car to the list (lister) and the user (user-chooser) who runs the car. There are several ways to get to a decision in this constellation. For simplicity, we assume that both lister and user-chooser decide as a single person, adding all relevant TCOs.
2.3 Diffusion factor (DIF) The decision to buy an xEV usually includes further components which we integrate in a “diffusion factor” (DIF). It mainly considers limitations for electric drive trains, especially in the early phase of market development. These limitations include the initial lack of different xEV offers in various vehicle segments, restricted availability of charging infrastructure, as well as concerns about and prejudices of a not yet established technology. Hence, the DIF expresses what share of potential xEV customers, determined by the TCO demand function, actually converts its interest into a final decision for using an xEV. It can be interpreted as an aggregated factor of many different technical, socio-economic, and psychological parameters. The NPE estimated a DIF of only 5 % for xEVs in 2011 (see table 1) – meaning that 95 % of the customers potentially interested in buying an xEV, will not buy or use one, because they e.g. cannot find an appropriate offer in their desired
vehicle class or do not have access to a charging spot.
Due to the complexity of these factors, their still unpredictable interactions and the dynamic changes within the markets, the DIF cannot be calculated with absolute precision. This also applies to highly sophisticated models. In our opinion however, this is not necessary in order to perceive a sufficiently meaningful impression of the prospects of xEVs. Our experience shows, that the DIF is ideally suited to quickly arrive at a common view in interdisciplinary groups of experts. The working group 7 of the NPE determined the following chronological course for DIFs with respect to vehicle classes (cf. table 1).
Table 1: Diffusion factors as estimated by the WG 7 of NPE [18].
2011 2014 2017 2020 BEV 5 % 15 % 30 % 45 % REEV 5 % 18 % 40 % 63 % PHEV 5 % 20 % 50 % 80 %
According to the NPE, purely electric drivetrains will face relatively great limitations even in 2020 – more than 50 % of potential users will desist from a decision for a BEV. This is mainly due to the concerns about the limited range compared to current cars. In contrast, 80 % of potential customers of plug-in hybrids are likely to act according to their TCO marked preference in 2020. Due to the extended range of the internal combustion engines this technology is more independent of public charging stations.
The strength of the method presented here is the reduction to only three elements: The TCO demand function, the TCO calculation and the diffusion factor. The TCO demand function is based on an empirically well-documented situation for gasoline-diesel-vehicles for which we assume that it can be transferred to the xEVs purchasing decision, too. The TCO calculation is straightforward. However, even though we know that not all users do calculate their TCO precisely, we assume that it has the described effect on the macroeconomic diffusion of the vehicles. The diffusion factor acts as an intentionally subjective element in our approach. Since the complex interdependencies and the development of the influencing parameters in the field of electric mobility detract from a serious quantitative analysis, it seems reasonable to work with expert estimations initially. The strength of the diffusion factor is the ability to document a common
EVS27 International Battery, Hybrid and Fuel Cell Electric Vehicle Symposium 6
assessment of a working group such as the NPE. Should any of the aforementioned factors be better described in effect and development over the next period of time, the diffusion factor can gradually be supplemented accordingly.
An in depth explanation of all three key elements is given in [18].
3 The German Market as a Reference Market
To model possible market shares, we focused on the German market for new vehicles and differentiate between three vehicle-groups: ‘A-B’ (small), ‘C’ (compact) and ‘D-F’ (mid and large). These three groups represent about one third of the German market each, if the D-segment stands representative for all further (larger) vehicle segments. One single technology pair is evaluated for every group: According to the segment, the respectively most successful conventional technology is compared to the xEV-technology for which the best prospects are expected.
In order to keep the model approach manageable, a minimal number of exemplary vehicles represent the total number of approximately 3 million cars newly registered in Germany every year. Based on today’s state of the art, the following segment-specific correlation is set:
- A/B segment: BEVs - C segment: REEVs - D-F segment: PHEVs
Table 2 shows the specific vehicle pairs – conventional vs. electric – and part of the performance data.
The lower annual mileage in the A and B segment allows the application of pure battery electric drive trains with certified electric ranges of 160 km. This seems to be a less acceptable restriction for the C segment. Therefore, the range extender technology was deemed suitable. It allows enlarging the range considerably by the small auxiliary combustion engine. D segment vehicles, however, are too often used for longer trips as a range extender function could be considered adequate. Instead, plug-in hybrids are considered favorable in this segment. The assumed electric range of 25 km enables it to cope with the majority of classical commuting trips. Thus, in accordance with the actual certification rules in the New European Driving Cycle an overall electric-driving share of 50 % is expected.
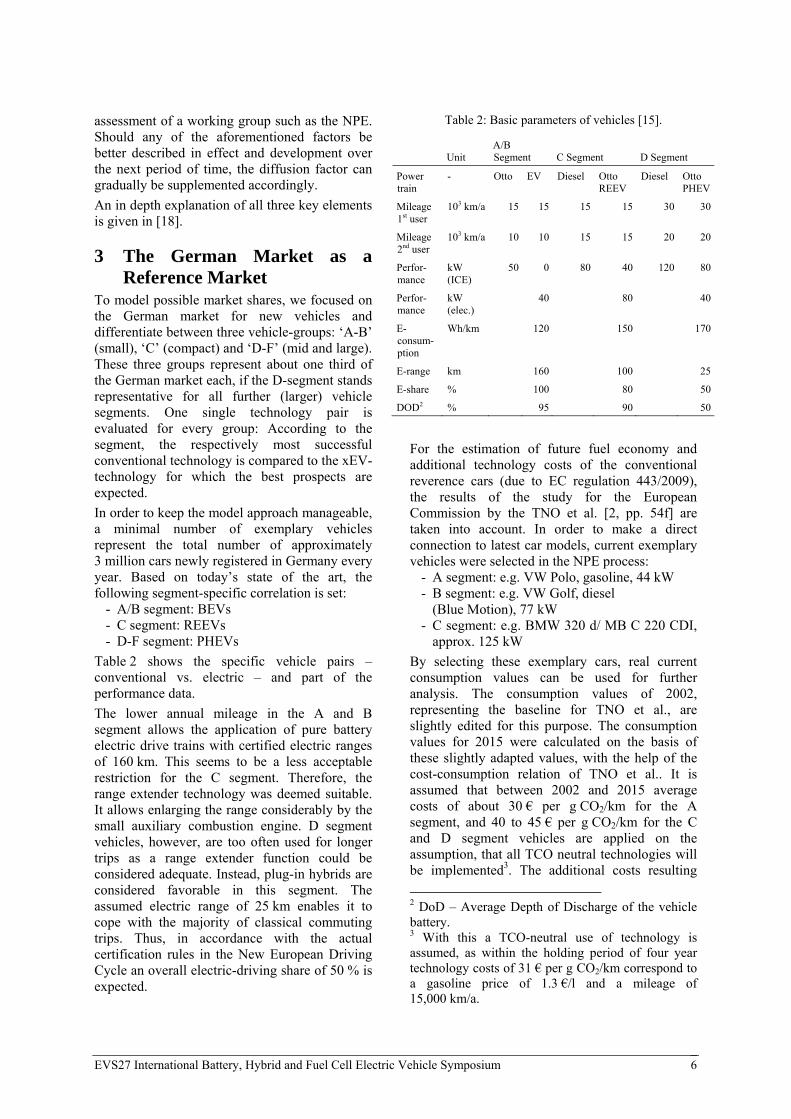
Table 2: Basic parameters of vehicles [15].
Unit A/B Segment C Segment D Segment
Power train
- Otto EV Diesel Otto REEV
Diesel Otto PHEV
Mileage 1st user
103 km/a 15 15 15 15 30 30
Mileage 2nd user
103 km/a 10 10 15 15 20 20
Perfor-mance
kW (ICE)
50 0 80 40 120 80
Perfor-mance
kW (elec.)
40 80 40
E-consum-ption
Wh/km 120 150 170
E-range km 160 100 25
E-share % 100 80 50
DOD2 % 95 90 50
For the estimation of future fuel economy and additional technology costs of the conventional reverence cars (due to EC regulation 443/2009), the results of the study for the European Commission by the TNO et al. [2, pp. 54f] are taken into account. In order to make a direct connection to latest car models, current exemplary vehicles were selected in the NPE process:
- A segment: e.g. VW Polo, gasoline, 44 kW - B segment: e.g. VW Golf, diesel
(Blue Motion), 77 kW - C segment: e.g. BMW 320 d/ MB C 220 CDI,
approx. 125 kW
By selecting these exemplary cars, real current consumption values can be used for further analysis. The consumption values of 2002, representing the baseline for TNO et al., are slightly edited for this purpose. The consumption values for 2015 were calculated on the basis of these slightly adapted values, with the help of the cost-consumption relation of TNO et al.. It is assumed that between 2002 and 2015 average costs of about 30 € per g CO2/km for the A segment, and 40 to 45 € per g CO2/km for the C and D segment vehicles are applied on the assumption, that all TCO neutral technologies will be implemented3. The additional costs resulting
2 DoD – Average Depth of Discharge of the vehicle battery. 3 With this a TCO-neutral use of technology is assumed, as within the holding period of four year technology costs of 31 € per g CO2/km correspond to a gasoline price of 1.3 €/l and a mileage of 15,000 km/a.

EVS27 International Battery, Hybrid and Fuel Cell Electric Vehicle Symposium 7
from these technologies are added to the base price level without further markup.
In order to achieve a further decrease of the fuel consumption of conventional cars TNO et al. [2] assumes marginal costs of more than 100 € per g CO2/km. These costs do not amortize during the first usage time of four years. Therefore, no further measures are assumed to be included. Nevertheless, according to [20] further efficiency gains can be expected as a result of continuous improvement processes. Therefore, we considered an annual decrease of fuel consumption of 1 % without cost effect. This leads to further reductions in fuel consumption of 5 g CO2/km until 2020.
The assumptions according the component costs of electrical drive trains are based on the feedback of NPE working groups 1, 2, and 3. A cross-comparison shows a good match with other renowned studies [21, 22]. An onboard charger for 400 € and other costs for the EV-components (power electronics, electric motor, etc.) of 2,600 € was included for all xEVs. Table 3 shows the cost premises for batteries – assuming a decrease over time – as well as the resulting vehicle prices and specific consumptions.
Table 3: Assumed development of the prices for batteries and vehicles, as well as vehicle efficiency, for the years 2011 and 2020. Further Information is
provided in [16] and [18].
Unit 2011 2020
Battery costs €/kWh 800 280
A segment
Net vehicle price ICEV € 10,403 11,176
Consumption ICEV gCO2/km 122 95
Net vehicle price BEV € 27,440 16,720
Consumption BEV4 gCO2/km 0 0
C segment
Net vehicle price ICEV € 19,352 19,702
Consumption ICEV gCO2/km 104 95
Net vehicle price REEV € 34,213 24,725
Consumption REEV gCO2/km 21 19
D segment
Net vehicle price ICEV € 32,787 33,734
Consumption ICEV gCO2/km 127 110
Net vehicle price PHEV € 44,077 37,860
Consumption PHEV gCO2/km 64 55
Technology costs of 40-45 € per g CO2/km correspond to a mileage of approx. 20,000 km per year. 4 We refer here to the EC Regulation 443/2009.
As mentioned under 2.2, the three user groups (privately owned cars, business vehicles, and company cars) have different TCOs, especially due to the differing levels of taxation and mileage. In accordance to [23] we assumed for our calculations a market share of 40 % for private users and 30 % for business and company cars each. This segmentation proved to be valuable, particularly in the NPE, to enable the discussion of a balanced political master plan.
4 Main Results and conclusion
4.1 TCO and take rate without subsidies
Based on the outlined market model and the premises set here, there is the perspective that the average TCO disadvantage of electric drives drops to a level of € 1,000 a year by 2020.5 For business vehicles and company cars the TCO values vary slightly from this. Although they were included in the following quantity analysis, they are not further documented, in order to maintain a reasonable length of this paper. Substantial driver for the continuous improvement of xEVs’ TCO situation are battery costs decreasing to 280 €/kWh in 2020 and a steadily climbing oil price to $ 100/bbl in 2020. Political parameters such as taxes were frozen to 2011 values, as described above.
Table 4: Average TCO disadvantages and the corresponding market penetration for the
different segments.
Unit 2014 2020
Δ TCO A, B segment €/a 2,020 1,100Δ TCO C segment €/a 2,050 1,130Δ TCO D, F segment €/a 1,660 890
Market share BEV A, B segment6
0.1 % 0.6 %
Market Share REEV C segment
0.2 % 1.2 %
Market share PHEV D, F segment +
0.2 % 3.4 %
Market share all new xEV 0.5 % 5.2 %
Target for market share according to NPE
2.0 % 5.0 %
Table 4 displays exemplarily the determined values and the resulting TCOs for the private customers. This is the group with the biggest TCO disadvantage, as here the VAT on the price of acquisition increases the disadvantage, and tax- 5 Obviously, these are average values. For some users, xEVs are already profitable today. 6 Market shares referring to total market.

EVS27 International Battery, Hybrid and Fuel Cell Electric Vehicle Symposium 8
deductions are not possible. The second part of the table documents the market shares for the entire market. The initially substantial TCO disadvantages lead, together with the relatively small diffusion factors, to an estimated market share for all xEVs of only 0.5 % in 2014 and almost 2 % in 2017. A market share of 5 % would not be reached before 2020. In consequence, there will be only a total 450,000 xEVs on German roads by 2020, instead of the intended 1 million. Incidentally, for 2012 the model predicted the correct volume of 2,700 xEVs in Germany [cf. 16].
4.2 Excursus: International comparison
In order to have a wider basis for evaluation, we applied the PTD-model for other countries (especially those providing purchase incentives). While the TCO analysis can be calculated directly from the data available, the estimation of the DIF is more challenging. When relating the TCO advantages of xEVs in various countries to the corresponding quantity shares, this method enables conclusions on the DIFs. Therefore, we estimated the DIF from the observed market share in 2012. The result is the smallest for the UK with a DIF of about 1 %, for France 3 %, for the US 6 %. The highest “acceptance” of xEVs was observed in the Netherlands and Norway with a DIF of 10 % (cf. table 5).
Table 5: International comparison.
D UK F USA NL NOR
TCO-advantages vs. Germany7 [€]
- 5,500 3,5008 5,500 4,500 >10,000
Market share all xEVs. in 2012
1‰ 1 ‰ 3 ‰ 3 ‰ 6 ‰ 20 ‰
Resulting DIF 5 % 1 % 3 % 6 % 10 % 10 %
4.3 Effectiveness of subsidies According to the results of the model, the NPE’s target of 1 million xEVs by 2020 would be missed. Thus, we investigated under what conditions a corresponding doubling of the market share of xEVs by 2020 is possible. The sole aim here was to reduce the TCO disadvantage, while aspects concerning the DIF, such as infrastructure, number of available xEV models and customer acceptance, were not taken 7 Here by the example of a BEV in the A segment. 8 Current increase in incentive payment from 5000 to 7000 € not included, since not valid in 2012.
into account. We focus in the following on governmental subsidies as purchase incentive for customers, in order to reach a share of 5 % in 2015. Other analyzed measurements for the German market can be found in [16] and [18] or for the UK in [24].
For this purpose, a subsidy was simulated, which reduces the TCO disadvantage of electric drive trains to a level of 1,000 € p.a. in 2013 (i.e. 4,000 € during the four years of holding period for the first user). The differentiated subsidy concept includes state incentives, special depreciations, loans with low interest by the German Reconstruction Credit Institute (KfW) as well as non-monetary incentives, the last of which were monetized in terms of their consequences for this model. These components are described in the second part of [18]. Due to the expected cost decrease by xEVs in the years to come, the subsidies show a decreasing trend, too. In the scenario it is reduced to zero until the year 2020 (cf. figure 3).
Evidently, PHEVs and also REEVs reach the biggest market share, while BEVs do not even comprise a tenth of the overall xEV market. This is in line with most other current studies [15]. The reason for this is seen mainly in the limited infrastructure and range, which affect BEVs more than PHEVs and REEVs – manifesting in the small diffusion factors for this technology (table 1). Furthermore, users of more expensive vehicles systematically tolerate higher additional TCOs, as nominal equal TCO disadvantages lead to a smaller relative reduction in the market share of expensive vehicles compared to cheaper vehicles.
4.4 Sensitivities: When will xEVs flood the German market?
The PTD-approach presented here, assuming the premises agreed upon within the NPE leads to a xEV market share of up to 5 % in Germany in the year 2020. This market share seems to be achievable even earlier if a subsidy is granted correspondingly. Nevertheless, xEVs would still turn out as niche products.

EVS27 International Battery, Hybrid and Fuel Cell Electric Vehicle Symposium 9
Figure 3: TCO disadvantages and the corresponding market penetration of xEVs for the different segments in Germany until 2020. Base Scenario and “1 million xEV Scenario” including subsidies.
In order to determine at which point in time xEVs are going to flood the German market, we have calculated two additional scenarios, where the subsidy for xEVs is continued at the same magnitude until 2020. Scenario 1 adopts the currently high support in other industrial countries (table 5) and assumes a high subsidy of € 5,000 per vehicle. In this case we receive a market share for xEVs in 2020 of over one third – for the especially favored larger PHEVs even over 50 %.
In comparison, scenario 2 is rather moderate. The basic idea here is to promote xEVs according to their contribution to CO2 reduction. Each of the considered xEVs reduces the direct CO2 emissions compared to its conventional counterpart by approx. 12 t. When comparing different political mechanisms of sanctions for reducing CO2 emission in the EU and Germany – for example the German Renewable Energy Act, EEG – it seems plausible, that until 2020 every t CO2 mitigated is rewarded with a value of about 100 €. If we freeze this sum as a plausible long-
term support, a respective xEV subsidy of 1,200 € per car is the result. This would lead to federal expenses of about 0.5 billion € and a market share of around 15 % by 2020 – in larger segments even of one quarter. Then, the xEVs market could be regarded as a mass market.
5 Conclusions This paper presents the PTD-method for the simulation of shares of xEV volumes. The emphasis was placed on an uncomplicated handling and communication qualities towards different decision makers. Core of the model are the TCO demand function and the diffusion factor (DIF). The TCO demand function allows deriving a cost driven market share independent of the drive train technology. The model calculates the TCO differences between xEVs (i.e. BEV, REEV, and PHEV) and their respective conventional counterparts (gasoline or diesel car). Additional factors influencing the purchase decision – especially all hampering factors in the early market

EVS27 International Battery, Hybrid and Fuel Cell Electric Vehicle Symposium 10
phase – are taken into account with the help of the technology-specific DIF.
The PTD-method represents a radical simplification compared to other, more sophisticated and detailed approaches. The TCO demand function is an adaptation of the situation for gasoline and diesel vehicles and is entirely based on empirical values. The TCO situation of passenger cars is transparent and reproducible at any time, given a sufficient documentation of premises. In contrast, the assessment of promoting and inhibiting factors for xEV sales is still subjective today. It is therefore appropriate to work with an easily comprehensible factor, which allows a clear comparison of technologies possible and simplifies the discussion between heterogeneous groups.
Furthermore, this paper presents the PTD-market model applied by a highly qualified, interdisciplinary commission of experts – the working group 7 of the NPE – taking the German passenger car market as an example. In this process, stretched over the years 2011 and 2012, it was to answer the question under which conditions the goal of 1 million xEVs by 2020 can be achieved. The methodological approach was tailored to this question and further assumptions were coordinated with other working groups of the NPE.
The most important results: - Without subsidies, only half of the targeted
1 million xEVs by 2020 can be expected (market share of 5 % xEVs).
- For an exact simulation of the target line set by the NPE, a subsidy of 4,000 € per xEV in 2014 and 1,500 € in 2017 was needed. The xEV share will further increase, even if subsidies phase-out completely until 2020.
- Already smaller changes of parameters in favor of xEVs (increase of oil price, stronger decrease of battery costs, etc.) would lead to a significant rise in xEV market shares.
- A continuous subsidy of approx. 1,200 € per xEV is in accordance with the so avoided CO2 emissions and comparable to subsidies in other CO2 related promotional programs like the EEG. It would lead to a significant increase and stable two digit market shares of xEVs.
- Since all three relevant factors (TCO, TCO-demand function and DIF) turn out relatively well for Plug-In hybrids, this
technology is expected to have the largest quantity-potential in the decade to come.
The presented PTD-approach has been applied successfully on several occasions (cf. section 1). In the example of the NPE-process it enabled a heterogeneous group to find a common understanding of the future of electric mobility. Here, both the premises established in 2011, and the results achieved have proven to be robust. Also, the xEV numbers calculated for the year 2012 have been confirmed in reality.
Moreover, we see great potential for further developments of the PTD-method to produce forecasts in the field of electric mobility: - As shown in section 4.2, it constitutes a basis
for international comparisons of market conditions for xEVs.
- The scope shown in sections 2.2 and 3 can be refined for specific in depth analysis. For example it is possible to specify the market potential for certain user groups (e.g. commuters with favorable usage patterns referring to xEVs) or further xEV characteristics.
- The DIF exhibited under section 2.3 helped to integrate the different expert views within the NPE. Obviously, the factors considered within the DIF will be better understood in the future and can then be integrated. For example, it can be expected that it will be possible to better quantify the expected density of charging stations and their effect on customer behavior.
The common view of politics, industry, science and public on the future development of electric mobility is a prerequisite for joint action of all stakeholders and thus for the success in this new and innovative field of technology. The PTD-approach shown here allows this common view by combining scientific accuracy with a plain and intelligible design. We therefore consider it a promising approach to support the further development of electric mobility.
Acknowledgments We would like to thank Christian Will for his patient and tireless help to complete this article.

EVS27 International Battery, Hybrid and Fuel Cell Electric Vehicle Symposium 11
References [1] Mock, P., D. Hülsebusch, J. Ungethüm, and
S. Schmid (2009): Electric vehicles – A model based assessment of future market prospects and environmental impacts, in proceedings of EVS24, Stavanger, Norway.
[2] TNO, AEA, CE Delft, Ökopol, TML, Ricardo, IHS Global Insight (2012): Support for the revision of Regulation (EC) No 443/2009 on CO2 emissions from cars, Project Report, Delft, the Netherlands.
[3] RWTH-Aachen University (2013): CO2-Reduzierungspotentiale bei Pkw bis 2020, Project Report, Aachen, Germany.
[4] Sander de Bruyn, S., L. Brinke, B. Kampman, and M. Koopman (2012): Literature review on employment impacts of GHG reduction policies for transport, Project Report, Delft, the Netherlands.
[5] Mueller, M., and P. de Haan (2009): How much do incentives affect car purchase? Agent-based microsimulation of consumer choice of new cars – Part I: Model structure, simulation of bounded rationality, and model validation, Energy Policy 37, 1072-1082.
[6] Al-Alawi, B.M., and T.H. Bradley (2013): Review of hybrid, plug-in hybrid, and electric vehicle market modeling studies, Renewable and Sustainable Energy Reviews 21, 190-203.
[7] Jochem, P., S. Babrowski, and W. Fichtner (2013): Electric Vehicle Market Penetration and Corresponding CO2 Emissions: A German Case Study for 2030, Proceedings of IAEE-Conference, Düsseldorf, Germany.
[8] Sullivan, J.L., I.T. Salmeen, and C.P. Simon (2009): PHEV market place penetration: an agent based simulation, University of Michigan Transportation Research Institute, Ann Arbor, MI, USA.
[9] Achtnicht, M. (2012): German car buyers' willingness to pay to reduce CO2 emissions, Climatic Change 113(3), 679-697.
[10] Higgins, A., P. Paevere, J. Gardner, and G. Quezada (2012): Combining choice modelling and multi-criteria analysis for technology diffusion: An application to the uptake of electric vehicles, Technological Forecasting and Social Change, 79, 1399-1412.
[11] Densing, M., H. Turton, and G. Bäuml (2012): Conditions for the successful deployment of electric vehicles – A global
energy system perspective, Energy 47, 137-149.
[12] Gomez Vilchez, J.J., P. Jochem, and W. Fichtner (2013): The Impact of Electric Vehicles on the Global Oil Demand and CO2 Emissions, in proceedings of World Conference of Transport Research Society, Rio de Janeiro, Brazil.
[13] Eggers, F. and F. Eggers (2011): Where have all the flowers gone? Forecasting green trends in the automobile industry with a choice-based conjoint adoption model, Technological Forecasting and Social Change, 78, 51-62.
[14] Kieckhäfer, K., G. Walther, J. Axmann, and T.S. Spengler (2009): Integrating agent-based simulation and system dynamics to support product strategy decisions in the automotive industry, in: Rosetti, M.D., R.R. Hill, B. Johansson, A. Dunkin, and R. Ingalls (Eds.): Proceedings of the 2009 Winter Simulation Conference, Austin, Texas, USA, 1433-1443.
[15] UKPIA (UK Petroleum Industry Association) and RAC (British Royal Automobile Club Foundation) (2013), Powering Ahead – The future of low-carbon cars and fuels, London, UK.
[16] NPE (National German Platform for Electric Mobility) (2011): Zweiter Bericht der Nationalen Plattform Elektromobilität. http://www.bmu.de/files/pdfs/allgemein/application/pdf/bericht_emob_2.pdf.
[17] NPE (National German Platform for Electric Mobility) (2012): Zwischenbericht der Nationalen Plattform Elektromobilität. http://www.bmu.de/files/pdfs/allgemein/applica tion/pdf/bericht_emob_bf.pdf.
[18] Pfahl, S. (2013): Alternative Antriebs-konzepte: Stand der Technik und Perspektiven – Die Sicht der Automobil-industrie, in: Jochem, P., W.-R. Poganietz, A. Grunwald, and W. Fichtner (Eds.): Alternative Antriebskonzepte bei sich wandelnden Mobilitätsstilen, Karlsruhe, 81-108.
[19] International Energy Agency (IEA) (2010): World Energy Outlook 2010, Paris, France.
[20] Ricardo-AEA (2009): Market outlook to 2022 for battery electric vehicles and plug-in hybrid electric vehicles, Project Report, Harwell Oxford, UK.
[21] Concawe, Eucar (European Council for Automotive R&D), and JRC (Joint Research Centre of the European Commission) (2008): Well-to-Wheels analysis of future automotive fuels and powertrains in the European
EVS27 International Battery, Hybrid and Fuel Cell Electric Vehicle Symposium 12
context – TANK-to-WHEELS Report, Version 3, Brussels, Belgium.
[22] Concawe, Eucar, and JRC (2011): Well-to-Wheels analysis of future automotive fuels and powertrains in the European context – TANK-to-WHEELS Report, Version 3c, Brussels, Belgium.
[23] KBA (German Federal Motor Transport Authority) (2013), KBA database, http://www.kba.de
[24] Brand, C., J. Anable, and M. Tran (2013): Accelerating the transformation to a low carbon passenger transport system: The role of car purchase taxes, feebates, road taxes and scrappage incentives in the UK, Transportation Research Part A: Policy and Practice 49, 132-148.
Authors
Stefan Pfahl is head of the CO2-Strategy-Team within the Daimler R&D-Department. He is an expert in innovation- and technology management and modelling of future markets concerning powertrains. He holds a PhD in economics and political sciences. He represents the Daimler AG in the German National Platform for Electric Mobility
Patrick Jochem is, leader of the research group “transport and Energy” at the chair of energy economics and senior researcher at the Karlsruhe Service Research Institute (KSRI) at KIT. He received his PhD in transport economics about CO2 emissions in road transport and holds a Diploma of economics from the university of Heidelberg, Germany.
Wolf Fichtner is Director of the Institute for Industrial Production and the French-German Institute for Environmental Research. He is full professor and holder of the Chair of Energy Economics at KIT. His main areas of research are Energy System Modelling and the Techno-economic Analysis of Energy Technologies.