when subsidized r&d-firms fail, do they still stimulate
TRANSCRIPT

Discussion Papers No. 399, December 2004 Statistics Norway, Research Department
Jarle Møen
When subsidized R&D-firms fail, do they still stimulate growth? Tracing knowledge by following employees across firms
Abstract: Public R&D subsidies aim to target particularly risky R&D and R&D with large externalities. One would expect many such projects to fail from a commercial point of view, but they may still produce knowledge with social value. Such knowledge is likely to be embodied in workers or teams of workers. I utilize a large matched employer-employee data set and test for knowledge diffusion from subsidised technology firms transmitted through the labor market. The specific case analysed is a series of Norwegian IT-programs so far considered unsuccessful, but which have been linked to the rise of a new generation of successful IT-firms. It has been argued that know-how and networks built up in leading companies during the programs still `fertilize' the IT-industry even though many of the companies have exited. I find limited support for this claim. On the positive side, the market value of work experience from subsidized firms does not seem to have been reduced by the fact that the firms did not succeed commercially, but workers from subsidized firms have not outperformed similar workers without this experience, either. Furthermore, firms that are spin-offs from formerly subsidized firms seem to perform below, rather than above average.
Keywords: R&D-subsidies, Knowledge spillovers, Human capital, Labor mobility,
Displaced workers, Spin-off firms, IT-industry, Program evaluation, Matched employer-employee data
JEL classification: J24, J31, J62, O32
Acknowledgement: This paper has benefitted from numerous discussions with Tor Jakob Klette, and is dedicated to his memory. I have received useful comments from M. Diane Burton, Giulia Faggio, Torbjørn Hægeland, Adam Jaffe, Finn Kydland, Oddbjørn Raaum, Kjell G. Salvanes and Manuel Trajtenberg. Remaining errors and all opinions expressed are the sole responsibility of the author. The project is financed by the Research Council of Norway.
Address: Norwegian School of Economics and Business Administration, Department of Finance and Management Science, Hellevn. 30, 5045 Bergen, Norway; and Statistics Norway, Research Department. E-mail: [email protected] http://www.nhh.no/for/cv/moen-jarle.html. Tel: + 47 55 95 96 12. Fax: + 47 55 95 96 50.
Discussion Papers comprise research papers intended for international journals or books. A preprint of a Discussion Paper may be longer and more elaborate than a standard journal article, as it may include intermediate calculations and background material etc.
Abstracts with downloadable Discussion Papers in PDF are available on the Internet: http://www.ssb.no http://ideas.repec.org/s/ssb/dispap.html For printed Discussion Papers contact: Statistics Norway Sales- and subscription service NO-2225 Kongsvinger Telephone: +47 62 88 55 00 Telefax: +47 62 88 55 95 E-mail: [email protected]

1 Introduction
Public R&D subsidies aim to target particularly risky R&D and R&D with large ex-
ternalities. One would expect many such projects and firms to fail from a commercial
point of view, but they may still produce knowledge with social value. Such knowledge
is likely to be embodied in workers or teams of workers. In order to assess it’s value, one
need to trace workers as they move across firms and industries seeking to maximize the
returns to their human capital. Consider the early days of the semiconductor industry
as an example of the potential importance of this approach. If evaluating the social
returns to R&D contracts awarded pioneering firms such as Sprague Electric, Shock-
ley or Fairchild based on the performance of these firms alone, it seems clear from
historical accounts that the return would appear modest. Yet, it is well documented
inn case studies that key technologies later utilized in the semiconductor industry by
tremendously successful companies like Intel, was developed in these early entrants
and transferred by employees to new firms better suited to exploit the technologies
commercially, see e.g. Holbrook et al. (2000), Jackson (1997) or Saxenian (1994).
A possible ‘scrap value’ associated with unsuccessful R&D projects and firms may
significantly influence the social returns to R&D and reduce the overall risk associ-
ated with technology programs. This issue has so far not been investigated in the
technology program evaluation literature, nor has there been much empirical analysis
of labor market knowledge flows or spin-off firms in general. The recent availability
of large matched employer-employee data sets, however, makes it possible to analyze
statistically the importance of human capital and employee mobility.
This paper ‘re-evaluates’ a series of Norwegian technology programs in the 1980s
that subsidized IT manufacturing firms. A previous evaluation by Klette and Møen
(1999) concluded that “the IT-programs were largely unsuccessful”. Later, however,
claims have been made that the growth of the Norwegian IT-industry in the late 1990s
was stimulated by knowledge built up in formerly subsidized firms. In particular, em-
ployees of the fallen industry leader, Norsk Data, have been pointed to as key contrib-
utors in a new generation of successful firms. Norsk Data was a ‘national champion’
and a leading minicomputer company. It was considered the third most profitable
computer company in the world in the mid 1980s, but had considerable difficulties in
adapting to the technology shift in the late 1980s represented by the introduction of
PCs and open standards. In 1989 mass layoffs were unavoidable, in 1991 it closed
down its manufacturing plants and in 1993 what little was left of the company went
bankrupt.
One expression of the idea that Norsk Data had a lasting impact on the industry,
1

can be found in a publication from the Research Council of Norway (2000) presenting
IT (ICT) firms and technologies that have benefitted from R&D subsidies. In the
introduction the Council states that1
“[t]he bankruptcy in Norsk Data received much attention, and left the im-
pression that the Norwegian ICT industry was severely injured. This was
not the case. Know-how was embedded in the employees, and these em-
ployees were rather quickly absorbed by other Norwegian ICT-firms.”
It may not be very surprising that the Research Council in this way tries to improve
upon the public impression of Norsk Data, given that the firm had received massive
subsidies2. A similar, but even stronger statement, however, was made by Norway’s
leading engineering magazine, Teknisk Ukeblad, one year earlier. In the fall of 1999,
this bulletin of the Norwegian Engineering Association wanted to elect the ‘engineering
achievement of the century’3. Second of ten nominees was Norsk Data. The magazine
argued that this ‘industrial adventure ... left behind a thousand professionals whose
knowledge still fertilize Norwegian information technology”4.
It seems that the statements quoted above are based on knowledge about a hand-
ful of cases. Both the Research Council and Teknisk Ukeblad mention e.g. Dolphin
Interconnect Solutions, a company that came out of the R&D department in Norsk
Data when it closed down. In 2000 a part of Dolphin was sold to Sun Microsystems
and in the business press, the price was pictured as sensational. Such ‘spin-off returns’
from previous investments cannot be captured by ordinary microeconometric program
evaluation methodologies which focus on the performance of the subsidized firms. In
1In my translation.2Norsk Data was the largest recipient among firms subsidized by the National Program for In-
formation Technology lasting from 1987 to 1990, and received more than 12 percent of the budget
allocated to commercial R&D under the program. Given the size of the company, this does not nec-
essarily imply that the subsidies were large relative to Norsk Data’s private R&D investments, but
money from the National Program for Information Technology came on top of subsidies from pre-
ceding programs and substantial public procurements which were used actively to help the company
develop new technology throughout its history. Cf. Harlem et al. (1990) and Bjerkan and Nergård
(1990).3Cf. Valmot (1999). A list of all nominees is given in the same journal (Teknisk Ukeblad), August
12th 1999, pp 10-11.4My translation. Spelled out in more detail: “All over Norway we see spin-off effects from the
Norsk Data era; thousands of people that worked in or with Norsk Data built up know-how whose
existence it is hard to imagine without this company. Many of these people started new firms together
with old colleagues or business contacts, others have contributed with their experience in other sectors
of the economy.” The article was titled “The lighthouse of the Norwegian IT-industry”.
2

order to evaluate whether Dolphin and similar cases are representative, a quantitative
framework utilizing matched employer-employee data is called for.
Using such data, I find that scientists and engineers with experience from subsidized
IT-firms to a much larger extent than other scientists and engineers in high-tech in-
dustries migrated to the rapidly growing IT service industry. They have not performed
bad, but there is no evidence indicating that these scientists and engineers played a
particularly prominent role in the growth process, either. Nor do spin-off firms from
the subsidized firms perform particularly well. In fact, they seem to have performed
below, rather than above, average. One possible explanation for these discouraging
results is that the technology shift in the late 1980s rendered much of the intellectual
human capital built up under the programs obsolete.
The rest of this paper is organized as follows: The next section discuss the data,
the empirical approach and the definition of key variables. Section three describes the
flow of scientists and engineers out of subsidized and non-subsidized firms. Section four
analyze the value of experience from subsidized IT-firms using wage regressions on a
sample of scientists and engineers with experience from high-tech and IT-industries.
Section five analyze the performance of spin-off firms, while section six concludes.
2 Data and empirical approach
2.1 Data
The data used in this study come from four main sources: Governmental administrative
records prepared by Statistics Norway, the biennial R&D survey conducted by the
Royal Norwegian Council for Scientific and Industrial Research and Statistics Norway,
the manufacturing statistics of Statistics Norway, and the statistics of accounts for non-
financial joint-stock companies prepared by Creditinform and Statistics Norway. The
Norwegian data are extraordinary in the sense that the entire working population can
be traced across employers over more than a decade, and in the sense that extremely
rich information is available both about the workers and about their employers. Cf.
the data appendix in the working paper version, Møen (2002), for further details and
descriptive statistics.
2.2 Hypothesis and approach
Figure 1 compares employment growth in subsidized firms with employment growth in
other categories of high-tech firms. There is a strong decline in employment in sub-
3

sidized firms5. Given this picture, the dismal conclusion of Klette and Møen (1999),
evaluating the technology programs based on firm level data, are not surprising. How-
ever, as suggested in the quotes in the previous section, this interpretation may be
misleading. A more positive way to read Figure 1 is to stress that workers were leaving
the subsidized firms on a large scale, and that they may have contributed to growth
elsewhere. Figure 2 pictures the growth in the Norwegian IT industry, as defined by
OECD, from 1995 to 1999. In these years the IT service industry grew considerably
faster than the rest of the private sector. The hypothesis under consideration in this
paper, is that the boom in R&D subsidies and R&D investments in the Norwegian
IT manufacturing industry in the mid and late 1980s, later caused growth in this or
other sectors of the economy through transfer of knowledge embodied in people. Es-
tablishing a possible causal link of this type is demanding and involves constructing a
counterfactual situation for the firms and workers involved.
Compared to the standard program evaluation literature, cf. e.g. Heckman, Lalonde
and Smith (1999), several complications are present. First, the ‘treatment’ is not di-
chotomous. R&D investments have both an intensity dimension and a time dimension.
Moreover, there is no clear-cut start of the program as various technology programs
have replaced each other for several decades prior to the period that can be observed6.
Also, the selection problem, fundamental to all program evaluation where participa-
tion is not randomized, has a peculiar twist. There is a ‘double selection’ process
where firms are selected into programs, and workers self-select into firms. Deciding on
a relevant and valid comparison group under these circumstances is difficult.
My responses to the problems listed above will be as follows: First, with respect
to the intensity and time dimension of treatment, I will use a regression framework so
that continuous variables can be utilized in addition to a dichotomous classification,
based on cut-off values. Next, with respect to missing data for previous programs,
little can be done. I will, however, argue below that this is not a severe obstacle.
Finally, my response to the potential selection problem will be to allow for individual
fixed effects. A more explicit approach to the selection problem is difficult due to lack
5Employment in non-subsidized R&D firms and other R&D firms appears to fluctuate more than
the other two categories simply because there are fewer workers behind these graphs. The strong
decline in employment for non-subsidized IT R&D firms from 1992 to 1993 is driven by one single
firm that ran into trouble. Much of the subsequent growth is due to the same firm recovering. The
negative employment growth in subsidized IT R&D firms is not driven by Norsk Data alone. Leaving
out this company does not alter the picture significantly. Furthermore, looking at sales growth gives
a very similar picture, but then one cannot keep track of plants which change industry classification
from manufacturing to services.6Cf. Klette and Møen (1999) for details.
4

of good instruments for subsidy awards and career choice. However, positive selection
creates a bias against my conclusion that the programs were not successful and negative
selection is not particularly relevant since R&D programs are meant to stimulate high
quality research7.
2.3 Defining ‘treatment’
Defining IT R&D-firms, other R&D-firms and high-tech Treatment, in the
context of this paper, is having work experience from a subsidized R&D firm in the
IT manufacturing industry. In principle, therefore, we would like to compare similar
workers with experience from IT-firms with and without subsidies. However, it is
difficult to define an IT-industry since information technology does not constitute a
separate class in standard industrial classification schemes8. Too narrow a set of classes
will leave out a lot of true IT-firms, whereas a broader set will include a lot of non-IT
firms. I get around this problem by utilizing a unique variable in the R&D surveys
which identify the IT-content in each firm’s R&D investments. Using this variable in
combination with R&D man-years, I define IT R&D-firms in the manufacturing sector
as firms with an intensity of IT-related R&D above 10 percent9. This definition is
designed to exclude a large number of firms that perform small IT projects without
having information technology as their main focus or being technologically advanced.
Similarly, I define R&D-firms in general as firms with an intensity of total R&D (IT
and non-IT) above 10 percent10.
Almost without exception, units classified as IT R&D-firms according to the above
definition belong to ISIC 382-385 (NACE 29-35), i.e. the machinery, electronics, trans-
portation equipment and technical instruments industries. I will hereafter refer to these
industries together as ‘high-tech’.
Defining subsidized firms Since subsidies are awarded unevenly among recipients,
there is also a problem of how to define a subsidized IT R&D-firm (hereafter referred
7This is not to say that negative selection could not exist. Various political economy processes may
lead the subsidies to troubled firms, cf. Klette and Møen (1999) for a discussion. Then, however, the
programs would not look successful, nor be successful.8Cf. e.g. OECD (2000).9The R&D-variables are not available, nor as relevant, for the IT service sector. This sector will
be defined using the OECD definition based on industrial classification codes.10R&D intensity is measured as R&D man-years per employee (per year) at the three-digit line of
business level within firms. Cf. the data appendix in Møen (2002) for more information. In the text,
I will not distinguish between firms and lines of business within firms.
5

to as a subsidized firm). For a subsidy to have an effect on a firm’s research activities,
it must be of some significance. Hence, any subsidy should not qualify, and I define
the treatment group as IT R&D-firms with an intensity of subsidized IT-related R&D
above 0.5 percent. For a treatment firm with an intensity of IT-related R&D at the
lower limit, i.e. 10 percent, this implies that at least 5 percent of the firm’s IT-R&D
must be subsidized11. The criteria is designed so that all large subsidy recipients known
from other sources, that can be identified in the data, are included.
Defining the treatment period Data on individual workers start in 1986, and the
era of large R&D subsidies ended in 1990. Hence, I will consider the years 1986 to 1990
to be the ‘treatment period’. As mentioned, there were targeted IT-programs prior to
1986, but I do not believe the lack of data from these early years is a severe restriction.
The largest R&D subsidy program were in effect from 1987 to 1990, and the largest
IT R&D contracts were awarded in the years 1985 to 1987. Furthermore, with some
stability in employment relationships, a certain persistence in program participation,
and both a lag and some persistence in the effect of subsidies, there will be a positive
correlation between the unobserved and the observed treatment.
Categorizing workers I want to assess the value of the core technological know-how
built up in the subsidized firms. This know-how is likely to be possessed by scientists
and engineers, and my analysis will therefore focus on this group. With the treatment
period lasting from 1986 to 1990, many scientists and engineers will have had several
employers, and firms may also have changed subsidy status within this time interval.
I categorize scientists and engineers as having ‘experience from subsidized firms’ if
they are attached to a subsidized firm in at least one year. Similarly scientists and
engineers are categorized as having ‘experience from IT R&D-firms’ and ‘experience
from R&D-firms’ if they have at least one year experience from such firms in 1986 to
1990.
Sample size The employee sample consists of male scientists and engineers born
after 1935 and employed full time in a high-tech firm at least one of the years 1986 to
199012. Altogether there are 3784 scientists and engineers in the sample. 3419 of these11I know for each firm the share of R&D that is classified as IT, but not the share of subsidies used in
IT-projects. However, since the government had IT high on its agenda, I assume that R&D-subsidies
awarded to firms that report to do IT R&D is related to their IT-projects. If subsidies exceed a firm’s
IT R&D-investments, the excess subsidies are excluded.12I have excluded women because they are known to have different career patterns and preferences
than men, and do not constitute a large share of the labor stock in these industries.
6

are in firms with known R&D-investments. There are 1755 scientists and engineers
with experience from R&D-firms. Out of these 1290 have experience from IT-R&D
firms. In this group 1095 have experience from subsidized firms. About a quarter of
the workers in subsidized firms were employed by the industry leader, Norsk Data.
There are altogether 1173 plants (constituting 957 firms) with known R&D in the
high-tech industries in the period 1986 to 1990. 197 plants belong to ‘R&D firms’, i.e.
having an intensity of total R&D above 10 percent. Out of these, 108 belong to ‘IT
R&D-firms’ and 79 belong to subsidized firms.
There are on average 4.0 observations of each plant in the years 1986 to 1990. Note
that firms, and thereby plants, can change category between years. When giving the
number of plants in different categories above, plants are counted as belonging to an
R&D firm or IT R&D firm if it has this status in at least one of the years 1986-1990.
Continuous treatment variables The firm categories defined above are based on
cut-off values for R&D intensities that are somewhat arbitrary, and that conceal a
significant amount of variation in research and ‘program’ exposure. The intensity
of R&D and subsidies varied between firms within each category, and within firms
over time. Furthermore, workers may have stayed with several employers during the
program years. In many of the analyses that follow it is possible to use such continuous
variation in treatment, and therefore I construct a stock measure of experience in
addition to the dummies. This is done by attaching to each worker information about
his employers R&D investments, and adding up intensities in R&D, IT R&D and
subsidized IT R&D over the years 1986 to 1991. I use these sums as measures of the
human capital accumulated13.
2.4 A description of workers and firms by treatment cate-
gory14
IT R&D firms are concentrated in the following industries: Computer and office ma-
chinery, Other machinery, Radio, TV and communication equipment, Insulated cables
13Since the intensities are measured in man-years per employee per year, the unit of the ‘experience
stocks’ are years. This should not be interpreted literary, however. It will only be a precise measure
of individual R&D experience if all workers participate equally in the firms’ R&D projects. This is
obviously not the case, and one should rather think of R&D intensities as proxies for how much there
is to learn in a firm at a given time. Summing the intensities over the time dimension then gives a
measure of on-the-job learning.14Detailed tables with descriptive statistics on workers and firms are given in the data appendix in
Møen (2002).
7

and wires, Professional and scientific instruments, and Photographic and optical goods.
Except for computers, non of these industries are dominated by IT R&D firms, however.
Subsidized and non-subsidized IT R&D-firms coexist in most industries mentioned.
Other R&D firms and non-R&D firms are represented in a wider set of subindustries
than the IT R&D firms. These industries comprise the production of various types of
machinery, electrical equipment and transport equipment15.
An important thing to notice is that the larger part of the IT-industry received
subsidies. There are 1095 scientists and engineers with at least one year of experience
from subsidized IT-firms and 195 that only have IT experience from non-subsidized
firms. Given that the authorities were determined to stimulate the IT-industry, this
is perhaps not surprising, but it leaves a relatively small, and possibly non-random,
control group. That being said, however, there are very few observable differences
between workers in subsidized and non-subsidized IT R&D-firms. Furthermore, my
analysis is not dependent on this dichotomous classification, as I also utilize continuous
experience variables as explained above16.
Subsidized firms are somewhat larger, more unionized and more likely to have a
rural location than non-subsidized firms. They are also more often foreign owned and
younger. The most interesting difference, however, is that subsidized firms had signif-
icantly higher growth rates in the years preceding the awarded subsidies. Presumably,
recent success must have been an important criteria when subsidies were awarded.
With respect to intensity in R&D and IT-R&D the two groups of firms are close to
identical. ‘Other R&D firms’ are somewhat less R&D intensive than IT R&D-firms and
have a slightly lower educational level, but they are more capital intensive. Non-R&D-
firms have an even lower educational level than R&D-firms and are more unionized
and less often foreign owned. Non-R&D firms are clearly the oldest group of firms.
With respect to educational composition, subsidized firms are slightly more diver-
sified with respect to the human capital they possess than non-subsidized firms. All
R&D-firms, however, even non-IT firms, are highly intensive in electrotechnical engi-
neering skills. Non-R&D firms also employ many workers of this type, but mechanical
engineers is the most dominant skill group in these firms.
Summing up the differences between subsidized and non-subsidized IT R&D-firms,
the main impression left by the descriptive statistics is that workers in subsidized and
non-subsidized firms are quite similar, although there are some differences between the
two types of firms. In particular, the technology programs seem to have favored firms
15About 82 percent of the worker-year observations are from firms with R&D information available.16This creates substantial variation, as subsidies were very unevenly distributed across firms. This
was part of a long tradition where ‘national champions’ were considered important catalysts for growth.
8

with rapid growth.
3 Tracing workers out of the subsidized firms
A natural first step when analyzing potential growth effects brought about by labor
mobility out of subsidized firms, is to see where the technical expertise became em-
ployed later on. The results of such an analysis are presented in Table 1. The first
column shows the industry of occupation in 1997 for scientists and engineers with ex-
perience from subsidized firms. The main comparison group is scientists and engineers
with experience from IT R&D-firms that were not subsidized. These are tabulated in
column 2. Columns 3 and 4 give mobility patterns for scientists and engineers with
experience from other R&D-firms in the high-tech industries, i.e. firms whose research
activities were not strongly IT-related, and scientists and engineers without experience
from R&D-intensive firms.
The main difference between subsidized and non-subsidized IT R&D-firms is that
a much higher share of scientists and engineers from the subsidized firms has moved
to IT-service industries. 30 percent of scientists and engineers from subsidized IT-
firms became employed in the IT-service industry17 versus 14 percent of scientists and
engineers with experience from non-subsidized IT-firms. The other columns show that
the less IT and R&D intensive the firms, the less likely are the scientists and engineers to
move to the IT service sector. The table suggests that the subsidized IT-activities were
service related, or at least that the IT-service industry offered the best opportunities
for scientists and engineers from subsidized firms when these firms closed down.
3.1 A brief summary of some ‘non-wage’ labor market out-
comes
The main message to take away from Table 1, is that the possibility of a link between
R&D subsidies awarded in the 1980s and growth in the IT-service sector in the 1990s, is
present in the data. Next, I investigate how workers from the subsidized firms actually
performed in the labor market. Were e.g. workers from the subsidized firms “rather
quickly absorbed” in the labor market, as claimed by the Research Council? Some
indicators that can throw light on this issue are reported in Table 2. Row 1 reports
the share of displaced workers that had to move to a different municipality to find a
new job. Row 2 reports the share of workers who participated in active labor market
17Looking separately at workers from Norsk Data, the share is as high as 46 percent.
9

programs. Row 3 reports the average employment rate following the program, row
4 reports the share of workers who took further education and finally row 5 reports
the share of workers that became self-employed18. Taken together, the results do not
suggest that workers from subsidized firms had any particular difficulties in finding
new jobs. Having established this, I will move on to analyze earnings.
4 Wage regression analyses
If know-how built up in the subsidized firms was not firm-specific and provided a basis
for growth in other firms later on, we would expect experience from subsidized firms to
have higher value in the labor market than experience from other firms. This assertion
can be tested using extendedMincer (1974) wage regressions. Lacking a ‘pre treatment’
period, I start out exploring the effect of R&D and R&D subsidies on scientists and
engineers’ wages during the program. Next, I investigate wage growth following the
program and check the results obtained from these two analyses against the wage level
after the program. Given that know-how built up in the industry leader Norsk Data
has been considered particularly valuable, and that about one quarter of all scientists
and engineers with experience from subsidized firms have worked for this company, I
investigate the robustness off all results with respect to leaving out these workers.
4.1 The effect of R&D and subsidies on wages during the pro-
gram
Several mechanisms related to R&D, IT and subsidies may possibly have affected wages
during the program period. First and foremost, if scientists and engineers expected to
accumulate more general knowledge in subsidized firms (or in IT firms in general) than
in other firms, they should be willing to pay for this through lower wages19. To the
extent that subsidized firms promoted more advanced technologies, and technologies
considered to have a large future potential, such investments in general human capital
are conceivable, although risk aversion and liquidity constraints on the worker side may
reduce the effect. Another mechanism, possibly affecting the wages, is that subsidized
firms may have employed scientists and engineers of better (unobserved) quality. High-
18These numbers may be artificially low. Presumably, they do not include workers who are employed
in joint-stock companies that they own themselves. Self-employed are included in the wage analyses
presented in the next section.19This follows from classical human capital theory, cf. Becker (1962, 1964) and the discussion in
Møen (2005).
10

ability workers are necessary to develop frontier technologies, but high-ability workers
may also have a preference for working in a technologically advanced environment20.
The net effect of this on wages is not obvious. On one hand, high-ability workers have
better outside options, but workers with a preference for technologically advanced firms
may, on the other hand, accept wages below their outside option21. A final possible
mechanism is unions. The wage level in subsidized firms would be affected if the
workers were able to negotiate higher wages and thereby extract some of the subsidies
as rents.
Table 3, column 1, 2, 5 and 6 explores the wage level for prime aged male scientists
and engineers in high-tech industries in the program years by including measures of
R&D, IT R&D and subsidized IT R&D in a standard wage regressions. Both a dummy
variable approach (column 1 and 5) and a specification with continuous variables (col-
umn 2 and 6) are reported. The dummy approach utilizes the dummies for R&D firm,
IT R&D firm and subsidized IT R&D firm described in section 2. Note that these
dummies are nested in the sense that a subsidized firm is also an IT R&D firm which
is also an R&D firm. In specifications with continuous variables, I use intensities mea-
sured as the share of the work force doing R&D, IT R&D and subsidized IT R&D.
These variables are also nested, so that in order to find the total effect of a marginal
increase in IT R&D due to a subsidized project, all three of the reported coefficients
should be added.
In all regressions, workers in non-R&D firms is the baseline comparison group. Non-
reported control variables are listed in the subtext to the table. Among these variables
are 15 dummies for different academic degrees, hence, scientists and engineers are
compared within detailed educational groups.
Table 3, column 1 and 2, does not distinguish between subsidized and non-subsidized
IT R&D, and from Part A of the table, using the full sample, we see that the wage
level in IT R&D firms is significantly below the wage level in other R&D firms. The
average discount is between 2 and 4 percent. Non-IT R&D, however, does not seem to
affect wages. When distinguishing between subsidized and non-subsidized IT R&D, a
puzzling pattern appears. The dummy approach suggests that the lower wage level is
20The work of Almeida and Kogut (1999), Stern (1999) and others suggests that scientists and
technical personnel have preferences regarding the technological environment they work in.21Rosen (1986) provides a review of the theory of compensated differentials (equalizing differences).
Stern (1999) shows that this mechanism has relevance for scientists in the private sector. This is, in
the setting of my paper, supported by Steine (1992) who states that the company policy of Norsk
Data was to pay the same as similar firms, or somewhat less. He adds, “[i]t was attractive to work in
Norsk Data, so why be a wage leader?” (p. 50, my translation).
11

associated with work in subsidized firms while the specification with continuous vari-
ables suggests that the lower wage level is associated with work in non-subsidized firms.
A clue as to how these conflicting results can be reconciled can be found in Part B
of the table where workers from Norsk Data are excluded. Column 1 and 2, suggest
that the observed lower wage level in IT R&D firms is driven mainly by workers in
Norsk Data. If Norsk Data received enough IT subsidies per worker to be classified as
a subsidized firm, but had, relative to other firms, far higher total investments in IT
R&D per worker, this may explain the observed coefficients in Part A, column 5 and
6. This is not inconceivable. When sources like Bjerkan and Nergård (1990) describe
Norsk Data as a thoroughly subsidized company, they are not so concerned with di-
rect R&D subsidies as with preferential public procurement, and Norsk Data is in this
respect a special case22. The company is also special in a different respect relevant
for my analysis. The company was famous for rewarding their employees with shares,
something that received much attention in the business press. The discount that the
employees received when buying shares was counted as taxable labor income and is
therefore included in my wage measure23, but the stock market price of the shares in-
creased so rapidly and for so many consecutive years, that the employees were likely to
value the opportunity to buy shares in the company highly and trade this off against
ordinary wage compensation. Hence, some (but probably not all, cf. footnote 21) of
the apparent discount associated with Norsk Data may be an artifact of the company’s
unusual compensation scheme and not a true compensating differential24.
Looking at Table 3B, column 5 and 6, we see that even when workers from Norsk
Data are excluded, there is still a wage discount associated with workers in subsidized
firms. Both the dummy specification and the intensity specification suggest that the
discount is slightly less than 2 percent compared to non-subsidized IT R&D firms,
although only the intensity specification produces a significant coefficient25. Above I
have mentioned several mechanisms that may be behind this. In order to distinguish
between some of these possible mechanisms, the analysis is extended by interacting
R&D variables with experience, thereby examining wage profiles rather than average
22Cf. footnote 2.23Cf. Steine (1992, p. 54-55).24As far as I know, this wage policy was unique for Norsk Data at the time, as were their consistently
rising stock price. Stock options were not much used in the sample years. Due to a very unfavourable
tax treatment between 1991 and 1999, it was not much used in later years, either. For these reasons,
labor earnings is likely to be a fairly accurate measure of monetary compensation in other companies
than Norsk Data.25For the intensity specification, the discount is derived by multiplying the coefficient -0.488 with
0.036, the employers’ average intensity in subsidized IT R&D, cf. table A2 in Møen (2002).
12

wage levels. If the wage discount in subsidized firms is due to workers investing in
general human capital, one would expect it to be associated with young workers taking
a wage cut when entering the firms and then experiencing stronger wage growth as
their expectations about the value of on-the-job training become fulfilled26.
Table 3, cloumn 3, 4, 7 and 8 gives the results of including R&D, IT R&D and
subsidized IT R&D, interacted with workers’ experience. In column 3 and 4, we see
that scientists and engineers have a steeper wage profile in IT R&D firms than in other
firms. Consistent with the idea that IT is a general technology, cf. e.g. Bresnahan
and Trajtenberg (1995), these firms appear to offer lower wages early in the career in
exchange for higher wage growth thereafter. The beginning wages in IT R&D-firms
are about 10 percent lower than in other R&D firms, and the annual wage growth is
about 0.5 percent higher27. Interestingly, there are no significant differences between
R&D firms that don’t specialize in IT and non-R&D firms.
Moving on to column 7 and 8, distinguishing between subsidized and non-subsidized
IT R&D firms, one finds that the wage profile in subsidized firms is less steep than the
wage profile in non-subsidized firms. Hence, there is nothing in the data suggesting that
investments in general human capital were particularly large for workers in subsidized
firms.
4.2 The effect of experience from subsidized firms on wages
later in the career
A key issue in this study is how experience from subsidized firms affected wages later
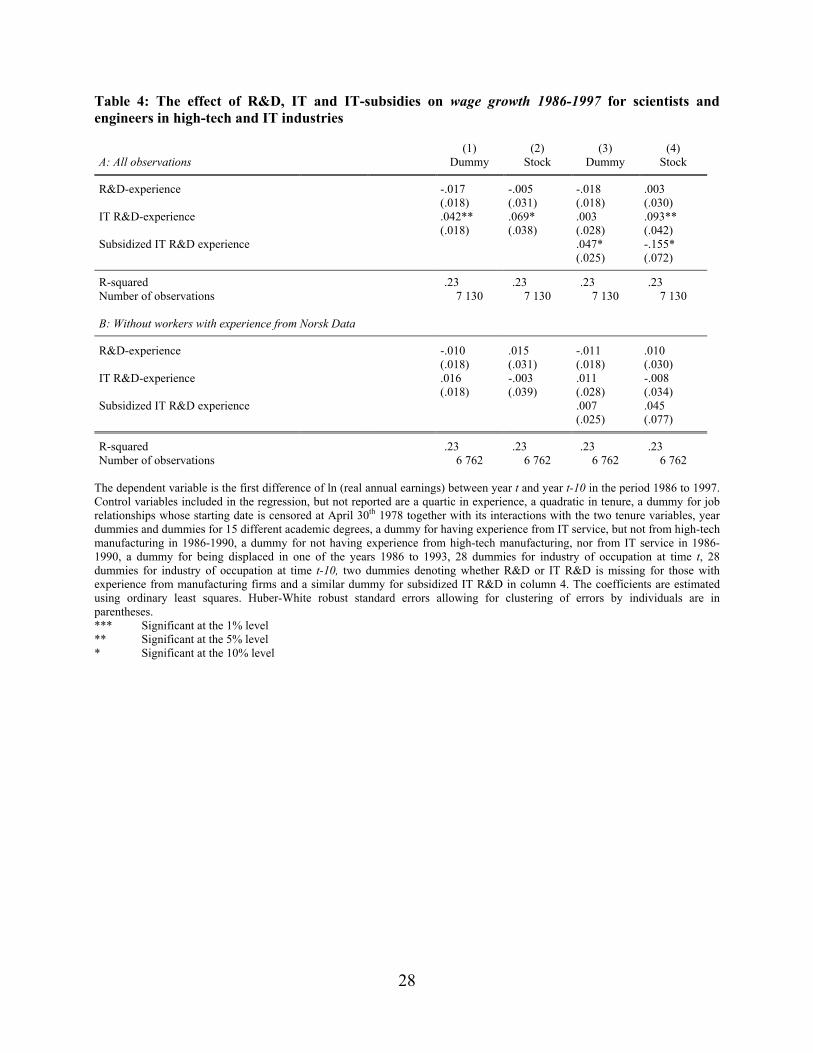
in the career. Table 4 contains the results of an analysis of ten year wage growth from
1986 and 1987 to 1996 and 1997. The advantage of looking at wage growth is that
potential differences in ability between workers are accounted for, and looking at the
full ten year interval takes one from one boom in the economy to the next. This is
26Workers may also pay for learning through lower wages later in their career, but that will be
difficult to separate from the wage premia they receive on their previous human capital investments,
cf. Møen (2005). From a theoretical point of view, their willingness to invest in human capital should
fall gradually towards retirement.27The dummy and the intensity specification give very similar results. Taking into account the
special wage policy of Norsk Data discussed above, and looking instead at part B, it may seem as if 10
percent is rather large. If the correct wage discount for entering workers is between 6 and 7 percent,
and the wage growth is between 0.4 and 0.5 percent, as suggested in Part B, this imply a pay-back
period of about 15 years. IT R&D-intensity is a noisy variable, and as a proxy for human capital, it
probably becomes increasingly noisy the further into the career a worker has reached. This implies
that measurement errors will bias the coefficient on the interaction term towards zero.
13

desirable, since it may be difficult to capture the full program effect before the labor
market has adjusted to the many mass layoffs caused by the recession.
The sample consists of full time working male scientists and engineers, having at
least one year full time experience from high-tech or IT industries, including services,
in 1986-1997. Workers who only have experience from IT services are included for
two reasons. First, it has some interest to compare workers entering the expanding IT
service industries with background from manufacturing high-tech industries to workers
who have acquired most of their work experience within the IT-service industries28.
Second, these workers help identify the many control variables in the wage regression,
such as experience and dummies for industries, altogether 72 coefficients29. Given the
relatively small number of workers with experience from non-subsidized IT firms, it is
important to identify common coefficients as precisely as possible30.
At first sight, the results in Table 4A, column 1 and 2, seem to imply that workers in
IT R&D firms have had significantly higher wage growth than other workers. Looking,
however, at column 3 and 4, and Part B, we see a pattern very similar to the one found
in Table 3 and discussed in detail above. This suggests that the significant growth
results are driven by a possible mismeasurement of compensation for workers in Norsk
Data in the beginning of the period. When excluding these workers, there is only a
small and non-significant wage growth effect left, i.e. workers with experience from
IT R&D-firms have a slightly higher wage growth than workers with experience from
other firms, and workers with experience from subsidized IT R&D-firms have a slightly
higher wage growth than workers with experience from non-subsidized IT R&D-firms,
without any of these differences being significantly different from zero.
Table 5 reports the results of an analysis of the effect of experience from R&D,
IT R&D and subsidized IT R&D-firms in the program years on the wage level in the
years 1996 and 1997. Consistent with Tables 3 and 4, the results show that there
28As it turns out, there does not seem to be any important differences between these groups,
and I have not tabulated separate coefficients for workers that only have experience from IT service
industries. On average, these workers seem to receive slightly lower wages than workers with experience
from high-tech manufacturing.29The industry dummies do not follow a particular NACE or ISIC level. Within high-tech and
IT-industries I use a detailed categorization, usually at the five digit level. In less advanced sectors,
with fewer observations in the sample, the dummies are usually at the two or three digit level. Cf.
the subtext to Table 4 for a full list of control variables an other details regarding the regression.30The assumption that there is a common experience profile, common industry effects and so on, is
of course not obvious, but it seems to be a reasonable approximation. Furthermore, my conclusions
are robust to reducing the sample size by excluding workers without experience from firms that have
invested in IT R&D.
14

are no significant differences related to the various types of experience. In particular,
workers with experience from subsidized firms, started out with a small but significant
(using the intensity specification) average wage discount, and had slightly higher, but
not significantly higher, wage growth, and they have ended up with a slightly lower,
although not significantly lower, wage level as reported in Table 531. Changing the
specification in Table 5 by including firm specific fixed effects, and thereby asking
whether workers with experience from subsidized firms have ended up in the best paid
positions within their firms, give very similar results to the specification without firm
specific fixed effects and is not reported.
Before concluding the wage analysis, one should reflect on how the results in Table
4 and 5 relates to Table 3, column 3, 4, 7 and 8, which indicated that workers in IT
R&D-firms, whether subsidized or not, accepted a wage discount at the start of their
career and experienced higher wage growth later on. If the estimated wage growth
associated with a career in IT R&D firms had continued after the program period, it
obviously should have caused a significant positive coefficient on experience from IT
R&D firms both in Table 4 and 532. When there is no such positive effect, it implies
that these workers did not receive the return they expected. One possible interpretation
is that their expectations did not come through because of the technology shifts in the
IT-industry in the late 1980s.
Is the glass half empty or half full? Tables 3 through 5, can be summarized in
one sentence: Scientists and engineers with experience from subsidized IT R&D-firms
performed about as good, or rather as bad, as workers from non-subsidized firms. Work-
ers in all IT R&D firms seem to have ‘co-financed’ their employers’ R&D investments
by accepting wages below their alternative wage, presumably believing that work ex-
perience from these firms would provide general human capital. The expected wage
31If including the years 1994 and 1995 in addition to 1996 and 1997, the coefficient on experience
from subsidized firms in column 4 becomes marginally significant. With respect to workers with
experience from Norsk Data, a detailed investigation of Table 5, contrasting Part A with Part B in
light of the previous discussion of subsidies and IT R&D investments in this company, suggests that
these workers have wages below the average for other workers with experience from subsidized firms.
If running a similar regression for skilled workers with secondary technical education, however, I find
a significant positive wage premium for workers with experience from Norsk Data. This may suggest
that scientists and engineers accumulate more firm specific human capital, and is more exposed to
technological risk than workers with secondary technical education.32In Table 5 this is so because the average worker with experience from IT R&D-firms, even if
continuing to invest in on-the-job training by staying in such a firm, should have caught up with and
passed workers without such experience by 1996/97.
15

growth, however, did not materialize after the program period, and they received no
monetary payback from their investment. With respect to workers in subsidized firms,
they do not seem to have gained anything from participating in the subsidized projects.
Consequently, my analysis does not support the idea that the IT R&D programs created
significant benefits for workers with experience from subsidized firms. On the positive
side, however, workers in subsidized firms did not perform particularly bad, either,
even though many of them became displaced in the late 1980s as shown in Figure 133.
Hence, the fact that many of the subsidized firms did not suceed commercially does
not seem to have reduced the market value of work experience from these firms. This
could be intepreted as a positive program effect, but we would expect the effect to
be stronger if these workers were truly ‘fertilizing’ the IT-industry with their human
capital.
5 The performance of spin-off firms
A complementary approach to looking at the performance of individual workers, is to
focus on the performance of spin-off firms defined by groups of workers that have stayed
together. When several workers from the same firm continue to work together, it is
reasonable to assume that they are exploiting know-how built up in their previous work
environment, and that there are positive complementarities between them that make
them stay together. It is also possible that firm profits is a better performance measure
than wages, particularly if the spin-off firms to some extent are worker-owned. Low
tax rate on capital income relative to labor income may induce employee-owners to
substitute wages for return on stocks34, and employee-owners may also sacrifice wages
in order to finance firm growth35.
33Note that I control for displacement in the wage regressions in Table 4 and 5, but the variable is
not significantly different from zero. Distinguishing, however, between workers with experience from
subsidized firms who have stayed with the same firm, and separators, I find a modest negative effect
for separators (not reported). In the stock specification this negative effect is significant.34Note, however, that the Norwegian tax system have detailed rules in order to avoid this type of
tax evation.35One may also think that employee stock options plans would reduce the relevance of taxable labor
income as an earnings measure, and show up in firm profits. This kind of options, however, has been
very unusual in Norway due to an unfavorable tax regime, cf. footnote 24.
16

5.1 Sample and definition of spin-offs
Table 6 present the results of my analysis of spin-off firms. Roughly speaking, i.e.
leaving out some of the finer details to be laid out below, I define a spin-off firm as a
firm that was not originally subsidized, but where at least 25 percent of the employees
have experience from a firm that was subsidized.
The sample period is 1994-1997, i.e. the years when the IT industry recovered
according to Figure 2. The sample consists of all non-financial joint-stock companies
with more than one employee and at least one scientist or engineer, in industries with
at least one ‘program firm’, a firm that to a large extent draw on human capital with
experience from subsidized IT R&D firms. Formally, I define program firms as firms
that have, at some point, had at least a 25 percent share of employees with experience
from subsidized firms, and at least one scientist or engineer with experience from a
subsidized firm. A definition of this type will necessarily be a bit arbitrary, but the
idea is to identify firms that draw significantly on knowledge that was built up under
the program.
The definition of program firms does not distinguish between continuing subsidized
firms that has retained experienced workers, and new firms, spin-offs, employing work-
ers with experience from subsidized firms. This is because I want to start out by
tracing all firms drawing on ‘program know-how’. Utilizing information about plants,
however, I can identify those of the program firms that represent a continuation of
originally subsidized firms36. I label these ‘continuing or reorganized subsidized firms’.
This group of firms is defined as program firms that contain one or more plant that
in 1986-1990 belonged to a subsidized firm. Program firms that do not fall into this
category are defined as spin-off firms. According to the above definitions, there are
altogether 109 program firms in the sample, 76 of these are spin-off firms and 33 are
continuing or reorganized subsidized firms.
5.2 Results
Program firms are somewhat larger, more capital intensive, more R&D intensive, and
more intensive in use of scientists and engineers, than non-program firms. They are also
36Firm identification numbers represent legal units, and will change if one firm or plant is bought by
another firm, etc. Plant identification numbers, on the other hand, will change only if the production
is physically moved or substantially altered with respect to industry classification. Not all registers
that are matched to produce my data set, however, use the same plant and firm identification number
system. For this reason the match between plants and firms, and the tracking of units over time, is
slightly imperfect.
17
somewhat younger and less often in a rural location. Spin-off firms are significantly
younger and smaller than continuing or reorganized subsidized firms, as one would
expect. Spin-offs are also less R&D-intensive, but more human capital intensive. This
reflect that a larger fraction of the spin-off firms belong to service industries. 37 percent
of the spin-off firms can be identified as spin-offs from Norsk Data.
The first performance measure I consider is sales growth. The results are reported
in Table 6, panel A. Program firms perform slightly better than other firms along this
dimension, but the difference is not significant. Moving on to profitability, Table 6,
panel B-D presents return on sales, return on assets and return on equity, respectively.
It shows that program firms are significantly less profitable than other firms. On
average they have 1.2 percent lower return on sales, 3.2 percent lower return on assets
and 15.5 percent lower return on equity.
Looking separately at spin-offs and continuing or reorganized subsidized firms, we
see that the significant negative results are exclusively associated with the spin-off
firms. It is difficult to explain these coefficients, but one possibility is that spin-off
firms mostly consist of troubled remnants of previously subsidized units, and that they
are kept running because their core know-how has low alternative value37. Analyzing
wages in spin-off firms (not reported), I find some support for this hypothesis. Scientists
and engineers with experience from subsidized firms that work in spin-off firms, have
a small wage discount. Workers with experience from subsidized firms that work in
continuing or reorganized subsidized firms, on the other hand, have a significant wage
premium. This may suggest that the most valuable know-how built up under the
program is to be found in the surviving plants and not in the spin-off firms. In any
case, my analysis does not give support to the idea that important returns from the
IT-program ended up outside the originally subsidized firms through labour mobility.
5.3 Robustness
In all the firm performance analyses presented above, I have controlled for firm age,
firm size, intensity in use of scientists and engineers, current R&D-investments, business
cycle effects, and industry differences. The main results are robust to leaving out these
control variables, but without controls, also continuing or reorganized subsidized firms
have a profitability below average.
Since the exact definition of program and spin-off firms is based on a somewhat
arbitrary cutoff value for the share of employees that has experience from firms that
37E.g. sales or service departments, or production teams, that either are reclassified with respect
to industry or move to a new location, and try to continue on their own.
18

received subsidies, it is particularly important to test the robustness of the results with
respect to these definitions. I have tried both a more inclusive definition, looking at
firms with a 10 percent share of employees with experience from subsidized firms, and
a more exclusive definition looking at firms with a 50 percent share of employees with
experience from subsidized firms. In both cases, the main results in Tables 6 hold true.
Defining spin-offs based on the share of engineers with experience from subsidized firms,
rather than the share of employees with experience from subsidized firms reduces the
significance of the negative coefficients. Finally, I have looked specifically at spin-offs
from Norsk Data. If anything, these firms have a weaker performance than other spin-
off firms. With respect to a possible time trend in performance, cf. the strong industry
growth present in Figure 2, I find that the profitability of the spin-off firms is falling
over time.
Given that the returns to innovation is known to have a very skewed distribution,
one may also question whether the regression analyses reported above correctly repre-
sent aggregate profits for the different categories of firms. A few large and profitable
spin-off firms could possibly more than outweigh the low profits in the many small firms
dominating the sample. One simple way to explore this issue is to pool all spin-off firms,
all continuing or reorganized subsidized firms, and all non-subsidized and non-spin-off
firms, in order to compute the joint performance of the various groups. The result of
this exercise is graphed in Figure 3. When assessing the joint performance this way,
spin-off firms as a group have a higher return on sales than non-spin-off firms, but they
perform worse with respect to sales growth, return on assets and return on equity.
A final question one may ask with respect to robustness, is whether the results are
specifically related to the subsidized IT R&D firms, or whether any spin-off from firms
that invested in IT R&D in the late 1980s have performed similarly bad. I have looked
at this question by defining spin-offs from all R&D firms and all IT R&D firms in the
same manner as I have defined spin-offs from subsidized IT R&D firms. This analysis
(not reported) show that the negative results are most strongly associated with spin-
offs from subsidized firms. There are, however, very few spin-offs from non-subsidized
IT R&D firms in the sample. In a related analysis (also not reported) I have regressed
firm profitability on a continuous measure of different types of R&D experience among
the firms’ scientists and engineers. In this analysis, R&D-, IT R&D- and subsidized
IT R&D experience is measured in the same way as in the wage regressions presented
in Tables 4 and 5. The results do not confirm the negative effect of subsidies found in
the spin-off analysis, but nor do firms whose scientists and engineers have particularly
much experience from subsidized firms perform significantly better.
19

5.4 Remarks on profitability as performance measure
An objection to the spin-off analysis might be that current sales and profitability are
not relevant performance measures in the IT industry, and that the spin-off firms
may become successes in the long run. Admittedly, numerous companies in the “New
Economy” were unprofitable, and still highly valued in the stock market due to large
investments in intangible capital. These arguments are not entirely convincing, how-
ever, as the extrordinary high stock market value of such firms did not last. Also,
private owners buying a company where previous owners have lost their money, may
make the company look successful and produce positive profits, without there being a
positive social return to the historical R&D investments that produced the technology.
Comparing total investments to expected future profits is difficult and requires case
studies.
A particularly interesting case in the Norwegian IT-industry is Dolphin Intercon-
nect Solutions. This company has been considered the most successful spin-off from
Norsk Data, cf. section 2, but did not make positive profit in any of the sample years.
The founding engineers started to develop the ‘Dolphin SCI technology’ in 1988 while
still working for Norsk Data, and 1999 was the first year in history that the company
generated positive profits38. Rough calculations suggest that total investments in Dol-
phin amounts to about NOK 500 million39. In 2000 a major part of Dolphin was sold
to Sun Microsystems and the price, NOK 171 million, was considered very favorable.
Per employee, the price was NOK 8 million, something which is more than 10 times the
cost of an engineering man-year. However, if the ‘major’ part of the company sold to
Sun represents more than one third of the total value of the company, the rate of return
to Dolphin as an investments project has been negative. A market based evaluation,
therefore, is not likely to make Dolphin come out as a large success.
6 Conclusion
This paper illustrates how matched employer-employee data can be used to assess
whether human capital built up in subsidized firms is general, and whether subsidies
to firms that fail stimulate growth elswhere through labor mobility. The case con-
38Cf. http://www.dolphinics.com.39This number is calculated on the basis of articles written about Dolphin in the major newspapers
Aftenposten, Dagens Næringsliv and Bergens Tidene in the years 1991-2001. The number is adjusted
for inflation. Using an additional 7 percent discount factor, the total investment amounts to NOK
800 milll. About 20 percent of the investments seems to have been financed by public subsidies.
20

sidered is a series of Norwegian IT-programs from the mid and late 1980s. I find no
evidence suggesting that experience from subsidized firms has been rewarded with a
wage premium. Scientists and engineers with experience from subsidized firms receive
on average the same wage as otherwise similar workers without such experience. This
suggests that the human capital built up in subsidized firms was general enough that
the commercial failure of these firms did not hurt the average workers’ career in the
long run. It does not, however, support the idea that the human capital built up in the
subsidized firms was particularly valuable and have constituted an important stimulus
to growth. Analyzing the performance of spin-off firms reinforces this negative con-
clusion. Spin-offs from subsidized firms are less profitable than other firms, suggesting
that the identified spin-offs to a large extent consist of troubled remnants of previously
subsidized units. My analysis, therefore, does not give support to the idea that im-
portant returns from the IT-programs ended up outside the originally subsidized firms
through labor mobility.
One question my analysis cannot answer, is how the subsidies affected the overall
supply of IT-engineers in Norway. The IT-programs may have stimulated talented
workers to specialize in IT rather than in some other field, and this may have pushed
down wages for IT-personnel in the years after the program. Indirectly, this may have
aided later growth in the industry, even though this growth did not draw on technolo-
gies developed under the program. A more complete analysis of the programs would
have to assess whether the experience of the workers attracted to the IT industry by
the programs, would have been better or worse in some other industry, and whether
firm entry and growth in the IT industry in the 1990s was sensitive to the observed
industry wage level. Answering such counter factual questions requires out of sample
analyses that is beyond the scope of the present study.40 The main goal of the pro-
grams, however, targeting general technologies with a large potential for growth, did
not succeed.
40A complete analysis should also assess other spillover channels than labour mobility, although this
is the mechanism emphasized by proponents of the program.
21

References
Almeida, P. and Kogut, B. (1999). Localization of knowledge and the mobility of
engineers in regional networks, Management Science 45(7): 905—917.
Becker, G. S. (1962). Investment in human beings, Journal of Political Economy 70: 9—49.
Becker, G. S. (1964). Human Capital, Columbia University Press, New York. [Third
Edition by the University of Chicago Pess 1993].
Bjerkan, G. and Nergård, A. (1990). Norsk Data A/S : En studie av feilslått handelspoli-
tikk, Master’s thesis, Norwegian School of Economics and Business Administration,
Bergen.
Bresnahan, T. F. and Trajtenberg, M. (1995). General purpose technologies: “Engines
of growth”?, Journal of Econometrics 65(1): 83—108.
Harlem, L. et al. (1990). Evaluering av Nasjonal Handlingsplan for Informasjonste-
knologi 1987-90, Rapport fra evalueringsutvalget oppnevnt ved kongelig resolusjon
12. januar 1990, Oslo.
Heckman, J. J., Lalonde, R. J. and Smith, J. A. (1999). The economics and economet-
rics of active labor market programs, in O. C. Ashenfelter and D. Card (eds), Hand-
book of Labor Economics, Vol. 3A, Vol. 3A, North-Holland, chapter 31, pp. 1865—
2096.
Holbrook, D., Cohen, W. M., Hounshell, D. A. and Klepper, S. (2000). The nature,
sources, and consequences of firm differences in the early history of the semiconductor
industry, Strategic Management Journal 21: 1017—1041.
Jackson, T. (1997). Inside Intel: Andrew Grove and the Rise of the World’s Most
Powerful Chip Company, Dutton Books.
Klette, T. J. and Møen, J. (1999). From growth theory to technology policy - Co-
ordination problems in theory and practice, Nordic Journal of Political Economy
25(1): 53—74.
Mincer, J. (1974). Schooling, Experience and Earnings, Columbia University Press,
New York.
22

Møen, J. (2002). Spin-offs and spillovers: Tracing knowledge by following employees
across firms. Discussion Paper 5/02, Department of Finance andMangement Science,
Norwegian School of Economics and Business Administration.
Møen, J. (2005). Is mobility of technical personnel a source of R&D spillovers? Forth-
coming in Journal of Labor Economics.
OECD (2000). Measuring the ICT Sector, Paris.
Rosen, S. (1986). The theory of equalizing differences, in O. Ashenfelter and R. Layard
(eds), Handbook of Labor Economics, Vol. I, North-Holland, Amsterdam, chapter 12,
pp. 641—692.
Saxenian, A. (1994). Regional Advantage: Culture Competition Between Route 128 and
Silicon Valley, Harvard University Press, Cambridge, Mass.
Statistics Denmark (2000). The ICT Sector in the Nordic Countries.
Steine, T. O. (1992). Fenomenet Norsk Data, Universitetsforlaget, Oslo.
Stern, S. (1999). Do scientists pay to be scientists? NBER Working Paper No. 7410.
Valmot, O. R. (1999). Det norske datafyrtårnet, Teknisk Ukeblad 146(32): 46—47.September 2nd.
23

24
Figure 1: Employment growth 1985-1997 in subsidized IT R&D-firms vs. other categories of firms in the high-tech industry
empl
oym
ent r
elat
ive
to 1
985
year
Subsidized IT R&D firms Other R&D firms Non-subs. IT R&D firms Non-R&D firms
85 86 87 88 89 90 91 92 93 94 95 96 97
.4
.6
.8
1
1.2
In 1985 there were about 11 100 workers in subsidized IT R&D firms, 1 800 workers in non-subsidized IT R&D firms, 5 800 workers in other R&D firms and 58 600 workers in non-R&D firms. Firms with unknown R&D-intensity are excluded. Firms that change industry classification are kept in the sample. Annual data points are connected using a cubic spline. Figure 2: Employment growth in IT vs. all private industries in 1995-1999
em
ploy
men
t rel
ativ
e to
199
5
year
IT services Total private sector IT manufacturing
1995 1996 1997 1998 1999
.9
1
1.1
1.2
1.3
1.4
Source: Statistics Denmark (2000) updated with numbers from Statistics Norway (www.ssb.no). Annual data points are connected using a cubic spline.

25
Figure 3: Joint growth and profitability of spin-off firms vs. non-spin-off firms in 1994 to 1997
sa
les
rela
tive
to 1
994
year
Spin-off firms Non-program firms Cont. or restr. sub. firms
1994 1995 1996 1997
.8
.9
1
1.1
1.2
1.3
1.4
re
turn
on
sale
s
year
Spin-off firms Non-program firms Cont. or restr. sub. firms
1994 1995 1996 1997
0
2
4
6
8
10
12
14
16
re
turn
on
asse
ts
year
Spin-off firms Non-program firms Cont. or restr. sub. firms
1994 1995 1996 1997
0
2
4
6
8
10
12
re
turn
on
equi
ty
year
Spin-off firms Non-program firms Cont. or restr. sub. firms
1994 1995 1996 1997
0
5
10
15
20
25
30
35
40
45

26
Table 1: Industry of occupation in 1997 for scientists and engineers with experience from high-tech industries in 1986-1990
Workers from subsidized IT R&D firms
Workers from non-
subsidized IT R&D firms
Workers from other R&D firms
Workers from non-R&D
firms
High-tech manufacturing industries 40% 53% 49% 44% Other manufacturing industries 2% 4% 3% 7% IT services industries 30% 14% 10% 6% Other services industries 12% 14% 15% 23% Public sector 5% 5% 6% 4% Other industries or unknown 2% 1% 8% 8% Not in the sample 9% 9% 9% 7%
Number of scientists and engineers 1095 195 465 1664 Workers are classified in the leftmost column applicable. Workers who are not observed in 1997 are classified according to their industry of occupation in 1996, if possible. Otherwise they are classified as not in the sample. Workers that only have experience from firms with unknown R&D-intensity are excluded. Table 2: Non-wage labour market outcomes for scientists and engineers with experience from high-tech industries in 1986-1990 Workers
from subsidized IT R&D
firms
Workers from non-subsidized IT R&D
firms
Workers from other R&D firms
Workers from
non-R&D firms
Average employment rate 1988-1997‡ 88% 87% 89% 89% Participated in active labour market programs 1988-1997 13% 11% 11% 11% Displaced workers that were re-employed in a different municipality‡‡
11%
11%
14%
14%
Re-educated or further educated by 1997 2.1% 2.1% 1.7% 1.7% Self-employed in at least one year after 1990 .01% .01% .02% .01%
Number of scientists and engineers 1095 195 465 1664 Workers are classified in the leftmost column applicable. Workers that only have experience from firms with unknown R&D-intensity are excluded. ‡ Those not employed include everyone who is not employed and not under education, regardless of whether they are registered as unemployed or not. Part time workers are counted as part time unemployed. ‡‡ A displaced worker is defined as a worker with at least two year tenure who left a plant that downsized at least 25 percent in that year or over that year and next year.

27
Table 3: The effect of R&D, IT and IT-subsidies on the wage level and wage profile for scientists and engineers in high-tech industries in 1986-1990 (1) (2) (3) (4) (5) (6) (7) (8) A: All observations Dummy Intensity Dummy Intensity Dummy Intensity Dummy Intensity
R&D .007 .048 .015 .081 .005 .025 .013 .016 (.009) (.043) (.016) (.074) (.009) (.045) (.015) (.075) R&D * experience -.001 -.004 -.001 .0001 (.001) (.005) (.001) (.005) IT R&D -.043*** -.245** -.109*** -.600*** .010 -.270*** -.088*** -.696*** (.008) (.061) (.015) (.104) (.015) (.065) (.023) (.108) IT R&D * experience .006*** .031*** .007*** .037*** (.001) (.008) (.002) (.009) Subsidized IT R&D -.040*** .229* -.027 .837*** (.014) (.121) (.022) (.205) Subsidized IT R&D * exp. -.001 -.051*** (.002) (.017)
R-squared .50 .50 .51 .51 .51 .51 .51 .51 Number of observations 11 386 11 386 11 386 11 386 11 386 11 386 11 386 11 386 B: Without workers with experience from Norsk Data
R&D -.008 .022 -.004 .057 -.009 .051 -.005 .049 (.009) (.044) (.015) (.075) (.009) (.046) (.015) (.075) R&D * experience -.0004 -.004 -.0004 -.001 (.001) (.005) (.001) (.005) IT R&D -.015* -.108* -.064*** -.426*** .0002 -.013 -.070*** -.426*** (.008) (.063) (.015) (.109) (.015) (.067) (.023) (.113) IT R&D * experience .004*** .028*** .006*** .035*** (.001) (.008) (.002) (.009) Subsidized IT R&D -.019 -.488*** .009 .138 (.015) (.125) (.022) (.211) Subsidized IT R&D * exp. -.003 -.050*** (.002) (.017)
R-squared .50 .50 .51 .51 .50 .50 .51 .51 Number of observations 10 513 10 513 10 513 10 513 10 513 10 513 10 513 10 513 The dependent variable is ln (real annual earnings). Control variables included in the regression, but not reported are a quartic in experience, a quadratic in tenure, a dummy for job relationships whose starting date is censored at April 30th 1978 together with its interactions with the two tenure variables, dummies for 15 different academic degrees, a quadratic in plant number of employees, dummies for 3 different regions, year dummies, year dummies interacted with experience, 6 industry dummies, 3 dummies denoting whether the R&D, IT or subsidy variable is missing and these dummies interacted with experience. The coefficients are estimated using ordinary least squares. Huber-White robust standard errors allowing for clustering of errors by individuals are in parentheses. *** Significant at the 1% level ** Significant at the 5% level * Significant at the 10% level
28
Table 4: The effect of R&D, IT and IT-subsidies on wage growth 1986-1997 for scientists and engineers in high-tech and IT industries (1) (2) (3) (4) A: All observations Dummy Stock Dummy Stock
R&D-experience -.017 -.005 -.018 .003 (.018) (.031) (.018) (.030) IT R&D-experience .042** .069* .003 .093** (.018) (.038) (.028) (.042) Subsidized IT R&D experience .047* -.155* (.025) (.072)
R-squared .23 .23 .23 .23 Number of observations 7 130 7 130 7 130 7 130
B: Without workers with experience from Norsk Data
R&D-experience -.010 .015 -.011 .010 (.018) (.031) (.018) (.030) IT R&D-experience .016 -.003 .011 -.008 (.018) (.039) (.028) (.034) Subsidized IT R&D experience .007 .045 (.025) (.077)
R-squared .23 .23 .23 .23 Number of observations 6 762 6 762 6 762 6 762
The dependent variable is the first difference of ln (real annual earnings) between year t and year t-10 in the period 1986 to 1997. Control variables included in the regression, but not reported are a quartic in experience, a quadratic in tenure, a dummy for job relationships whose starting date is censored at April 30th 1978 together with its interactions with the two tenure variables, year dummies and dummies for 15 different academic degrees, a dummy for having experience from IT service, but not from high-tech manufacturing in 1986-1990, a dummy for not having experience from high-tech manufacturing, nor from IT service in 1986-1990, a dummy for being displaced in one of the years 1986 to 1993, 28 dummies for industry of occupation at time t, 28 dummies for industry of occupation at time t-10, two dummies denoting whether R&D or IT R&D is missing for those with experience from manufacturing firms and a similar dummy for subsidized IT R&D in column 4. The coefficients are estimated using ordinary least squares. Huber-White robust standard errors allowing for clustering of errors by individuals are in parentheses. *** Significant at the 1% level ** Significant at the 5% level * Significant at the 10% level

29
Table 5: The effect of R&D, IT and IT-subsidies in 1986-1990 on the wage level for scientists and engineers in 1996 and 1997 in high-tech and IT industries (1) (2) (3) (4) A: All observations Dummy Stock Dummy Stock
R&D-experience .012 .035 .012 .037 (.017) (.027) (.017) (.036) IT R&D-experience -.007 -.021 .004 -.014 (.017) (.035) (.026) (.038) Subsidized IT R&D experience -.012 -.041 (.024) (.082)
R-squared .21 .21 .21 .21 Number of observations 10 109 10 109 10 109 10 109
B: Without workers with experience from Norsk Data
R&D-experience .011 .031 .011 .033 (.017) (.027) (.017) (.027) IT R&D-experience -.003 -.009 .005 .004 (.017) (.036) (.026) (.043) Subsidized IT R&D experience -.009 -.059 (.025) (.093)
R-squared .22 .22 .22 .22 Number of observations 9 632 9 632 9 632 9 632
The dependent variable is ln (real annual earnings). Control variables included in the regressions, but not reported are a quartic in experience, a quadratic in tenure, a dummy for job relationships whose starting date is censored at April 30th 1978 together with its interactions with the two tenure variables, year dummies and dummies for 15 different academic degrees, a quadratic in plant number of employees, a dummy for being displaced in one of the years 1986 to 1993, dummies for 3 different regions, a dummy for having experience from IT service, but not from high-tech manufacturing in 1986-1990, a dummy for not having experience from high-tech manufacturing, nor from IT service in 1986-1990, 28 industry dummies, two dummies denoting whether R&D or IT R&D is missing for those with experience from manufacturing firms and a similar dummy for subsidized IT R&D in column 4. The coefficients are estimated using ordinary least squares. Huber-White robust standard errors allowing for clustering of errors by individuals are in parentheses. *** Significant at the 1% level ** Significant at the 5% level * Significant at the 10% level

30
Table 6: Performance in 1994-1997 in firms that employ knowledge developed in the subsidized IT R&D firms A: Sales growth (1) (2)
Dummy for program firm .064 (.044) Dummy for continuing or reorganized subsidized firm .075 (.086) Dummy for spin-off firm .060 (.045)
R-squared .93 .93 Number of observations 3 641 3 641
B: Return on sales
Dummy for program firm -1.22 (1.00) Dummy for continuing or reorganized subsidized firm 1.57 (1.48) Dummy for spin-off firm -2.56** (1.24)
R-squared .08 .08 Number of observations 3 719 3 719
C: Return on assets
Dummy for program firm -3.15* (1.67) Dummy for continuing or reorganized subsidized firm 1.25 (2.51) Dummy for spin-off firm -5.26*** (2.00)
R-squared .07 .08 Number of observations 3 719 3 719
D: Return on equity
Dummy for program firm -15.51** (7.57) Dummy for continuing or reorganized subsidized firm 2.57 (11.79) Dummy for spin-off firm -24.19*** (8.68)
R-squared .06 .06 Number of observations 3 719 3 719
In panel A the dependent variable is ln(Sales), ln(Sales t-1) is included as a regressor. Control variables included in all regressions, but not reported are a quartic in firm age, a quartic in firm no. of employees, a quartic in the share of employees that are scientists and engineers, a dummy for positive R&D-investments, a dummy for R&D-intensity above 0.05, a dummy for R&D-intensity above 0.2, a dummy for no information about R&D investments, year dummies and 38 NACE industry dummies. Firm age is deliberately censored at 30 and firm no. of employees is censored at 1000. The coefficients are estimated using ordinary least squares. Huber-White robust standard errors allowing for clustering of errors by firms are in parentheses. In panel B-D, the influence of outliers is reduced by replacing values for return on sales, assets and equity below the 5th percentile with the 5th percentile, and values above the 95th percentile with the 95th percentile. *** Significant at the 1% level ** Significant at the 5% level * Significant at the 10% level

31
Recent publications in the series Discussion Papers
308 T. Kornstad (2001): Are Predicted Lifetime Consumption Profiles Robust with respect to Model Specifications?
309 H. Hungnes (2001): Estimating and Restricting Growth Rates and Cointegration Means. With Applications to Consumption and Money Demand
310 M. Rege and K. Telle (2001): An Experimental Investigation of Social Norms
311 L.C. Zhang (2001): A method of weighting adjustment for survey data subject to nonignorable nonresponse
312 K. R. Wangen and E. Biørn (2001): Prevalence and substitution effects in tobacco consumption. A discrete choice analysis of panel data
313 G.H. Bjertnær (2001): Optimal Combinations of Income Tax and Subsidies for Education
314 K. E. Rosendahl (2002): Cost-effective environmental policy: Implications of induced technological change
315 T. Kornstad and T.O. Thoresen (2002): A Discrete Choice Model for Labor Supply and Child Care
316 A. Bruvoll and K. Nyborg (2002): On the value of households' recycling efforts
317 E. Biørn and T. Skjerpen (2002): Aggregation and Aggregation Biases in Production Functions: A Panel Data Analysis of Translog Models
318 Ø. Døhl (2002): Energy Flexibility and Technological Progress with Multioutput Production. Application on Norwegian Pulp and Paper Industries
319 R. Aaberge (2002): Characterization and Measurement of Duration Dependence in Hazard Rate Models
320 T. J. Klette and A. Raknerud (2002): How and why do Firms differ?
321 J. Aasness and E. Røed Larsen (2002): Distributional and Environmental Effects of Taxes on Transportation
322 E. Røed Larsen (2002): The Political Economy of Global Warming: From Data to Decisions
323 E. Røed Larsen (2002): Searching for Basic Consumption Patterns: Is the Engel Elasticity of Housing Unity?
324 E. Røed Larsen (2002): Estimating Latent Total Consumption in a Household.
325 E. Røed Larsen (2002): Consumption Inequality in Norway in the 80s and 90s.
326 H.C. Bjørnland and H. Hungnes (2002): Fundamental determinants of the long run real exchange rate:The case of Norway.
327 M. Søberg (2002): A laboratory stress-test of bid, double and offer auctions.
328 M. Søberg (2002): Voting rules and endogenous trading institutions: An experimental study.
329 M. Søberg (2002): The Duhem-Quine thesis and experimental economics: A reinterpretation.
330 A. Raknerud (2002): Identification, Estimation and Testing in Panel Data Models with Attrition: The Role of the Missing at Random Assumption
331 M.W. Arneberg, J.K. Dagsvik and Z. Jia (2002): Labor Market Modeling Recognizing Latent Job Attributes and Opportunity Constraints. An Empirical Analysis of Labor Market Behavior of Eritrean Women
332 M. Greaker (2002): Eco-labels, Production Related Externalities and Trade
333 J. T. Lind (2002): Small continuous surveys and the Kalman filter
334 B. Halvorsen and T. Willumsen (2002): Willingness to Pay for Dental Fear Treatment. Is Supplying Fear Treatment Social Beneficial?
335 T. O. Thoresen (2002): Reduced Tax Progressivity in Norway in the Nineties. The Effect from Tax Changes
336 M. Søberg (2002): Price formation in monopolistic markets with endogenous diffusion of trading information: An experimental approach
337 A. Bruvoll og B.M. Larsen (2002): Greenhouse gas emissions in Norway. Do carbon taxes work?
338 B. Halvorsen and R. Nesbakken (2002): A conflict of interests in electricity taxation? A micro econometric analysis of household behaviour
339 R. Aaberge and A. Langørgen (2003): Measuring the Benefits from Public Services: The Effects of Local Government Spending on the Distribution of Income in Norway
340 H. C. Bjørnland and H. Hungnes (2003): The importance of interest rates for forecasting the exchange rate
341 A. Bruvoll, T.Fæhn and Birger Strøm (2003): Quantifying Central Hypotheses on Environmental Kuznets Curves for a Rich Economy: A Computable General Equilibrium Study
342 E. Biørn, T. Skjerpen and K.R. Wangen (2003): Parametric Aggregation of Random Coefficient Cobb-Douglas Production Functions: Evidence from Manufacturing Industries
343 B. Bye, B. Strøm and T. Åvitsland (2003): Welfare effects of VAT reforms: A general equilibrium analysis
344 J.K. Dagsvik and S. Strøm (2003): Analyzing Labor Supply Behavior with Latent Job Opportunity Sets and Institutional Choice Constraints
345 A. Raknerud, T. Skjerpen and A. Rygh Swensen (2003): A linear demand system within a Seemingly Unrelated Time Series Equation framework
346 B.M. Larsen and R.Nesbakken (2003): How to quantify household electricity end-use consumption
347 B. Halvorsen, B. M. Larsen and R. Nesbakken (2003): Possibility for hedging from price increases in residential energy demand
348 S. Johansen and A. R. Swensen (2003): More on Testing Exact Rational Expectations in Cointegrated Vector Autoregressive Models: Restricted Drift Terms
349 B. Holtsmark (2003): The Kyoto Protocol without USA and Australia - with the Russian Federation as a strategic permit seller
350 J. Larsson (2003): Testing the Multiproduct Hypothesis on Norwegian Aluminium Industry Plants
351 T. Bye (2003): On the Price and Volume Effects from Green Certificates in the Energy Market
352 E. Holmøy (2003): Aggregate Industry Behaviour in a Monopolistic Competition Model with Heterogeneous Firms
353 A. O. Ervik, E.Holmøy and T. Hægeland (2003): A Theory-Based Measure of the Output of the Education Sector
354 E. Halvorsen (2003): A Cohort Analysis of Household Saving in Norway
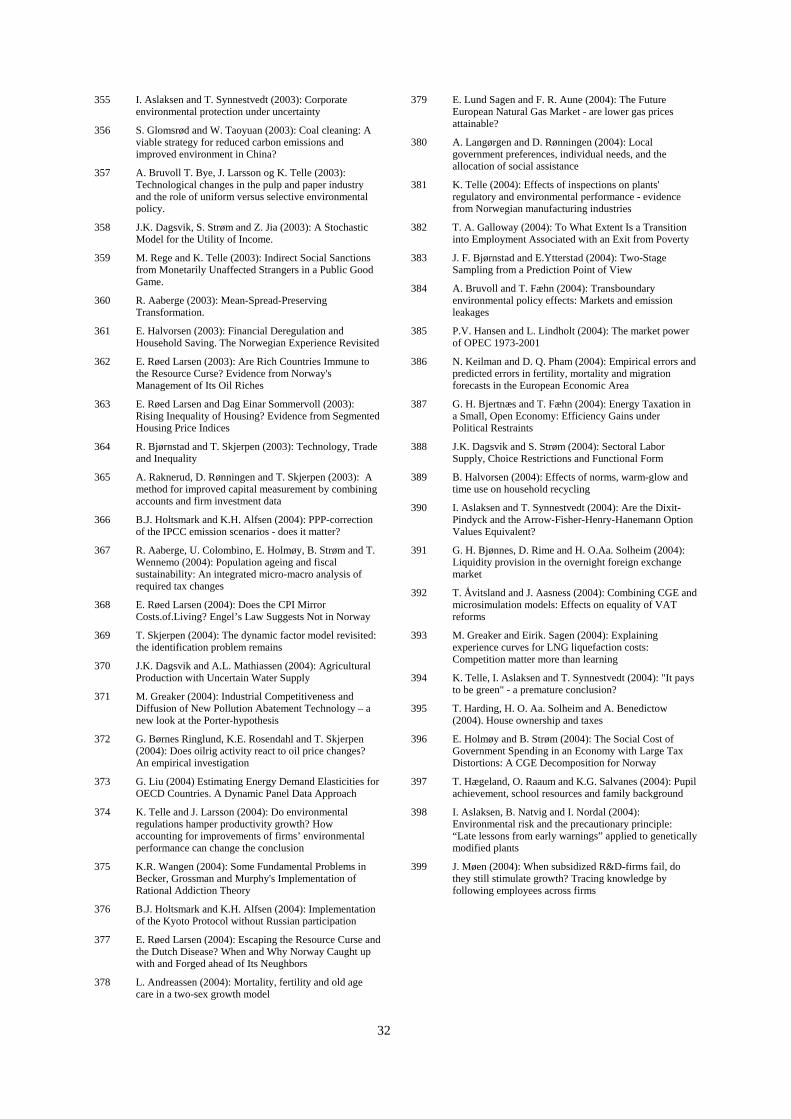
32
355 I. Aslaksen and T. Synnestvedt (2003): Corporate environmental protection under uncertainty
356 S. Glomsrød and W. Taoyuan (2003): Coal cleaning: A viable strategy for reduced carbon emissions and improved environment in China?
357 A. Bruvoll T. Bye, J. Larsson og K. Telle (2003): Technological changes in the pulp and paper industry and the role of uniform versus selective environmental policy.
358 J.K. Dagsvik, S. Strøm and Z. Jia (2003): A Stochastic Model for the Utility of Income.
359 M. Rege and K. Telle (2003): Indirect Social Sanctions from Monetarily Unaffected Strangers in a Public Good Game.
360 R. Aaberge (2003): Mean-Spread-Preserving Transformation.
361 E. Halvorsen (2003): Financial Deregulation and Household Saving. The Norwegian Experience Revisited
362 E. Røed Larsen (2003): Are Rich Countries Immune to the Resource Curse? Evidence from Norway's Management of Its Oil Riches
363 E. Røed Larsen and Dag Einar Sommervoll (2003): Rising Inequality of Housing? Evidence from Segmented Housing Price Indices
364 R. Bjørnstad and T. Skjerpen (2003): Technology, Trade and Inequality
365 A. Raknerud, D. Rønningen and T. Skjerpen (2003): A method for improved capital measurement by combining accounts and firm investment data
366 B.J. Holtsmark and K.H. Alfsen (2004): PPP-correction of the IPCC emission scenarios - does it matter?
367 R. Aaberge, U. Colombino, E. Holmøy, B. Strøm and T. Wennemo (2004): Population ageing and fiscal sustainability: An integrated micro-macro analysis of required tax changes
368 E. Røed Larsen (2004): Does the CPI Mirror Costs.of.Living? Engel’s Law Suggests Not in Norway
369 T. Skjerpen (2004): The dynamic factor model revisited: the identification problem remains
370 J.K. Dagsvik and A.L. Mathiassen (2004): Agricultural Production with Uncertain Water Supply
371 M. Greaker (2004): Industrial Competitiveness and Diffusion of New Pollution Abatement Technology – a new look at the Porter-hypothesis
372 G. Børnes Ringlund, K.E. Rosendahl and T. Skjerpen (2004): Does oilrig activity react to oil price changes? An empirical investigation
373 G. Liu (2004) Estimating Energy Demand Elasticities for OECD Countries. A Dynamic Panel Data Approach
374 K. Telle and J. Larsson (2004): Do environmental regulations hamper productivity growth? How accounting for improvements of firms’ environmental performance can change the conclusion
375 K.R. Wangen (2004): Some Fundamental Problems in Becker, Grossman and Murphy's Implementation of Rational Addiction Theory
376 B.J. Holtsmark and K.H. Alfsen (2004): Implementation of the Kyoto Protocol without Russian participation
377 E. Røed Larsen (2004): Escaping the Resource Curse and the Dutch Disease? When and Why Norway Caught up with and Forged ahead of Its Neughbors
378 L. Andreassen (2004): Mortality, fertility and old age care in a two-sex growth model
379 E. Lund Sagen and F. R. Aune (2004): The Future European Natural Gas Market - are lower gas prices attainable?
380 A. Langørgen and D. Rønningen (2004): Local government preferences, individual needs, and the allocation of social assistance
381 K. Telle (2004): Effects of inspections on plants' regulatory and environmental performance - evidence from Norwegian manufacturing industries
382 T. A. Galloway (2004): To What Extent Is a Transition into Employment Associated with an Exit from Poverty
383 J. F. Bjørnstad and E.Ytterstad (2004): Two-Stage Sampling from a Prediction Point of View
384 A. Bruvoll and T. Fæhn (2004): Transboundary environmental policy effects: Markets and emission leakages
385 P.V. Hansen and L. Lindholt (2004): The market power of OPEC 1973-2001
386 N. Keilman and D. Q. Pham (2004): Empirical errors and predicted errors in fertility, mortality and migration forecasts in the European Economic Area
387 G. H. Bjertnæs and T. Fæhn (2004): Energy Taxation in a Small, Open Economy: Efficiency Gains under Political Restraints
388 J.K. Dagsvik and S. Strøm (2004): Sectoral Labor Supply, Choice Restrictions and Functional Form
389 B. Halvorsen (2004): Effects of norms, warm-glow and time use on household recycling
390 I. Aslaksen and T. Synnestvedt (2004): Are the Dixit-Pindyck and the Arrow-Fisher-Henry-Hanemann Option Values Equivalent?
391 G. H. Bjønnes, D. Rime and H. O.Aa. Solheim (2004): Liquidity provision in the overnight foreign exchange market
392 T. Åvitsland and J. Aasness (2004): Combining CGE and microsimulation models: Effects on equality of VAT reforms
393 M. Greaker and Eirik. Sagen (2004): Explaining experience curves for LNG liquefaction costs: Competition matter more than learning
394 K. Telle, I. Aslaksen and T. Synnestvedt (2004): "It pays to be green" - a premature conclusion?
395 T. Harding, H. O. Aa. Solheim and A. Benedictow (2004). House ownership and taxes
396 E. Holmøy and B. Strøm (2004): The Social Cost of Government Spending in an Economy with Large Tax Distortions: A CGE Decomposition for Norway
397 T. Hægeland, O. Raaum and K.G. Salvanes (2004): Pupil achievement, school resources and family background
398 I. Aslaksen, B. Natvig and I. Nordal (2004): Environmental risk and the precautionary principle: “Late lessons from early warnings” applied to genetically modified plants
399 J. Møen (2004): When subsidized R&D-firms fail, do they still stimulate growth? Tracing knowledge by following employees across firms