when no pollen does not mean no trees
TRANSCRIPT

Veget Hist Archaeobot (2006) 15: 253–261DOI 10.1007/s00334-006-0063-9
ORIGINAL ARTICLE
Sheila Hicks
When no pollen does not mean no trees
Received: 10 April 2006 / Accepted: 5 May 2006 / Published online: 27 July 2006C© Springer-Verlag 2006
Abstract The question of what signal, if any, appears inthe pollen record when trees are present in the vegetationwithout producing pollen or with no pollen being recorded,is addressed. Four scenarios are envisaged: (i) the numberof trees in the landscape are very few and scattered, (ii)the trees are too young to produce pollen, (iii) climateconditions are unfavourable for the trees to producepollen and (iv) the trees are cut or damaged so that theydo not flower. Each of these is considered in terms ofpollen accumulation rates (PARs) and present theoriesand models of pollen dispersal. Examples are providedfor the forest limit areas of the northern boreal trees inFinnish Lapland using data of pollen deposition monitoredby pollen traps and results from the high temporalresolution (near annual) analyses of peat profiles. Therelevance of the results to questions such as finds of sprucemacrofossils in the Swedish mountains, the 8200 cal b.p.cold event, the migration of species/vegetation succession,and widespread damage to trees are all considered. It isconcluded that although these situations are sometimes‘invisible’ or misrepresented when pollen assemblagesare expressed in the traditional percentage manner, theyare often revealed by PARs. The fact that the pollenassemblage reflects a much wider regional area than isoften understood can strengthen signals which have aregional impact, such as those which are climate induced,but may obscure events which affect only a limited spatialarea or occur as small patches in the landscape.
Keywords Pollen accumulation rates . Boreal forest .8200 b.p. event . Pollen dispersal model . Regional . Highresolution
Communicated by Pim van der Knaap
S. Hicks (�)Institute of Geosciences,P.O. BOX 3000,90014 University of Oulu,Finlande-mail: [email protected]
Introduction
In palaeoecological studies involving pollen analysis it haslong been understood that there is no 1:1 relationship be-tween the pollen incorporated in a sediment and the veg-etation which produced it. This is because of differencesin pollen production, pollen dispersal and pollen deposi-tion between species. Particularly the fact that pollen canbe blown considerable distances by the wind has tradition-ally been taken into account in interpreting fossil pollenassemblages, such that from a relative early stage it wasappreciated that high percentages of tree pollen in depositswhich, by independent means, can be dated to a time whenno trees can have existed at the site (e.g. areas peripheralto an ice sheet) must represent pollen in-blown from ar-eas where trees were growing (Aario 1943). Thus the ideaof tree pollen being present in a sediment sample withoutthere having been any trees in the vegetation surroundingthe sampling site at that time, is neither new nor difficult tounderstand. The opposite situation, where trees are presentin the vegetation but their pollen is absent from the sedimentrecord, is something which is less frequently considered,although it was recognized in the early stages of palaeo-ecology (Rudolph 1928, 1930; Welten 1944; Firbas 1949).One such situation which has long been appreciated occurswhen the pollen type in question is very fragile and rarelypreserved thus causing a ‘blank in the landscape’.
Plants which produce pollen that is extremely fragile andsubject to degradation and corrosion will always be un-derrepresented or completely missing from fossil pollenassemblages. This article, however, concentrates on pollentypes that are normally very well preserved and considersa number of ‘trees but no pollen’ situations; both wheretrees are present but there is no pollen recorded and wheretrees are present but are not producing pollen. It has beensuggested that the only way to address the question ofwhether trees were actually present at a site or not is bylooking at plant macrofossils and, in the case of conifers,searching for stomata from the pollen slides (Birks andBirks 2000), and this is, indeed, one approach. Recent

254
investigations involving calculating pollen accumulationrates (PARs, grains cm−2 year−1) offer an additional ap-proach, as do models of pollen dispersal. The modelsconsidered here are those of Sugita (1993, 1994). In thisconnection he describes a Relevant Source Area of Pollen(RSAP) as the point beyond which the goodness of fit be-tween the pollen loading at a site and the vegetation aroundthat site does not improve. In effect this means that withinthe RSAP different mosaics in the vegetation will be dis-tinguishable in the pollen assemblage but vegetation frombeyond the RSAP will be represented by background pollenand this background pollen will give an homogenized sig-nal for the whole region. The two points where the modelsmake us rethink our interpretations are in predicting thatthe background pollen can form more than 50% of the to-tal pollen loading, and that the source of this backgroundpollen can be tens of kilometres. It is the PAR evidencecoupled with the knowledge gained from the models whichis presented here.
The following scenarios will be considered:
• The number of specimens of the tree taxon being con-sidered is very few and they occur in the landscape onlyas isolated and widely spaced individuals.
• Trees are present within the vicinity of the site beinginvestigated but are too young to flower.
• Trees are present around the sampling site but it is toocold and/or dry for them to flower.
• Trees are present but they are constantly being cut ordamaged in some way that prevents them from flowering.
In all these situations it is the pollen productivity of thespecies in question which plays the most decisive role indetermining its presence in the pollen record. In the sce-narios outlined above the actual quantity of pollen which isavailable for deposition is either very small or non-existent.With the classical practice of expressing taxon presence asa percentage of a defined assemblage the decrease or disap-pearance of one or more pollen types can lead to extremelymisleading increases in the percentage values for those taxathat are represented.
Materials and methods
The data used to investigate these ‘no pollen’ scenarioscomprise the results of monitoring annual pollen deposi-tion, and high temporal resolution pollen analyses from peatprofiles. The evidence comes from eastern Finnish Lapland(Fig. 1), an area where the regional northern boreal veg-etation exhibits a clear latitudinal zonation. The samplingsites used form a transect crossing the forest limits of bothspruce and pine. The pollen traps monitor pollen deposi-tion (sites Ku46, S22, P9 and Ke8, the latter being at Kevo)following the standard protocol of the Pollen MonitoringProgramme (PMP; Hicks et al. 1996; Hicks et al. 1999b).The results presented here are for the 22-year period 1982–2003 and have, in part, been previously published as partof a larger data set (Hicks 2001). The peat profiles (Kevoand Suovalampi) consist of fast growing Sphagnum fuscum
Fig. 1 Vegetation map of north-east Finnish Lapland based on theCorine map (CLC2000 data is based on SYKE, MML, MMM (fieldsas of 1999), VRK (built-up areas as of 2001) and satellite interpre-tations, making use of the Finnish Forest Commission and UPMKymmene Oy data), with the location of sites mentioned in the text.Ku46, S22 and P9 are pollen trap sites, Kevo and Suovalampi arepeat profile sites. The pollen trap Ke8 is located at Kevo. NB. Suo-valampi is a mire close to the lake of the same name investigated byHyvarinen (1975, 1976)
peat for which an age-depth chronology has been obtainedby wiggle matching 14C analyses from the peat with theatmospheric 14C curve (Goslar et al. 2005) and then cuttingthe peat into either consecutive 2 mm thick slices (Kevo)or consecutive near annual slices ranging between 2 and3 mm in thickness (Suovalampi). Further details of theage-depth chronology for the Kevo profile together withthe complete pollen diagrams have been published previ-ously (Hicks et al. 2004) and are, therefore, not repeatedhere. The PARs calculated from the peat profiles are il-lustrated in two ways, as a grains cm−2 year−1 value foreach sample (Fig. 3) and as a grains cm−2 year−1 valuefor each calendar year (Fig. 2). In the case of the Kevoprofile where samples were taken as regular 2 mm thickslices (surface area 4 × 4 cm), because of the changing rateof peat accumulation, samples in the uppermost part ofthe profile represent less than 1 calendar year while those
255
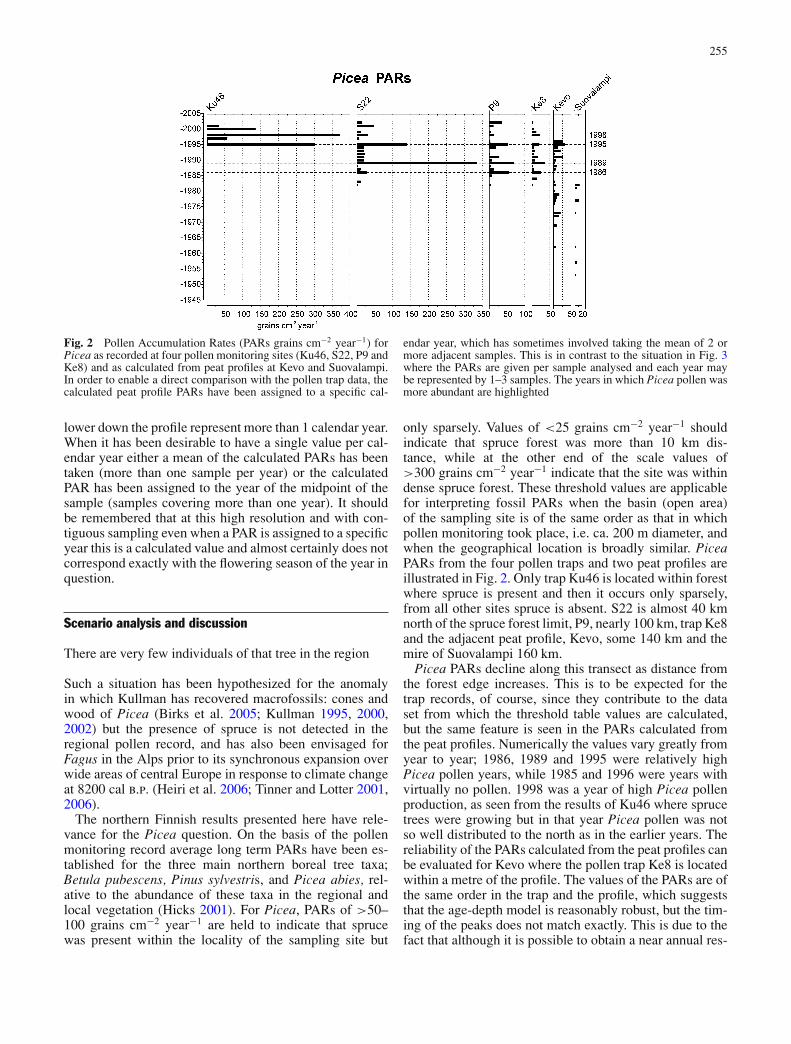
Fig. 2 Pollen Accumulation Rates (PARs grains cm−2 year−1) forPicea as recorded at four pollen monitoring sites (Ku46, S22, P9 andKe8) and as calculated from peat profiles at Kevo and Suovalampi.In order to enable a direct comparison with the pollen trap data, thecalculated peat profile PARs have been assigned to a specific cal-
endar year, which has sometimes involved taking the mean of 2 ormore adjacent samples. This is in contrast to the situation in Fig. 3where the PARs are given per sample analysed and each year maybe represented by 1–3 samples. The years in which Picea pollen wasmore abundant are highlighted
lower down the profile represent more than 1 calendar year.When it has been desirable to have a single value per cal-endar year either a mean of the calculated PARs has beentaken (more than one sample per year) or the calculatedPAR has been assigned to the year of the midpoint of thesample (samples covering more than one year). It shouldbe remembered that at this high resolution and with con-tiguous sampling even when a PAR is assigned to a specificyear this is a calculated value and almost certainly does notcorrespond exactly with the flowering season of the year inquestion.
Scenario analysis and discussion
There are very few individuals of that tree in the region
Such a situation has been hypothesized for the anomalyin which Kullman has recovered macrofossils: cones andwood of Picea (Birks et al. 2005; Kullman 1995, 2000,2002) but the presence of spruce is not detected in theregional pollen record, and has also been envisaged forFagus in the Alps prior to its synchronous expansion overwide areas of central Europe in response to climate changeat 8200 cal b.p. (Heiri et al. 2006; Tinner and Lotter 2001,2006).
The northern Finnish results presented here have rele-vance for the Picea question. On the basis of the pollenmonitoring record average long term PARs have been es-tablished for the three main northern boreal tree taxa;Betula pubescens, Pinus sylvestris, and Picea abies, rel-ative to the abundance of these taxa in the regional andlocal vegetation (Hicks 2001). For Picea, PARs of >50–100 grains cm−2 year−1 are held to indicate that sprucewas present within the locality of the sampling site but
only sparsely. Values of <25 grains cm−2 year−1 shouldindicate that spruce forest was more than 10 km dis-tance, while at the other end of the scale values of>300 grains cm−2 year−1 indicate that the site was withindense spruce forest. These threshold values are applicablefor interpreting fossil PARs when the basin (open area)of the sampling site is of the same order as that in whichpollen monitoring took place, i.e. ca. 200 m diameter, andwhen the geographical location is broadly similar. PiceaPARs from the four pollen traps and two peat profiles areillustrated in Fig. 2. Only trap Ku46 is located within forestwhere spruce is present and then it occurs only sparsely,from all other sites spruce is absent. S22 is almost 40 kmnorth of the spruce forest limit, P9, nearly 100 km, trap Ke8and the adjacent peat profile, Kevo, some 140 km and themire of Suovalampi 160 km.
Picea PARs decline along this transect as distance fromthe forest edge increases. This is to be expected for thetrap records, of course, since they contribute to the dataset from which the threshold table values are calculated,but the same feature is seen in the PARs calculated fromthe peat profiles. Numerically the values vary greatly fromyear to year; 1986, 1989 and 1995 were relatively highPicea pollen years, while 1985 and 1996 were years withvirtually no pollen. 1998 was a year of high Picea pollenproduction, as seen from the results of Ku46 where sprucetrees were growing but in that year Picea pollen was notso well distributed to the north as in the earlier years. Thereliability of the PARs calculated from the peat profiles canbe evaluated for Kevo where the pollen trap Ke8 is locatedwithin a metre of the profile. The values of the PARs are ofthe same order in the trap and the profile, which suggeststhat the age-depth model is reasonably robust, but the tim-ing of the peaks does not match exactly. This is due to thefact that although it is possible to obtain a near annual res-

256
Fig. 3 Pollen Accumulation Rates (PARs grains cm−2 year−1) forBetula, Pinus and Picea as calculated from the Kevo peat profile, an-notated with on-site observations by the author. Note that the PARsare calculated for each sample analysed and, therefore, differ fromthose illustrated in Fig. 2 where one value has been assigned to eachcalendar year. For the peat section which accumulated between 1974
to 1996 sampling is contiguous at 2 mm intervals. Accepting theslight smoothing resulting from the fact that each calculated yeardoes not coincide with a single flowering season, the higher peaksfollow years where mean July temperature reached or exceeded 14 ◦C(1979, 1985, 1988 and 1994, see Fig. 4) and all the tree taxa reactedby producing more pollen
olution from the peat the calculated years do not coincidewith individual flowering seasons. In some years there isno Picea pollen at all, which is in keeping with phenolog-ical observations that in northern Finland this tree flowersinfrequently. The dramatic annual variation in the amountof pollen produced leads to the ‘noise’ in the PARs whensampling at this very high temporal resolution. Figure 2illustrates how the PARs contain two signals; an annualone where climate affects pollen productivity (the quantityof pollen available for deposition) and a long-term aver-age one which reflects the density of the species within thepollen source area. When looking at Picea pollen quantitiesin sediment samples which may cover many years (e.g. ac-cumulation of sediment in the lake Suovalampi is such thata 1-cm sample can represent as much as 60 years; Hicksand Hyvarinen 1999), the rare occurrence of high pollenyears will result in the actual quantity of Picea pollen persample being very low compared with that of the othertrees. The long term average Picea values in Fig. 2 repre-sent just under 1% of total dryland pollen at Kevo and 0.1%at Suovalampi.
What does this mean in terms of the Kullman macro-fossil spruce finds? The Finnish results show the situationwhere, although spruce is completely absent from the veg-etation, small amounts of Picea pollen occur because anextensive region of forest in which spruce is present oreven dominant exists some 100–150 km to the south. Thisis the classic ‘small quantities of pollen represent long dis-tance dispersal’ explanation. The representation of Piceain the pollen record is discussed in detail by Giesecke andBennett (2004). They take 1% terrestrial pollen as a thresh-
old for the presence of spruce when considering forestedareas but point out that this value should not be appliedin beyond tree line situations. From the analogy with theFinnish PAR results one would have to conclude that at thetime of the spruce macrofossil finds there was certainly noexpanse of spruce forest within 150 km, so the alternativeis a few scattered clumps of trees.
The hypothesis that pollen from a few scattered treesmay not be visible in the pollen record is also supported bytheories of pollen dispersal based on models developed bySugita (1993, 1994, 1998) and Sugita et al. (1999). He wasable to suggest that it is not possible from the pollen recordto detect fire disturbance within the regional forest (i.e. atdistance from the sampling site) because such a large pro-portion of the pollen loading (the background pollen sensuSugita) gives a generalized signal of the regional vegetationas a whole (Sugita et al. 1997). Only when the event to bedetected occurs within the RSAP is there any chance ofseeing it in the pollen signal. The situation becomes moreexaggerated when PARs are considered. Prentice’s model(Prentice 1985) predicts that with increasing basin size theactual quantity of pollen being deposited will decrease.This means that for open areas, such as the tree-line situa-tion on the mountains, not only will the amount of pollenbeing deposited be very small but more than half of it re-presents an homogenized signal for many tens of kilome-tres around the site. The small amount of pollen producedby isolated groups of a few trees will simply not be vis-ible. As Seppa and Bennett (2003) conclude ‘pollen datamay not be sensitive enough to detect small isolated pop-ulations’. This is especially so in the case of Picea where

257
the amount of pollen produced is small and flowering isinfrequent. Work by von Stedingk and Segerstrom fromthis controversial area clearly illustrates the relevance ofthe highly local signal (Segerstrom and Stedingk 2003). Itwould be interesting to see what the PAR values are in thiscase.
The trees are too young to flower
This will always be the situation with a species that is ex-tending its distribution area. There is inevitably a time lagbetween the establishment of seedlings and the maturationof the trees to the stage that they are able to produce pollen.The degree to which this needs to be taken into account willdepend on the age at which the tree species starts floweringrelative to the time resolution of the fossil record, whichin turn depends upon the rate of sediment accumulation,the sampling interval and whether samples are taken con-tiguously or not. This scenario will be relevant when theresearch aim is to establish the time of arrival of a speciesin an area (Giesecke et al. 2004; Giesecke 2005a; Willisand van Andel 2004).
From the Picea example presented above it is clear thatwhen dealing with percentages a threshold for the estab-lishment of forest is imprecise and a credible value for thearrival of the first trees is almost impossible to establish.The same conclusion was reached by Tinner and Lotter(2006). With a migrating forest front the increase in PARresulting from the greater abundance of the tree whose dis-tribution is expanding and the increasing closeness of thattree to the site being investigated can clearly indicate theexpansion (Giesecke 2005b) but the time when saplings areestablished in the immediate vicinity can only be deducedon the basis of the knowledge of growth factors of the treein question. This has significant implications. If it is notpossible to establish the first arrival of trees on the basisof pollen percentages (or even macrofossils; Birks 2001)then it is impossible to infer migrations although it maybe possible to trace population expansions from isolatedindividuals (Bennett 1983, 1988).
The Kevo peat profile, covering a time when yearly on-site observations of the surrounding vegetation have beenmade, affords a possibility for looking at this scenario withrespect to pine. Kevo is situated within an area where pineoccurs within the valley of the Kevo river but this occur-rence is clearly north of the pine forest limit (the palecoloured area south of Kevo in Fig.1, Hicks et al. 2004).These pines have been noticeably increasing in numberover the past decades (Siren 1998). In addition there is ev-idence from charcoal in the soil and from local knowledgeof a fire having occurred on the Kevo peninsula in the earlydecades of the 20th century. This destroyed the majority ofthe pine trees so that when the Kevo Subarctic ResearchStation was founded in 1958 the pines surrounding the sta-tion were few in number and mostly young in age. In theimmediate surroundings of the small mire from which thepeat profile was taken there are a few old pines but the vastmajority are young ones, scattered through the mountain
birch woodland. The large pines were sufficiently unusualas to be immediately noticeable when the first pollen trapwas set up in the area in 1974. These same pines were coredin 1998 and, at that time, were seen to be 180–230 yearsold. By 2005 several of them had died. Although pinesare capable of flowering at 10–12 years of age, only big-ger trees, aged 25–30 years, will be capable of producingnoticeable quantities of pollen (Jalkanen, pers. comm.). InFig. 3 the Pinus PARs for the period 1960–1996 as calcu-lated from the peat profile reflect the known history. Thepeaks in the diagram reflect years of high pollen productionbut the long term averages can be interpreted in terms oftree abundance.
In the 1960s and 1970s Pinus PARs are >2000–300 cm−2 year−1. Using the threshold values derived fromthe pollen traps (Hicks 2001) this would suggest pines werenot present within 1 km. We know that pines were present,but very few of them were mature enough to flower, or ifcapable of flowering were so small that they did not pro-duce much pollen. The threshold for sparse presence of500 cm−2 year−1 is crossed in the late 1970’s. The val-ues for the 1990s rise dramatically to cross the thresholdvalue of 2000 cm−2 year−1 for dense forest. This is thetime by which the young trees of the 1970’s have reachedmaturity and can produce larger amounts of pollen. TheKevo mire is small in size (0.77 ha) so the local situa-tion will be clearly seen in the pollen loading (Jacobsonand Bradshaw 1981) but, nevertheless, as Sugita’s mod-els suggest, the pollen component representing the wholeregion beyond the RSAP will also be present. This situ-ation of a few old scattered pines and more recent vigor-ous growth is also characteristic of the wider area. Hus-tich (1948) shows a map of pine seedlings in the Kevoarea in 1939/1940 and also records that where more ma-ture pines exist they grow completely isolated as if theyare the remnants of a larger forest area. Pines in the Ke-nesjarvi valley just to the south of Kevo belong to thissame younger cohort that were the seedlings in Hustich’smap, and an experimental plot of pines was planted bythe forestry commission to the north of the Kevo area in1948. All these trees would not have begun flowering beforethe 1960s and would only later be big enough to producelarger amounts of pollen. The relatively recent increase inflowering because of pines reaching maturity is, therefore,also a regional phenomenon, hence the strong signal in thePARs.
The example presented here covers a period of 30years but, since the temporal resolution is very high,changes in both tree density and annual pollen produc-tion are recorded. In the fossil situation, the combina-tion of sample size and rate of sediment accumulationwill determine the degree to which this situation can beseen.
It is too cold and/or too dry for the trees to flower
This is more relevant when the trees are growing at theirecological limit e.g. in tree-line studies. Just as the age

258
at which trees begin to flower differs between species sothe temperature threshold which must be crossed beforeflowering is possible also differs between species. Situa-tions where a series of cold years inhibits flowering butdoes not kill the tree will usually be of more limited tem-poral duration than situations where the trees are actuallykilled and have to re-establish themselves in the area andgrow once more to maturity. It is relevant to consider thisin connection with the 8200 cal b.p. cold event (Barberet al. 1999; Johnsen et al. 2001; Wiersma and Renssen2006).
The annual variation in amounts of pollen revealed bypollen monitoring (Hicks 1994, 2001) is so great that, atthis temporal resolution, the variation can in no way berelated to changes in the density of trees in the surround-ings of the monitoring sites. Moreover high and low pollenyears tend to coincide irrespective of the density of the treein question. Such annual variation in the pollen availablefor deposition must be controlled by weather conditions.There is a calibration between Pinus PARs and mean Julytemperature of the year before pollen emission (Fig. 4),with some indication that the calibration is even better fora 2-week period in July (Autio and Hicks 2004; McCarrollet al. 2003). The results presented in Fig. 4 suggest thatat the limit of its range, as illustrated by the Kevo site,no Pinus pollen is produced at mean July temperatures of10.5–11 ◦C degrees. At P9, located further south and closeto the pine forest limit, this cut off value is slightly higher11–11.5 ◦C. Even if pines stop producing pollen at thistemperature, they are, nevertheless, growing in both heightand width and also producing needles (Pensa et al. 2005;Salminen and Jalkanen 2005). Based on these results onecan hypothesize that if there were a series of summers withJuly temperatures below 11 ◦C then this would be seenin a pollen diagram as a time of very low Pinus PARs,the only pollen present being that blown in from warmerareas.
The 8200 cal b.p. event was an abrupt event, occurringat a time when, in Scandinavia, temperatures were alreadyhigh enough and sufficient time had elapsed since the dis-appearance of the Weichselian ice for pine to be presenton the mountains (Barnekow 1999, 2000; Barnett et al.2001; Berglund et al. 1996; Bergman et al. 2005; Bjuneet al. 2004; Seppa and Weckstrom 1999; Seppa and Birks2002; Seppa et al. 2005). Evidence from a laminated lake inEstonia (Veski et al. 2004) suggests that the 8200 cal b.p.cold period lasted 320 years (but with a focused cold timelasting 150 years) and that the drop in temperature was 1–2 ◦C. For situations where pine was growing at its ecolog-ical limit (comparable with the pollen monitoring recordsfrom Finland) a cessation of flowering could very wellresult from a short-lived abrupt event, without the trees ac-tually being killed. In several of the pollen diagrams fromthe Scandinavian mountains referred to above the Pinuscurve could be interpreted as reacting in this way. The con-cept of changes in pollen production (or no production atall) in response to temperature thresholds may also havebeen significant at the Late-glacial Holocene transition as
Fig. 4 Correlation between annual PAR for Pinus and July temper-ature of the year before pollen emission at the pollen monitoring sitesof Kevo (within an area with pines but beyond the pine forest limit)and P9 (just at the pine forest limit)
hypothesized for an altitudinal transect in the Swiss Alps(Ammann et al. 2000).
The trees are cut or damaged in some way thatprevents them from flowering
The obvious situation that comes to mind of trees beingcut before they can flower is related to woodland manage-ment through coppicing or pollarding. None of the ther-mophilous trees frequently cut in this way grow within thearea being considered here so results relevant to this hu-man interference situation are not available. A comparableevent, however, is represented and that is the defoliationof the mountain birches by the larvae of the moth Epirritaautumnata. There was a devastating attack by this moth onthe mountain birch trees of the Kevo peninsula in 1965–66. During this attack 135,000 ha of birch forest in theadministrative district of Utsjoki in northern Finland weredefoliated (Kallio and Lehtonen 1973; Tenow 1972). Oncedefoliated, the birches cannot begin to flower again untilthey have recovered sufficiently to produce leaves. Onlythe very lowest parts of the valleys, where extremely coldwinter temperatures killed off the Epirrita eggs, were savedfrom the attack. For ten years or more (the birches were stillwithout leaves when a pollen trap was set up in Kevo in1974; Kukkonen 2002) the vast majority of birches overan extensive area were not flowering. The effect of thison Betula PARs can be seen in Fig. 3 where values re-

259
Fig. 5 Percentage presence of the major tree taxa shrubs, dwarfshrubs and herbs in the Kevo profile for the same period (1962–1996) as in Fig. 3. A large proportion of the dwarf shrub pollencomes from species growing on the mire surface (see Bennett andHicks 2005). Note the difference in scale for Picea
main <300 grains cm−2 year−1 (suggesting birch was notpresent at all) through to the late 1970’s and do not consis-tently exceed 1000 grains cm−2 year−1 (the threshold foropen forest) until the late 1980’s after which they rapidlyreach values which, from the threshold table, indicate densewoodland.
The Kevo profile, therefore shows as situation where forabout 20 years the landscape was extremely open – themajority of the mountain birches were leafless and unableto flower, mature pines were few in number and isolated andyoung pines were not mature enough to produce pollen. Inthis situation a classic percentage diagram for this 30 yearperiod is misleading. The same analyses are illustrated aspercentages of total dry-land pollen in Fig. 5. From this,one would conclude that birch and pine have both beenconsistently present on the Kevo peninsula, if anythingwith pine more abundant than birch. The opposite is thecase, with the regionally dominant tree being birch andwith pines being confined to the valley. Because both treeswere producing so little pollen the percentage values ofPicea, whose pollen was being blown in from 140 kmaway, fluctuate between 1 and 2% of total dry-land pollen(the higher values being for the time when the local treeswere not producing pollen)—a value which many wouldregard as indicating that spruce was present!
Conclusions
This paper started with the suggestion that even if there isno pollen at all in the pollen record trees may still havebeen present. On the basis of what has been presented fornorthern Finnish Lapland it would seem that this situationis very rarely achieved, the only scenario where this is
true, being the situation where trees are extremely few andwidely scattered in the landscape. In all other situationswhere trees are present but are not flowering some pollen(however small the quantity) is usually present in the pollenassemblage. This is due to the fact that such a large pro-portion of the pollen loading is coming from an extremelywide area around the sampling site, so that although thelocal trees are not producing pollen there are always sometrees of the same species within the catchment area thatare producing pollen. Davis’s analogy with a witch’s hat(Davis 2000) is helpful in visualizing the Sugita modelledsituation. Specimens of a tree close to the sampling site,particularly when the basin size is small, contribute a largequantity of pollen to the pollen loading while specimens ofthe same tree spread through the region and at increasingdistances individually contribute much less. Although thiscontribution decreases with distance (hence the use of dis-tance weighted plant abundance in the models), however,the area involved is so huge that the total contribution fromthe region is still larger than from the nearby trees. The PARdata presented here support this and help in understandingthe models by demonstrating the sort of quantities of pollenthat are involved.
Of course, the results and explanations presented aboveonly begin to touch on this topic. More experimentationand testing with empirical data is needed. The aim, how-ever, has been to suggest a fruitful line of approach. Modelsare useful for evaluating the spatial dimension of the pollenloading but are still restricted to expressing the loading inpercentage terms. PARs can give an idea of the quantity ofpollen which comprises the pollen loading, thus revealingthe density of the trees. The two, in combination, can read-ily explain the situation where there is pollen present butno trees and can also help in understanding the oppositesituation, that of trees being present but not contributingpollen to the sediment. A controlling factor when apply-ing the ideas presented here to the interpretation of fossilpollen assemblages is the temporal resolution of the fossilsample. Profiles where the sediment accumulation rate isslow, so that individual samples may represent several tensof years, and where the sampling interval is large, so thatthe ‘pollen view’ pictures are given at intervals of maybe100 years, will not reveal the sort of detail illustrated here,even if PARs are calculated.
Acknowledgements It gives me great pleasure to dedicate this con-tribution to Brigitta Ammann, who has constantly supported and en-couraged pollen monitoring and was the prime mover in establishingthe Pollen Monitoring Programme (PMP) as an INQUA workgroup.I have greatly enjoyed her lively and pertinent discussions and hercontinued interest over the years has been of utmost value.
The ideas presented here arise from discussions linking threeprojects: PMP (Pollen Monitoring Programme), PINE (PredictingImpacts on Natural Ecotones: EVK2-CT-2002-00136) and POL-LANDCAL (POLlen-LANDscape CALibrations: a NordForsk net-work) and forms a contribution to all of them. A. Lotter and W.Tinner kindly reviewed an earlier version of the text and providedvaluable comments. The map in Fig. 1 was produced by H. Suutari,help with the pollen counting was provided by R.-L. Huttunen, J.van Leeuwen, H. Hyotyla and H. Hyyppa and the analyses in Fig. 4were performed by R. Jalkanen who also provided critical informa-

260
tion on the growth of pines. To all of these people I offer my sincerethanks.
References
Aario L (1943) Uber die Wald- und Klimaentwicklung an derLapplandischen Eismeerkuste in Petsamo. Annales BotaniciSocietatis Zoologicæ Botanicæ Fennicæ Vaniamo 19:1–158
Ammann B, Birks HJB, Brooks SJ, Eicher U, von GrafensteinU, Hofmann W, Lemdahl G, Schwander J, Tobolski K, WickL (2000) Quantification of biotic responses to rapid climatechanges around the Younger Dryas—a synthesis. PalaeogeogrPalaeoclimatol Palaeoecol 159:313–347
Autio J, Hicks S (2004) Annual variations in pollen deposition andmeteorological conditions on the fell Aakenustunturi in northernFinland: Potential for using fossil pollen as a climate proxy.Grana 43:31–47
Barber DC, Dyke A, Hillaire-Marcel C, Jennings AE, Andrews JT,Kerwin MW, Bilodeau G, McNeely R, Southon J, MoreheadMD, Gagnon J-M (1999) Forcing of the cold event of 8,200years ago by catastrophic drainage of Laurentide lakes. Nature400:344–348
Barnekow L (1999) Holocene tree-line dynamics and inferred cli-matic changes in the Abisko area, northern Sweden, basedon macrofossil and pollen records. The Holocene 9:253–265
Barnekow L (2000) Holocene regional and local vegetation historyand lake-level changes in the Tornetrask area, northern Sweden.J Paleolimnol 23:399–420
Barnett C, Dumayne-Peaty L, Matthews JA (2001) Holocene cli-matic change and tree-line response in Leirdalen, central Jotun-heimen, south central Norway. Rev Palaeobot Palynol 117:119–137
Bennett KD (1983) Post-glacial population expansion of forest treesin Norfolk, U.K. Nature 303:164–167
Bennett KD (1988) Holocene geographic spread and population ex-pansion of Fagus grandifolia in Ontario, Canada. J Ecol 76:547–557
Bennett KD, Hicks S (2005) Numerical analysis of surface and fossilpollen spectra from northern Fennoscandia. J Biogeogr 32:407–423
Berglund BE, Barnekow L, Hammarlund D, Sandgren P, SnowballIF (1996) Holocene forest dynamics and climate changes inthe Abisko area, northern Sweden – the Sonesson model ofvegetation history reconsidered and confirmed. Ecological Bull45:15–30
Bergman J, Hammarlund D, Hannon G, Barnekow L, WohlfarthB (2005) Deglacial vegetation succession and Holocenetree-limit dynamics in the Scandes Mountains, west-centralSweden: stratigraphic data compared to megafossil evidence.Rev Palaeobot Palynol 134:129–151
Birks HH (2001) Plant macrofossils. In: Smol JP, Birks HJB, LastWM (eds) Tracking environmental change using lake sediments.Kluwer, Dordrecht, pp 49–74
Birks HH, Birks HJB (2000) Future uses of pollen analysis mustinclude plant macrofossils. J Biogeogr 27:31–35
Birks HH, Larsen E, Birks HJB (2005) Did tree-Betula, Pinus andPicea survive the last glaciation along the west coast of Norway?A review of the evidence, in the light of Kullman (2002). JBiogeogr 32:1461–1471
Bjune AE, Birks HJB, Seppa H (2004) Holocene vegetation andclimate history on a continental-oceanic transect in northernFennoscandia based on pollen and plant macrofossils. Boreas33:211–223
Davis MB (2000) Palynology after Y2K - understanding the sourcearea of pollen in sediments. Annu Rev Earth Planetary Sci 28:1–18
Firbas F (1949) Spat- und nacheiszeitliche Waldgeschichte Mitteleu-ropas nordlich der Alpen, vol 1. Fischer, Jena
Giesecke T, Bennett KD (2004) The Holocene spread of Picea abies(L.) Karst. in Fennoscandia and adjacent areas. J Biogeogr31:1523–1548
Giesecke T (2005a) Holocene forest development in the central Scan-des Mountains, Sweden. Veget Hist Archaeobot 14:133–147
Giesecke T (2005b) Moving front or population expansion: How didPicea abies (L.) Karst. become frequent in central Sweden? QuatSci Rev 24:2495–2509
Goslar T, van derKnaap WO, Hicks S, Andric M, Czernik J,Goslar E, Rasanen S, Hyotyla H (2005) Radiocarbon datingof modern peat profiles: pre- and post-bomb 14C variationsin the construction of age-depth models. Radiocarbon 47:115–134
Heiri C, Bugmann H, Tinner W, Heiri O, Lischke H (2006) A model-based reconstruction of Holocene treeline dynamics in the Cen-tral Swiss Alps. J Ecol 94:206–216
Hicks S (1994) Present and past pollen records of Lapland forests.Rev Palaeobot Palynol 82:17–35
Hicks S, Ammann B, Latałowa M, Pardoe HS, Tinsley H (1996)European Pollen Monitoring Programme Project description andguidelines. University of Oulu, Oulu
Hicks S, Hyvarinen H (1999) Pollen influx values measured in dif-ferent sedimentary environments and their palaeoecological im-plications. Grana 38:228–242
Hicks S, Tinsley H, Pardoe H, Cundill P (eds) (1999) Supplement tothe guidelines. European Pollen Monitoring Programme. Uni-versity of Oulu, Oulu
Hicks S (2001) The use of annual arboreal pollen deposition valuesfor delimiting tree-lines in the landscape and exploring modelsof pollen dispersal. Rev Palaeobot Palynol 117:1–29
Hicks S, Goslar T, van der Borg K (2004) A near annual record ofrecent tree-line dynamics from northern Finland. Acta Palaeobot44:299–316
Hustich I (1948) The Scots pine in northernmost Finland and itsdependence on the climate in the last decades. Acta BotanicaFennica 42:4–75
Hyvarinen H (1975) Absolute and relative pollen diagrams fromnorthernmost Fennoscandia. Fennia 142:1–23
Hyvarinen H (1976) Flandrian pollen deposition rates and tree-linehistory in northern Fennoscandia. Boreas 5:163–175
Jacobson GL, Bradshaw RHW (1981) The selection of sites for pa-leovegetational studies. Quat Res 16:80–96
Johnsen SJ, Dahl-Jensen D, Gunderstrup N, Steffensen JP, ClausenHB, Miller H, Masson-Delmotte V, Sveinbjornsdottir AE,White J (2001) Oxygen isotope and palaeotemperature recordsfrom six Greenland ice-core stations: Camp century, Dye-3,GRIP, GISP2, Renland and NorthGRIP. J Quat Sci 16:299–307
Kallio P, Lehtonen J (1973) Birch forest damage caused by Oporiniaautumnata (Bkh.) in 1965–66 in Utsjoki, N Finland. Rep KevoSubarctic Res Station 10:55–69
Kukkonen T (2002) Tunturikoivikoiden elpyminen tunturimittarin ai-heuttamista tuhoista Kevon luonnonpuistssa. Maantieteen laitos.Turun yliopisto, Turku
Kullman L (1995) New and firm evidence for mid-Holocene ap-pearance of Picea in the Scandes Mountains, Sweden. J Ecol83:439–447
Kullman L (2000) The Geoecological history of Picea abies in north-ern Sweden and adjacent parts of Norway. A contrarian hypoth-esis of postglacial tree immigration patterns. Geookodynamik21:141–172
Kullman L (2002) Boreal tree taxa in the central Scandes during theLate-Glacial: implications for Late-Quaternary forest history. JBiogeogr 29:1117–1124
McCarroll D, Jalkanen R, Hicks S, Tuovinen M, Gagen M, PawellekF, Eckstein D, Schmitt U, Autio J, Heikkinen O (2003) Multi-proxy dendroclimatology: a pilot study in northern Finland. TheHolocene 13:829–838
Pensa M, Salminen H, Jalkanen R (2005) A 250-year-long height-increment chronology for Pinus sylvestris at the northern conif-erous timberline. A novel tool for reconstructing past summertemperatures? Dendrochronologia 22:75–81

261
Prentice IC (1985) Pollen representation, source area, and basin size:toward a unified theory of pollen analysis. Quat Res 23:76–86
Rudolph K (1928) Die bisherigen Ergebnisse der botanischenMooruntersuchungen in Bohmen. Beihefte zum BotanischenCentralblatt 45:1–180
Rudolph K (1930) Grundzuge der nacheiszeitlichen WaldgeschichteMitteleuropas. Beihefte zum Botanischen Centralblatt 47:111–176
Salminen H, Jalkanen R (2005) Modelling the effect of temperatureon height increment of Scots pine at high latitudes. Silva Fennica39:497–508
Segerstrom U, von Stedingk H (2003) Early-Holocene spruce, Piceaabies (L.) Karst., in west central Sweden as revealed by pollenanalysis. The Holocene 13:897–906
Seppa H, Weckstrom J (1999) Holocene vegetational and limnolog-ical changes in the Fennoscandian tree-line area as documentedby pollen and diatom records from Lake Tsuolbmajavri, Finland.Ecoscience 6:621–635
Seppa H, Birks HJB (2002) Holocene climate reconstructions fromthe Fennoscandian tree-line area based on pollen data fromToskaljavri. Quat Res 57:191–199
Seppa H, Bennett KD (2003) Quaternaty pollen analysis; recentprogress in palaeoecology and palaeoclimatology. Prog PhysGeogr 27:548–579
Seppa H, Hammarlund D, Antonsson K (2005) Low-frequency andhigh-frequency changes in temperature and effective humidityduring the Holocene in south-central Sweden: implications foratmospheric and oceanic forcings of climate. Clim Dyn 25:285–297
Siren G (1998) Results and conclusions of pine advance in subarcticFinland in the 20th century. Finn Forest Res Inst Res Pap 677:7–21
Sugita S (1993) A model of pollen source area for an entire lakesurface. Quat Res 39:239–244
Sugita S (1994) Pollen representation of vegetation in Quaternarysediments: theory and method in patchy vegetation. J Ecol82:881–897
Sugita S, MacDonald GM, Larsen CPS (1997) Reconstruction offire disturbance and forest succession from fossil pollen in lakesediments: potential and limitations. In: Clark JS, Cachier H,Goldammer JG, Stocks B (eds) Sediment records of biomassburning and global change. Springer, Berlin, Heidelberg, NewYork, pp 387–411
Sugita S (1998) Modelling pollen representation of vegetation.In: Gaillard M-J, Berglund BE, Frenzel B, Huckriede U(eds) Quantification of land surfaces cleared of forests dur-ing the Holocene – Modern pollen/vegetation/landscape re-lationships as an aid to the interpretation of fossil pollendata. Palaoklimaforschung/Palaeoclimate Research 27. Fischer,Stuttgart, pp 1–16
Sugita S, Gaillard MJ, Brostrom A (1999) Landscape openness andpollen records: A simulation approach. The Holocene 9:409–421
Tenow O (1972) The outbreaks of Oporinia autumnata Bkh. andOperophthera spp. (Lep., Geometridae) in the Scandinavianmountain chain and northern Finland 1862–1968. Zool BidrUppsala Suppl 2,1:107
Tinner W, Lotter AF (2001) Central European vegetation response toabrupt climate change at 8.2 ka. Geology 29:551–554
Tinner W, Lotter A (2006) Holocene expansions of Fagus sylvaticaand Abies alba in Central Europe: where are we after eightdecades of debate? Quat Sci Rev 25:526–549
Veski S, Seppa H, Ojala AEK (2004) Cold event at 8200 yr b.p.recorded in annually laminated lake sediments in eastern Europe.Geology 32:681–684
Welten M (1944) Pollenanalytische, stratigraphische und geochro-nologische Untersuchungen aus dem Faulenseemoos bei Spiez.Veroffentlichungen Geobotanisches Institut Rubel, Zurich 21:1–210
Wiersma AP, Renssen H (2006) Model–data comparison for the8.2 ka b.p. event: confirmation of a forcing mechanism bycatastrophic drainage of Laurentide Lakes. Quat Sci Rev25:63–88
Willis KJ, van Andel TH (2004) Trees or no trees? The environmentsofcentral and eastern Europe during the Last Glaciation. QuatSci Rev 23:2369–2387