when is more better? the impact of business scale and scope on
TRANSCRIPT

WHEN IS MORE BETTER? THE IMPACT OF BUSINESS SCALE AND SCOPE ON LONG-TERM
BUSINESS SURVIVAL, WHILE CONTROLLING FOR PROFITABILITY
Janet Bercovitz The Fuqua School of Business, Duke University
Box 91020, Durham, NC 27708-0120 Phone: 919.660.7993 Fax: 919.681.6244
Email: [email protected]
Will Mitchell The Fuqua School of Business, Duke University
Box 91020, Durham, NC 27708-0120 Phone: 919.660.7994 Fax: 919.681.6244
Email: [email protected]
Version: RscaleScope3i.doc (June 4, 2004)

WHEN IS MORE BETTER? THE IMPACT OF BUSINESS SCALE AND SCOPE ON LONG-TERM
BUSINESS SURVIVAL, WHILE CONTROLLING FOR PROFITABILITY
Abstract
Empirical research shows that larger businesses tend to survive longer than smaller companies. Little research, though, shows whether size confers survival advantages in addition to the survival benefits of baseline profitability. Moreover, no prior research attempts to disentangle the benefits of scale from those of greater business scope. Thus, we lack a conceptual understanding of the underlying benefits of business size for long-term survival. We expect business scale and business scope to offer survival benefits, where we conceptualize scale in terms of annual sales revenue and scope in terms of product line breadth within a related business context. We first argue that greater business scale and business scope each enhance long-term survival, independent of baseline profitability, owing to greater availability of financial resources, organizational routines, and external ties. We then argue that the benefits of scale are greatest for multi-product businesses, stemming from positive interactive effects of breadth and depth. We find support for these hypotheses with data from 618 firms that operated in the U.S. medical sector between 1978 and 1995.

1
WHEN IS MORE BETTER? THE IMPACT OF BUSINESS SCALE AND SCOPE ON LONG-TERM BUSINESS
SURVIVAL, WHILE CONTROLLING FOR PROFITABILITY
Two decades of research shows that larger firms and businesses tend to survive longer
than smaller companies (Aldrich and Auster, 1986; Schary, 1991; Mitchell, 1994; Baum, 1996).
Little research, though, has dug down to figure out how greater size might confer survival
advantages. One concern is that size, which is often measured as sales levels, might simply be
picking up an effect of profitability, which tends to correlate with sales but which few survival
studies control (Silverman, Nickerson, and Freeman, 1997). If greater size simply reflects greater
profitability, it is possible that the survival benefits of size per se might be overstated. A second
concern is the failure to disaggregate the independent scale and scope effects underlying the size-
survival relationship. Greater size might mask survival benefits of greater related business scope,
which tends to correlate with size (Karim and Mitchell, 2000). The distinction between business
scale and scope raises intriguing questions, because some theories attribute a greater chance of
survival to greater scope (e.g., Dowell, 2000), while others predict that greater scope may detract
from performance and lead to failure. A third concern is that any scale benefits might be
contingent on business scope, such that businesses with different scope might realize differential
survival benefits from greater scale. Together, these issues raise a fundamental conceptual
question concerning the long-term business size-survival relationship: what underlying
contributions of business scale and scope confer long-term competitive advantages or,
conversely, create disadvantages?
This paper takes a multi-disciplinary approach to investigate how profitability, scale, and
scope during a baseline period contribute to long-term business survival. We combine insights
from traditional economics, the resource-based view of strategy (Penrose, 1959), evolutionary
economics (Nelson and Winter, 1982), and organizational ecology (Hannan and Freeman, 1989).
In concert, these perspectives point to three related attributes of scale and scope – financial
resources, organizational routines, and external ties – that together create long-term survival
advantages, even controlling for baseline profitability. We predict that greater scale and scope
provide stocks of money, routines, and ties from which a firm can draw when it faces problems
and therefore contribute to longer survival. We also predict that the three attributes together
create a moderating effect, in which the benefits of scale apply most strongly to multi-product
2
businesses. We test the predictions in the context of publicly traded U.S. medical sector
businesses from 1978 to 1995. This study contributes to the diversification literature, by
investigating how characteristics of a firm’s scale and scope at a point in time contribute to long
term business survival, controlling for profitability. In doing so, the study helps identify the
limits of beneficial diversification, contrasting the gains from diversification within an industrial
sector with the difficulties imposed by growth beyond a sector.
THEORY
Five concepts are central parts of our discussion of long-term business survival:
businesses, long-term survival, profitability, scale, and scope. A business is the commercial
activity of a firm within a given industrial sector. A business is equivalent to a firm if a company
participates in a single industry. In parallel, a business is a subunit of a multi-industry company.
Studying businesses is useful because it allows us to examine both single-business and multi-
business commercial activity within industrial sectors, which typically have both types of
participants.
In turn, long-term business survival is the length of time following a baseline point before
a business shuts down. For a single-business firm, shutting down is equivalent to corporate
failure. By contrast, multi-business firms may continue to operate as active corporations, even if
they shut down a particular business. We consider both types of business dissolutions to be
business failure, including closure of a single-business firm and dissolution of a focal business
by an ongoing corporation. By contrast, we do not view the sale of a business to a new owner
(whether sale of an entire corporation or divestiture of a focal business) as a business failure.
We are interested in long-term business survival for both conceptual and empirical
reasons. Conceptually, long-term survival is a meaningful performance measure for multiple
stakeholders in a business. Survival is valuable to shareholders to the extent that dissolution costs
create substantial financial losses. In addition, business survival and failure affect other
stakeholders, including employees, suppliers, distributors, and communities, who make
dedicated investments in a particular business. Thus, it is useful to develop a deeper
understanding of what factors make a business more or less likely to survive for extended
periods. Empirically, business survival is a meaningful performance measure for diversified
firms that do not report the financial performance of their discrete business units. Unlike most
survival studies that examine survival based on the hazard of failure from one year to the next,
3
this study investigates how baseline levels of profitability, scale and scope (at time t) influence
long-term business survival (at time t+n). We explore the long-term effects of organizational
capital stocks and flows for survival beyond a baseline period. Of course, immediate influences
on survival are important. It is equally important, however, to examine whether resource stocks
have persistent effects on performance.
Profitability, scale, and scope are three key dimensions of organizational capital
(Levinthal, 1991). Profitability (which we define in terms of return on sales) is a relative
measure of the flow of capital that the firm has available to convert into new stocks. This
measure represents how successful a firm has been in generating resources – firms with greater
return on sales generate proportionally more resources from their current businesses that they can
use to sustain and grow those businesses. Thus, the profitability ratio measure is a signal of the
business’ competitive success, in the sense that its customers’ willingness to pay is greater than
cost of products.
Scale and scope, on the other hand, reflect stocks of organizational capital resulting from
past flows. We conceptualize business scale and scope in terms of sales revenue and product
lines. Business sales are the value of goods that a business provides to its customers in a given
period. Sales, which reflect commercial success, provide a common conceptually-appropriate
measure of business scale because they reflect current stock of resources with realizable value.
Other measures of scale include assets, capacity, and employment. These alternative measures
are less appropriate conceptually for studies of long-term survival. Asset and capacity size may
reflect prior investment in obsolete resources. Similarly, greater employment may reflect prior
business conditions. Given the relatively “sticky” nature of employees, a large employee base
could be the unproductive remnants of a previous expansion attempt rather than a useful measure
of productive assets. In addition, the employee-size relationship is sensitive to business type – a
different number of employees are needed to create similar value across manufacturing, service,
or distribution-focused businesses. Product lines are the different types of physical goods and
non-physical services that a business sells to consumers. Product lines provide a common
measure of business scope. In our approach, the product line scope of a business provides an
accurate measure of related diversification, because we focus on product line proliferation within
a specified industrial sector. Together, scale and scope comprise key dimensions of business size
that previous research does not disaggregate.

4
Profitability: Benefits of Financial Strength
We start with the straight-forward prediction that firms with greater baseline profitability
will survive longer than less profitable firms. The relationship between profits and survival is
fundamental to traditional economics. Simply put, firms will tend to exit a market if the risk-
adjusted rate of return falls below costs (Besanko, Dranove, and Shanley, 2000). The strongest
argument applies to exit by dissolution, rather than to cases in which a business is sold to new
owners, because divestiture may happen for many reasons other than low profitability
(Ravenscraft and Scherer, 1987). While organizational theorists tend to adopt a more tempered
view of the selection environment, arguing that non-economic ties and other factors may buffer
unprofitable firms, they generally concur that lack of profits is a fundamental driver of
organization mortality (Levinthal, 1991; Carroll and Harrison, 1994). Organization theory, to the
extent that it makes a distinction between types of exits, also views the profitability-survival
relationship more in terms of dissolution than divestiture. Thus, the following baseline
hypothesis draws from both economic and organizational logic, focusing specifically on avoiding
dissolution (i.e., we exclude divestiture from the definition of business failure).
H1. The greater the baseline profitability of a firm, the longer a business will survive.
This baseline profitability prediction is intuitive. Nonetheless, few studies of business
survival have directly investigated the profitability-mortality link because of the significant
challenges of collecting longitudinal profitability data and of distinguishing business dissolutions
from divestitures in historical data.1 Instead, most survival analyses have focused on the impact
of size, using various measures of size including sales, assets, capacity, and employment,
consistently finding that larger firms and businesses are less likely to exit. These studies include
Star and Massel (1981), Small Business Administration (1983), Aldrich and Auster (1986),
Evans (1987), Barnett (1990), Delacroix and Swaminathan (1991), Baum and Oliver (1991),
Baum and Mezias (1992), Carroll and Swaminathan (1992), Barron, West, and Hannan (1994),
and Mitchell (1994). Although many of these studies pool dissolutions and acquisitions as forms
of exit, which creates some ambiguity in interpreting the results, the basic size-survival
relationship appears to be robust at both the corporate and business level.
Despite the robust size-survival findings, the underlying causality of the result may be
problematic, because profitability tends to correlate with size (Scherer and Ross, 1990;
Szymanski, Bharadwaji, and Varadarajan, 1993). Therefore, the size-survival relationship might

5
simply be a proxy for an underlying profitability-survival relationship. The baseline profitability
hypothesis provides a first step in segregating specific profitability effects from the size effects
that we discuss next.
Scale: Benefits of Greater Sales
Even controlling for profitability, we believe that greater business scale will lead to
longer business survival. We will focus on three related benefits associated with greater scale,
which include the availability of financial resources, routines, and external ties.
First, consider the financial benefits that accrue to scale. At any given level of return,
larger businesses will have access to more extensive financial resources. For example, the flow
of cash moving through a business with $100M in sales and 10% margin will be much greater
than the flow moving through a $10M business with the same 10% margin. Given some
flexibility in the allocation of this cash flow, larger businesses will have a greater opportunity to
accumulate stocks of firm-specific resources that provide competitive advantage and
subsequently reduce the mortality hazard (Barney, 1986; Levinthal, 1991). Specifically, greater
day-to-day spending on R&D activities and/or marketing and sales activities in support of
business operations can provide the seeds for long-term advantage by building knowledge stocks
and brand identity (Hambrick and D'Aveni, 1988). This sustainability advantage will increase
further if asset mass efficiencies operate, that is, if the incremental cost of adding to asset stocks
declines as the existing base grows (Dierickx and Cool, 1989).
Second, in addition to financial resources, the routines associated with greater scale
augment the survival benefit. With greater sales, a business can repeatedly employ a central set
of operational and managerial routines. Repeated use of routines leads to refinements and
efficiencies (Nelson and Winter, 1982; Hannan and Freeman, 1984; March 1991). Thus, greater
scale provides greater opportunities for learning by doing that can result in productivity gains
(Argote, 1996). Simultaneously, the recurring utilization of a set of routines limits costly
knowledge depreciation and thus enhances operational effectiveness (Argote, Beckman, and
Epple, 1990). As long as the external environment does not change drastically, the increased
efficiency and effectiveness of organizational routines will enhance long-term business survival.
Third, greater scale helps create deeper external ties. Given the costs of establishing new
ties, businesses will tend to exploit existing ties more intensely before opting to pursue new
external links. To avoid the performance risk and qualification costs associated with bringing a
6
new supplier on-board, for instance, businesses generally prefer to ask proven suppliers to
provide greater volumes to meet growing demand. Likewise, augmenting relationships with
existing customers can provide a lower-cost source of revenues than starting the sales process
from scratch to acquire a new customer (Uzzi, 1996). Given the non-proportional relationship
between number of ties and sales, the external ties of larger businesses tend to be deeper than the
external ties of smaller businesses. Further, as the magnitude of the exchange increases, the level
of interdependence between the business and its external constituents tends to rise (Pfeffer and
Salancik, 1978; Gulati, 1995). External players with vested interest in, and deep ties with, a focal
firm have both opportunity and reasons to continue to support the focal business in times of crisis
(Winter, 1987). For example, suppliers might find it in their best interest to extend payment
deadlines or provide special volume discounts to assist key customers through rough financial
periods. Similarly, key buyers may be willing to invest – through equity acquisition or
collaborative ventures – to enhance the technology and thus the survival prospects of important
suppliers. For instance, Nortel and Ericsson were able to negotiate favorable terms with their
telecommunications customers when they faced financial difficulties in 2001 and 2002. In
essence, strong relationships with dependent external players provide buffers that protect larger
firms from survival-threatening shocks (Miner, Amburgey, and Stearns, 1990).
These three intertwined characteristics of larger business scale – greater financial
resources, more efficient routines, and deeper external ties – provide a stock of resources that
confer both economic and organizational advantages that contribute to business survival. All
three stocks help a firm deal with challenges that arise in relatively stable markets. The stocks
also help a firm adapt during market evolution.
The adaptation value of financial resources and external ties is most obvious. Having
access to greater stocks of financial resources can help a firm make needed changes, while
external ties help buffer a firm during adaptation.
In addition, the possession of a large stock of routines that suit a particular market
environment provides depth from which a firm can draw to help create new routines as markets
evolve. These stocks of financial resources, ties, and routines will help a firm respond to, and
recover from, competitive challenges and market changes that cause profitability to decline.
Thus, greater scale provides stocks of resources on which a firm can draw when it
encounters problems that threaten its survival. As a result, greater scale limits the impact of
7
difficulties that would cause smaller firms to fail. As such, we hypothesize that greater scale will
contribute to long-term survival even controlling for baseline profitability.2
H2. The greater a business’s scale, the longer it will survive.
Scope: Benefits of Product Line Breadth
The second element in our argument links business scope to long-term business survival.
We define business scope in terms of the firm’s variety of offerings (i.e., product-lines) within an
industrial sector. The same three factors that create the scale-survival relationship – financial
resources, organizational routines, and external ties – are also at the root of the scope-survival
relationship. We argue that greater variety in any of these three factors provides survival
benefits.
Consider first the business’s financial resources. Businesses with multiple product lines
may benefit from two financial portfolio effects: risk reduction and internal capital allocation
efficiencies. Risk reductions obtain when the cash flows of different product lines correlate
imperfectly, so that product-line breadth reduces the variance, and thus the overall risk, of the
business (Lubatkin and Chatterjee, 1994). Such diversification can enhance business longevity
by dampening the financial fluctuations that can push a business into insolvency. In sum,
broader scope – as evidenced by a portfolio of products – may diversify risk. Internal capital
allocation efficiencies obtain because businesses with multiple product lines have the
opportunity to move capital across lines. If the business has more complete knowledge about the
merits of internal investment options within their related business activities than do external
suppliers of capital, internal capital allocation offers efficiency advantages for the diversified
business that, in turn, may contribute to the entity’s long-term survival (Williamson, 1975;
Liebeskind, 2000).
Second, multi-product businesses also have more diverse sets of organizational routines
then do focused firms. Single product businesses generate a relatively specialized set of
operating routines. By contrast, multi-product businesses must generate multiple sets of routines
to develop, produce, and sell their goods as well as a set of coordinating routines to manage these
activities within the business (Dowell, 2000; Karim and Mitchell 2000; Mukherjee, Mitchell, and
Talbot, 2000). Routine variety provides survival advantages by supporting broader search and
increasing routine recombination opportunities. When faced with a challenge, the span of
problemistic search is determined in large part by the business’s existing organizational routines
8
(Nelson and Winter, 1982; Dosi, 1988: Teece, Pisano, and Shuen, 1997). Those businesses
having more diverse routine sets will be better positioned to identify a richer set of potential
solutions and better endowed to more astutely evaluate the viability of these alternatives (Winter,
1987; Cohen and Levinthal, 1990). Further, businesses having more expansive routine sets will
also have greater opportunity to leverage and creatively combine existing routines to solve
problems and create new opportunities thus enhancing the business’s survival chances (Penrose,
1959; Nelson and Winter, 1982; Fleming, 2001).
Third, the variety of external ties a business possesses will influence its mortality hazard.
Similar to variety in internal routines, variety in external ties provides information access
benefits as businesses often learn from those they interact with (Von Hippel, 1988). Being able
to draw knowledge from a heterogeneous set of external ties allows the business to accumulate
superior information for building and focusing internal capabilities to solve problems and/or
exploit opportunities (Gulati, 1999; McEvily and Zaheer, 1999).
Thus, variety in financial resources, organizational routines, and/or external ties confers
survival benefits in terms of business scope. Like greater scale, greater scope helps a firm
overcome competitive challenges and market changes.
H3. The broader the business scope within a sector, the longer the business will survive.
Hypothesis 3 might appear to conflict with arguments concerning business scope that
arise in several literatures. Business expansion does not come without costs and, beyond some
point, the costs may outweigh the benefits of greater breadth. For example, economists highlight
how pursuing broad scope strategies may degrade performance by reducing a firm’s ability to
take advantage of economies of scale (Scherer and Ross, 1990). Similarly, ecological studies
note the challenge of bounded rationality that constrains the size of operations and number of
routines that firms can manage efficiently (Barnett and Freeman, 1997). The diversification
literature, too, has used variables similar to the number of product lines as measures of over-
diversification or high governance costs (e.g., Markides, 1992; Hitt, Hoskisson, Johnson and
Moesel, 1996; Bergh and Lawless, 1998), arguing that firms with excess levels of diversification
will suffer lower performance and will be more likely to spin off business or realize increased
value when they spin off businesses. To the extent that that product line expansion represents
over-diversification, then, we will not find support for our hypothesis.

9
For such over-diversification problems to lead to business failure, though, two factors
would need to apply: first, firms would need to expand beyond their carrying capacity; second,
they would then have to find it difficult to renarrow themselves to viable limits. These issues
might well arise if one examines business scope at relatively high levels of aggregation, such as
unrelated diversification across different industries. At more refined levels of scope within an
industry, such as the product line level that we use in this paper, though, firms in developed
markets regularly add new product lines and typically are able to subtract obsolete or conflicting
product lines without damaging their survival chances.
Indeed, when one considers increasing business scope within a related business area, we
expect to find the benefits of greater scope that we discussed above. Opportunities for internal
capital allocation, routine recombination, and ties with external constituents all are likely to arise
frequently within an industrial sector. By contrast, of these three benefits of scope, only the
financial benefits can be counted on to strongly contribute under conditions of unrelated
diversification as routines and ties often do not transfer across different industries. Moreover,
firms will tend to be better able to realize the opportunities that arise within an industrial sector
than those that might potentially apply in cases of unrelated diversification, because they usually
have greater immediate understanding of prospects and means of implementation in related
activities than they do across diversified businesses. Consistent with our argument, we measure
product lines at a much more refined level than prior studies, which tend to use business
segments or four-digit SIC codes as measures of diversification.
At the same time, it is partly an empirical issue whether excessive scope creates
systematic problems or, instead, whether firms usually can manage their product line scope
effectively. In particular, if firms find it difficult to retrench from over-expansion, then scope
might have a non-linear relationship with survival, first contributing and then detracting. We test
for evidence of non-linearity in our analysis and discuss this issue in the results section.
Scale and Scope: Moderating Interactions
Our final hypothesis addresses the way in which business scope influences the scale-
survival relationship. We predict a positive scale x scope interaction effect, such that the benefits
of scale increase as product line breadth increases. Across each of the three operative
components – financial resources, organizational routines, and external ties – we expect an
increase in related scope to enhance the survival benefits accruing to business scale.
10
First, consider how variety in financial resources contributes to the scale benefits. As we
noted above, larger businesses generate greater cash flows that can be used to accumulate
capabilities and enhance business survival. Increases in product line scope amplify the survival-
related value of these financial resources by providing opportunities to allocate capital across
product lines in a manner that enables the business to address the most pressing problems and
build the most promising areas. Thus, businesses with more product lines will realize greater
benefits from greater sales.
Second, with respect to organizational routines, scale imparts experience benefits.
Specifically, by virtue of repeated use, larger businesses will develop more efficient
organizational routines (Nelson and Winter, 1982). The survival benefits of these efficiencies
further increase with scope because multi-product firms have greater opportunities to leverage
established routines across the activities associated with multiple lines (Penrose, 1959). Again,
businesses with more product lines will gain greater benefits of increased sales.
Finally, the existence of deep ties with vested external constituents buffers large
businesses from survival-threatening environmental shocks. Product-line breadth can augment
this buffering effect in two ways. First, for a core set of suppliers and customers, related
diversification (i.e., offering multiple product lines) by the focal firm serves to intensify the
strength of existing ties by increasing the interactions between the players – as suppliers provide
materials for multiple line and buyers purchase products from multiple lines. Second, the number
and variety of external ties of the focal firm also will increase with increasing scope. The
information gains from this variety can lead to capability refinement that makes the focal firm
even more valuable to its external constituents. On both accounts, the incentive for the external
players to support the focal firm to insure survival increases. Thus, the following hypothesis:
H4. The broader the related scope of a business, the more that business scale increases long term business survival.
In summary, we argue that business scale and scope provide long term business survival
benefits, even controlling for profitability. The possession of larger stocks of organizational
capital provides long-term survival benefits, independent of the level of resources that flow from
current profitability. The survival benefits stem from greater availability of financial resources,
organizational routines, and external ties, which help a firm deal with competitive challenges and
market evolution. We also predict that the benefits of scale apply most strongly to multi-product
businesses, owing to moderating effects of financial resources, routines, and ties. Table 1

11
summarizes these theoretical arguments. We note that the three underlying contributors to the
scale and scope benefits – money, routines, and ties – reflect both economic and organizational
dynamics and that these attributes reinforce each other. Rather than disaggregate into separable
effects, they provide an aggregate contribution that leads to longer survival, independent of
baseline profitability.
********** Table 1 about here **********
This approach takes a forward-looking view, in which current stocks and flows affect
future business survival. Clearly, the stocks of scale and scope and the flows of profits that exist
at a baseline point result from a complex set of past actions. From this baseline, however,
profitability, scale, and scope have persistent influences on a firm’s future performance. Thus, a
firm’s current organizational capital has an exogenous effect on future performance, even though
current capital may arise from prior resource flows.
DATA AND EMPIRICAL APPROACH
We test the hypotheses by examining a sample of firms that participated in the U.S.
medical sector between 1978 and 1995. The data source that we use is The Medical and
Healthcare Marketplace Guide (1975, 1978, 1983, 1986, 1989, and each year after until 1995).
These guides identify virtually every firm of any appreciable size that was operating in the U.S.
medical sector, including U.S.-owned and foreign-owned businesses. The guides provide
extensive information regarding the firms’ medical sector product lines. The guides identify 258
product lines from five sub-sectors: medical devices (184 lines), dental devices (5 lines),
ophthalmic devices (7 lines), pharmaceutical products (16 lines), and healthcare services (46
lines). The data provide an unusually fine-grained set of information about firms’ profitability,
sales, product lines, and survival.3
We construct the sample from all public firms operating in 1978 and 1983 and then
examine their survival through 1995. We focus on two years of baseline activity to increase the
number of firms that we can examine. The sample includes 618 firms, with 145 firms that were
operating in 1978 and an additional 473 firms that entered the data set by 1983.4 Almost all the
firms were based in the U.S. We focus on these years for two reasons. First, we choose 1978 as
the base year because we were then able to use information from the 1975 guide to calculate
control variables for ex ante business activity and industry growth. Second, focusing on these
two baseline years provides a more consistent window over which to examine firm actions than
12
if we include a greater number of years. We focus on public firms because profitability
information is available in these cases.
Focal Variables
The dependent variable measures how long a business survived after the baseline year in
which the firm entered the data set. We treated firms that remained in the data set in 1995 as
right-censored cases, as we will discuss in the methods section. In addition, we also treated firms
that were acquired during the study period as right-censored cases because, as we noted earlier,
acquisition is a conceptually different outcome from business failure. Within our 618 cases, 212
(34%) continued in 1995, 199 (32%) shut down before 1995, and 207 (33%) were acquired
before 1995.
The primary independent variables are profitability, sales, and scope. We defined
profitability as the firm’s reported return on total sales (PROFITABILITY) in the baseline year
(1978 or 1983).5 We measured sales in terms of reported medical sector sales revenue in the
baseline year (thousands of 1982 dollars based on the Producer Price Index), taking the natural
log in order to constrain the effect of outliers (LOGSALES_MEDICAL). We measured scope as
the natural log of the number of medical sector product lines that the business offered in the
baseline year (LOGPRODUCT_LINES). The number of lines ranged as high as 56, but almost
60% of the businesses had only one or two lines. There were 223 single-line businesses (36%),
145 two-line businesses (23%), and 250 businesses with three or more lines (41%).
We also interacted the LOGSALES_MEDICAL variable with the
LOGPRODUCT_LINES variable in order to test hypothesis 4. The effect of this interaction
variable in the analysis, as we discuss in the results section, is to adjust (increase or decrease) the
main effect of sales for businesses with the specified number of lines. Table 2 reports descriptive
statistics for the independent variables.
********** Table 2 about here **********
Control Variables
We included control variables at the business and sector level. We used four sets of
variables at the business level to control for competitive advantage, performance trends, age, and
semi-related/unrelated diversification effects.
First, it could be argued that long-term business survival is a product of firm competitive
advantage with scale and scope being supplementary by-products of this competitive advantage.
13
To tackle this spurious correlation issue, we include several competitive advantage variables to
capture the strength of a business’s resource base that might drive survival. To control for
innovation capability, we add a variable (NEW PRODUCT INTRODUCTION) that tracks the
number of new products that the firm introduced during the three to five years before the
baseline year. Firms that have added more products have demonstrated greater ability to respond
to market opportunities (Roberts, 1999; Banbury and Mitchell, 1995; Katila and Ahuja, 2002)
We also add functional dummies (manufacturing, service, and distribution) to control for the
span of the business’ operations as a means of measuring its access to complementary
commercialization resources. (Table 2 shows that these functional variables have low
correlation with scale and scope.) Firms with the relevant complementary assets may have a
competitive advantage in that they may be better able to appropriate rents and thus enhance
survival (Teece, 1986; Mitchell, 1991).
Second, we created a variable (PROFITABILITY GROWTH), calculated as the change
in profitability between the baseline year and the average return on sales for the five-year period
immediately prior to the baseline year, to incorporate a measure of the business’ financial history
(we also examined a three-year change in profitability, finding no material differences in the
results). An increasing performance trend might contribute to long-term business survival.
Third, we defined a set of corporate age dummy variables, based on firm age in the
baseline year: 1 to 3 years (AGE1), 4 years (AGE2), 5 to 8 years (AGE3), 9 to 14 years (AGE4),
15 to 21 years (AGE5), 22 to 29 years (AGE6), 30 to 55 (AGE7), 56 to 81 years (AGE8), 82 or
more years (AGE9). We chose the age categories based on empirical distributions; the results
were not sensitive to varying the cut-off points. Many studies find that older businesses are less
likely to shut down (Mitchell, 1994), although sometimes with an increased risk of failure at
extreme age (Barron, West, and Hannon, 1994).
Finally, we include two variables to capture the effects of unrelated and semi-related
diversification. As a measure of unrelated diversification, we include the level of non-medical
sales (LOGSALES_NONMEDICAL) for the multi-business corporations in the data set in order
to determine whether scale benefits are business specific, as we expect, or whether there is a
more general effect on long-term survival of corporate size. As a measure of semi-related
diversification, we include the number of medical sub-sectors (NUMBER OF SUB-SECTORS)
in which a firm operates.
14
We defined two variables to measure medical sector effects. First, we include a variable
to control for the effect of competition (COMPETITORS). This variable records the number of
companies that operate in each firm’s product lines during the baseline year (1978 or 1983). For
companies that operate in more that one product line, we average the values across lines. Second,
we measure market growth in the product lines that a firm operates by determining the change in
the number of firms that participated in a product line (PRODUCT LINE GROWTH).6 For firms
that operate in multiple product lines, we take the mean competitor-growth in each line.
We also defined a dummy variable that distinguished between the businesses that entered
the sample in 1978 and those that entered in 1983 (SAMPLE_1983). This variable helps
determine whether there were systematic differences across the subsamples.
Statistical Methods
We tested the hypotheses using accelerated event-time regression (Kalbfleisch and
Prentice 1980; Cox and Oakes, 1984; Mitchell, 1989). The accelerated event-time method
assumes that the event-times, which are survival durations in this study, distribute according to a
parametric baseline distribution that would hold if all independent variables were zero. The
procedure then estimates the effects of covariates as exponentially multiplicative accelerations or
decelerations of the baseline distribution. The basic additive logarithmic form of the model takes
the form: (1) ln Ti = bXi + sei . In this equation, Ti is the observed event time of the ith case, Xi is
a vector of intercept and covariates associated with the ith case, and b is a vector of coefficients
associated with the independent variables. A positive b coefficient accelerates the baseline
distribution of event times and a negative coefficient decelerates the distribution. The error
vector e takes an assumed parametric distribution with a variance-related scale factor s. A shape
parameter also appears in some distributions, as we discuss below.
The accelerated event-time method suits the duration analysis of this study for two
reasons. First, the method incorporates the information that some survival times are right-
censored, that is, business dissolution did not occur before the end of the study period. Right
censoring includes cases for which an event has not occurred by the end of the study period and
cases that leave the sample before an event occurs, which in our sample includes businesses that
continued in 1995 and businesses that were acquired before 1995. The accelerated event-time
method uses the right-censoring information by including the value of a censored duration in the
estimation of the survival function, which is the probability that an outcome will occur at some

15
unknown time in the future. A noncensored case, meanwhile, applies to the probability density
function, which is the probability that an outcome occurs at the observed time.
The second advantage of the accelerated event-time method is that it takes a flexible set
of parametric distributions that can be used to distinguish between constant, monotonically
declining or increasing, and nonmonotonically declining hazard rates. The one-parameter
exponential distribution can estimate a constant hazard rate. The exponential nests arithmetically
within the two-parameter Weibull distribution, which will describe a monotonically declining or
increasing rate. The Weibull, in turn, nests within several three-parameter generalized gamma
distributions, which will describe both monotonic and nonmonotonic rates. In addition to the
gamma families of distributions, the two-parameter log-logistic distribution will take either a
monotonic or nonmonotonic form. Together, the logistic and gamma-family distributions
describe and estimate many common monotonic and nonmonotonic patterns of organizational
outcomes.
We initially employed a gamma distribution for the analyses. The gamma distribution
has the useful property that the shape parameter incorporates heterogeneity in a duration model
(Greene, 1990). That is, the shape parameter controls for influences on the outcome distributions
of different observations that the independent variables in the model do not explicitly measure.
In addition, the gamma distribution will collapse to either a monotonic Weibull model or a
nonmonotonic lognormal model if such heterogeneity is not present.
The gamma distribution reported by Greene (1990: 319) has a hazard function,
h(t)Gamma, which breaks into the following two multiplicative components
(2) h(t)Gamma = S(t)q x h(t)Weibull, where
(2a) S(t)q = [1+q(Lt)p]-1/q
(2b) h(t)Weibull = Lp(Lt)p-1.
Equations (2a) and (2b) introduce three parameters, q, L, and p. The parameter q
represents the shape parameter of the gamma distribution. As q goes to 0, the limit of S(t) goes to
1, so that h(t)Gamma converges on the Weibull hazard function h(t)Weibull. The parameter L is
a transformation of the reported intercept and covariate effects from equation (1), with values
taken at the data means, such that L=exp(bX). The parameter p represents a transformation of the
reported scale parameter s from equation (1), such that p=1/s. The tables of results in this paper
report the values of b, s, and q for the coefficients, scale parameter, and shape parameter.
16
As we noted above, the generalized gamma collapses to the simpler two-parameter
Weibull or lognormal distribution if unspecified covariates do not have significant influences.
The lognormal distribution, which holds when the gamma shape parameter equals 0, will model
cases in which there is an underlying nonmonotonic event rate such that events at first occur
slowly, then quickly, and then decline again. The Weibull, which holds when the gamma shape
parameter equals 1, is appropriate for monotonically decreasing rates. The Weibull in turn
collapses to the exponential distribution if event rates are constant, that is, the Weibull scale
parameter equals 1. Thus, the gamma distribution encompasses a general set of underlying
distributional patterns.
Based on assessment of the models, we found that the gamma analyses would collapse to
the more parsimonious Weibull without losing statistical fit. We compared the initial gamma
distribution estimates to the nested Weibull and lognormal distributions. We found that the
gamma shape parameter was not significantly different from 1, indicating that the Weibull
provides an equivalent statistical fit (but differed strikingly from the lognormal). In addition, the
coefficients in the gamma and Weibull estimates were materially equivalent. We also tested the
Weibull against the constant-rate exponential distribution that nests within it, finding that the
Weibull produced a significantly better statistical fit than the exponential (the Weibull scale
parameter differed from 1). Therefore, we settled on the Weibull distribution for the analyses that
we report here.
Accelerated event-time regression provides a robust technique for estimating influences
on the duration before an event takes place, allowing the inclusion of right-censored cases. The
generalized gamma distribution and the distributions that nest within it provide a particularly
flexible family of accelerated event-time regression models because they estimate monotonic and
nonmonotonic underlying event rates as well as testing for the influence of omitted effects.
RESULTS
Hypothesis tests
Table 3 reports the results of the accelerated event-time regressions. We follow a
hierarchical estimation procedure adding independent variables one at a time and building to the
full model in column 4.
********** Table 3 about here **********

17
Model 1, our baseline model, includes all the business and sector level control variables
plus the profitability independent variable. In support of H1, we find that firm profitability leads
to long-term business survival. As predicted, more profitable businesses survive longer than less
profitable businesses.
The regression equation in Model 2 adds medical sector sales, our measure of business
scale (LOGSALES_MEDICAL). As H2 predicts, we find that, even controlling for baseline
profitability, greater scale positively and significantly contributes to long-term survival. The
change in the log-likelihood χ2 statistic between Model 1 and Model 2 is also significant. The
finding of independent and significant effects for profitability and sales on long-term survival
highlights the necessity of including both variables in the estimation.
H3 predicts that greater related scope will have a positive effect on long-term business
survival. Consistent with this hypothesis, the coefficient on the product-line variable in Model 3
is positive, although only moderately significant (LOGPRODUCT_LINES).
In sum, the initial results strongly support H1 and H2, while offering moderate support
for H3. We find positive main effects for each of the key independent variables – profitability,
scale, and scope. Higher levels of any one of these three attributes enhance long-term business
survival.
Model 4 adds the interaction terms necessary to complete the analysis and to test H4.
With the interaction terms, we investigate whether and how scope moderates the impact of sales
on long-term business survival. First, the regression analysis indicates that the addition of the
SCALE*SCOPE interaction term provides a statistically significant improvement in model
explanatory power. Further, the significant coefficients on the interaction term supports H4. The
interaction term shows that as related scope increases the beneficial main effect of sales also
increases. Thus, as predicted, we find that for businesses of a particular scale, the positive
contribution to long-term survival will be greatest for those firms having broader scope. That is,
greater product-line breadth augments the long-term survival gains that accrue from greater
scale.
The full analysis in model 4 supports H1, H2, and H4. Both profitability (H1) and scale
(H2) continue to influence survival directly, even with the interaction of scale and scope. Scope
(H3), however, becomes insignificant in model 4. Greater scope appears to affect survival only
18
in concert with greater sales (H4). Thus, firms that introduce multiple product lines without
gaining substantial sales do not gain survival benefits.
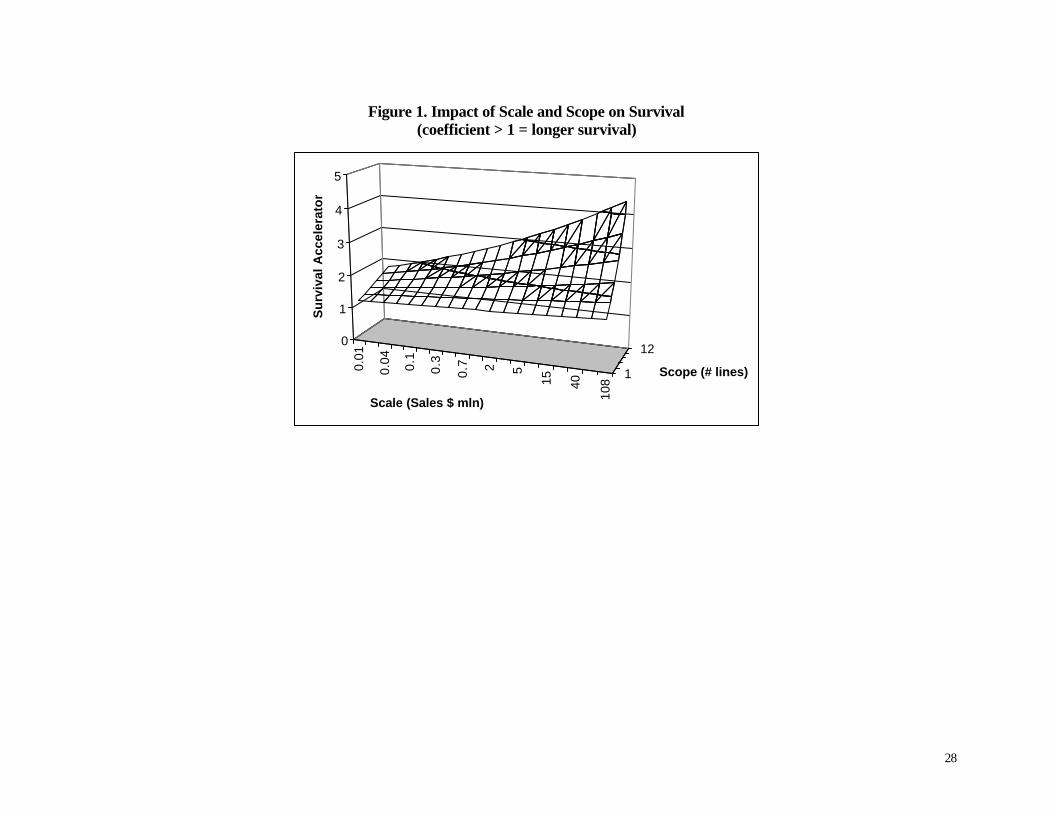
Figure 1 depicts the combined impact of scale and scope on survival within the empirical
range of the data. At low levels of scale and scope (the left front corner of the graph), there is
little impact on survival. Survival chances increase somewhat as sales increase (from left to right
along the front of the graph). Similarly, survival chances increase as scope increases at the
depicted level of sales (from front to back along the left side of the graph).7 The biggest survival
impact, though, is when both sales and scope increase (toward the back right corner of the
graph). The key conclusion from the figure is that, by far, the biggest impact on survival comes
from a combination of scale and scope, rather than from either dimension alone.
********** Figure 1 about here **********
Several business level control variables also contribute to survival in the full model
(Model 4). First, two of the competitive advantage control variables have a significant positive
impact on long-term business survival. Businesses that demonstrate innovation capability via a
track record of introducing new products reap survival benefits (NEW PRODUCT
INTRODUCTION). Similarly, involvement in the key complementary activity of manufacturing
also enhances long-term survival (MANUFACTURING). Second, business age influences long-
term business survival. The results reflect a liability of adolescence pattern (Bruderl and
Schussler, 1990; Fichman and Levinthal, 1991). As compared to AGE9 businesses (businesses
82 years or older in the baseline year), long-term survival is shorter for businesses that were 21
years or younger in the baseline year (AGE1-AGE5), with AGE2 businesses showing the
greatest survival vulnerabilities indicating that the survival threat is greatest for young businesses
that have run through their initial capital. Third, we find a positive relationship with long-term
survival for businesses that entered the sample in 1983 as compared to those that entered the
sample in 1978 (SAMPLE_1983). Fourth, a positive profit trend for the five-year period prior to
the baseline year had a weak influence on survival (PROFITABILITY GROWTH), although not
at a statistically significant level in the full model. Fifth, semi-related diversification (NUMBER
OF SUB-SECTORS) has a positive impact on long-term survival.
In turn, several business level control variables detract from survival. First, non-medical
sales (LOGSALES_NONMEDICAL) had a significant negative impact on long-term business
survival. It appears that increased activity in unrelated sectors may effectively divert

19
management attention or dilute corporate focus to a degree that is detrimental to the long-term
survival of the medical sector business. Put together with the benefits of semi-related
diversification (NUMBER OF SUB-SECTORS), these findings are consistent with our
contention that the benefits of scope stem from transferable variety in organizational routines,
external ties, and financial resources. Diversification offers benefits when the distance between
activities is close, such as among sub-sectors of the medical market. By contrast, added scope
harms rather than helps performance when distance between activities is too great to allow
businesses to leverage routines and ties – as in the case of unrelated diversification beyond the
medical market. Second, increases in the number of firms that participate in a product line
(PRODUCT LINE GROWTH) have a negative impact on long-term business survival. This may
reflect the impact of active competition in growing parts of a market.
Sensitivity analyses
To confirm the robustness of the scale and scope effects, we conducted four sensitivity
analyses. First, we explored the potential non-linearity of scope by adding the squared term for
scope to the model (number of product-lines squared). The resultant coefficient on this variable
was insignificant and inclusion of this term does not significantly increase model explanatory
power. As such, we find no evidence that long-term business survival suffers due to “over-
diversification.” We do not interpret these results as discrediting arguments that point to
substantial costs of over-expansion. Rather, we infer from this analysis that the firms in our
sample rarely expand and maintain lines past their product-line carrying capacity. As Karim and
Mitchell (2000) document, medical sector firms do undertake significant product-line
reconfiguration – both in the addition and in the deletion of lines. Over-expansion, when it
occurs, will not greatly threaten long-terms survival as long as firm can correct such mistakes by
divesting non-core lines (Carroll, 1993). Second, to ensure that using firm rather than business
unit profitability measures did not introduce bias, we ran the full model using a dataset that
included only firms that have all their sales within the medical sector. Results from this restricted
sample did not differ significantly from those that Model 4 reports. Third, we ran the analysis on
each of the two subsets of the data (firms that were present in 1978 and those that entered
between 1979 and 1983), finding consistent results for the predicted effects, although with
slightly less significance due to the reduction in sample size. Fourth, we added dummy variables

20
for the five medical subsectors to investigate sector-specific effects on survival, finding no
significant differences.
In addition, we conducted sensitivity analysis to investigate the effects of employment, an
alternative measure of scale, on long-term survival. We argued earlier that employment is not a
conceptually appropriate size measure in our context, because it may reflect inefficiencies as
well as greater resources. We found only a moderate correlation between number of employees
and annual sales revenue (r=0.14) in the subset of our sample for which we could obtain
employment data (about 85% of the sample). We found no relationship between employment and
long-term survival, whether we introduced employment as an additional variable in the full
model or whether we substituted employment for the sales measure.8 This finding is consistent
with our belief that sales provide a more valid measure of the key attributes of scale than
employment in studies of long-term survival.
DISCUSSION AND CONCLUSION
This study makes three contributions that extend our understanding of diversification and
long-term business survival. First, although many studies show that greater scale contributes to
survival, no studies have compared the effects of related and unrelated scale, where related scale
is the size of the focal business, while unrelated scale is the size of the rest of the corporation.
Second, a very small body of research examines whether related scope contributes to survival,
but no studies have examined the interplay between scale and scope, that is, whether the
advantages of scope arise independently of the advantages of size or, instead, whether firms
require greater size in order to benefit from greater scope. Third, we show that the benefits of
scale and scope go beyond the direct effect of profitability, which few survival studies control.
Thus, we suggest that related scale and scope provide stocks of organizational capital that confer
business survival advantages independent of baseline profitability flows.
These results are important because they dig down into the underlying causes of a
broadly-accepted relationship – the positive impact that greater size has on business survival –
and suggest that the reasons stem from a broader conceptual basis than traditional theories
provide. We demonstrate that survival does not stem simply from economic profitability.
Moreover, we argue, scale and scope provide benefits via a combination of factors that one
might think of as primarily “economic” and others that are more “organizational” in nature. The
benefits of financial resources align with traditional economic arguments, while the benefits of

21
routines and external ties add organizational components to more economic arguments. Thus, we
provide a more integrated theory of business performance than arguments that rely primarily on
either economic or organizational premises.
At the same time, the results provide a base for continuing research. The first finding –
that scale and scope confer survival advantages independent of profitability – creates a call for
more detailed investigations into the root factors underlying the scale/scope–survival link. In
developing hypotheses, we leveraged existing theory to identify three key attributes of scale and
scope that contribute long-term survival advantages: financial resources, organizational routines,
and external ties. Our current data do not allow us to directly study the survival contributions of
these factors. Further research to separate the influence of each of these attributes on business
survival would be valuable. Several questions arise. What are the relative contributions of
financial resources, organizational routines, and external ties to long-term business survival?
With respect to each of these factors, does depth or breath confer more survival value? How does
environmental stability or turbulence effect this ordering? Answers to such questions will further
advance theory and provide actionable recommendations for management.
The second finding – that scale-survival effects are greatest for multi-line businesses –
also provides a springboard for theory development and empirical research. In terms of survival,
the evidence suggests that a related diversification strategy will trump a pure focus strategy
within an industrial sector. Many questions remain, however, regarding the expansion modes and
firm-specific factors that support and/or constrain the concomitant growth in business scale and
business scope necessary to optimize long-term business survival.
An important piece of future research lies in determining whether different evolutions of
scale and scope pathways to possessing a combination of large size and extensive scope are more
successful. In particular, does it matter whether (1) a firm first becomes big and then adds lines
or (2) becomes big by judiciously adding lines that subsequently garner substantial sales? At
present, our data suggest that either route might hold. First, while we expect that some minimum
scale is necessary to support scope, we find that firms with many products and small scale
neither gain nor lose survival benefits. The fact that small firms do not incur a penalty in adding
new lines indicates that raw economies of scale reach diminishing marginal returns within the
empirical range of our data. Second, while the majority of businesses in our data fall within the
two categories of small and focused or large and diversified, we find that number of firms in
22
each of the off-diagonal categories is roughly equivalent. Thus, it seems that similar numbers of
firms are attempting the progression from small/focused to large/diversified by each pathway. A
longitudinal study that explores the survival rates of transitioning companies that take different
paths would be of interest and perhaps provide a source of actionable advice for managers.
The fact that that the majority of businesses in our sample were quite focused, with 60%
offering only one or two product-lines, give rise to questions regarding the firm-specific factors
underlying choice of scope. Given the direct and indirect benefits of scope, what explains the
failure of these firms to add additional product-lines? Can we conclude that these decisions
reflect rational choices based on variations in carrying capacity across similarly-sized firms? If
so, what factors are at the root of this variation in carrying capacity: organizational structure,
capabilities mix, or diversification experience? Or, contrary to arguments that decry the empire-
building tendency of management, is this lack of product-line expansion an indication of
managerial inertia and/or myopia? If so, how might the adoption of alternative expansion modes
such as in-house development, strategic alliances, or acquisition moderate such inertia? Karim
and Mitchell (2000) find evidence that acquisition leads to greater product-line reconfiguration,
with much of this reconfiguration occurring through the addition of lines. They stop short,
however, of connecting acquisition activities to long-term business survival. Based on our
findings, we would hypothesize a positive relationship between acquisition activity and survival.
This prediction offers an intriguing base for research, particularly because it flies in the face of
popular belief and conceptual arguments that emphasize the negative aspects of acquisitions.
In sum, this study helps enhance our understanding of the link between size and long-
term business survival by disaggregating the effects of baseline profitability, scale, and scope. In
and of itself, this contribution is substantial. In addition, these findings regarding the intricacies
of the size-survival relationship draw attention to the next layer of questions that need to be
explored in order to further clarify of this link.

23
ENDNOTES
1 Silverman, Nickerson, and Freeman (1997) control for profitability, finding that exit declines with sales while controlling for return on sales, but do not separate dissolutions and acquisitions. 2 The value of scale is likely to be strongest in environments characterized by continuous or incremental innovation as all three factors enhance survival in this context. By contrast, the survival contributions of efficient routines and deep external ties may degrade in business environments punctuated with disruptive or radical innovations. Nonetheless, routines and ties provide value even in such environments because some routine-based operational efficiencies may transfer to the new environment and some external ties may actually prove instrumental in buffering the firm as it adapts to new conditions. The beneficial influence of financial resources will, of course, remain in all environments. In our empirical context, we will examine an environment that primarily involved continuous changes, with a few discrete technical and market alterations. 3 The Medical & Healthcare Marketplace Guide was published by International Bio-Medical Information Services, Inc. (Acton, MA, and Miami, FL; edited by Adeline B. Hale and Arthur B. Hale) in 1975, 1978, 1983, 1986, and 1989. Subsequent editions have been published by MLR Publishing Company (Philadelphia, PA) and by Dorland's Biomedical Publications (Philadelphia, PA). Karim and Mitchell (2000) use a related data set to examine a different issue: whether product line overlap at acquirers and targets affected post-acquisition product line retention. 4 The medical sector is highly dynamic in terms of business entry and exit. The large number of entries between 1978 and 1983 reflect several driving factors including: (1) the growth of Medicare and Medicaid, which by the late 1970s was fueling commercial entry to take advantage of available payment for services that had not previously been covered by public programs (e.g., dialysis and nursing home care); (2) ongoing technical innovation, such as biotechnology, diagnostic equipment, and therapeutics; (3) the development of new health care services, such as assisted care services; (4) regulatory changes that led to substantial changes in the product and sales systems customers needed; and (5) changes in the customer base itself due to the emergence of new types of health care providers such as free-standing imaging facilities, out-patient clinical facilities, new nursing home chains, freestanding clinical testing laboratories. 5 Ideally, we would measure business unit profitability for the multi-business corporations in our data set, but business line profitability data do not exist. Corporate profitability is a meaningful measure of profitability even for examining sub-units of a multi-business firm, however, because corporate wide profits provide resources that can be used to maintain any business unit within the company. We include a control variable for non-medical sales levels of the multi-business corporations. In sensitivity analyses that restricted the sample to single-business firms, we found similar results to those that we report in this paper. 6 Ideally, we would measure change in total product line sales in the market, but data do not exist at that level of disaggregation. The growth in the number of firms is a reasonable alternative measure of whether a product area is growing or declining. We calculated the growth in the number of firms in the previous three to five years (1975-1978 or 1978-1983, depending on the baseline period); in sensitivity analyses, we also used competitor-growth per year, finding no material differences.

24
7 If we extend the graph to the left, towards lower levels of sales, then greater scope leads to slightly reduced survival chances at very low sales levels (reflecting the negative coefficient for scope in Model 4 of Table 3). However, such low levels of sales fall outside the empirical range of the data. Within the empirical range, the positive SCALE*SCOPE interaction is sufficient to more than offset the negative scope coefficient. 8 Although we can identify only total corporate employment, rather than medical sector employment, we found the same null effect when we limited the analysis to firms that operate only in the medical sector.

25
REFERENCES Aldrich, Howard, and Ellen Auster. 1986. "Even Dwarfs Started Small: Liabilities of Size and Age and Their
Strategic Implications." In Barry M. Staw and L.L. Cummings (eds.), Research in Organizational Behavior, 8: 165-198, Greenwich, CT: JAI Press.
Argote, Linda. 1996. “Organizational Learning Curves: Persistence, Transfer and Turnover.” International Journal of Technology Management, 11(7/8): 759-769.
Argote, Linda, Sara Beckman, and Dennis Epple. 1990. “The Persistence and Transfer of Learning in Industrial Settings.” Management Science, 36(2): 140-154.
Banbury, Catherine and Will Mitchell. 1995. “The Effect of Introducing Important Incremental Innovations on Market Share and Business Survival,” Strategic Management Journal, 16: 161-182.
Barnett, William and Glenn Carroll. 1987. “Competition and Mutualism Among Early Telephone Companies.” Administrative Science Quarterly, 32: 400-421.
Barnett, William P. 1990. "The Organizational Ecology of a Technological System." Administrative Science Quarterly, 35: 31-60.
Barnett, W., and J. Freeman. 1997. "Too Much of a Good Thing? Product Proliferation and Organizational Failure". Stanford University working paper.
Barney, J.B. 1986. "Strategic Factors Markets: Expectations, Luck, and Business Strategy." Management Science, 42: 1231-1241.
Barron, David N., Elizabeth West, and Michael T. Hannan. 1994. "Age, Size, and the Growth and Failure of Organizations: Credit Unions in New York." American Journal of Sociology, 100: 381-421.
Baum, Joel. 1996. “Organizational Ecology”, in Clegg, Hardy, and Nord (eds.) the Handbook of Organization Studies. Pages: 77-113. London: Sage Publications
Baum, Joel A.C., and Christine Oliver. 1991. "Institutional Linkages and Organizational Mortality." Administrative Science Quarterly, 36:187-218.
Baum, Joel A.C., and Stephen J. Mezias. 1992. "Localized Competition and Organizational Failure in the Manhattan Hotel Industry." Administrative Science Quarterly, 37: 580-604.
Bergh DD, and M.W. Lawless. 1998. “Portfolio Restructuring and Limits to Hierarchical Governance: The Effects of Environmental Uncertainty and Diversification Strategy.” Organization Science, 9 (1): 87-102
Besanko, David, David Dranove, and Mark Shanley. 2000. Economics of Strategy, 2nd Edition. New York: John Wiley & Sons, Inc.
Bruderl, Josef and Rudolph Schussler. 1990. “Organizational Mortality: The Liabilities of Newness and Adolescence.” Administrative Science Quarterly, 35: 530-537.
Carroll, Glenn. 1993. “A Sociological View on Why Firms Differ.” Strategic Management Journal, 14: 237-249.
Carroll, Glenn and J. Richard Harrison. 1994. “On the Historical Efficiency of Competition Between Organizational Populations.” American Journal of Sociology, 100: 720-749.
Carroll, Glenn R., and Anand Swaminathan. 1992. "The Organizational Ecology of Strategic Groups in the American Brewing Industry from 1975 to 1990." Industrial and Corporate Change, 1: 65-98.
Cohen, Wes and Daniel Levinthal. 1990. “Absorptive Capacity: A New Perspective on Learning and Innovation.” Administrative Science Quarterly, 35: 128-152.
Cox, D.R. and D. Oakes. 1984. Analysis of Survival Time Data. London: Chapman & Hall.
Delacroix, Jacques, and Anand Swaminathan. 1991. "Cosmetic, Speculative, and Adaptive Change in the Wine Industry: A Longitudinal Study." Administrative Science Quarterly, 36: 631-661
Dierickx, Ingemar and Karel Cool. 1989. “Asset Stock Accumulation and Sustainability of Competitive Advantage.” Management Science, 35: 1504-1511.

26
Dosi, Giovanni. 1988. “Sources, Procedures, and Microeconomic Effects of Innovation.” Journal of Economic Literature, 16: 1120-1171.
Dowell, Glen. 2000. “A Routine Based View of Constrained Organizational Change: The Impact of Product Line Breadth and Firm Experience on Survival of U.S. Bicycle Businesses,” Unpublished Doctoral Dissertation, University of Michigan.
Evans, D. S. 1987. “The Relationship between Firm Growth, Size, and Age: Estimates for 100 Manufacturing Industries." Journal of Industrial Economics, 35: 567-581.
Fichman, Mark, and Daniel Levinthal. 1991. “Honeymoons and the Liability of Adolescence: A New Perspective on Duration Dependence in Social and Organizational Relationships.” Academy of Management Review, 16: 442-468.
Fleming, L. 2001. “Recombinant Uncertainty in Technological Search.” Management Science, 47 (1): 117-132.
Greene, William E., (1990). LIMDEP User's Manual, Version 5.1. New York: Econometric Software, Inc.
Gulati, Ranjay. 1995. “Familiarity Breeds Trust? The Implications of Repeated Ties on Contractual Choice in Alliances.” Academy of Management Journal, 38: 85-112.
Gulati, Ranjay. 1999. “Network Location and Learning: The Influence of Network Resources and Firm Capabilities on Alliance Formation.” Academy of Management Journal, 38: 85-112.
Hambrick, D.C. and R.A. D’Aveni. 1988. “Large Corporate Failures as Downward Spirals.” Administrative Science Quarterly, 33: 1-23.
Hannan, Michael and John Freeman. 1984. “Structural Inertia and Organizational Change.” American Sociological Review, 48: 149-164.
Hitt, M. A., R. E. Hoskisson, R. A. Johnson and D. D. Moesel. 1996. “The Market for Corporate Control and Firm Innovation.” Academy of Management Journal, 39(5), 1084-1119.
Kalbfleisch, J. D. and R.L. Prentice 1980. The Statistical Analysis of Failure Time Data. New York: John Wiley & Sons.
Karim, Samina and Will Mitchell. 2000. “Path-Dependent and Path-Breaking Change: Reconfiguring Business Resources Following Acquisitions in the U.S. Medical Sector, 1978-1995.” Strategic Management Journal, 21: 1061-1081.
Katila, Ritta and Gautam Ahuja. 2002. “Something Old, Something New: A Longitudinal Study of Search Behavior and New Product Introduction,” Academy of Management Journal, 45(6): 1183-1194.
Levinthal, Daniel. 1991. “Random Walks and Organization Mortality.” Administrative Science Quarterly, 36: 397-420.
Liebeskind, Julia Porter. 2000. “Internal Capital Markets: Benefits, Costs, and Organizational Arrangements.” Organization Science, 11(1): 58-76.
Lubatkin M. and S. Chatterjee. 1994. “Extending Modern Portfolio Theory into the Domain of Corporate Strategy.” Academy of Management Journal, 37: 109-136.
March, James. 1991. “Exploration and Exploitation in Organizational Learning.” Organization Science, 2: 71-87.
Markides, CC. 1992. “Consequences of Corporate Refocusing - Ex Ante Evidence.” Academy of Management Journal, 35 (2): 398-412.
McEvily, Bill and Akbar Zaheer. 1999. “Bridging Ties: A Source of Firm Heterogeneity in Competitive Capabilities.” Strategic Management Journal, 20: 1133-1156.
Miner, A., T. Amburgey, and T. Stearns, 1990. “Interorganizational Linkages and Population Dynamics: Buffering and Transformational Shields.” Administrative Science Quarterly, 35: 689-713.
Mitchell, Will. 1989. "Whether and When? Probability and Timing of Incumbents' Entry into Emerging Industrial Subfields." Administrative Science Quarterly, 34, 208-230.

27
Mitchell, Will. 1991. Dual clocks: Entry order influences on industry incumbent and newcomer market share and survival when specialized assets retain their value. Strategic Management Journal, 12 (2): 85-100.
Mitchell, Will. 1994. “The Dynamics of Evolving Markets: The Effects of Business Sales and Age on Dissolutions and Divestitures.” Administrative Science Quarterly, 39(4): 575-602.
Mukherjee, Ashok, Will Mitchell, and F. Brian Talbot. 2000. “The Impact of New Manufacturing Requirements on Production Line Productivity and Quality at a Focused Factory.” Journal of Operations Management, 18(2): 139-168.
Nelson, Richard, and Sidney Winter. 1982. An Evolutionary Theory of Economic Change. Cambridge, MA: Harvard University Press.
Penrose, Edith. 1959. The Theory of the Growth of the Firm. New York: Wiley.
Pfeffer, Jeffrey, and Gerald Salancik. 1978. The External Control of Organizations: A Resource Dependence Perspective. New York: Harper & Row.
Ravenscraft, David J., and Frederic M. Scherer. 1987. Mergers, Sell-offs, and Economic Efficiency. Washington, DC: Brookings Institution.
Roberts, Peter. 1999. “Product Innovation, Product-Market Competition and Persistent Profitability in the U.S. Pharmaceutical Industry,” Strategic Management Journal, 20: 655-670.
Schary, Martha A. 1991. "The Probability of Exit." Rand Journal of Economics, 22: 339-353.
Scherer, F.M. and David Ross. 1990. Industrial Market Structure and Economic Performance, 3rd Edition. Boston, MA: Houghton Mifflin Company.
Silverman, Brian, Jackson Nickerson, and John Freeman. 1997. “Profitability, Transactional Alignment, and Organizational Mortality in the U.S. Trucking Industry.” Strategic Management Journal, 18(Summer Special Issue): 31-52.
Small Business Administration. 1983. The State of Small Business: A Report of the President. Washington, DC: U.S. Government Printing Office.
Star, A., and M. Massel. 1981. "Survival Rates For Retailers." Journal of Retailing, 57(2): 87-99.
Szymanski, David, Sundar Bharadwaji, and P. Rajan Varadarajan. 1993. “An Analysis of the Market Share-Profitability Relationship.” Journal of Marketing, 57: 1-18.
Teece, David. 1986. “Profiting from Technological Innovation: Implications for Integration, Collaboration, Licensing and Public Policy,” Research Policy, 15(6): 285-306.
Teece, David, Gary Pisano, and Amy Shuen. 1997. “Dynamic Capabilities and Strategic Management.” Strategic Management Journal, 18(7): 509-533.
Uzzi, Brian. 1996. “The Sources and Consequences of Embeddedness for the Economic Performance of Organizations.” American Sociological Review, 61: 674-698.
Von Hippel, Eric. 1988. The Sources of Innovation. Cambridge, MA: MIT Press.
Williamson, Oliver. 1975. Markets and Hierarchies: Analysis and Antitrust Implications. New York: The Free Press.
Winter, Sidney. 1987. “Knowledge and Competence as Strategic Assets,” in D.J. Teece (ed) The Competitive Challenge p. 159-184. Cambridge, MA: Ballinger.
28
Figure 1. Impact of Scale and Scope on Survival (coefficient > 1 = longer survival)
0.01
0.04 0.1
0.3
0.7 2 5
15 40
108
1
120
1
2
3
4
5
Su
rviv
al A
ccel
erat
or
Scale (Sales $ mln)
Scope (# lines)

29
Table 1: Survival Contributions of the Three Key Attributes of Scale and Scope
Financial Resources Organizational Routines External Ties
Scale Accumulation of firm-specific assets Efficiency gains from repeated use Buffer from external shocks
Scope Portfolio benefits
• Risk reduction
• Capital allocation efficiencies
Diverse routine sets
• Broader search opportunities
• Recombination opportunities
Variety of ties provides information access
Scale & Scope Financial effectiveness Recombination efficiencies Buffered and informed
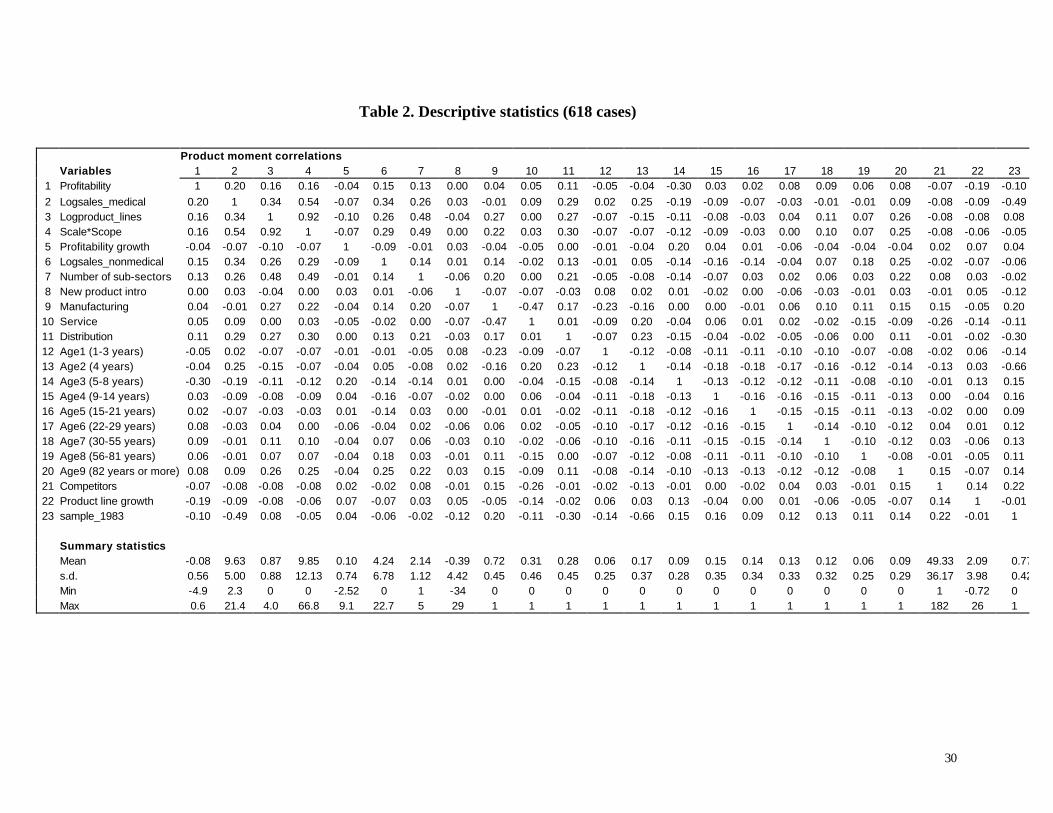
30
Table 2. Descriptive statistics (618 cases)
Product moment correlations Variables 1 2 3 4 5 6 7 8 9 10 11 12 13 14 15 16 17 18 19 20 21 22 23 1 Profitability 1 0.20 0.16 0.16 -0.04 0.15 0.13 0.00 0.04 0.05 0.11 -0.05 -0.04 -0.30 0.03 0.02 0.08 0.09 0.06 0.08 -0.07 -0.19 -0.10 2 Logsales_medical 0.20 1 0.34 0.54 -0.07 0.34 0.26 0.03 -0.01 0.09 0.29 0.02 0.25 -0.19 -0.09 -0.07 -0.03 -0.01 -0.01 0.09 -0.08 -0.09 -0.49 3 Logproduct_lines 0.16 0.34 1 0.92 -0.10 0.26 0.48 -0.04 0.27 0.00 0.27 -0.07 -0.15 -0.11 -0.08 -0.03 0.04 0.11 0.07 0.26 -0.08 -0.08 0.08 4 Scale*Scope 0.16 0.54 0.92 1 -0.07 0.29 0.49 0.00 0.22 0.03 0.30 -0.07 -0.07 -0.12 -0.09 -0.03 0.00 0.10 0.07 0.25 -0.08 -0.06 -0.05 5 Profitability growth -0.04 -0.07 -0.10 -0.07 1 -0.09 -0.01 0.03 -0.04 -0.05 0.00 -0.01 -0.04 0.20 0.04 0.01 -0.06 -0.04 -0.04 -0.04 0.02 0.07 0.04 6 Logsales_nonmedical 0.15 0.34 0.26 0.29 -0.09 1 0.14 0.01 0.14 -0.02 0.13 -0.01 0.05 -0.14 -0.16 -0.14 -0.04 0.07 0.18 0.25 -0.02 -0.07 -0.06 7 Number of sub-sectors 0.13 0.26 0.48 0.49 -0.01 0.14 1 -0.06 0.20 0.00 0.21 -0.05 -0.08 -0.14 -0.07 0.03 0.02 0.06 0.03 0.22 0.08 0.03 -0.02 8 New product intro 0.00 0.03 -0.04 0.00 0.03 0.01 -0.06 1 -0.07 -0.07 -0.03 0.08 0.02 0.01 -0.02 0.00 -0.06 -0.03 -0.01 0.03 -0.01 0.05 -0.12 9 Manufacturing 0.04 -0.01 0.27 0.22 -0.04 0.14 0.20 -0.07 1 -0.47 0.17 -0.23 -0.16 0.00 0.00 -0.01 0.06 0.10 0.11 0.15 0.15 -0.05 0.20 10 Service 0.05 0.09 0.00 0.03 -0.05 -0.02 0.00 -0.07 -0.47 1 0.01 -0.09 0.20 -0.04 0.06 0.01 0.02 -0.02 -0.15 -0.09 -0.26 -0.14 -0.11 11 Distribution 0.11 0.29 0.27 0.30 0.00 0.13 0.21 -0.03 0.17 0.01 1 -0.07 0.23 -0.15 -0.04 -0.02 -0.05 -0.06 0.00 0.11 -0.01 -0.02 -0.30 12 Age1 (1-3 years) -0.05 0.02 -0.07 -0.07 -0.01 -0.01 -0.05 0.08 -0.23 -0.09 -0.07 1 -0.12 -0.08 -0.11 -0.11 -0.10 -0.10 -0.07 -0.08 -0.02 0.06 -0.14 13 Age2 (4 years) -0.04 0.25 -0.15 -0.07 -0.04 0.05 -0.08 0.02 -0.16 0.20 0.23 -0.12 1 -0.14 -0.18 -0.18 -0.17 -0.16 -0.12 -0.14 -0.13 0.03 -0.66 14 Age3 (5-8 years) -0.30 -0.19 -0.11 -0.12 0.20 -0.14 -0.14 0.01 0.00 -0.04 -0.15 -0.08 -0.14 1 -0.13 -0.12 -0.12 -0.11 -0.08 -0.10 -0.01 0.13 0.15 15 Age4 (9-14 years) 0.03 -0.09 -0.08 -0.09 0.04 -0.16 -0.07 -0.02 0.00 0.06 -0.04 -0.11 -0.18 -0.13 1 -0.16 -0.16 -0.15 -0.11 -0.13 0.00 -0.04 0.16 16 Age5 (15-21 years) 0.02 -0.07 -0.03 -0.03 0.01 -0.14 0.03 0.00 -0.01 0.01 -0.02 -0.11 -0.18 -0.12 -0.16 1 -0.15 -0.15 -0.11 -0.13 -0.02 0.00 0.09 17 Age6 (22-29 years) 0.08 -0.03 0.04 0.00 -0.06 -0.04 0.02 -0.06 0.06 0.02 -0.05 -0.10 -0.17 -0.12 -0.16 -0.15 1 -0.14 -0.10 -0.12 0.04 0.01 0.12 18 Age7 (30-55 years) 0.09 -0.01 0.11 0.10 -0.04 0.07 0.06 -0.03 0.10 -0.02 -0.06 -0.10 -0.16 -0.11 -0.15 -0.15 -0.14 1 -0.10 -0.12 0.03 -0.06 0.13 19 Age8 (56-81 years) 0.06 -0.01 0.07 0.07 -0.04 0.18 0.03 -0.01 0.11 -0.15 0.00 -0.07 -0.12 -0.08 -0.11 -0.11 -0.10 -0.10 1 -0.08 -0.01 -0.05 0.11 20 Age9 (82 years or more) 0.08 0.09 0.26 0.25 -0.04 0.25 0.22 0.03 0.15 -0.09 0.11 -0.08 -0.14 -0.10 -0.13 -0.13 -0.12 -0.12 -0.08 1 0.15 -0.07 0.14 21 Competitors -0.07 -0.08 -0.08 -0.08 0.02 -0.02 0.08 -0.01 0.15 -0.26 -0.01 -0.02 -0.13 -0.01 0.00 -0.02 0.04 0.03 -0.01 0.15 1 0.14 0.22 22 Product line growth -0.19 -0.09 -0.08 -0.06 0.07 -0.07 0.03 0.05 -0.05 -0.14 -0.02 0.06 0.03 0.13 -0.04 0.00 0.01 -0.06 -0.05 -0.07 0.14 1 -0.01 23 sample_1983 -0.10 -0.49 0.08 -0.05 0.04 -0.06 -0.02 -0.12 0.20 -0.11 -0.30 -0.14 -0.66 0.15 0.16 0.09 0.12 0.13 0.11 0.14 0.22 -0.01 1 Summary statistics Mean -0.08 9.63 0.87 9.85 0.10 4.24 2.14 -0.39 0.72 0.31 0.28 0.06 0.17 0.09 0.15 0.14 0.13 0.12 0.06 0.09 49.33 2.09 0.77 s.d. 0.56 5.00 0.88 12.13 0.74 6.78 1.12 4.42 0.45 0.46 0.45 0.25 0.37 0.28 0.35 0.34 0.33 0.32 0.25 0.29 36.17 3.98 0.42 Min -4.9 2.3 0 0 -2.52 0 1 -34 0 0 0 0 0 0 0 0 0 0 0 0 1 -0.72 0 Max 0.6 21.4 4.0 66.8 9.1 22.7 5 29 1 1 1 1 1 1 1 1 1 1 1 1 182 26 1
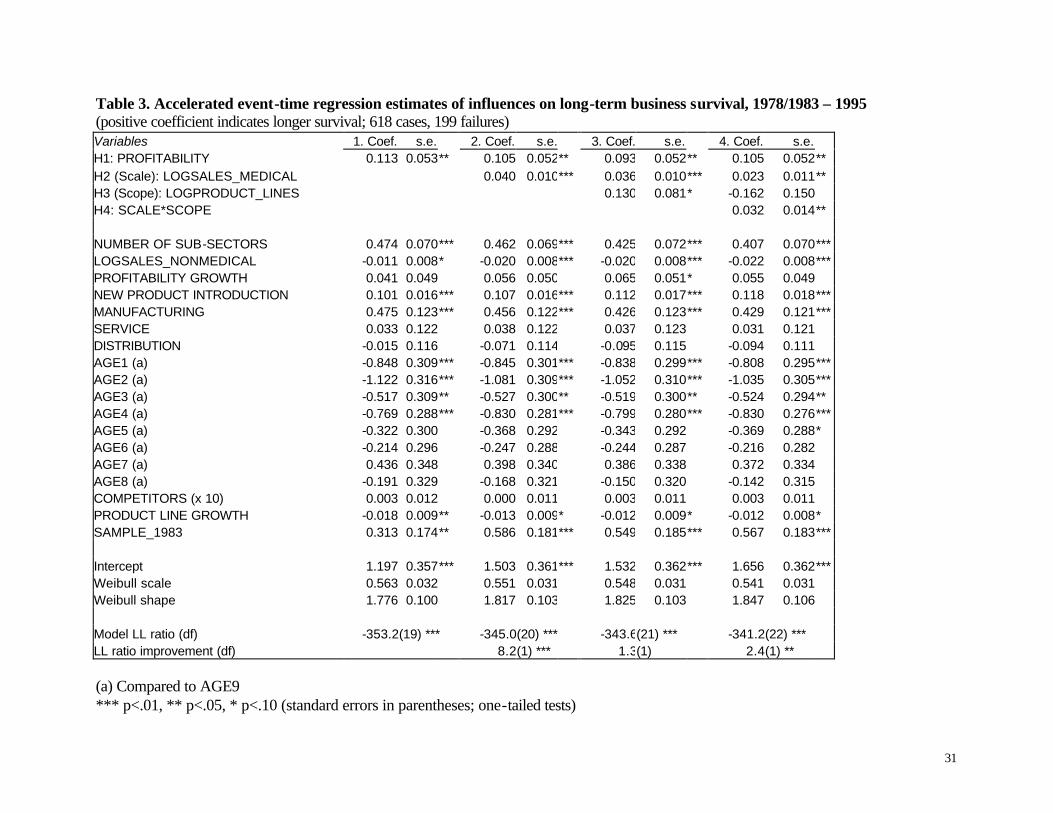
31
Table 3. Accelerated event-time regression estimates of influences on long-term business survival, 1978/1983 – 1995 (positive coefficient indicates longer survival; 618 cases, 199 failures) Variables 1. Coef. s.e. 2. Coef. s.e. 3. Coef. s.e. 4. Coef. s.e. H1: PROFITABILITY 0.113 0.053** 0.105 0.052** 0.093 0.052** 0.105 0.052** H2 (Scale): LOGSALES_MEDICAL 0.040 0.010*** 0.036 0.010*** 0.023 0.011** H3 (Scope): LOGPRODUCT_LINES 0.130 0.081* -0.162 0.150 H4: SCALE*SCOPE 0.032 0.014** NUMBER OF SUB-SECTORS 0.474 0.070*** 0.462 0.069*** 0.425 0.072*** 0.407 0.070*** LOGSALES_NONMEDICAL -0.011 0.008* -0.020 0.008*** -0.020 0.008*** -0.022 0.008*** PROFITABILITY GROWTH 0.041 0.049 0.056 0.050 0.065 0.051* 0.055 0.049 NEW PRODUCT INTRODUCTION 0.101 0.016*** 0.107 0.016*** 0.112 0.017*** 0.118 0.018*** MANUFACTURING 0.475 0.123*** 0.456 0.122*** 0.426 0.123*** 0.429 0.121*** SERVICE 0.033 0.122 0.038 0.122 0.037 0.123 0.031 0.121 DISTRIBUTION -0.015 0.116 -0.071 0.114 -0.095 0.115 -0.094 0.111 AGE1 (a) -0.848 0.309*** -0.845 0.301*** -0.838 0.299*** -0.808 0.295*** AGE2 (a) -1.122 0.316*** -1.081 0.309*** -1.052 0.310*** -1.035 0.305*** AGE3 (a) -0.517 0.309** -0.527 0.300** -0.519 0.300** -0.524 0.294** AGE4 (a) -0.769 0.288*** -0.830 0.281*** -0.799 0.280*** -0.830 0.276*** AGE5 (a) -0.322 0.300 -0.368 0.292 -0.343 0.292 -0.369 0.288* AGE6 (a) -0.214 0.296 -0.247 0.288 -0.244 0.287 -0.216 0.282 AGE7 (a) 0.436 0.348 0.398 0.340 0.386 0.338 0.372 0.334 AGE8 (a) -0.191 0.329 -0.168 0.321 -0.150 0.320 -0.142 0.315 COMPETITORS (x 10) 0.003 0.012 0.000 0.011 0.003 0.011 0.003 0.011 PRODUCT LINE GROWTH -0.018 0.009** -0.013 0.009* -0.012 0.009* -0.012 0.008* SAMPLE_1983 0.313 0.174** 0.586 0.181*** 0.549 0.185*** 0.567 0.183*** Intercept 1.197 0.357*** 1.503 0.361*** 1.532 0.362*** 1.656 0.362*** Weibull scale 0.563 0.032 0.551 0.031 0.548 0.031 0.541 0.031 Weibull shape 1.776 0.100 1.817 0.103 1.825 0.103 1.847 0.106 Model LL ratio (df) -353.2(19) *** -345.0(20) *** -343.6(21) *** -341.2(22) *** LL ratio improvement (df) 8.2(1) *** 1.3(1) 2.4(1) ** (a) Compared to AGE9 *** p<.01, ** p<.05, * p<.10 (standard errors in parentheses; one-tailed tests)