when is brand orientation a useful strategic posture?
TRANSCRIPT
This is a repository copy of When is brand orientation a useful strategic posture?.
White Rose Research Online URL for this paper:http://eprints.whiterose.ac.uk/99632/
Version: Accepted Version
Article:
Boso, N, Carter, PS and Annan, J (2016) When is brand orientation a useful strategic posture? Journal of Brand Management, 23 (4). pp. 363-382. ISSN 1350-231X
https://doi.org/10.1057/bm.2016.15
(c) Palgrave Macmillan, a division of Macmillan Publishers Ltd 2016. This is a post-peer-review, pre-copyedit version of an article published in the Journal of Brand Management. The definitive publisher-authenticated version 'Boso, N, Carter, PS and Annan, J (2016) When is brand orientation a useful strategic posture? Journal of Brand Management, 23 (4). pp. 363-382. ISSN 1350-231X. doi: 10.1057/bm.2016.15' is availableonline at: http://doi.org/10.1057/bm.2016.15
[email protected]://eprints.whiterose.ac.uk/
Reuse
Unless indicated otherwise, fulltext items are protected by copyright with all rights reserved. The copyright exception in section 29 of the Copyright, Designs and Patents Act 1988 allows the making of a single copy solely for the purpose of non-commercial research or private study within the limits of fair dealing. The publisher or other rights-holder may allow further reproduction and re-use of this version - refer to the White Rose Research Online record for this item. Where records identify the publisher as the copyright holder, users can verify any specific terms of use on the publisher’s website.
Takedown
If you consider content in White Rose Research Online to be in breach of UK law, please notify us by emailing [email protected] including the URL of the record and the reason for the withdrawal request.
1
WHEN IS BRAND ORIENTATION A USEFUL STRATEGIC POSTURE? ABSTRACT
This study examines the extent to which the effect of brand orientation on sales performance is contingent
upon levels of transformational leadership and inter-functional collaboration. Using primary data from
108 subsidiaries of multinational enterprises (MNEs) operating in the Commonwealth Caribbean region,
the study finds that brand orientation is not directly related to sales performance. However, findings show
that brand orientation is positively related to sales performance when levels of both transformational
leadership and inter-functional collaboration are high. Theoretical implications of these findings are
discussed while drawing lessons for MNE subsidiary brand management practice.
KEYWORDS: Brand Orientation; Transformational Leadership; Inter-Functional Collaboration; MNE Subsidiary; Commonwealth Caribbean Region Outlet: Journal of Brand Management
2
INTRODUCTION
Recent decades have witnessed increased academic and practitioner interests in the notion of brand
orientation and its performance consequences (e.g., Baumgarth, Merrilees, & Urde, 2013; Schmidt &
Baumgarth, 2014; Spyropoulou, Skarmeas, & Katsikeas, 2011; Urde, Baumgarth, & Merrilees, 2013). It
is argued that increasing global market competition has made brand orientation a useful strategic posture
for ensuring firm growth and profitability (Gromark & Melin, 2011; Rugman & Verbeke, 2001).
Accordingly, the development of powerful brands and a continuous monitoring of brand equity has
become an important top management issue (Hirvonen, Laukkanen, & Reijonen, 2013; Rao, Agarwal, &
Dahlhoff, 2004). To this end, firms are continuously urged to adopt strong brand orientation as a strategic
posture (Schmitt, 2012; Simoes & Dibb, 2001). The assumption behind this line of research is that brand-
oriented firms benefit from greater efficiency as they standardize market offerings across multiple
markets (Keller & Lehmann, 2006). In the particular case of multinational enterprises (MNEs), a
branding advantage stem from a greater capacity to generate increased cash flows from loyal customers
worldwide (Rao et al., 2004). Thus, the literature suggests that superior brand orientation is a major driver
of financial health (e.g. Fastoso & Whitelock, 2007).
While researchers have examined the brand orientation–financial performance relationship at
length (e.g., Baumgarth, 2010; Hankinson, 2012; Urde, 1999; Urde et al., 2013), knowledge is lacking
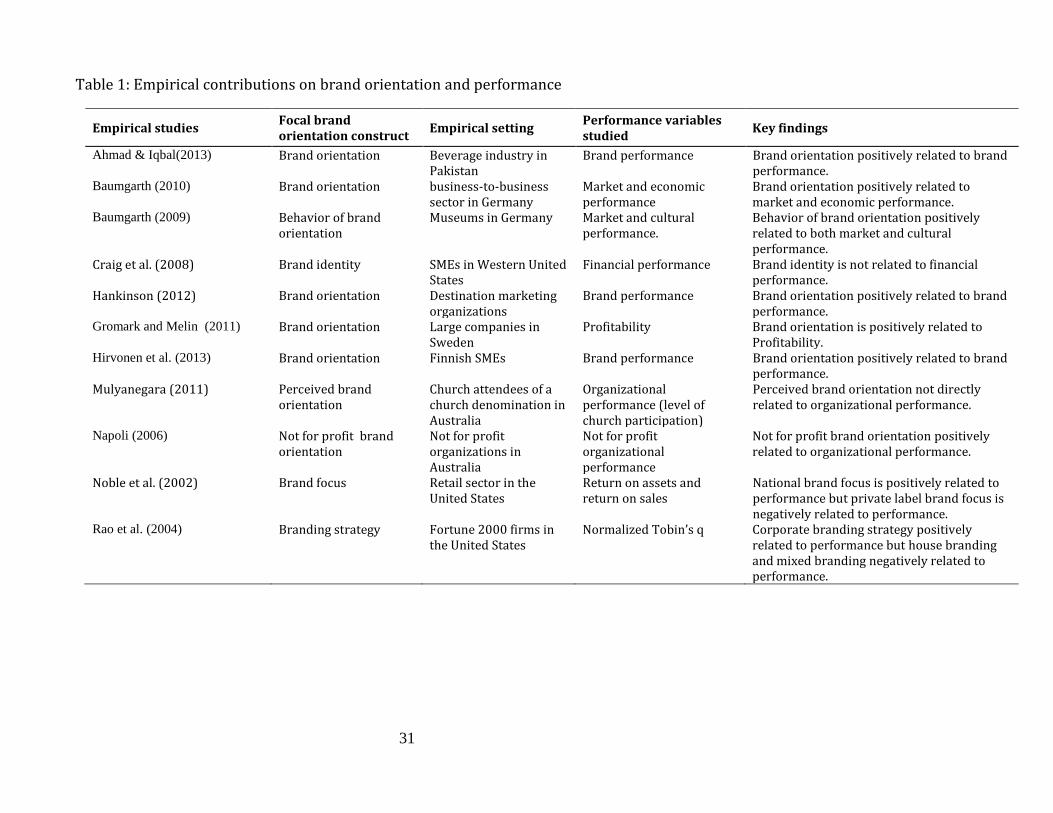
on the boundary conditions of the relationship. As Table 1 shows, previous studies have reported mixed
findings: positive (e.g., Ahmad and Iqbal, 2013; Baumgarth, 2009), negative (e.g., Noble, Sinha, &
Kumar, 2002), and non-significant effects (e.g., Craig, Dibrell, & Davis, 2008), suggesting that we
currently lack knowledge on the conditions under which brand orientation impacts performance. This
study argues that the equivocal findings on the brand orientation–performance relationship can be
addressed if firm-specific contingencies are modelled. Although Hirvonen et al. (2013) are unable to find
3
empirical support for moderating roles of firm-specific contingency factors (e.g., branding know-how),
no study has sought to further analyze internal firm-specific boundary conditions of the relationship.
This study draws insights from resource-based view (Barney, 1991), organizational leadership,
and structure research to shed new light on the boundary conditions of the brand orientation–performance
relationship. Our research shows that the performance outcomes of brand orientation may be contingent
upon a firm’s top management leadership style and intra-firm structural contingencies (Keller &
Lehmann, 2006). Although in taking such a position we run counter to the traditional structure-conduct-
performance paradigm of industrial organization economics, we think that by focusing more on firms’
internal leadership and structural processes, we can extend the extant brand orientation literature in two
important ways.
First, we contend that brand orientation, like any strategic posture, is a firm-specific resource that
offers a potential value (Day, 1994), but only to the extent that its performance outcomes may be
dependent upon a number of complementary firm resources and capabilities (Baumgarth, 2010). Drawing
lessons from the organizational leadership literature, we maintain that a firm’s top management team
plays a vital role in shaping a firm’s overall strategic posture, including its brand orientation (Hankinson,
2012). The strategic postures adopted by the top echelon of a firm can be seen as a firm-specific
complementary resource that may facilitate the effectiveness of a firm’s brand orientation. Effective
leadership is the ability to manage change, establish direction, motivate subordinates, and reconfigure
firm resources to achieve overall firm goals, and while we can think about several leadership styles (e.g.,
autocratic, charismatic), we reason that a transformational leadership style is particularly suited to
achieve successful firm-wide brand orientation. Thus, we see transformational leadership as a
complementary resource that may provide the capability for firms to build an abstract branding culture
that subsequently facilitates effectiveness of brand orientation.

4
Second, the literature on inter-group cooperation (e.g., Baer, Vadera, Leenders, & Oldham, 2013)
and inter-functional interaction (e.g. Menon, Jaworski, & Kohli, 1997), supports the idea that the impact
of brand orientation on performance may depend on levels of inter-functional collaboration. While
different functional units within a firm are expected to work together to achieve shared visions and goals,
dysfunctional conflict and competition between functional units has been found to be prevalent (Baer et
al., 2013), and this dysfunctionality is noted to undermine effectiveness of firm strategy (Pfeffer & Sutton,
2000). Accordingly, this study extends the brand orientation literature by examining how inter-functional
collaboration conditions the effectiveness of brand orientation efforts.
In summary, this study proposes a conceptual model to examine the notion that the effect of brand
orientation on sales performance is dependent upon levels of transformational leadership and inter-
functional collaboration. The model is then empirically tested within the context of MNE subsidiary
firms operating in the Commonwealth Caribbean region.
_____________ Table 1 here _____________
THEORETICAL BACKGROUND
Brand orientation has been defined as “an inside-out, identity-driven approach that sees brands as a hub
for an organization and its strategy” (Urde et al., 2013, p. 1). This definition is based on an assertion that
“brand orientation is an approach in which the processes of the organization revolve around the creation,
development, and protection of brand identity in an ongoing interaction with target customers with the
aim of achieving lasting competitive advantages in the form of brands” (Urde, 1999, p. 113). As a guiding
principle that shapes a firm’s strategic direction and activities, brand orientation, therefore, provides a
platform to lend significance to brands over and above the importance of satisfying customer needs and
wants to improve firm performance (Ahmad & Iqbal, 2013).

5
For MNEs and their overseas subsidiaries, arguments have been made that adopting a strong
brand orientation is a useful strategic posture to succeed in host markets (Rao et al., 2004). Within the
strategic management literature, it is widely accepted that the treatment of an MNE subsidiary as a
relevant unit of analysis is valid as subsidiaries are distinct from their parent companies in terms of their
ability to take initiatives to improve their performance (Birkinshaw, 1997; Birkinshaw & Hood, 1998).
Within this context, the way an MNE subsidiary’s brand orientation affects its sales performance is of
particular interest to MNE subsidiary managers. The assumption behind this line of research has been
that the financial benefits of brand orientation are predicated on the development of successful brands
through a re-orientation of the entire organization around the brand’s core values and identity (Hankinson,
2012; Urde et al., 2013). Thus, brand orientation emphasizes the strategic significance of branding
activities, and is therefore seen as a resource that may shape a firm’s strategic direction (Urde et al.,
2013). As an inside-out strategic posture, brand orientation enables a firm to develop and sustain a shared
value with core stakeholders (i.e., customers and employees) to generate superior performance (Napoli,
2006; Reijonen, Laukkanen, Komppula, & Tuominen, 2012). Given that brand orientation encapsulates
a firm’s long-term strategic goal, it helps define and cement relationships within the firm (Napoli, 2006;
Urde, 1994; Urde et al., 2013).
In reaction to this potential financial benefit of brand orientation, studies have focused on
discovering and explaining how firms can develop their brand orientation levels (e.g., Baumgarth, 2010;
Ewing & Napoli, 2005; Hankinson, 2001; Napoli, 2006; Mulyanegara, 2011; Schmidt & Baumgarth,
2014; Simoes & Dibb, 2001; Urde, 1994; Wong & Merrilees, 2005). Empirical studies examining how
brand orientation impacts performance have primarily been descriptive (e.g., Baumgarth, 2009; Keller,
Dato-on, & Shaw, 2010) and directed at understanding linear associations (e.g., Gromark & Melin, 2011).
Yet, evidence suggests inconsistent empirical findings: There are studies that have reported positive
effect, negative effect, and no relationship between brand orientation and performance, suggesting that

6
brand managers do not currently have solid evidence with respect to whether it is useful to be brand
oriented (see Table 1).
Despite these inconsistencies in empirical findings, the extant literature portrays the benefits of
brand orientation to be uniform along a spectrum of brand orientation levels, such that brand orientation
is being depicted in the literature as beneficial for business success at all times and under all conditions.
An exception is Hirvonen et al.’s (2013) study of Finnish small- and medium-sized enterprises that found
that while external environment variables moderate the relationship, there is no evidence that the
relationship is moderated by internal firm-specific variables (e.g., branding know-how). Thus, while
some studies have attempted to explain the association of brand orientation and performance, the
importance of boundary conditions of the brand orientation–firm performance relationship remains
under-recognized and under-studied.
Additionally, given the importance of branding for the success of MNE subsidiaries, and in view
of the fast-growing and wealthy middle class consumer segments, scholars now accept the notion that
emerging markets have become an attractive target for global brands to improve their sales performance
(Schmitt, 2012). Evidence suggests that foreign subsidiaries of MNEs represent important proprietary
assets as they leverage their technological, manufacturing, and marketing-related know-how across
multiple geographical locations (Rugman & Verbeke, 2001). Given that foreign subsidiaries provide
capabilities required to efficiently coordinate and control an MNE’s asset base (Rugman, 1981), it
becomes important to understand how a subsidiary’s brand orientation influences its performance and
the boundary conditions of such a relationship. To date, only a few studies have looked at the
performance impact of brand orientation within the context of MNE subsidiaries in emerging markets
(e.g., Wang et al., 2012). In this study, we fill this knowledge gap by proposing a conceptual model
(Figure 1) and by empirically investigating the extent to which brand orientation impacts sales
performance under differing levels of transformational leadership and inter-functional collaboration.
7
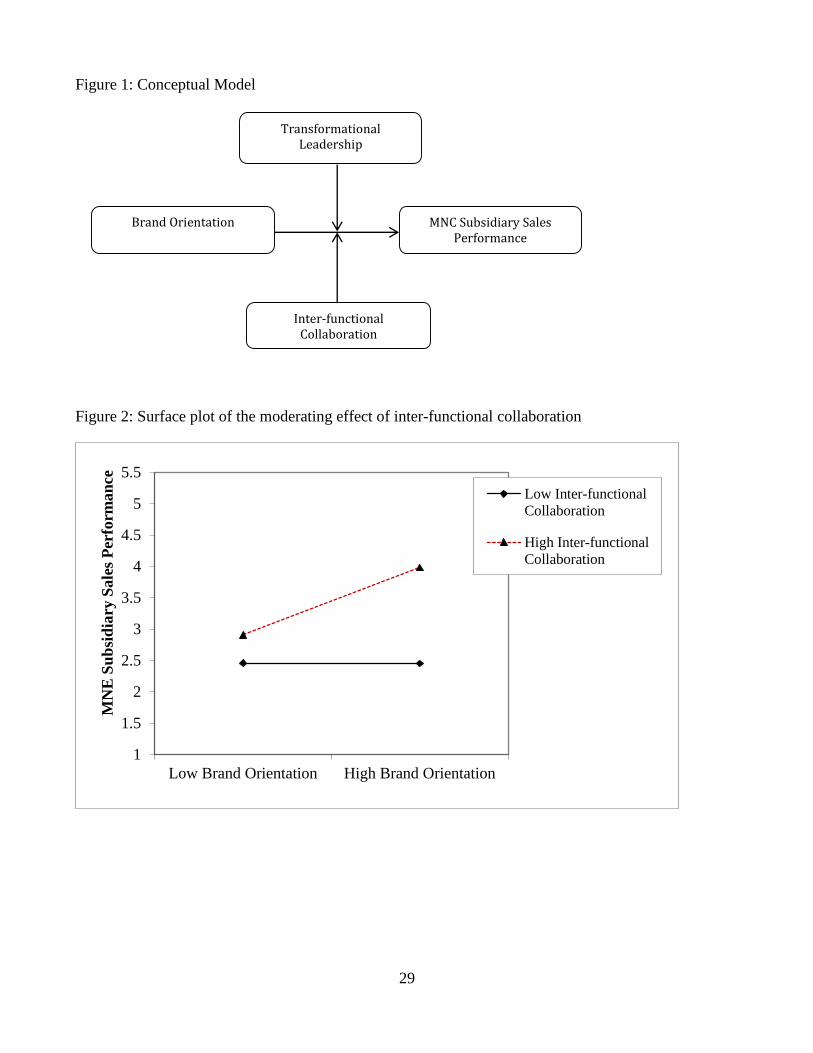
____________ Figure 1 here ____________
HYPOTHESIS DEVELOPMENT
Brand Orientation and Sales Performance
A firm’s overall performance can be measured by the achievement of market performance goals
and financial performance goals (Merrilees, Rundle-Thiele, & Lye, 2011; Morgan, Katsikeas, & Vorhies,
2012). Market performance goals are based on the outcomes of branding and marketing-related activities:
e.g., customer satisfaction, customer loyalty, and market share improvement. Financial performance
goals are based on the efficiency results of the actions of all functional units: sales, finance, human
resources, and the like. With turnover and profit being classic measures, Baumgarth (2010) argues that
brand orientation is most likely to have a positive association with market performance. Similarly,
Gromark and Melin (2011) suggest that favorable brand orientation can lead to superior performance,
conceptualized as the attainment of superior brand equity.
Napoli (2006) concluded that because of the apparent positive association between brand
orientation and market related performance, firms that direct their managerial practices towards the
development, acquisition, and leveraging of branded products and services are likely to experience
superior performance outcomes. Napoli’s argument is based on the notion that brand orientation is a
resource that provides firms with the capability to differentiate their market offerings from those of their
competitors. Drawing on the resource-based view of the firm (Barney, 1991), we extend Napoli’s logic
and other recent literature on branding (e.g., Merrilees et al., 2011; Urde, 2013) by conceptualizing brand
orientation as an organizational resource that provides a firm the capability to give meaning to its
products and services. For MNE subsidiaries in particular, a strong brand orientation may help give
coordinated guidance and support to the processes of launching new products and services abroad. Strong
brands allow ownership of products and services that benefit subsidiary firms by adding credibility and

8
legitimacy, enhancing visibility, and supporting communication efforts. Brand equity is strengthened as
subsidiaries’ products/services succeed. Successful products/services help to reinforce and broaden
brand meaning, revitalize brands, act as an effective safeguard against private labels, and improve brand
value. It follows that brand-oriented MNE subsidiaries are better able to improve their performance than
their less brand-oriented counterparts (Ewing & Napoli, 2005; Van Wijk, Jansen, & Lyles, 2008).
Brand orientation can be a particularly useful strategy for boosting performance in uncertain
(unpredictable and dynamic) environments (Miller, 1988; Hirvonen et al., 2013). For example, in
dynamic market environments in which demand constantly changes, and where opportunities are more
plentiful, firms are more likely to earn higher sales when they have an orientation for building and
sustaining strong brands that draw the attention of brand-conscious consumers (Wang et al., 2012), most
notably boosting sales among wealthy and middle-income consumers (Wang et al., 2004). Strong brands
are more resistant to competitor actions and piracy, and therefore contribute more to a firm’s bottom line
(Napoli, 2006). Committing to a strong brand orientation becomes a strategic platform for enhancing a
firm’s capability to compete overseas (Wong & Merrilees, 2005). Thus, companies with a strong brand
orientation are expected to be more successful relative to less brand-oriented firms. Accordingly, we
offer hypothesis H1:
H1: High levels of brand orientation are positively related to high levels of sales performance
Brand Orientation, Transformational Leadership, and Sales Performance
The extent to which brand orientation enhances the sales performance of an MNE subsidiary may
depend on the degree to which the subsidiary’s top management team demonstrates transformational
leadership. While a strong brand orientation may help a firm give meaning to existing and new products
and services in target markets, a top management team that demonstrates strong transformational
leadership may help further enhance performance outcomes. We base this proposition on the
organizational citizenship literature that has credited transformational leaders with an ability to persuade

9
organizational members (or employees) to sacrifice their personal interests for the sake of a collective
organizational goal (Flynn & Staw, 2004). Beugre, Acar, and Braun (2006) suggest that transformational
leadership effectiveness is predicated on a leader’s ability to unite followers, change followers’ goals and
beliefs, motivate followers to share the leader’s compelling vision, and perform beyond expectations
(Jung & Sosik, 2006; Limsila & Ogunlana, 2008; Ogbonna & Harris, 2000; Vallejo, 2009).
Transformational leadership behaviors may increase the possibility of brand orientation driving
sales because such a leadership style motivates organizational members to take on a brand-oriented
approach to decision-making activities (Napoli, 2006). Transformational leadership styles serve to rally
organizational members around a shared brand vision to gain commitment and support for branding
activities. Employees are more likely to idealize their transformational leaders as such leaders represent
what employees may aspire to become. This leader–follower bond may generate a strong fondness and
commitment that goes beyond transactional compliance (Javidan & Waldman, 2003), thus organizational
members may be more willing to change their attitudes, values, and behaviors to be consistent with the
leader’s expectations. Employees likely will be more receptive to the idea of brand orientation if they are
convinced that their transformational leader is supportive of their branding activities (Conger, Kanungo,
& Menon, 2000). The kind of commitment, dedication, and advocacy required to ensure that an MNE
subsidiary’s branding activities are successful is facilitated when transformational leader style is
increasingly demonstrated by the top management team.
Conger et al. (2000) found that when high group task efficacy is required to ensure positive
performance results, the presence of a transformational leadership can be particularly helpful in
motivating organizational members to act in a desired manner. Task efficacy allows leaders to set higher
performance targets for personnel and increase acceptance rates. Given that transformational leaders are
more capable of motivating organizational members to persevere in their tasks despite difficult
organizational and environmental obstacles (Conger et al,), firms with such leaders should be expected

10
to outperform competitors; their capacity to hold the firm together in challenging environments shows
that firms with well-known transformational leaders at the top management team tend to ensure higher
stockholder confidence (e.g., Flynn & Staw, 2004). For example, Flynn and Staw (2004) found that
investors are more willing to pay higher stock prices to firms that have a reputable transformational leader
in charge. In this regard, the hypothesis can be proposed that a firm’s brand orientation activities are
more likely to be successful if they are championed by a transformational leader in the top management
team.
H2: The effect of brand orientation on sales performance is greater as levels of transformational
leadership style behaviors increase.
Brand Orientation, Inter-functional Collaboration and Sales Performance
Firms can apply task efficacy requirements to help employees feel proud of belonging to a high
performing group, leading to increased staff satisfaction and motivation (Conger et al., 2000), making
them effective brand ambassadors who can help ensure brand success. Successful brand management
requires an alignment of brand vision with stakeholders’ supportive behaviors. As internal stakeholders,
employees’ identification with the brand for the sake of the firm as not merely their subunits can increase
employees’ proclivity to contribute to brand vision (Walumbwa, Wang, Lawler, & Shi, 2004). Where is
a high level of collaboration across functional units within MNC subsidiaries there are likely to be a
fruitful, even emotional, feelings towards the value that a firm’s brand represent. Employees’ sense of
engagement, enthusiasm, and acceptance will increase when there is a firm-wide gravitation towards
cohesive decision making. Greater group consciousness is likely to be high when everyone believes that
inter-functional collaboration is a firm-wide accepted practice, which helps facilitate the benefits that
firms derive from their brand orientation (Vallejo, 2009).
Inter-functional collaboration may affect performance given the integration of resources and
capabilities that it brings to bear (Ellinger, Keller, & Ellinger, 2000). Sharing ideas, resources and
11
activities; creating a mutual understanding of interdepartmental responsibilities; informally working
together; and jointly accomplishing corporate goals are inter-functional behaviors that can positively
affect performance. Interdepartmental integration permits knowledge transfers across functional units
enabling functional heads to leverage their strengths, which support smooth running of the firm and
efficient implementation of a brand oriented philosophy (Van Wijk et al., 2008; Massey & Dawes, 2007).
In order for brand orientation to be engrained in the heart of all organizational members inter-functional
collaboration is critical; such interactions facilitate the responsiveness that is necessary for a brand
orientation to be effective (Van Wijk et al., 2008; Stank, Daugherty, & Ellinger, 1999).
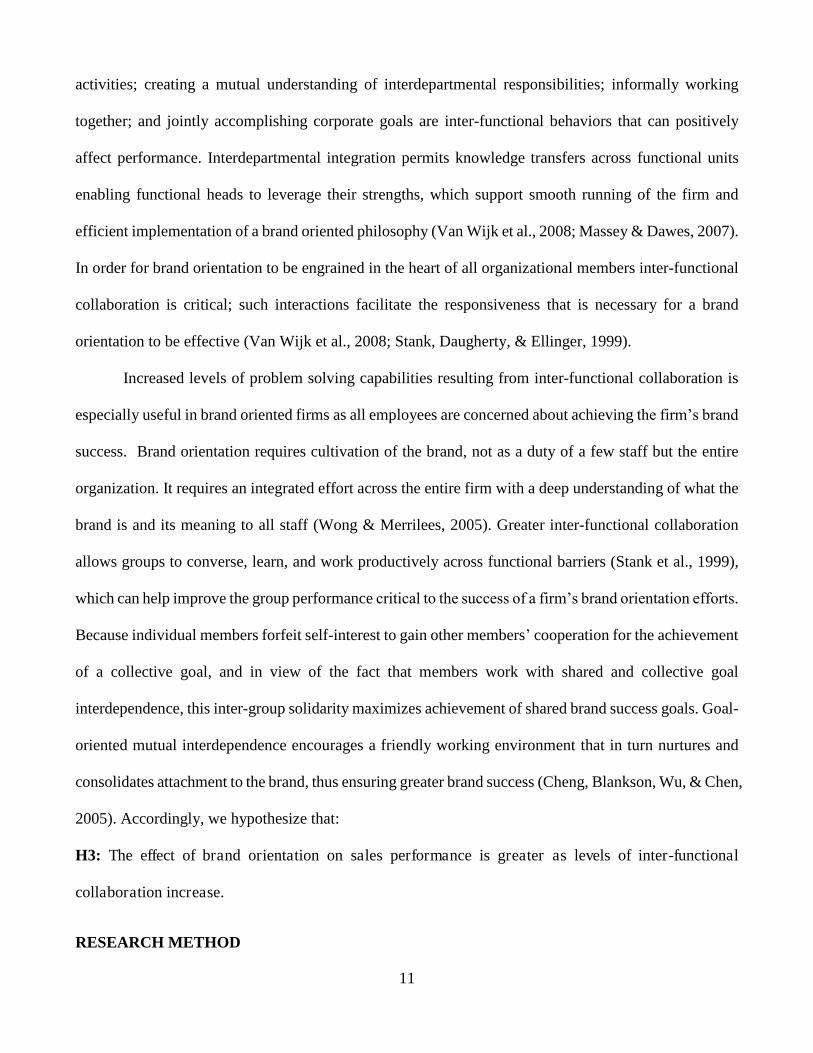
Increased levels of problem solving capabilities resulting from inter-functional collaboration is
especially useful in brand oriented firms as all employees are concerned about achieving the firm’s brand
success. Brand orientation requires cultivation of the brand, not as a duty of a few staff but the entire
organization. It requires an integrated effort across the entire firm with a deep understanding of what the
brand is and its meaning to all staff (Wong & Merrilees, 2005). Greater inter-functional collaboration
allows groups to converse, learn, and work productively across functional barriers (Stank et al., 1999),
which can help improve the group performance critical to the success of a firm’s brand orientation efforts.
Because individual members forfeit self-interest to gain other members’ cooperation for the achievement
of a collective goal, and in view of the fact that members work with shared and collective goal
interdependence, this inter-group solidarity maximizes achievement of shared brand success goals. Goal-
oriented mutual interdependence encourages a friendly working environment that in turn nurtures and
consolidates attachment to the brand, thus ensuring greater brand success (Cheng, Blankson, Wu, & Chen,
2005). Accordingly, we hypothesize that:
H3: The effect of brand orientation on sales performance is greater as levels of inter-functional
collaboration increase.
RESEARCH METHOD

12
Research Setting and Data Collection
The conceptual model developed in this study is a universal theory that can be applied in any
market economy. However, to empirically test our model we focused on MNE subsidiaries in the
Commonwealth Caribbean region for several reasons. First, this region has been a market for Western
multinationals for several decades, such that the region has virtually all Western MNE subsidiaries
operating there. Second, while the Commonwealth Caribbean economy is a small open market economy,
the region has one of the highest per-capita incomes in the world (Central Bank of Barbados, 2010;
Central Intelligence Agency, 2012). Barbados and Bahamas, for example, are widely known as being the
Caribbean region’s wealthiest economies with offshore finance and tourism being key sources of
economic growth. In particular, Barbados has consistently been ranked 37th of the freest economies in
the world and 4th in the South and Central American/ Caribbean region. These strong foundations of
economic freedom, a high degree of transparency, and an efficient judiciary have positioned the region
for attracting MNEs (The Heritage Foundation, 2012). Thus, in view of the potential competition among
MNE subsidiaries in the region, it would be insightful to learn how the MNE subsidiaries’ brand
orientations influence their sales performance.
Adhering to acceptable practice (e.g., Bird & Beechler, 1995; Qu, 2007), we tested our conceptual
model on a sample of MNE subsidiary firms operating across the Commonwealth Caribbean region (i.e.,
Antigua and Barbuda, Bahamas, Barbados, Dominica, Grenada, Jamaica, Saint Kitts and Nevis, Saint
Lucia, Saint Vincent and the Grenadines, and Trinidad and Tobago). The sampling frame was developed
from the respective countries’ Chambers of Commerce and Industry. These Chambers are the top private
sector organizations in the Commonwealth Caribbean region and are responsible for supporting and
encouraging the interests of the business community in the region (Commonwealth of Nations, 2012).
The firms selected for this study met three requirements: (1) they had been operating in the region for a
minimum of five years, (2) the employed a minimum of 100 full-time staff, and (3) they had sales in
13
excess of USD$1 million. Given these parameters, a sampling frame of 550 MNC subsidiaries was
developed.
Literature indicates that senior managers are the most knowledgeable individuals within
companies and have the capability to provide accurate information on companies’ strategic decision-
making (MacKenzie & Podsakoff, 2012). Accordingly, senior managers (e.g., the country
director/coordinator, managing director, marketing director, vice president, chief executive officer, or
president) of the 550 subsidiaries were asked to respond to a questionnaire containing the variables of
interest to this study. We used electronic surveys (i.e., online and email) to administer a structured
questionnaire to the managers. After three rounds of reminders, 108 valid responses were received,
representing a response rate of 20%.
Sample distribution by country was as follows: Antigua and Barbuda = 5, Bahamas = 9, Barbados
= 45, Dominica = 2, Grenada =3, Jamaica =14, Saint Kitts and Nevis = 12, Saint Lucia = 2, Saint Vincent
and the Grenadines = 6, and Trinidad and Tobago = 10. Barbados tends to have a greater proportion of
MNE subsidiaries, which is indicative of that country’s economic dominance in the region. MNE
subsidiaries in the sample were medium- to large-sized firms employing an average of 773 full-time staff
with the largest firm employing 2,500 employees. The subsidiaries had been in operation for a total of
approximately 111 years with the youngest subsidiary being 14 years old. The average sales turnover
was approximately US$3.4 million, the largest posting annual sales of US$36 million. The firms spent
an average of US$1.9 million on research and development activities (with a minimum of US$5,000 and
maximum of US$15 million). While 89% of the firms operated in the services industry (predominantly
financial, tourism, energy, and healthcare sectors), 9% operated in the manufacturing sector (e.g.,
computer equipment), and 2% concentrated their operations in the mineral extraction sector.
In a follow-up study twelve months after the original study, and following the same sampling
procedure, the finance managers or chief accountants in the 108 subsidiary firms that participated in the
14
first study were asked for information about their financial performance data. The follow-up study
yielded a reasonably high response rate of 60% (i.e., 65 valid responses). We assessed non-response bias
to determine whether there was any difference between early and late responses to our surveys
(Armstrong & Overton, 1977). To identify late and early responses, date and time stickers were placed
on each questionnaire upon receipt from respondents. Subsequently, a t-test of difference was performed
on the early and late responses regarding mangers’ perceptions of brand orientation. Findings revealed
that were no significant differences between early and late responding firms at the .05 level of
significance with t-values ranging between .629 and .892. This shows that non-response bias is unlikely
to influence the results of the study.
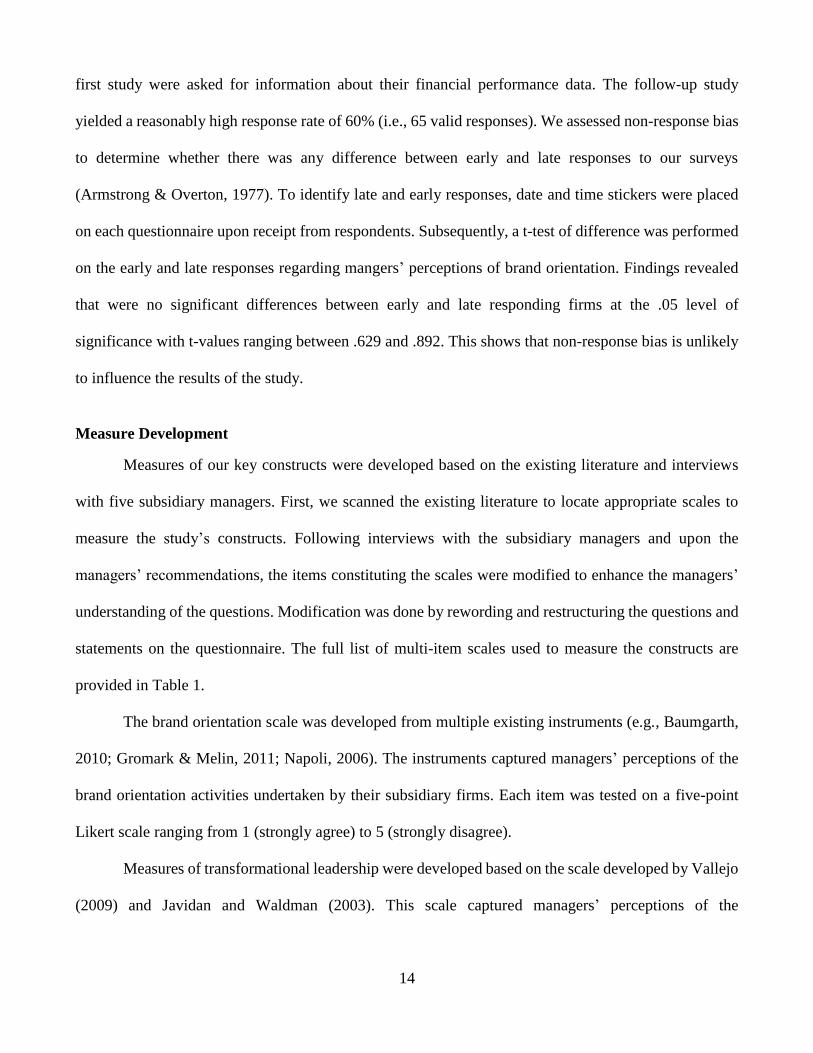
Measure Development
Measures of our key constructs were developed based on the existing literature and interviews
with five subsidiary managers. First, we scanned the existing literature to locate appropriate scales to
measure the study’s constructs. Following interviews with the subsidiary managers and upon the
managers’ recommendations, the items constituting the scales were modified to enhance the managers’
understanding of the questions. Modification was done by rewording and restructuring the questions and
statements on the questionnaire. The full list of multi-item scales used to measure the constructs are
provided in Table 1.
The brand orientation scale was developed from multiple existing instruments (e.g., Baumgarth,
2010; Gromark & Melin, 2011; Napoli, 2006). The instruments captured managers’ perceptions of the
brand orientation activities undertaken by their subsidiary firms. Each item was tested on a five-point
Likert scale ranging from 1 (strongly agree) to 5 (strongly disagree).
Measures of transformational leadership were developed based on the scale developed by Vallejo
(2009) and Javidan and Waldman (2003). This scale captured managers’ perceptions of the
15
transformational leadership exhibited in the subsidiaries’ top management teams. The seven items were
measured on a five-point Likert scale ranging from 1(very low) to 5 (very high).
Measures of inter-functional collaboration were developed from Menon et al.’s (1997)
interdepartmental connectedness scale to capture managers’ perceptions of the level of collaboration that
existed across functional units within the subsidiary firms. The items were measured on a five-point
Likert scale ranging from 1 (strongly agree) to 5 (strongly disagree).
The performance measure used focused on the sales performance of the MNE subsidiaries: sales
growth, market share, and sales volume, all measured on a five-point scale (1 = below average; 5 = above
average), relative to the industry (Menguc & Auh, 2008). Non-finance senior managers (e.g., country
directors) provided this information in the first survey study. In our second survey study, we validated
this sales performance data from the non-finance senior managers by asking the finance managers of the
108 firms to provide information on the firms’ sales performance. This follow-up data from the finance
managers was correlated with the data from the non-finance managers, and a strong correlation was
obtained (r = .85; p < .001), indicating that the sales performance data from the two sources was similar.
Consequently, in further analyses we relied on the original sales performance data provided by the non-
finance senior managers of the 108 firms.
In addition to the key study constructs, we included several control variables to minimize
potential confounds. In particular, in drawing lessons from previous studies (e.g., Rugman & Verbeke,
2001) we also controlled for MNE subsidiaries’ sizes, annual R&D expenses, experience, and industry
type as well as the managers’ perceptions of environmental turbulence in the Commonwealth Caribbean
region. Firm size was measured by the natural logarithm of the total number of full-time staff, whereas
industry type was dummy coded in (services = 0; and manufacturing = 1).

16
Reliability and Validity Assessment of Measures
To assess the validity and reliability of the study’s measures, all scales were examined using
exploratory factor analysis (EFA) and confirmatory factor analysis (CFA). The initial factor analysis
identified which items loaded on a variable to explain 79% variance, and this was followed by additional
purification of the scale items in CFA. From the CFA, five factor solutions emerged reflecting the five
multi-items scales analyzed. Table 2 provides detailed information about the study’s key constructs and
their respective item loadings and reliability scores. Convergent validity of scales was established as all
items loaded significantly on their theorized constructs without any indication of cross loading and
correlated errors. All scales have coefficient alphas greater than .70 and construct reliability above .60,
indicating acceptable levels of reliability and convergent validity (Grewal, Cote, & Baumgartner 2004;
Ping, 2004).
_____________ Table 2 here _____________
Discriminant Validity was assessed to ensure that each construct was unique and portrayed a
distinct phenomenon (Fornell & Larcker, 1981). Discriminant validity was demonstrated as none of the
95% confidence intervals of the elements of the latent factor correlation matrix had a value of 1.00. Inter-
construct correlation was computed and revealed correlation among constructs was not significantly
above .70 (Grewal et al., 2004; Ping, 2004). The largest inter-construct correlation was the correlation
between brand orientation and leadership (r = .52), which is within the recommended threshold.
Furthermore, in comparing the average variance extracted (AVE) of each construct to the highest shared
variance (squared correlation) between pair of constructs, it can be seen that the AVE values are all
greater than the shared variances (see Table 3), demonstrating discriminant validity of our constructs.
_____________ Table 3 here _____________

17
STRUCTURAL MODEL SPECIFICATION AND FINDINGS
To test our hypotheses, averages were taken across the multi-items constructs to generate composite
scores for brand orientation (BO), transformational leadership (LEA), inter-functional collaboration
(COL), sales performance, and environment turbulence. The composite scores were subsequently used
to test the structural relationships in a moderated hierarchical regression analysis using ordinary least
square estimation method. While there are several statistical approaches for calculating interaction terms
(e.g. Marsh et al., 2007; Ping, 1995), Marsh et al. recommend that the focus should be on ensuring greater
“parsimony…and robustness in relation to violation of assumptions (e.g., normality)” (p. 578).
Accordingly, we followed the traditional product-term approach (Ping, 1995) to compute two interaction
(or moderator) terms. To capture the interaction terms, we multiplied brand orientation by
transformational leadership (BO x LEA) and brand orientation by inter-functional collaboration (BO x
COL). The three variables used to calculate the interaction terms were mean-centered to reduce
multicollinearity problems (Aiken & West, 1991; Cohen & Cohen, 1983). This mean-centering approach
helped ensure that our variance inflation factors (VIFs) were substantially below the recommended cutoff
range of 5.00.
Subsequently, three nested regression models were estimated. In Model 1, we regressed the
control variables on sales performance: MNE subsidiary size, total annual R&D expenses, environmental
turbulence, firm experience, and industry type. In Model 2, we estimated the control variables together
with the direct effects of brand orientation, transformational leadership and inter-functional collaboration.
We then estimated Model 3 by adding the two interaction effect variables (i.e. BO x LEA, and BO x
COL) to Model 2. We then estimated Model 4 in which we tested for a potential three way interaction
between brand orientation, transformational leadership and inter-functional collaboration (i.e. BO x LEA
x COL).

18
Findings show that brand orientation, leadership and collaboration explained 55% of the variation
in sales performance. However, when the interaction terms were added to the model, we explained an
additional 2% variation in sales performance (∆R2= 0.024, p< .05). Thus, we show that the interaction
between brand orientation and transformational leadership, and brand orientation and inter-functional
collaboration have significantly impacted on MNE subsidiaries’ sales performance. Summary of results
are reported in Table 4. Results of the study’s analysis indicate that transformational leadership (く = .363;
t = 3.366; p< .01) and inter-functional collaboration (く = .243; t = 3.923; p< .01) are both directly related
to sales performance. A bivariate correlation analysis also indicated a positive relationship between inter-
functional collaboration and brand orientation (r = .510; p< .01) and between transformational leadership
and brand orientation (r = .211; p< .01). However, these correlations are not too high to raise any
discriminant validity concern.
Regarding the specific hypotheses tested, the study argues in H1 that the relationship between
brand orientation and sales performance is positive. We failed to find support for H1 because the direct
effect of brand orientation on sales performance is non-significant (く = .032; t = .252; p> .05). Thus,
brand orientation is not directly associated with sales performance. The study argues in H2 that the effect
of brand orientation on MNE subsidiary sales performance is more positive when levels of
transformational leadership are greater. Results suggest that transformational leadership does not
significantly moderate the relationship between brand orientation and MNE subsidiary sales performance,
although the direction of the effect has become negative (く = -.024; t = -.325; p> .05), thus rejecting H2.
Evidence as provided by the data indicates that the regression coefficient for the interaction between
brand orientation and inter-functional collaboration is positive and significant at the 5% level (く =.183; t
= 2.740; p<.01). This means that at high levels of inter-functional collaboration, the non-significant
positive association between brand orientation and sales performance becomes significant and more
19
positive. However, at low levels of inter-functional collaboration the relationship is less significant and
less positive (see Figure 2), providing support for H3.
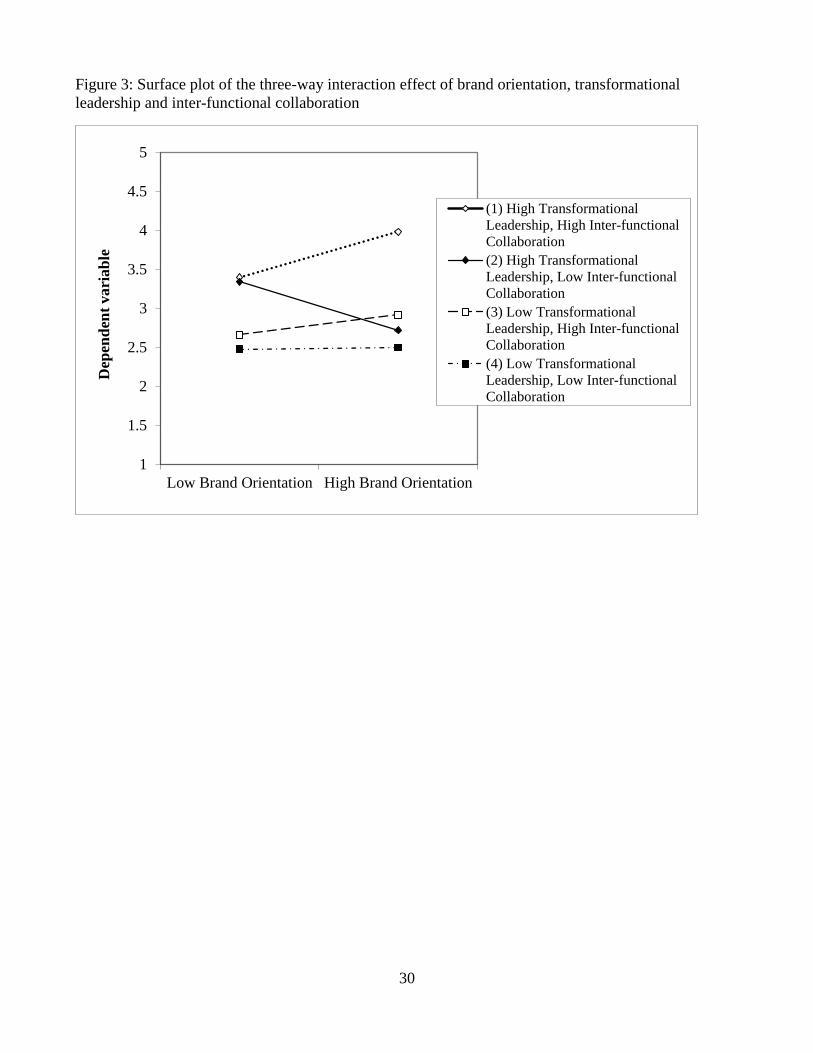
To further probe the non-significant interaction term involving transformational leadership, we
estimated a three-way interaction between brand orientation, transformational leadership and inter-
functional collaboration in Model 4. The Model 4 explained an additional 1% variation in sales
performance, suggesting that a significant impact of the three-way interaction term. We find that the
regression coefficient for the three-way interaction between brand orientation, transformational
leadership and inter-functional collaboration is positively associated with sales performance (く = .126; t
= 2.446; p< .01), which is rather interesting. This suggests that the relationship between brand orientation
and sales performance moves from being non-significant to become significant and positive when levels
of transformational leadership and inter-functional collaboration are both high (figure 3). We discuss the
theoretical and managerial implications of these findings in the sections that follow next.
_________________________ Table 4 here _________________________ _________________________ Figure 2, Figure 3 here _________________________
DISCUSSION AND IMPLICATIONS
The purpose of this study was to examine the extent to which brand orientation influences sales
performance under differing levels of transformational leadership and inter-functional collaboration. The
study’s conceptual model was tested on a primary data obtained from a sample of 108 MNE subsidiaries
operating in the Commonwealth Caribbean region. Findings reveal that brand orientation is not directly
associated with sales performance in MNE subsidiaries operating in the Commonwealth Caribbean
region. However, results show that under high levels of both transformational leadership and inter-
functional collaboration, brand orientation is positively related to sales performance.

20
Theoretical Implications
Unlike past research that has argued that brand orientation is positively associated with firm performance
(e.g., Baumgarth, 2010; Ewing & Napoli, 2005; Gromark & Melin, 2011; Napoli, 2006), findings from
this study suggest that brand orientation on its own is not directly associated with sales performance. One
way to explain this surprising result is that brand orientation, like any other strategic orientation,
constitutes costs to firms as it can be expensive to build brands. The logic backing this assertion is that
expenses on marketing communication efforts (e.g., advertising, brand sponsorship, and sales promotion)
aiming to make a brand visible and entrenched in the minds of consumers can be very high. Additionally,
when firms are outwardly brand oriented and push the value of a brand to appeal to external customers,
if a similar effort is not exerted to promote a brand and its vision to internal customers (i.e., employees),
any sales benefits generated by the brand orientation efforts is cancelled out by employees lack of
commitment to the brand’s value (Baxter, Kerr, & Clarke, 2013). The values that a brand represents are
best communicated by internal customers (i.e., employees) who are often in direct contact with external
customers. Additionally, as a strategic resource (Urde et al., 2013; Wallace, Buil, & de Chernatony, 2013),
brand orientation offers a potential value, and its actual value creation may depend on a variety of firm-
specific complementary resources and capabilities (Lepak, Smith, & Taylor, 2007; Day, 1994). As
findings from this study suggest, brand orientation’s effect on sales performance is accentuated when
firms align it to their leadership and structure-related activities. These important findings enable this
study to extend the brand orientation literature in two ways.
First, this study provides empirical support for the notion that brand orientation impacts MNE
subsidiary sales performance when levels of inter-functional collaboration are high. This finding extends
Baumgarth’s (2010) view that the brand orientation relationship to economic performance depends upon
organizational structural contingencies. Baumgarth proposes a corporate culture model predicated on the
idea that corporate leaders can help instill a “living the brand” culture across all functional units within

21
an organization. In extending Baumgarth’s framework, this study shows that greater inter-functional
collaboration enhances the effect of brand orientation on sales performance. We argue that brand
orientation is a long-term strategic posture and as such its sales value is facilitated when employees share
the brands’ long-term vision, rallying around a common brand-related identity and purpose (Rao et al.,
2004) and live the brand (Baumgarth, 2010). Importantly, given that the sales benefit of brand orientation
is predicated on customers’ identification with the brand, firms need less departmentalization of customer
face-to-face activities and greater structural fluidity to perpetuate a common firm-wide identity around
the brand. Thus, morale boosting, a sense of togetherness, and coordination of knowledge and
intelligence benefits cross functional collaboration and helps facilitate the sales generating values of
branding activities.
Second, this study finds that transformational leadership alone does not significantly moderate
the effect of brand orientation on sales performance. While one may explain this non-significant
relationship to mean that transformational leaders only appeal to employees’ emotional instincts as a
rallying force, and lacking a tendency to use punishment and rewards to encourage employees to rally
around a common goal, an alternative leadership style (such as autocratic leadership) therefore may be
more effective in enforcing brand-oriented goals to generate sales. Although this alternative line of
reasoning is interesting, especially when positioned within the context of the Caribbean society where
business culture tends to exhibit characteristics of the former colonial management style that was
predicated on a top-down authoritative approach to the leader-follower relationship, an additional
analysis of our data reveals that the brand orientation-sales performance relationship is strengthened
when levels of both transformational leadership and inter-functional collaboration are high (see Figure
3). It is important to note that this high-order three-way interaction effect model is superior to the lower-
order two-way interaction effect models such that any finding associated with the higher-order three-way
interaction negates the lower-order findings (Aiken and West, 1991; Ping, 2004). With this in mind, we

22
contend therefore that the brand orientation–sales performance relationship is more complex than
previously thought.
Based on our finding from the three-way interaction effect model, we suggest that the sales
success outcome of brand orientation is a function of high levels of transformational leadership and inter-
functional collaboration as these two organizational forces are required to translate a firm’s branding
philosophy into sales. The complementary roles of transformational leadership style and inter-functional
collaboration in facilitating the effectiveness of brand orientation extend Baumgarth’s (2010) corporate
culture model that advocates for a corporate culture that promotes the idea of all employees “living the
brand” in driving brand effectiveness. Thus, in order to enhance sales benefits, MNE subsidiaries in the
Caribbean region must look for an alignment involving high levels of brand orientation, transformational
leadership styles, and inter-functional collaboration activities.
Lessons for MNE Subsidiary Brand Managers
This study’s implications for MNE subsidiary managers need explicating. First, the finding that
inter-functional collaboration implies that managers can be certain that when employees throughout the
organization and across different functional units are focused on a common brand agenda, that subsidiary
can expect to extract greater sales benefits from its branding activities. Second, and a more interesting
finding from this study, is that under conditions of high levels of brand orientation, transformational
leadership, and inter-functional collaboration there is a corresponding increase in sales performance for
MNE subsidiary firms.
A key message for subsidiary brand managers is that there is a need to foster a stronger brand
oriented philosophy in their firms, but for this philosophy to help boost sales it has to be accompanied
by a high degree of collaboration between functional units and pushed by a strong transformational leader.
23
LIMITATIONS AND FUTURE RESEARCH DIRECTION
It is important to highlight that although the findings of this study extend knowledge on the
relationship between brand orientation and sales performance, some limitations that affect the study must
be taken into consideration. First, the sampling process in this study was limited to nations within the
Commonwealth Caribbean region. Consequently, the ability to generalize our findings to other emerging
markets is limited. To help improve the external validity of our finding, we suggest that our study be
replicated in other contexts, particularly the BRIC countries (Brazil, Russia, India, and China) and the
MINT (Mexico, Indonesia, Nigeria, and Turkey) countries whose economies are larger and who share
similar cultural and economic characteristics with the Caribbean. Beyond the emerging market contexts,
we propose replication of our study in developed markets such as the United States and Europe, and if
possible a comparative study involving emerging and developed market samples.
We propose that research should be carried out to determine the effect of other styles of leadership
(e.g., autocratic leadership and charismatic styles) and structural contingencies (e.g., organizational
complexity) on the brand orientation–sales performance relationship. Additionally, it can be argued that
brand orientation, like any strategic orientation, may have a curvilinear relationship with performance
(Cadogan, 2012; Tang, Tang, Marino, Zhang, & Li., 2008). While we searched but did not find evidence
of a curvilinear association in our data, we suggest that future research should explore these possibilities
to broaden our perspective on the benefits and costs associated with brand orientation.
This study focused on explaining variations in subsidiary sales performance, but the relationships
between parent MNEs and their subsidiaries remain a debatable subject. Future research may examine
how parent MNE strategic brand orientation influences subsidiary brand orientation and sales
performance. While such a study would require samples from MNE headquarters and subsidiaries in a
dyadic research design, it would extend our understanding of brand orientation activities in MNEs.

24
REFERENCES
Ahmad, N., & Iqbal, N. (2013). The impact of market orientation and brand orientation on strengthening brand performance: An insight from the beverage industry of Pakistan. International Review of Management and Business Research, 2, 128-132.
Aiken, L. S. & S. G. West. (1991). Multiple regression: Testing and interpreting interactions. Sage: Newbury Park CA.
Armstrong, J. S., & Overton, T. S. (1977). Estimating nonresponse bias in mail surveys. Journal of Marketing Research, 14, 396-402.
Baer, M., Vadera, A. K., Leenders, R. T., & Oldham, G. R. (2013). Intergroup competition as a double-edged sword: How sex composition regulates the effects of competition on group creativity. Organization Science, 1-17.
Barney, J. (1991). Firm resources and sustained competitive advantage. Journal of management, 17(1), 99-120.
Baumgarth, C. (2009). Brand orientation of museums: Model and empirical results. International Journal of Arts Management, 11, 30-45.
Baumgarth, C. (2010). Living the brand: Brand orientation in the business-to-business Sector. European Journal of Marketing, 44(5), 653-671.
Baumgarth, C., Merrilees, B., & Urde, M. (2013). Brand orientation: Past, present, and future. Journal of Marketing Management, 29(9-10), 973-980.
Baxter, J., Kerr, G., & Clarke, R. J. (2013). Brand orientation and the voices from within. Journal of Marketing Management, 29(9-10), 1079-1098.
Beugre, C. D., Acar, W. & W. Braun. (2006). Transformational leadership in organizations: An Environment-induced Model. International Journal of Manpower, 27(1), 52-62.
Bird, A., & Beechler, S. (1995). Links between business strategy and human resource management strategy in US-based Japanese subsidiaries: An empirical investigation. Journal of International Business Studies, 26, 23-46.
Birkinshaw, J. M. (1997). Entrepreneurship in multinational corporations: The characteristics of subsidiary initiatives. Strategic Management Journal, 18(3), 207-229.
Birkinshaw, J. M, & Hood, N. (1998). Multinational subsidiary evolution: Capability and charter change in foreign-owned subsidiary companies. Academy of Management Review, 23(4), 773-795.
Cadogan, J. W. (2012). International marketing, strategic orientations and business success: Reflections on the path ahead. International Marketing Review, 29(4), 340-348.
Central Bank of Barbados (2010). Central Bank of Barbados. Available at http://www.centralbank.org.bb/index.htm
25
Central Intelligence Agency (2012). The World Factbook – Barbados. Available at https://www.cia.gov/library/publications/the-world-factbook/geos/bb.html
Cheng, J. M.-S., Blankson, C., Wu, P. C. S. and Chen, S. S. (2005). A stage model of international brand development: the perspectives of manufacturers from two newly industrialized economies – South Korea and Taiwan. Industrial Marketing Management, 34, 504-514.
Cohen, J. & Cohen, P. (1983). Applied multiple regression/correlation analysis for the behavioural sciences. Erlbaum, Hillsdale, NJ.
Common Wealth of Nations. (2012). Common Wealth Network Barbados. Available at http://www.commonwealth-of nations.org/Barbados/Business
Conger, J. A., Kanungo, R. N. & Menon, S. T. (2000). Charismatic leadership and follower effects. Journal of Organizational Behavior, 21(7), 747-767.
Craig, J. B., Dibrell, C., & Davis, P. S. (2008). Leveraging family-based brand identity to enhance firm competitiveness and performance in family businesses. Journal of Small Business Management, 46(3), 351-371.
Day, G. S. (1994). The capabilities of market-driven organizations. Journal of Marketing, 58(4), 37-52.
Ellinger, A., Keller, S., & Ellinger, A. (2000). Developing interdepartmental integration: An evaluation of three strategic approaches for performance improvement. Performance Improvement Quarterly, 13(3), 41-59.
Ewing, M. T., & Napoli, J. (2005). Developing and validating a multidimensional nonprofit brand orientation scale. Journal of Business Research, 58(6), 841-853.
Fastoso, F., & Whitelock, J. (2007). International advertising strategy: The standardisation question in manager studies: Patterns in four decades of past research and directions for future knowledge advancement. International Marketing Review, 24(5), 591-605.
Flynn, F. J. &. Staw, B. M. (2004). Lend me your wallets: The effect of charismatic leadership on external support for an organisation. Strategic Management Journal, 25(4), 309-330.
Fornell, C. & Larcker, D. F. (1981). Structural equation models with unobservable variables and measurement error: Algebra and statistics. Journal of Marketing Research, 18(3), 362-368.
Grewal, R., Cote, J. A., & Baumgartner, H. (2004). Multicollinearity and measurement error in structural equation models: Implications for theory testing. Marketing Science, 23(4), 519-529.
Gromark, J. & Melin, F. (2011). The underlying dimensions of brand orientation and its impact on financial performance. Journal of Brand Management, 18(6), 394-410.
Hankinson, G. (2012). The measurement of brand orientation, its performance impact, and the role of leadership in the context of destination branding: An exploratory study. Journal of Marketing Management, 28(7-8), 974-999.
Hankinson, P. (2001). Brand orientation in the charity sector: A framework for discussion and research. International Journal of Nonprofit and Voluntary Sector Marketing, 6(3), 231-242.

26
Harris, L. C., Ogbonna, E. & Goode, M. M. H. (2006). Intra-functional conflict: An investigation of antecedent factors in marketing functions. European Journal of Marketing, 43(3/4), 453-476.
Hirvonen, S., Laukkanen, T., & Reijonen, H. (2013). The brand orientation-performance relationship: An examination of moderation effects. Journal of Brand Management, 20(8), 623-641.
Javidan, M., & Waldman, D. A. (2003). Exploring charismatic leadership in the public sector: measurement and consequence. Public Administration Review, 63(2), 229-242.
Jung, D. D., & Sosik, J. J. (2006). Who are the spellbinders? Identifying personal attributes of charismatic leaders. Journal of Leadership & Organizational Studies, 12(4), 12-26.
Keller, E. W., Dato-on, M. C., & Shaw, D. (2010). NPO branding: Preliminary lessons from major players. International Journal of Nonprofit and Voluntary Sector Marketing, 15, 105-121.
Keller, K. L., & Lehmann, D. R. (2006). Brands and branding: Research findings and future priorities. Marketing Science, 25(6), 740-759.
Lepak, D. P., Smith, K. G., & Taylor, M. S. (2007). Value creation and value capture: a multilevel perspective. Academy of Management Review, 32(1), 180-194.
Limsila, K., & Ogunlana, S. O. (2008). Performance and leadership outcome correlates of leadership style and subordinate commitment. Engineering Construction and Architectural Management, 15(2), 164-184.
MacKenzie, S. B., & Podsakoff, P. M. (2012). Common method bias in marketing: Causes, mechanisms, and procedural remedies. Journal of Retailing, 88(4), 542-555.
Marsh, H. W., Wen, Z., Hau, K. T., Little, T. D., Bovaird, J. A., & Widaman, K. F. (2007). Unconstrained structural equation models of latent interactions: Contrasting residual- and mean-centered approaches. Structural Equation Modeling: A Multidisciplinary Journal, 14(4), 570-580.
Massey, G. R., & Dawes, P. L. (2007). The antecedents and consequences of functional and dysfunctional conflict between marketing managers and sales managers. Industrial Marketing Management, 36(8), 1118-1129.
Menguc, B., & Auh, S. (2008). The asymmetric moderating role of market orientation on the ambidexterity-firm performance relationship for prospects and defenders. Industrial Marketing Management, 37, 455-470.
Menon, A., Jaworski, B. J., & Kohli, A. K. (1997). Product quality: Impact of interdepartmental interactions. Academy of Marketing Science Journal, 25(3), 187-198.
Merrilees, B., Rundle-Thiele, S., & Lye, A. (2011). Marketing capabilities: Antecedents and implications for B2B SME performance. Industrial Marketing Management, 40(3), 368-375.
Miller, D. (1988). Relating Porter’s business strategies to environment and structure: Analysis and performance implications. The Academy of Management Journal, 31(2), 280-308.

27
Morgan, N. A., Katsikeas, C. S., & Vorhies, D. W. (2012). Export marketing strategy implementation, export marketing capabilities, and export venture performance. Journal of the Academy of Marketing Science, 40(2), 271-289.
Mulyanegara, R. C. (2011). The role of brand orientation in church participation: An empirical examination. Journal of Nonprofit and Public Sector Marketing, 23, 226-247.
Napoli, J. (2006). The impact of nonprofit brand orientation on organisational performance. Journal of Marketing Management, 22, 673-694.
Noble, C. H., Sinha, R. K., & Kumar, A. (2002). Market orientation and alternative strategic orientations: A longitudinal assessment of performance implications. Journal of Marketing, 66(4), 25-39.
Ogbonna, E., & Harris, L. (2000). Leadership style, organisational culture and performance: Empirical evidence from UK companies. The International Journal of Human Resource Management. 11(4), 766-788.
Pfeffer J., & Sutton R. I. (2000). The knowing–doing gap: How smart companies turn knowledge into action, Harvard Business School Press, Boston.
Ping, R. A. (2004). On assuring valid measures for theoretical methods using survey data. Journal of Business Research, 57, 125-141.
Ping, R. A., Jr. (1995). A parsimonious estimation technique for interaction and quadratic latent variables. Journal of Marketing Research, 32(August), 336-347.
Qu, R. (2007). The role of market orientation in the business success of MNCs' UK subsidiaries. Management Decision, 45(7), 1181-1192.
Rao, V. R., Agarwal, M. K., & Dahlhoff, D. (2004). How is manifest branding strategy related to the intangible value of a corporation? Journal of Marketing, 68(4),126-141.
Reijonen, H., Laukkanen, T., Komppula, R., & Tuominen, S. (2012). Are growing SMEs more market-oriented and brand-oriented? Journal of Small Business Management, 50(4), 699-716.
Rugman, A. M., & Verbeke, A. (2001). Subsidiary-specific advantages in multinational enterprises. Strategic Management Journal, 22(3), 237-250.
Rugman, A. M. (1981). Inside the multinationals: The economics of internal markets. Columbia University Press: New York.
Schmidt, H., & Baumgarth, C. (2014). Introducing a conceptual model of brand orientation within the context of social entrepreneurial businesses. International Journal of Strategic Innovative Marketing, 1(1), 37-50.
Schmitt, B. (2012). The consumer psychology of brands. Journal of Consumer Psychology, 22, 7-17.
Simoes, C., & Dibb, S. (2001). Rethinking the brand concept: New brand orientation. Corporate Communications, 6(4), 217-224.
Spyropoulou, S., Skarmeas, D., & Katsikeas, C. S. (2011). An examination of branding advantage in export ventures. European Journal of Marketing, 45(6), 910-935.
28
Stank, T. P., Daugherty, P. J. & Ellinger, A. E. (1999). Marketing/logistic integration and firm performance. International Journal of Logistic Management, 10(1), 11-24.
Tang, J., Tang, Z., Marino, L. D., Zhang, Y., & Li, Q. (2008). Exploring an inverted U-shape relationship between entrepreneurial orientation and performance in Chinese ventures. Entrepreneurship Theory and Practice, 32(1), 219-239.
The Heritage Foundation (2012). Barbados. Available at http://www.heritage.org/index/country/barbados
Urde, M. (1994). Brand orientation: A strategy for survival. Journal of Consumer Marketing, 11(3), 18-32.
Urde M. (1999). Brand orientation: A mindset for building brand into strategic resources. Journal of Marketing Management, 15(1-3), 117-133.
Urde, M., Baumgarth, C., & Merrilees, B. (2013). Brand orientation and market orientation: From alternatives to synergy. Journal of Business Research, 66(1), 13-20.
Vallejo, M. C. (2009). Analytical model of leadership in family firms under transformational approach. Family Business Review, 22(2), 136-150.
Van Wijk, R., Jansen, J. J., & Lyles, M. A. (2008). InterǦand intraǦorganizational knowledge transfer: A metaǦanalytic review and assessment of its antecedents and consequences. Journal of Management Studies, 45(4), 830-853.
Wallace, E., Buil, I., & de Chernatony, L. (2013). Brand orientation and brand values in retail banking. Journal of Marketing Management, 29(9-10), 1007-1029.
Walumbwa, F. O., Wang, P., Lawler, J. J., & Shi, K. (2004). The role of collective efficacy in the relations between transformational leadership and work outcomes. Journal of Occupational and Organizational Psychology, 77(4), 515-530.
Wang, C. L., Li, D., Barnes, B., &Anh, J. (2012). Country image, product image and consumer purchase intention: Evidence from an Emerging economy. International Business Review, 21(6), 1041-1051.
Wong, H. Y., & Merrilees, B. (2005). A brand orientation typology for SMEs: A case research approach. Journal of Product & Brand Management, 14(3), 155-162.
Wong, H. Y., & Merrilees, B. (2008). The performance benefits of being brand-orientated. Journal of Product & Brand Management, 17(6), 372-383.
29
Figure 1: Conceptual Model
Figure 2: Surface plot of the moderating effect of inter-functional collaboration
Inter-functional
Collaboration
MNC Subsidiary Sales
Performance
Brand Orientation
Transformational
Leadership
1
1.5
2
2.5
3
3.5
4
4.5
5
5.5
Low Brand Orientation High Brand Orientation
MN
E S
ubsi
diar
y Sa
les
Per
form
ance
Low Inter-functionalCollaboration
High Inter-functionalCollaboration
30
Figure 3: Surface plot of the three-way interaction effect of brand orientation, transformational leadership and inter-functional collaboration
1
1.5
2
2.5
3
3.5
4
4.5
5
Low Brand Orientation High Brand Orientation
Dep
ende
nt v
aria
ble
(1) High TransformationalLeadership, High Inter-functionalCollaboration(2) High TransformationalLeadership, Low Inter-functionalCollaboration(3) Low TransformationalLeadership, High Inter-functionalCollaboration(4) Low TransformationalLeadership, Low Inter-functionalCollaboration
31
Table 1: Empirical contributions on brand orientation and performance
Empirical studies Focal brand
orientation construct Empirical setting
Performance variables
studied Key findings
Ahmad & Iqbal(2013) Brand orientation Beverage industry in
Pakistan
Brand performance Brand orientation positively related to brand
performance. Baumgarth (2010) Brand orientation business-to-business
sector in Germany
Market and economic
performance
Brand orientation positively related to
market and economic performance. Baumgarth (2009) Behavior of brand
orientation
Museums in Germany Market and cultural
performance.
Behavior of brand orientation positively
related to both market and cultural
performance.
Craig et al. (2008) Brand identity SMEs in Western United
States
Financial performance Brand identity is not related to financial
performance.
Hankinson (2012) Brand orientation Destination marketing
organizations
Brand performance Brand orientation positively related to brand
performance. Gromark and Melin (2011) Brand orientation Large companies in
Sweden
Profitability Brand orientation is positively related to
Profitability. Hirvonen et al. (2013) Brand orientation Finnish SMEs Brand performance Brand orientation positively related to brand
performance.
Mulyanegara (2011) Perceived brand
orientation
Church attendees of a
church denomination in
Australia
Organizational
performance (level of
church participation)
Perceived brand orientation not directly
related to organizational performance.
Napoli (2006) Not for profit brand
orientation
Not for profit
organizations in
Australia
Not for profit
organizational
performance
Not for profit brand orientation positively
related to organizational performance.
Noble et al. (2002) Brand focus Retail sector in the
United States
Return on assets and
return on sales
National brand focus is positively related to
performance but private label brand focus is
negatively related to performance. Rao et al. (2004) Branding strategy Fortune 2000 firms in
the United States
Normalized Tobin╆s q Corporate branding strategy positively
related to performance but house branding
and mixed branding negatively related to
performance.

32
Table 2: Descriptive Statistics, details of measures, standardized factor loadings and reliability tests
Item Description
Standardized factor Loadings
Brand Orientation (g= .95; CR = .94) Branding is important to our strategy .92
Branding flows through all our marketing activities .94
The brand is an important asset for us .90 We are very brand oriented as we feel inspired by our brands .88
Environment turbulence (g= .82; CR = .83) In our business environment: : competitors are constantly trying out new competitive strategies
.77
In our business environment: customer needs and demands are changing rapidly
.85
In our business environment: firms are rapidly innovating .89 Transformational leadership (g= .94; CR = .93) I believe that it is my job to transmit a clear and positive vision of the future of the company
.83
I believe that it is my job to promote trust, involvement and corporation among staff members
.93
I believe that it is my job to encourage staff to think of new methods of resolving problems
.93
I believe that it is my job to lead by example .87 Inter-functional collaboration(g= .91; CR = .90) In this company, it is easy to talk with virtually anyone you need to regardless of rank or position
.85
In this company employees from different departments feel comfortable calling each other when the need arise
.93
People around here are quite accessible to those in other departments .88 Sales performance (g= .91; CR = .92) Sales Growth .86 Market Share .80 Sales Volume .92
CR = Composite Reliability; g = Cronbach’s Alpha
Table 3: Descriptive statistics, inter-construct correlation and discriminant Validity tests Mean Standard Deviation 1 2 3 4 5 Sales performance 3.69 1.49 .71 Brand orientation 2.10 1.24 .27** .72 Transformational leadership 1.96 1.38 .28** .21** .77 Inter-functional cohesion 3.28 1.09 .43** .51** .28** .66 Environment turbulence 3.89 1.38 .46** .52** .33** .17 .72
Note: Average variance extracted (AVE) are reported on the diagonal

33
Table 4: Results of hierarchical moderated regression analysis
Dependent Variable: MNE subsidiary sales performance Hypothesis Variables Model 1 Model 2 Model 3 Model 4
Control く t-values く t-values く t-values く t-values Firm size -.407 -4.788 -.195 -3.188 -.235 -3.889 -.218 -3.666 Subsidiary experience (years) .193 2.160 .128 2.042 .158 2.499 .164 2.656 Industry type -.124 -.971 .043 .464 -.005 -.055 -.030 -.334 R&D expenses .337 2.840 .278 3.420 .273 3.453 .277 3.596 Environment turbulence .470 4.539 .141 1.816 .144 1.928 .130 1.791 Transformational leadership (LEA) .592 6.157 .450 4.317 .363 3.366 Inter-functional collaboration (COL) .296 4.762 .245 3.861 .243 3.923
H1 Brand orientation (BO) -.143 -1.294 -.082 -.678 .032 .252 H2 BO x LEA -.055 -.736 -.024 -.325 H3 BO x COL .160 2.355 .183 2.740
Additional tests LEA x COL .091 1.48 BO x LEA x COL .126 2.446 Goodness of fit statistics
F-statistics 17.576 38.576 34.508 33.527
R2 .463 .757 .781 .793
Adjusted R2 .436 .737 .758 .770
∆R2 - .294** .024* .012*
** p<.01; * p<.05; † p<.10; Critical t-values for hypothesized paths = 1.645 (5%, one-tail tests)