when does spring start
TRANSCRIPT

When does Spring start?Gardening Category Trends
Research compiled by Michele Masnaghetti and Manon Jones
Abstract
Every year as gardening brands start building their marketing plans they face an important
question: Does Spring start at different times in different UK regions? By using the
transactional information available on the Abacus Alliance to analyse purchasing patterns
in the January to May period of 2013, 2014 and 2015, we found that there isn’t a North/
South divide in when consumers start buying gardening products. However, there is a
difference between urban and rural areas, with customers who live in or around major UK
cities purchasing later in the season. It is possible that this “urban delay” is linked to urban
customers selecting ready-to-plant products over seeds and bulbs.
Introduction
Every year as gardening brands start building their marketing plans for the crucial Spring
season, they face an important question: “Does Spring start at different times in different
UK regions? Should we mail catalogues to Sussex and Inverness-shire at the same time or
should this be staggered?”
We have previously used transactional information available within the Abacus Alliance
to answer key questions regarding year-on-year trends in purchasing patterns within
the Gardening market (as well as other product categories). This insight is available in
our Annual Trends Report, downloadable free of charge. We are now going to compare
the data in the shared database to investigate the possible geographical differences in
purchasing patterns within the UK. The results of this analysis are presented below.
Methodology
We defined ‘Spring’ as the period between the 1st of January to the 31st May. To remove
the effect of yearly changes in the weather pattern, we extracted data for three years:
2013, 2014 and 2015. We in included only purchases of plants, bulbs and seeds in the
analysis because gardening sundries and gardening furniture follow distinctly different
patterns to the rest of the category. The Abacus Alliance counts 19 member brands that
sell plants, bulbs and seeds: these brands recorded 4.38 million transactions in the analysis
period across 2.17 million UK households. The data was summarised to postal area level,
which is defined as the first 1 or 2 letters of the postcode.
Results
We looked at two maps that illustrate total spend and average spend within the gardening
sector throughout the UK.
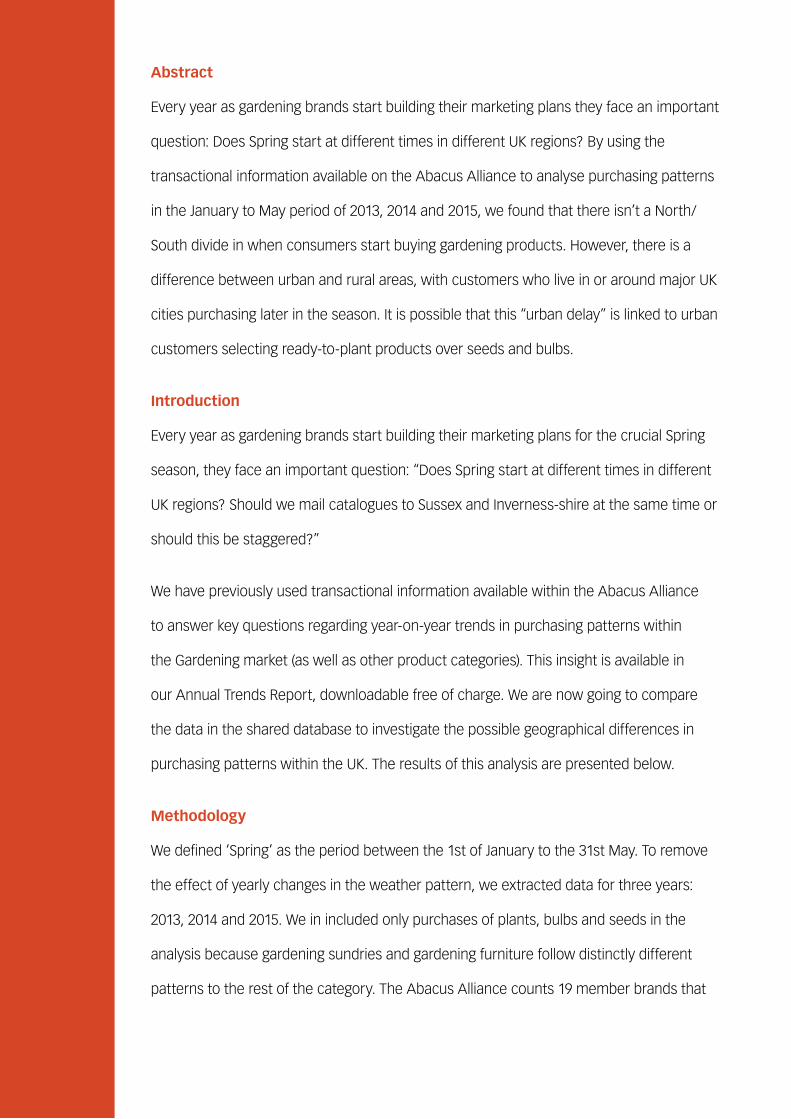
Figure one: Average Household Spend (Active households only)
Figure 1 shows the average household spend by area. The light areas show lower than
average household spend, and the darker areas show higher than average household
spend. Scotland and the ‘home counties’ of the South appear to have a higher average
than household spend compared to the Midlands.
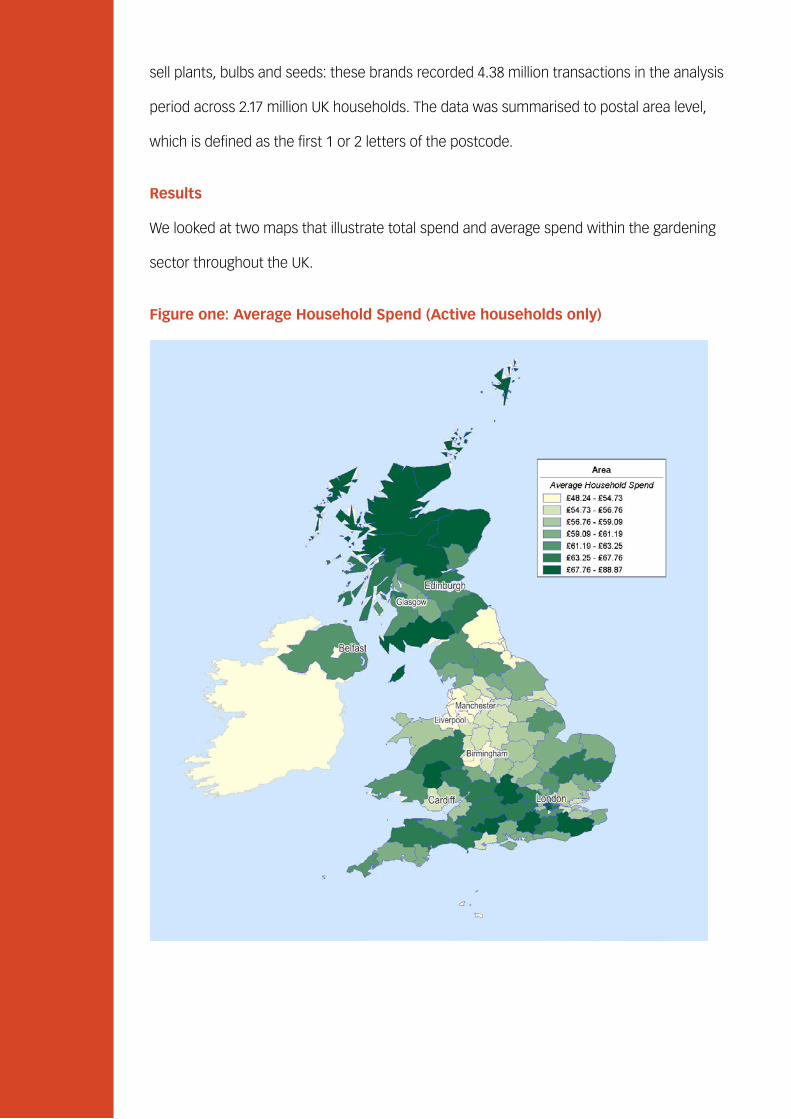
Figure Two: Total Spend
Figure 2 shows total spend by postal area. The total spend in each area is linked to
average household spend as well as population density/size in the postal area. In
Scotland, the total spend is low despite the higher than average household spend as the
population is more dispersed. In contrast, average household spend in the East Midlands
isn’t high but due to the dense population we see high total spend in these regions.
It’s important to be aware of these differences, but they have no impact on our analysis as
the measure we have used compares the spend in each postal area since the beginning
of the year to the total spend for that specific area during Spring. We have called this
measure “Progress”, as it represents how far Spring sales have progressed at that point in
time. For example, if in the “GU” postal area the total spend in January was £1 million and
the total spend in the area in Spring was £5 million, then progress as of February 1st was
20%.
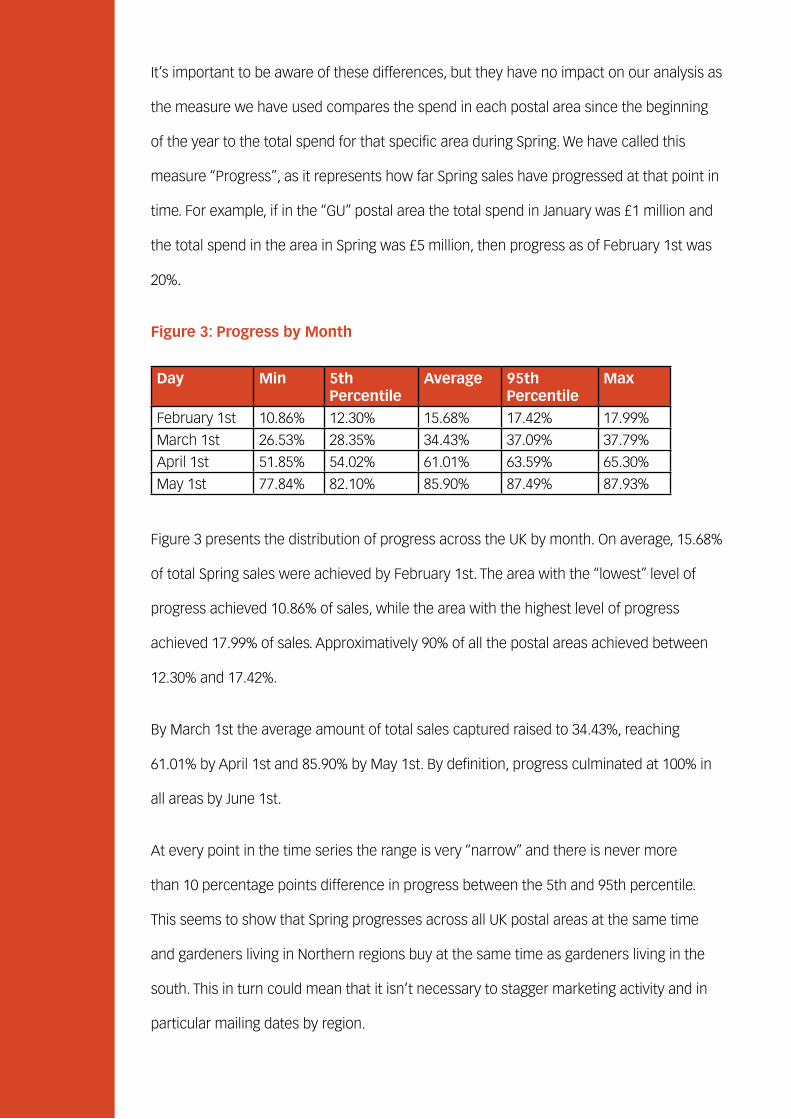
Figure 3: Progress by Month
Figure 3 presents the distribution of progress across the UK by month. On average, 15.68%
of total Spring sales were achieved by February 1st. The area with the “lowest” level of
progress achieved 10.86% of sales, while the area with the highest level of progress
achieved 17.99% of sales. Approximatively 90% of all the postal areas achieved between
12.30% and 17.42%.
By March 1st the average amount of total sales captured raised to 34.43%, reaching
61.01% by April 1st and 85.90% by May 1st. By definition, progress culminated at 100% in
all areas by June 1st.
At every point in the time series the range is very “narrow” and there is never more
than 10 percentage points difference in progress between the 5th and 95th percentile.
This seems to show that Spring progresses across all UK postal areas at the same time
and gardeners living in Northern regions buy at the same time as gardeners living in the
south. This in turn could mean that it isn’t necessary to stagger marketing activity and in
particular mailing dates by region.
Day Min 5th Percentile
Average 95th Percentile
Max
February 1st 10.86% 12.30% 15.68% 17.42% 17.99%
March 1st 26.53% 28.35% 34.43% 37.09% 37.79%
April 1st 51.85% 54.02% 61.01% 63.59% 65.30%
May 1st 77.84% 82.10% 85.90% 87.49% 87.93%
The average of the distribution of progress sits much closer to the 95th percentile than
to the 5th percentile. This indicates that there aren’t areas that are spending significantly
earlier than others, there may be a few areas that are lagging behind substantially.
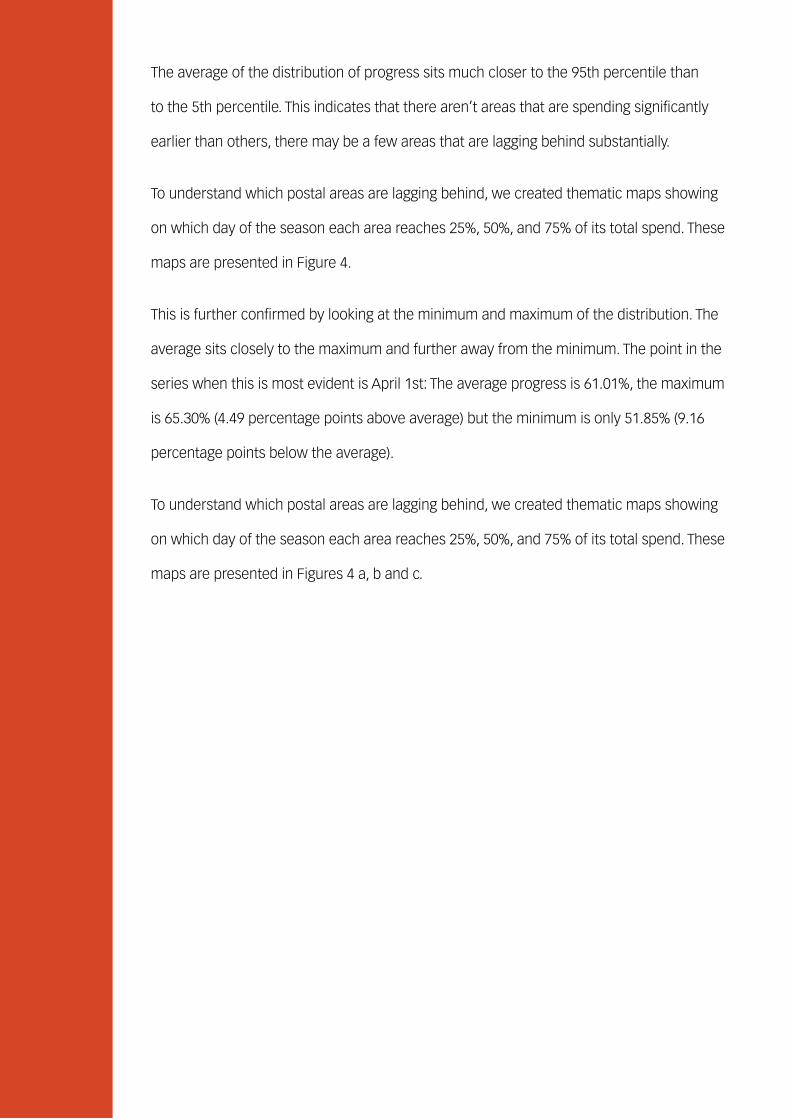
To understand which postal areas are lagging behind, we created thematic maps showing
on which day of the season each area reaches 25%, 50%, and 75% of its total spend. These
maps are presented in Figure 4.
This is further confirmed by looking at the minimum and maximum of the distribution. The
average sits closely to the maximum and further away from the minimum. The point in the
series when this is most evident is April 1st: The average progress is 61.01%, the maximum
is 65.30% (4.49 percentage points above average) but the minimum is only 51.85% (9.16
percentage points below the average).
To understand which postal areas are lagging behind, we created thematic maps showing
on which day of the season each area reaches 25%, 50%, and 75% of its total spend. These
maps are presented in Figures 4 a, b and c.
Figure 4a – Day in which 25% of total sales is reached

Figure 4b – Day in which 50% of total sales is reached
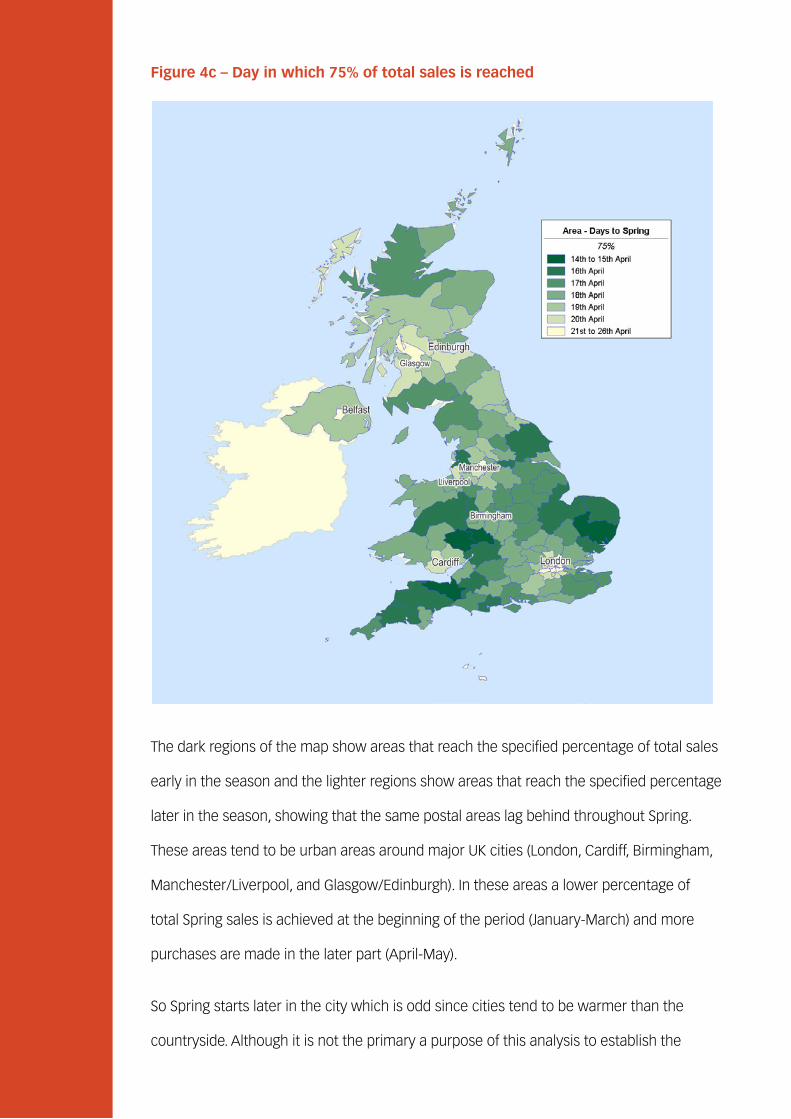
Figure 4c – Day in which 75% of total sales is reached
The dark regions of the map show areas that reach the specified percentage of total sales
early in the season and the lighter regions show areas that reach the specified percentage
later in the season, showing that the same postal areas lag behind throughout Spring.
These areas tend to be urban areas around major UK cities (London, Cardiff, Birmingham,
Manchester/Liverpool, and Glasgow/Edinburgh). In these areas a lower percentage of
total Spring sales is achieved at the beginning of the period (January-March) and more
purchases are made in the later part (April-May).
So Spring starts later in the city which is odd since cities tend to be warmer than the
countryside. Although it is not the primary a purpose of this analysis to establish the

causes of this “urban delay”, we will attempt to explain. It seems possible that the type
of gardening products purchased by city dwellers might be the reason why Spring
comes later in the city. Urban areas are characterised by smaller garden sizes, a higher
percentage of dwelling without a garden and a younger population. This makes it likely
that city dwellers buy more ready-to-plant products and fewer seeds and bulbs than
suburban and country consumers. This can be due to a lack of space for seed propagation
and a preference for greens that require less “care”. Ready-to-plant products are generally
available later in the season, so that could explain why sales in the city only “pick-up” in
April-May.
Summary
In conclusion, our analysis shows that there isn’t a North/South divide in when Spring
starts from a gardening perspective. The weather may vary across the UK but customers
in Sussex and customers in Inverness-shire purchase at the same time. However, there is
difference in purchasing between customers who live in urban areas and customers who
live in rural areas. Customers living in or around major UK cities buy later in the season. It is
possible that this “delay” is linked to the type of products purchased by city dwellers, and
in particular to a preference of urban customers for ready-to-plant products.

Find out more
To find out more about the analysis please contact Michele Masnaghetti
at [email protected] or 020 8943 8036/07500 049 171.
To find out more about Epsilon Abacus, please visit
www.abacusalliance.com, call 020 8943 8000 or email
Hear news and updates by following us on Twitter
@abacusalliance.com or our LinkedIn company page and joining our
LinkedIn Home Shopping Data Strategy Group.