when and how to use therapeutic drug monitoring in ibd patients bruce e. sands, md, ms chief of the...
TRANSCRIPT
When and How to Use Therapeutic Drug Monitoring in IBD Patients
Bruce E. Sands, MD, MS
Chief of the Dr. Henry D. Janowitz Division of Gastroenterology
Dr. Burrill B. Crohn Professor of Medicine
Icahn School of Medicineat Mount SinaiNew York, NY

Disclosures
• AbbVie• Amgen• Celgene• Forest Research Institute• Janssen Biotech• Luitpold Pharmaceuticals• MedImmune• Millennium Pharmaceuticals• Pfizer• Prometheus Laboratories• Takeda
Overview
• To understand the relationship between pharmacokinetics (levels and distribution of drug) to pharmacodynamics (therapeutic and adverse effects)
• To determine the roles for therapeutic drug monitoring in treating IBD, as well as limitations of current knowledge

Duration of action
TherapeuticRange
Conc
entr
ation
Cmax
Onset time tmax Time
MTC
MEC
TOXICITY
LACK OF EFFICACY
AUC
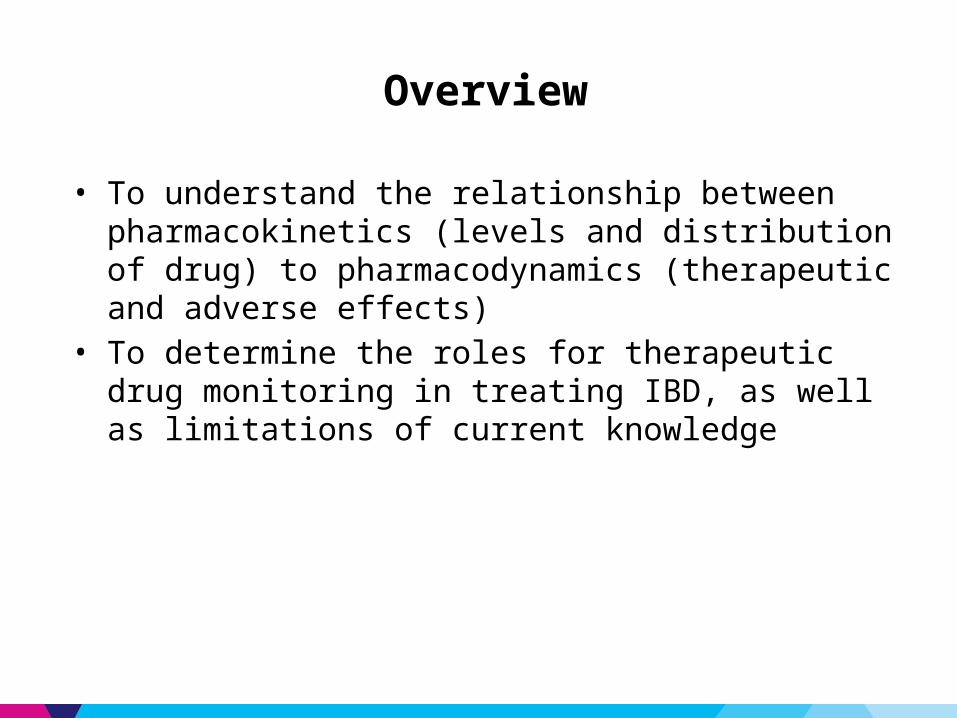
Association of 6-thioguanine nucleotide levels and IBD activity: a meta-analysis
·Osterman MT. Gastroenterology 2006;130:1047-53.

Prospective Data Supporting Metabolite-Based Dose Optimization of Thiopurines are Inconclusive
Clinical Remission at 16 weeks(%)
0
20
40
60
80
100
40
16
Individualised Weight-Based
Clinical Remission at 16 weeks(%)
0
10
20
30
40
50
60
7060
25
Individualised Weight-Based
Dassopoulos T, et al. Aliment Pharmacol Ther 2014;39: 163-175
Inte
ntion
To
Trea
t
Per P
roto
col
p=0.11 p=0.12
•Multicenter RCT comparing AZA dosing - weight-based (2.5 mg/kg/day) versus individualized (stratified by TPMT, then optimized to target6TGN – 250-400 pmol/8 x 108RBC)•Powered for 226 subjects, 50 subjects randomized, 27 subjects completed

Higher 6-TGN Levels are Associated with Higher Infliximab Trough Levels in Patients on Combination Therapy
• Cross-sectional study of 72 patients on combination therapy• 6TGN levels (but not thiopurine dose or lymphocyte count) correlated with IFX
levels (rho:0.466, p<0.001) • 6TGN > 125 pmol/8 x 108 RBC predicted higher IFX levels – ROC: 0.82, p=0.002• 6TGN < 125 pmol/8 x 108 RBC predicted higher likelihood of ATIs – OR: 1.3, 95%
CI 2.3 – 72.5, p<0.01
Yarur A et al. DDW 2014, Abstract 788 Series1
0
50
100
150
200
250
193
117
ATI -ve ATI +ve
6TG
N le
vel –
pm
ol/8
x 1
08 RBC
P=0.02
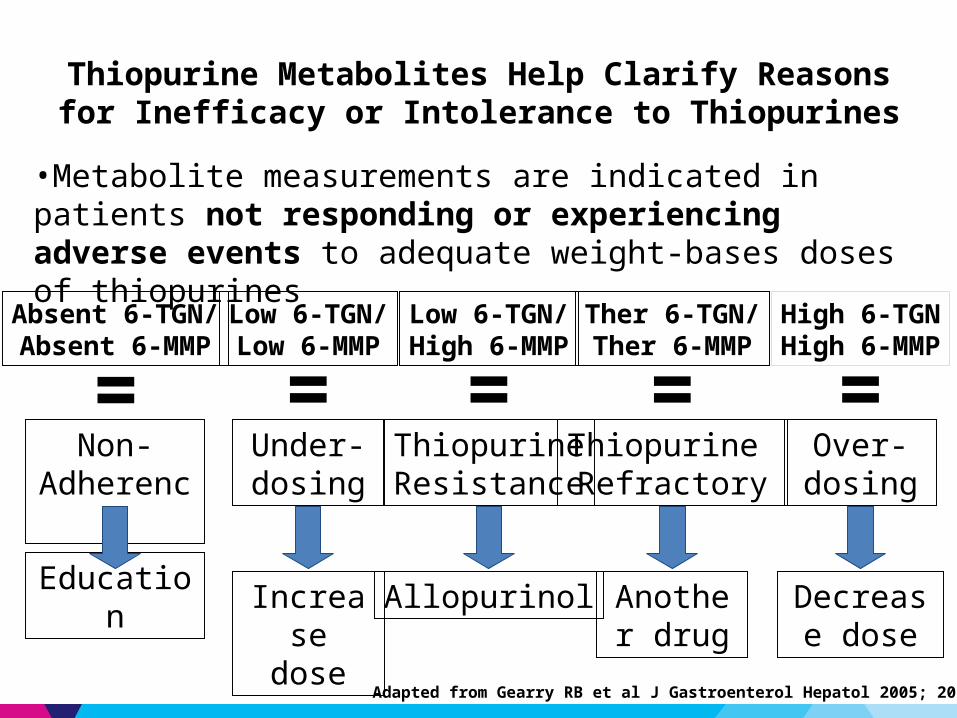
Thiopurine Metabolites Help Clarify Reasons for Inefficacy or Intolerance to Thiopurines
•Metabolite measurements are indicated in patients not responding or experiencing adverse events to adequate weight-bases doses of thiopurines
Absent 6-TGN/Absent 6-MMP
Non-Adherence
Education
=Under-dosing
Increase dose
Low 6-TGN/Low 6-MMP
=
Adapted from Gearry RB et al J Gastroenterol Hepatol 2005; 20:1149-57
High 6-TGNHigh 6-MMP
Over-dosing
Decrease dose
=Low 6-TGN/High 6-MMP
ThiopurineResistance
Allopurinol
=Ther 6-TGN/Ther 6-MMP
Thiopurine Refractory
Another drug
=
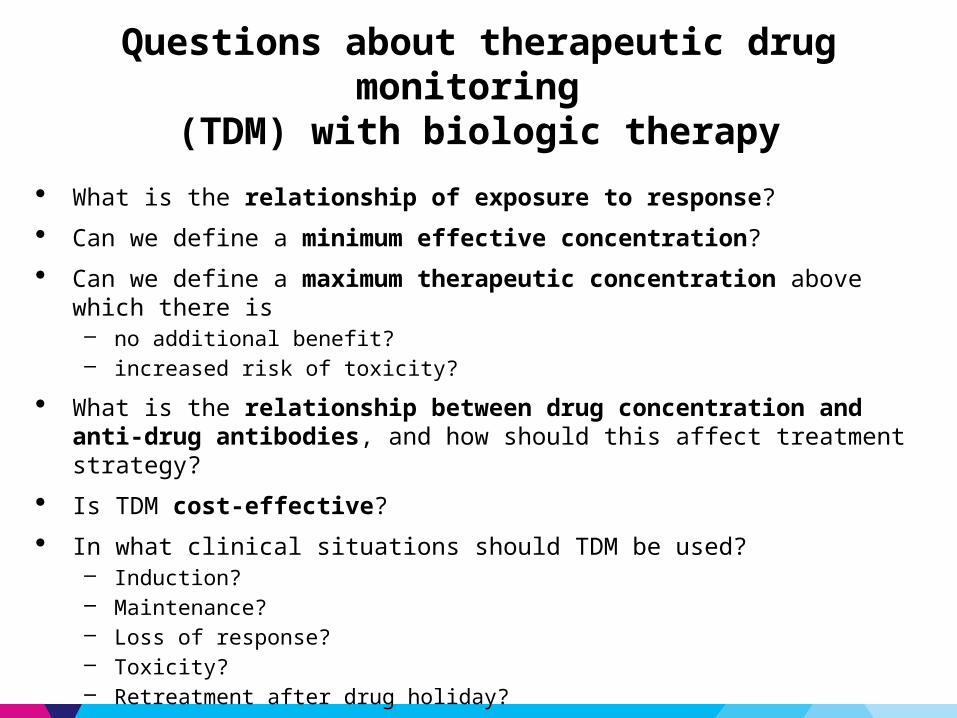
Questions about therapeutic drug monitoring (TDM) with biologic therapy
· What is the relationship of exposure to response?
· Can we define a minimum effective concentration?
· Can we define a maximum therapeutic concentration above which there is – no additional benefit?– increased risk of toxicity?
· What is the relationship between drug concentration and anti-drug antibodies, and how should this affect treatment strategy?
· Is TDM cost-effective?
· In what clinical situations should TDM be used?– Induction?– Maintenance?– Loss of response?– Toxicity?– Retreatment after drug holiday?

Higher Serum Infliximab Concentration is Associated with a Higher Response Rate in CD
• Study design: prospective, cohort study
• N=125, 30% Rx for fistula • Median follow-up: 36 months• Efficacy
– Infliximab concentrations ≥12 μg/mL were associated with greater median duration of response
– Immunosuppressant use was associated with IFX concentrations ≥12 μg/mL
Baert F, et al. N Engl J Med. 2003;348:601.
Duration of Response Based onIFX Concentrations
≥12.0 μg/mL <12.0 μg/mL0
20
40
60
80
100
81.5
68.5
Du
rati
on
of
Re
sp
on
se
(d
ay
s)
P<0.01

·Pr
opor
tion
of P
atien
ts (%
)
IFX Concentration (mcg/ml) at Wk 30
Clinical Remission Without Corticosteroids by Trough IFX Concentration at Week 26: SONIC
Primary Endpoint
·*IFX and IFX+AZA patients who had 1 or more PK samples obtained after their first study agent administration were included in the analysis
0 >0-1 >1-3 >3-6 >60
102030405060708090
100
59 57
73 74 72
31/4336/4943/5913/2319/32
·Colombel JF, et al. N Engl J Med. 2010.
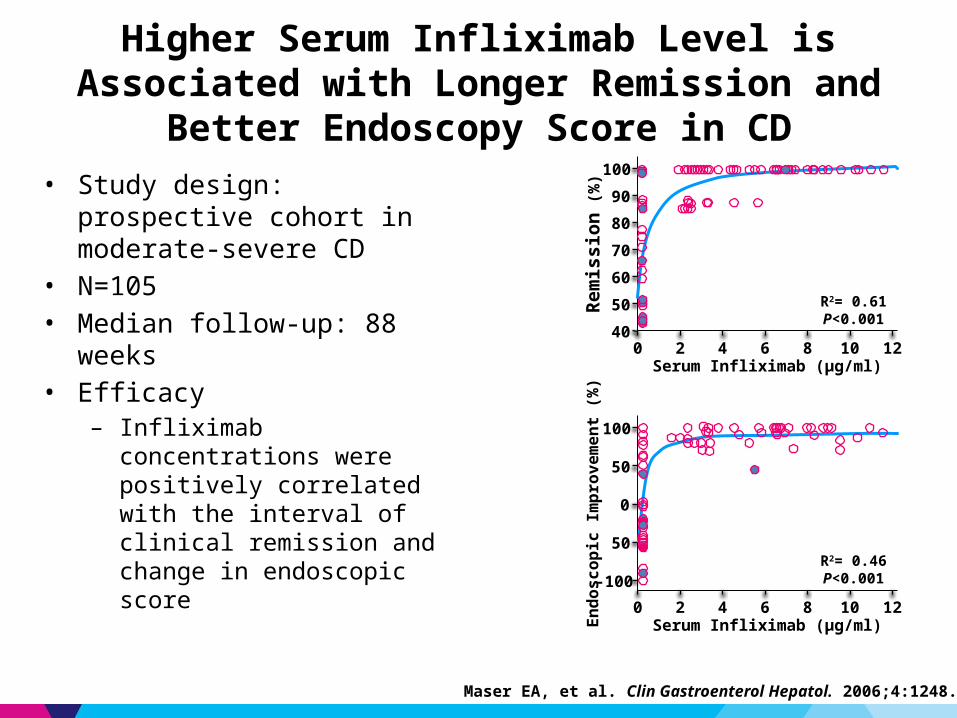
Higher Serum Infliximab Level is Associated with Longer Remission and Better Endoscopy Score in CD
• Study design: prospective cohort in moderate-severe CD
• N=105• Median follow-up: 88 weeks• Efficacy
– Infliximab concentrations were positively correlated with the interval of clinical remission and change in endoscopic score
Maser EA, et al. Clin Gastroenterol Hepatol. 2006;4:1248.
40
50
60
70
80
90
100
Rem
issi
on (%
)
Serum Infliximab (µg/ml)
R2= 0.61P<0.001
0 2 4 6 8 10 12
-100
50
0
50
100
Endo
scop
ic Im
prov
emen
t (%
)
Serum Infliximab (µg/ml)
R2= 0.46P<0.001
0 2 4 6 8 10 12

High Infliximab Levels are Associated with Mucosal Healing in Crohn’s Disease
• Serum samples in 210 CD patients undergoing treatment with infliximab were collected
• Infliximab trough levels were correlated with endoscopic healing (complete, partial or none) Complete Partial None
0
1
2
3
4
5
6
7
5.77
3.89
0.950000000000001
Tro
ug
h l
ev
el
(mc
g/m
L)
· Van Moerkercke W. et al. DDW 2010. Abs #405
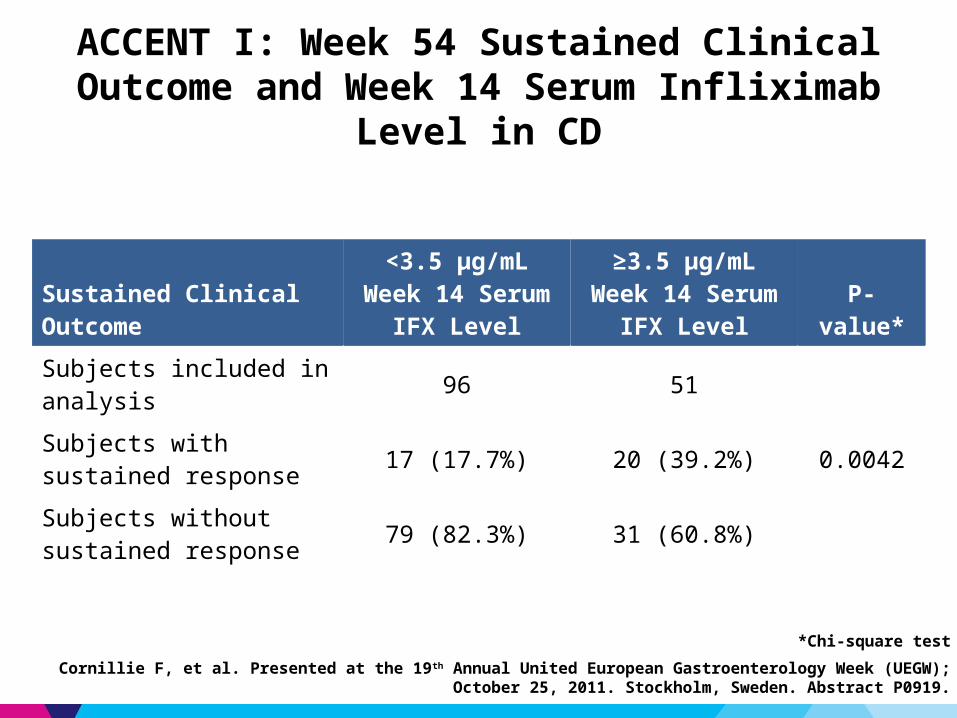
ACCENT I: Week 54 Sustained Clinical Outcome and Week 14 Serum Infliximab Level in CD
Sustained Clinical Outcome<3.5 μg/mL Week 14
Serum IFX Level≥3.5 μg/mL Week 14
Serum IFX Level P-value*
Subjects included in analysis 96 51
Subjects with sustained response 17 (17.7%) 20 (39.2%) 0.0042
Subjects without sustained response 79 (82.3%) 31 (60.8%)
*Chi-square test
Cornillie F, et al. Presented at the 19th Annual United European Gastroenterology Week (UEGW); October 25, 2011. Stockholm, Sweden. Abstract P0919.
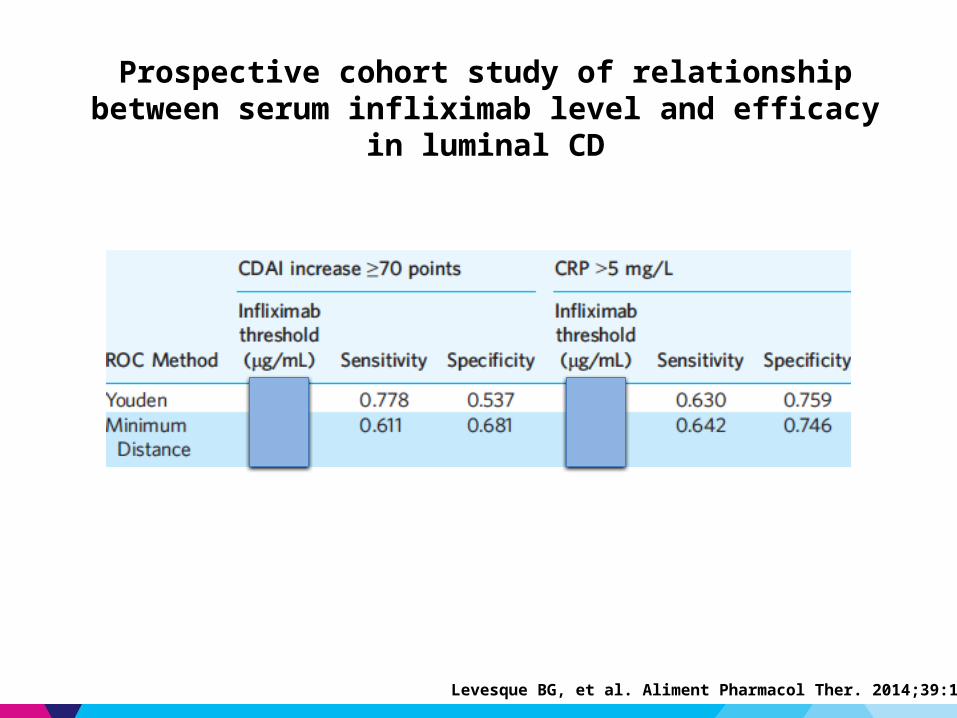
Prospective cohort study of relationship between serum infliximab level and efficacy in luminal CD
Levesque BG, et al. Aliment Pharmacol Ther. 2014;39:1126-35.
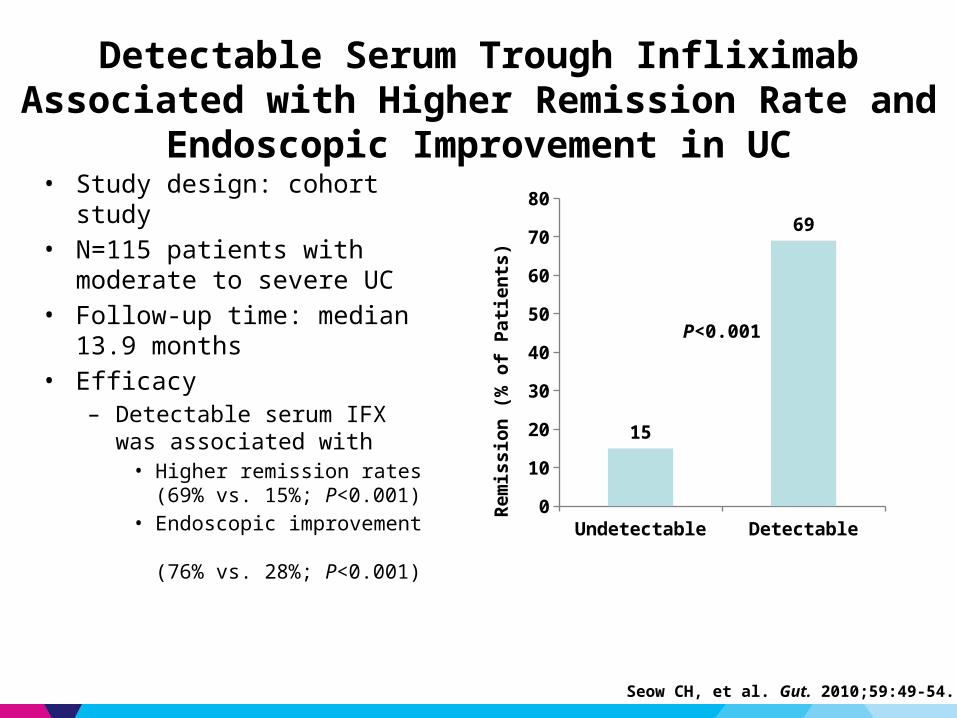
Detectable Serum Trough Infliximab Associated with Higher Remission Rate and Endoscopic Improvement in UC
• Study design: cohort study• N=115 patients with moderate
to severe UC• Follow-up time: median 13.9
months• Efficacy
– Detectable serum IFX was associated with
• Higher remission rates (69% vs. 15%; P<0.001)
• Endoscopic improvement (76% vs. 28%; P<0.001)
Seow CH, et al. Gut. 2010;59:49-54.
Undetectable Detectable0
10
20
30
40
50
60
70
80
15
69
Re
mis
sio
n (
% o
f P
ati
en
ts)
P<0.001
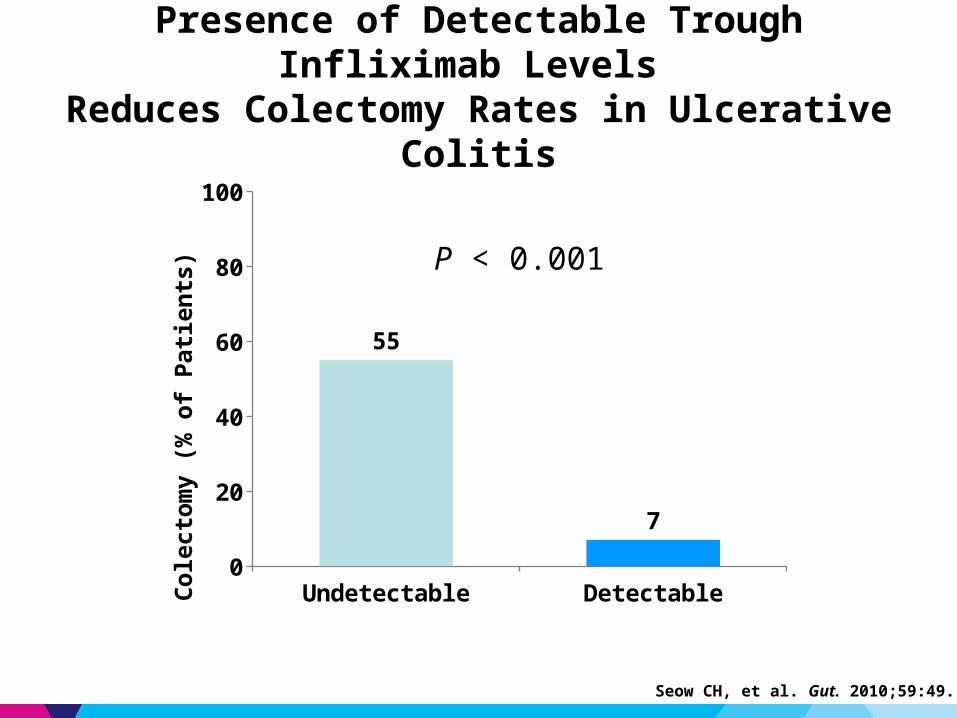
Presence of Detectable Trough Infliximab Levels Reduces Colectomy Rates in Ulcerative Colitis
Seow CH, et al. Gut. 2010;59:49.
Undetectable Detectable0
20
40
60
80
100
55
7
Cole
ctom
y (%
of P
atien
ts) P < 0.001

Proportion of Patients Achieving Clinical Remission by Serum IFX Concentration: ACT 1 and 2
IFX Conc.(% patients)
1stQuartile
2nd Quartile
3rd Quartile
4thQuartile P-values
Week 826.3%
(<21.3μg/mL)37.9%
(≥21.3-<33μg/mL)43.9%
(≥33-<47.9μg/mL)43.1%
(>47.9μg/mL)P=0.0504
Week 3014.6%
(<0.11μg/mL)25.5%
(≥0.11-<2.4μg/mL)59.6%
(≥2.4-<6.8μg/mL)52.1%
(>6.8μg/mL)P<0.0001
Week 5421.1%
(<1.4μg/mL)55.0%
(≥1.4-<3.6μg/mL)79.0%
(≥3.6-<8.1μg/mL)60.0%
(>8.1μg/mL)P=0.0066
At wks 8, 30 and 54, the proportion of patients achieving clinical remission increased with increasing quartiles of IFX concentrations.
Reinisch W et al., Gastro Vol 142, Issue 5, suppl-1, May 2012, page S-114

* 6 discontinued IFX, 3 continued same dose 3, 3 proceeded to surgery, 5 patients could not be assessed
Clinical outcomes in patients with detectable HACA (n=35)*
* 10 continued same dose, 9 discontinued IFX, 8 proceeded to surgery and 7 patients could not be assessed
Clinical outcomes in patients with sub-therapeutic concentrations (n=69)*
Increasing dose of infliximab in the presence of ATI formation is inferior to changing anti-TNF
Com
plet
e / p
artia
l res
pons
e (%
)
P<0.004
Com
plet
e / p
artia
l res
pons
e (%
) P<0.016
Afif W, et al. Am J Gastroenterol 2010;105:1133-9.

Proposed algorithm for patients with loss of response to infliximab
Positive HACA
Change to another anti-TNF agent
Change to non–anti-TNF agent
persistent disease
Increase infliximab
dose or frequency
Change to non–
anti-TNF agent
Change to different anti-TNF
agent
Change to different anti-TNF
agent
Subtherapeutic IFX concentration
Therapeutic IFX concentration
Active disease on endoscopy/radiology?
Change to different anti-TNF
agent
Investigate alternate etiologies
yes no
Afif W et al. Am J Gastroenterol 2010;105:1133.

• 66 patients: 27% with detectable ATA 59 (89%) CD, 7 (11%) UC
• Mean ADA levels were higher in patients with Undetectable ATA Mucosal healing Concomitant use of immunosuppressants
• ADA level ≥ 5 µg/ml is associated with lower CRP and healed mucosa
• Variables associated with positive ATA (≥ 1.7 µg/ml) ADA < 5µg/ml: OR 8.6, 95%CI (2.3-31) Mucosal inflammation: OR 3.8, 95% CI (1.1-13) Steroid use: OR 3.7, 95% CI (1.1-13)
Serum Adalimumab (ADA) Levels and Anti-Adalimumab Antibodies (ATA) Correlate with Endoscopic Inflammation
and Inflammatory Markers
Yarur, AJ, et al. Presented at DDW; May 21, 2013. Abstract Tu1147.
Endoscopic Inflammation
ad
alim
um
ab
[g
/mL
]
0
10
20
30
40
p=0.016
adal
imu
mab
[ g
/mL]
0
10
20
30
40
p=0.002
Immunosuppresant Usead
alim
umab
[ g
/mL]
0
10
20
30
40
p=0.028

Cross-sectional study of ADA drug level as predictor of clinical response and CRP in CD
• ADA level of 5.85 μg/mL was optimal- Sensitivity 68%- Specificity 71%- Positive LR 2.3
• AAA were inversely related to ADA drug levels
Mazor Y, et al. Aliment Pharmcol Ther 2014;40:620-8.

Higher trough levels of adalimumab are associated with higher rates of mucosal healing
Roblin X, et al. Clin Gastroenterol Hepatol 2014;12:80-84.
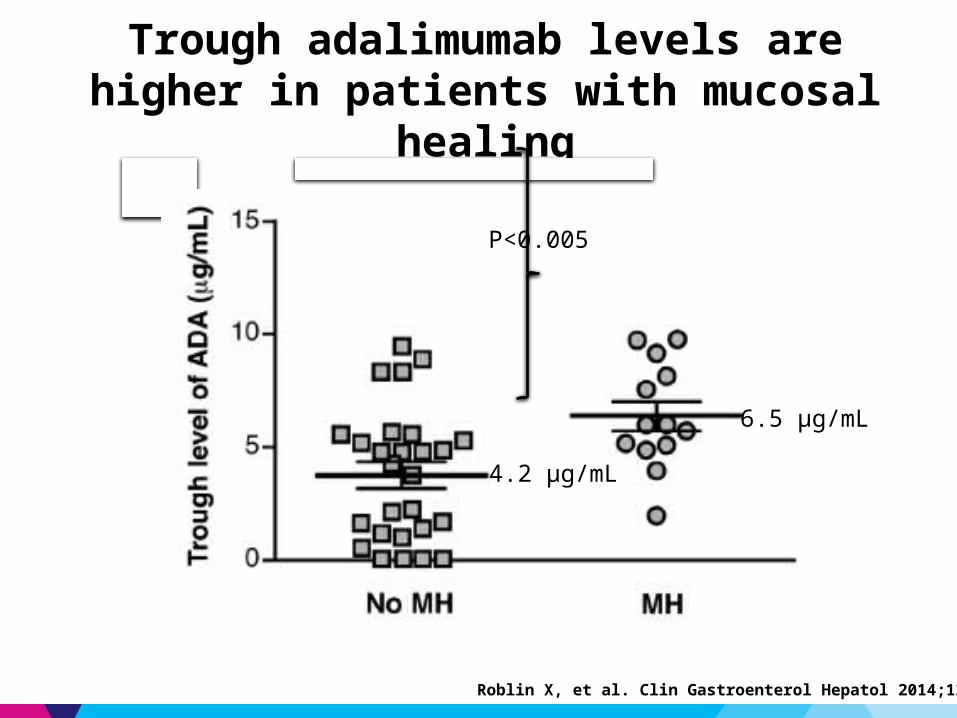
Trough adalimumab levels are higher in patients with mucosal healing
6.5 μg/mL
4.2 μg/mL
P<0.005
Roblin X, et al. Clin Gastroenterol Hepatol 2014;12:80-84.

Adalimumab Trough Serum Levels < 0.33 µg/mL Predicts a Lower Rate of Sustained Complete Response in
Patients with Crohn’s Disease
Karmiris K, et al. Gastroenterology. 2009;137:1628.
Patie
nts
with
Sus
tain
edCl
inic
al R
espo
nse
(%)
0.0
0.2
0.4
0.6
0.8
1.0
0 210 240
LogRank: P=.01
Sustained Clinical Response (weeks)90 12030 15060 180
ADA TR>0.33 µg/mL, n=104
ADA TR<0.33 µg/mL, n=16
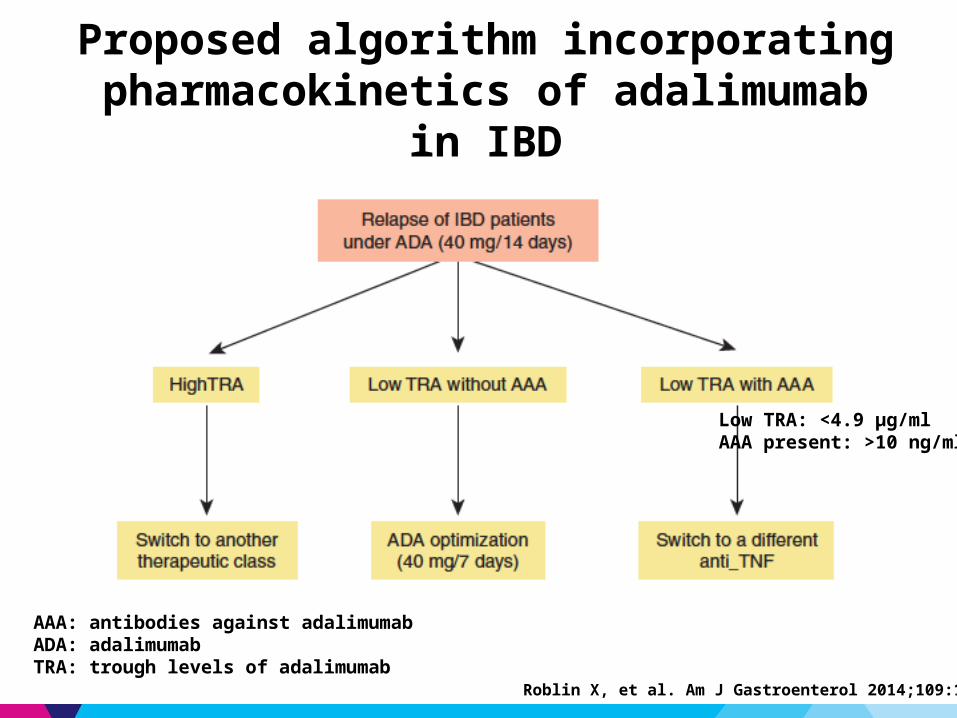
Proposed algorithm incorporating pharmacokinetics of adalimumab in IBD
AAA: antibodies against adalimumabADA: adalimumabTRA: trough levels of adalimumab
Low TRA: <4.9 μg/ml AAA present: >10 ng/ml
Roblin X, et al. Am J Gastroenterol 2014;109:1250-6.

• Single-center cohort of 125 steroid-refractory acute UC patients
• Standard infliximab induction/maintenance
• Fluid-phase assay for [IFX] and ATI
Trough Infliximab >2 µg/ml is Associated with Clinical Remission in Steroid-Refractory UC
Remission aOR [95%CI]
Colectomy aOR [95%CI]
Trough IFX > 2 µg/ml (vs. ≤ 2 µg/ml)
10 [3,35] 0.18 [0.07,0.44]
ATI (vs. no ATI) 0.64 [0.2,2.4] 1.0 [0.5,2.1]
IFX, infliximab Murthy S, et al. Presented at DDW; May 19, 2012. Abstract Sa2047.
Steroid-free Remission by IFX/ATI Status100
0
60
20
Pat
ien
ts i
n R
emis
sio
n (
%)
80
40
IFX+ATI-
70.0
16.6
28.5
13.0
IFX+ATI+
IFX-ATI-
IFX-ATI+
P=0.84
P=0.073
P<0.001
Steroid-free Remission by IFX Trough Status100
0
60
20
Pat
ien
ts i
nR
emis
sio
n (
%)
80
40
Serum IFX≤ 2µg/ml
17.5
69.4
Serum IFX> 2µg/ml
P<0.001
Colectomy by IFX Trough Status100
0
60
20Co
lect
om
y (%
)
80
40
Serum IFX≤ 2µg/ml
55.5
17.7
Serum IFX> 2µg/ml
P<0.001

Rapid IFX Clearance: Mechanism of Non-Response in UC
Kevans D, et al. Presented at DDW; May 19, 2012.

• Multicenter, propspective observational study in anti-TNF-naïve patients (N=19) with moderate-to-severe UC (Endoscopic Mayo 2/3)1
– IFX measured at 10 time points during first 6 weeks of induction therapy– Nonlinear mixed-effects modelling
• No difference in IFX concentration area under the curve (AUC) between endoscopic responders and endoscopic non-responders at week 8 (P=0.65 )
• Patients with CRP>50 µg/mL had lower IFX concentration (P=0.001)• 7/19 had positive ATI (homogeneous mobility shift assay)
– 6 of 8 endoscopic non-responders were ATI +– 2 of 8 endoscopic non-responders were ATI –
• Concomitant immunomodulator = 12/19 (P=NS)• IFX presumed to be lost in stool in severe IBD colitis2
Pharmacokinetics of Infliximab Induction Therapy in Patients With Moderate to Severe UC
1. Brandse JF, et al. Presented at DDW; May 5, 2014 A786. 2. Brandse JF, et al. Presented at DDW; May 18, 2013. A157.
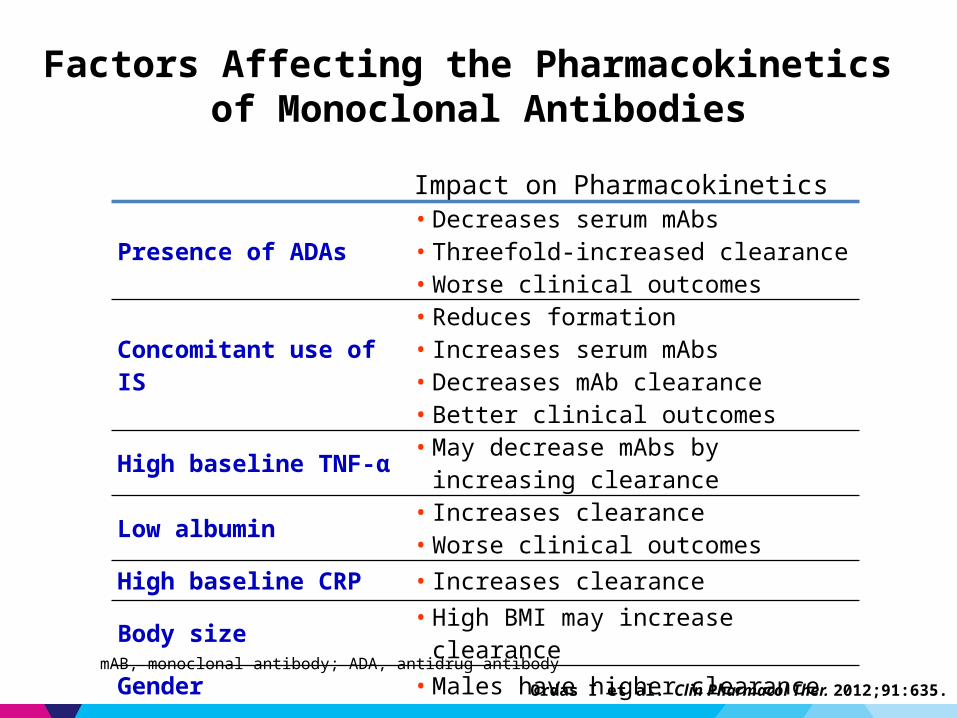
Factors Affecting the Pharmacokinetics of Monoclonal Antibodies
Impact on Pharmacokinetics
Presence of ADAs • Decreases serum mAbs• Threefold-increased clearance• Worse clinical outcomes
Concomitant use of IS• Reduces formation• Increases serum mAbs• Decreases mAb clearance• Better clinical outcomes
High baseline TNF-α • May decrease mAbs by increasing clearance
Low albumin • Increases clearance• Worse clinical outcomes
High baseline CRP • Increases clearance
Body size • High BMI may increase clearance
Gender • Males have higher clearance
Ordas I et al. Clin Pharmacol Ther. 2012;91:635.
mAB, monoclonal antibody; ADA, antidrug antibody

Do early serial trough and antidrug antibody level measurements predict clinical outcome of infliximab and adalimumab treatment?
Vande Casteele N, et al. Gut 2012;61:321

• Retrospective cohort of patients in clinical remission, single physician practice– IFX dose optimization to trough concentrations 5–10ug/mL (n=48)– No IFX dose optimization (n=78)
• Evaluated probability of remaining on IFX, up to 5 years
Prospective Therapeutic Drug Monitoring to Optimize Infliximab Maintenance Therapy in IBD
Vaughn BP, et al. Presented at DDW; May 3, 2014 Abstract 209.
Dose optimization increases probability of remaining on IFX therapy up to 5 years

IFX TL withinoptimal interval
LB Group
CB Group
Randomized 1:1
IFX dosing based on clinical symptoms &
CRP
Maintenance phase (52 weeks)
IFX dosing based on IFX TL
(3-7 µg/mL)
Dosing based on IFX TL
(3-7 µg/mL)
Optimization phase (n weeks)
Prospective Controlled Trial of Trough Level Adapted Infliximab Treatment (TAXIT): Study outline
Screening Randomization Primary end point
Primary end point = rate of clinical (Harvey-Bradshaw or Partial Mayo score) and biological (C-reactive protein ≤5 mg/l) remission one year after randomization in each group
CB Group= Clinically Based Group; LB Group= Level Based Group
IFX maintenancetherapy –> Stableclinical response
Vande Casteele N, et al. United European Gastroenterology Journal 2013;1:A1

TAXIT Results: Optimization PhaseDose escalation (N=76)
Dose escalation in Crohn’s disease patients with subtherapeutic levels results in a better disease control
CD (N=43)* UC (N=28)*0
20
40
60
80
100
Before optimization After optimization
P=0.02 P=1.0
65.1
88.4 88.9 88.5
Pat
ien
ts (
%)
CD UC0
5
10
15
Before optimization After optimization
P<0.001 P=0.16
Mea
n C
RP
Con
cent
ratio
n(m
g/lit
er)
*five patients (1 CD and 4 UC) were excluded from analysis because of withdrawal of consent during optimization phase.
CD: Harvey-Bradshaw ≤ 4 / UC: Partial Mayo ≤ 2
Vande Casteele N, et al. United European Gastroenterology Journal 2013;1:A1
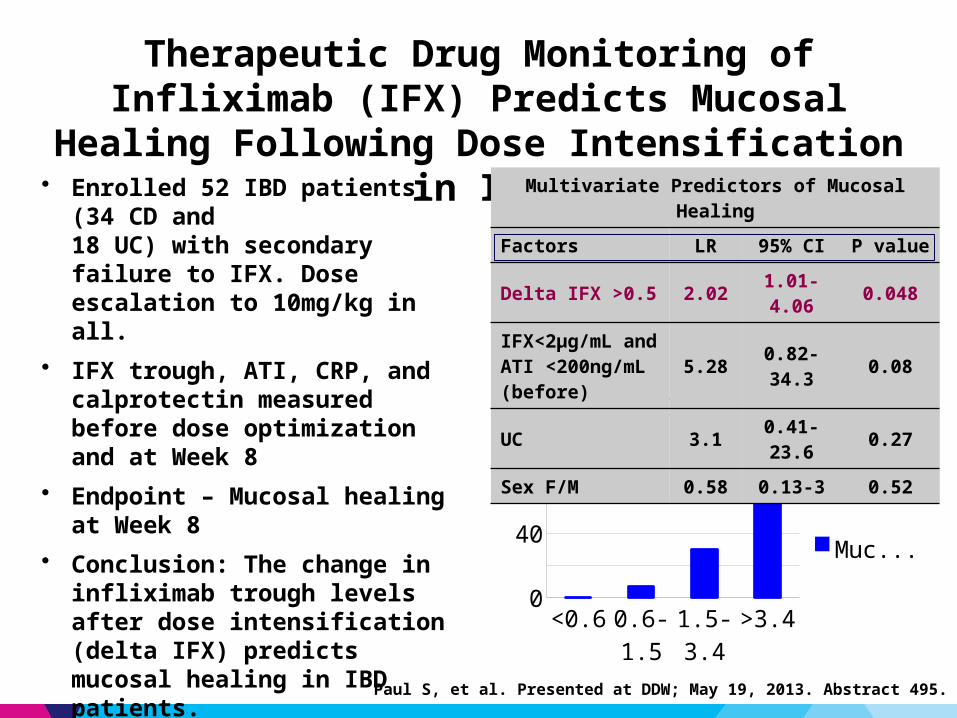
• Enrolled 52 IBD patients (34 CD and 18 UC) with secondary failure to IFX. Dose escalation to 10mg/kg in all.
• IFX trough, ATI, CRP, and calprotectin measured before dose optimization and at Week 8
• Endpoint – Mucosal healing at Week 8 • Conclusion: The change in infliximab
trough levels after dose intensification (delta IFX) predicts mucosal healing in IBD patients.
Therapeutic Drug Monitoring of Infliximab (IFX) Predicts Mucosal Healing Following Dose Intensification in IBD
<0.6 0.6-1.5
1.5-3.4
>3.40
10203040506070
Delta IFX and Mucosal Healing
Mucosal healing
Multivariate Predictors of Mucosal Healing
Factors LR 95% CI P value
Delta IFX >0.5 2.02 1.01-4.06 0.048
IFX<2μg/mL and ATI <200ng/mL (before) 5.28 0.82-34.3 0.08
UC 3.1 0.41-23.6 0.27
Sex F/M 0.58 0.13-3 0.52
Paul S, et al. Presented at DDW; May 19, 2013. Abstract 495.
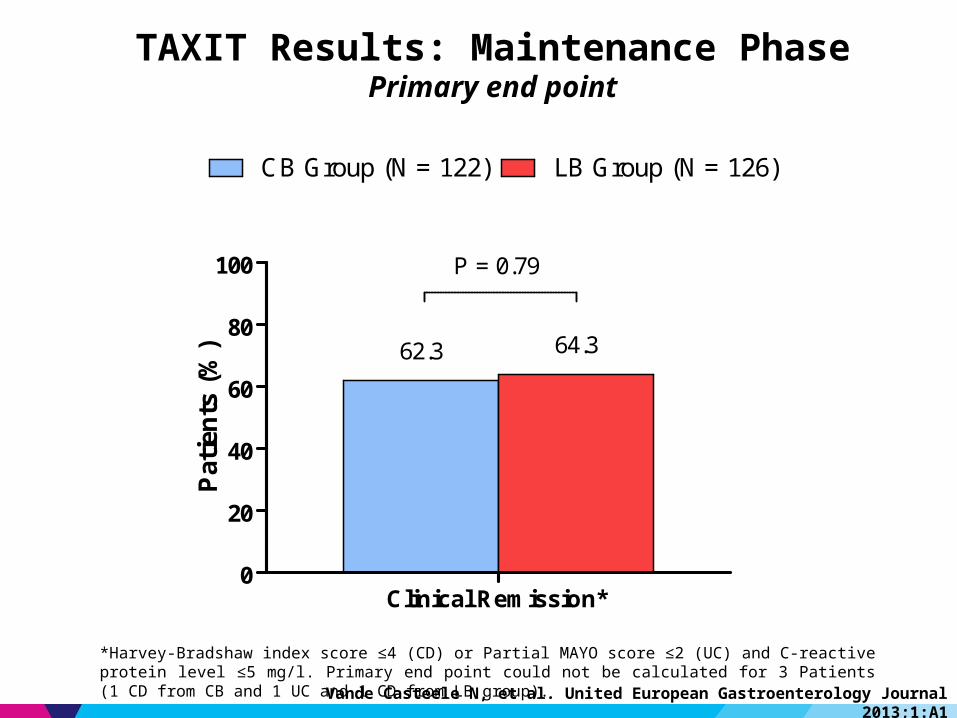
TAXIT Results: Maintenance PhasePrimary end point
*Harvey-Bradshaw index score ≤4 (CD) or Partial MAYO score ≤2 (UC) and C-reactive protein level ≤5 mg/l. Primary end point could not be calculated for 3 Patients (1 CD from CB and 1 UC and 1 CD from LB group).
Clinical Remission*0
20
40
60
80
100
CB Group (N = 122) LB Group (N = 126)
P = 0.79
62.3 64.3
Pat
ien
ts (
%)
Vande Casteele N, et al. United European Gastroenterology Journal 2013;1:A1
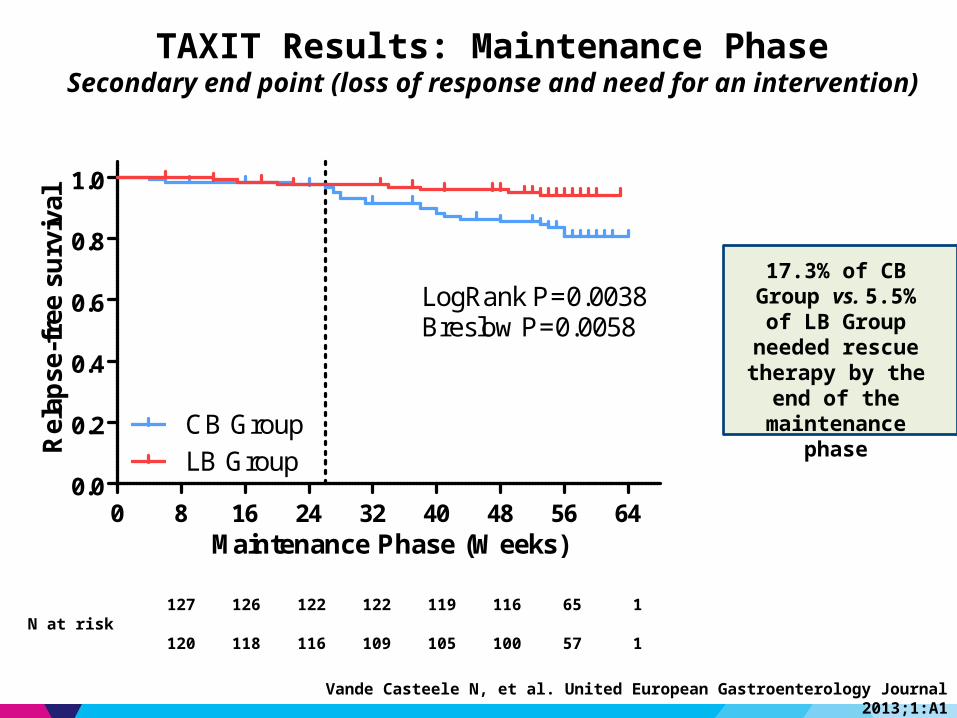
TAXIT Results: Maintenance PhaseSecondary end point (loss of response and need for an intervention)
17.3% of CB Group vs. 5.5% of LB Group
needed rescue therapy by the end of
the maintenance phase
N at risk127 126 122 122 119 116 65 1
120 118 116 109 105 100 57 1
0 8 16 24 32 40 48 56 640.0
0.2
0.4
0.6
0.8
1.0
CB GroupLB Group
LogRank P=0.0038Breslow P=0.0058
Maintenance Phase (Weeks)
Rel
apse
-fre
e su
rviv
al
Vande Casteele N, et al. United European Gastroenterology Journal 2013;1:A1
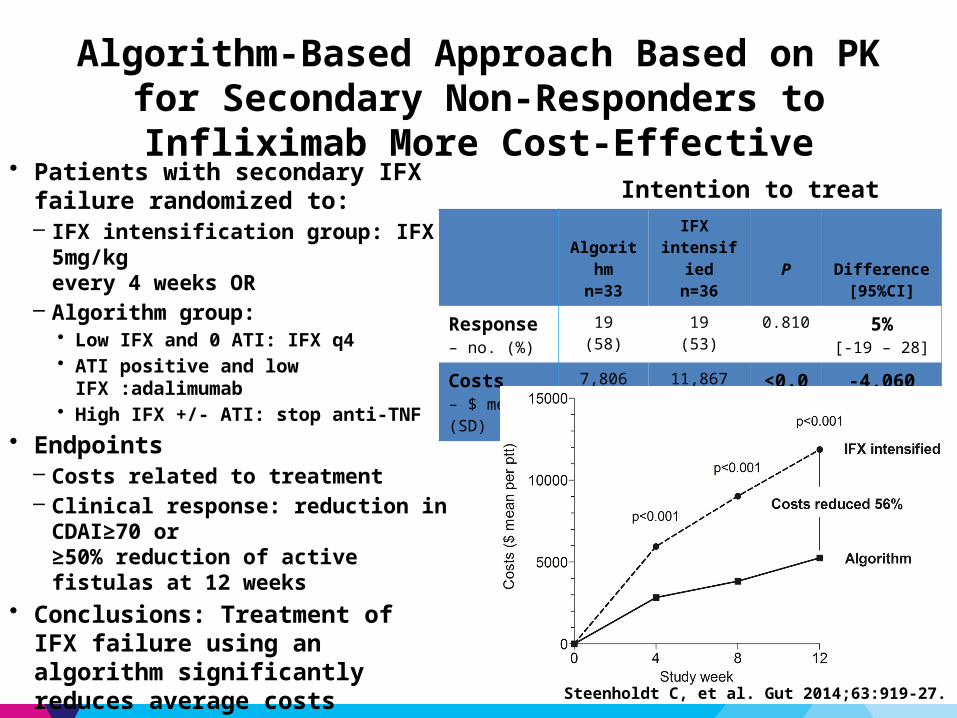
• Patients with secondary IFX failure randomized to: – IFX intensification group: IFX 5mg/kg
every 4 weeks OR– Algorithm group:
• Low IFX and 0 ATI: IFX q4• ATI positive and low IFX :adalimumab• High IFX +/- ATI: stop anti-TNF
• Endpoints– Costs related to treatment– Clinical response: reduction in CDAI≥70 or
≥50% reduction of active fistulas at 12 weeks• Conclusions: Treatment of IFX failure
using an algorithm significantly reduces average costs without compromising care
Algorithm-Based Approach Based on PK for Secondary Non-Responders to Infliximab More Cost-Effective
Intention to treat
Algorithm
n=33
IFX intensified
n=36P Difference
[95%CI]
Response– no. (%)
19(58)
19(53)
0.810 5%[-19 – 28]
Costs– $ mean (SD)
7,806(5,360)
11,867(2,661)
<0.001 -4,060 [-5,969;-
1,775]
Steenholdt C, et al. Gut 2014;63:919-27.
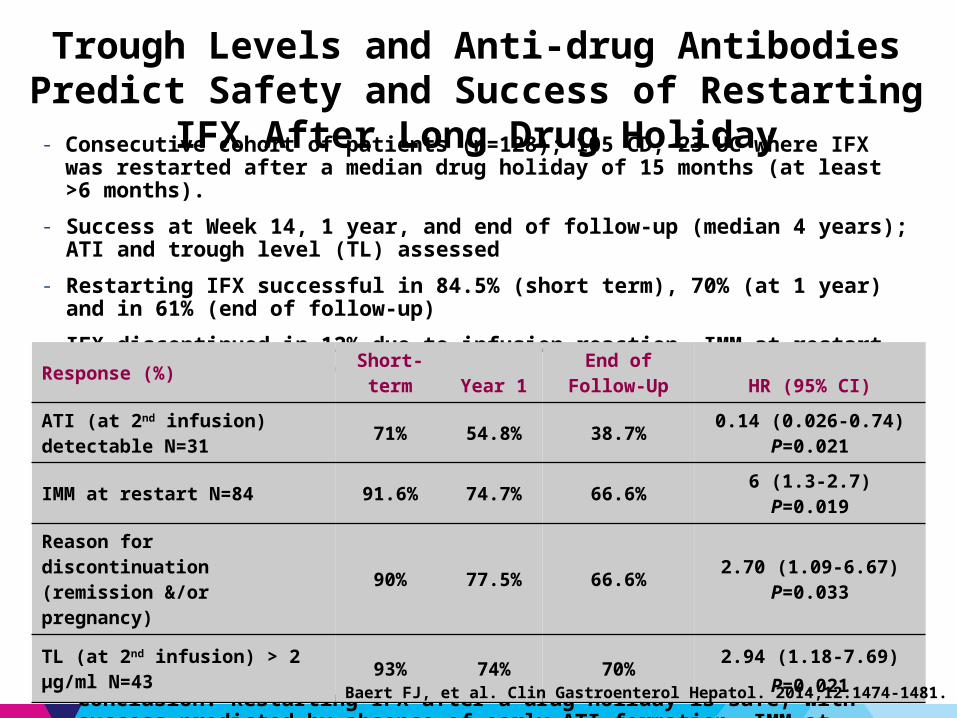
- Consecutive cohort of patients (n=128); 105 CD, 23 UC where IFX was restarted after a median drug holiday of 15 months (at least >6 months).
- Success at Week 14, 1 year, and end of follow-up (median 4 years); ATI and trough level (TL) assessed
- Restarting IFX successful in 84.5% (short term), 70% (at 1 year) and in 61% (end of follow-up)
- IFX discontinued in 12% due to infusion reaction. IMM at restart prevents infusion reactions.Multivariate analysis
• Conclusion: Restarting IFX after a drug holiday is safe, with success predicted by absence of early ATI formation, IMM at recommencement, and not having had previous infusion reactions
Trough Levels and Anti-drug Antibodies Predict Safety and Success of Restarting IFX After Long Drug Holiday
Response (%) Short-term Year 1
End of Follow-Up HR (95% CI)
ATI (at 2nd infusion) detectable N=31
71% 54.8% 38.7%0.14 (0.026-0.74)
P=0.021
IMM at restart N=84 91.6% 74.7% 66.6% 6 (1.3-2.7) P=0.019
Reason for discontinuation (remission &/or pregnancy)
90% 77.5% 66.6% 2.70 (1.09-6.67) P=0.033
TL (at 2nd infusion) > 2 μg/ml N=43
93% 74% 70% 2.94 (1.18-7.69) P=0.021
Baert FJ, et al. Clin Gastroenterol Hepatol. 2014;12:1474-1481.

Additional questions
• Should target trough levels differ at different phases of treatment?– Rate of early drug clearance seems important early in severe disease– Is a higher trough required in induction than in maintenance?– Would rate of early drug clearance be a clinically useful parameter?
• Should TDM be individualized, or do population means work?- Can accurate predictive models for individual PK be created?
• Is there a safety benefit to dose reduction for supratherapeutic levels?
• Questions of timing and frequency of TDM: maximizing the value
Conclusions
• TDM with biologics more complex than with thiopurines• Minimum effective concentration roughly defined
– IFX trough ~3 μg/mL– ADA trough ~5 μg/mL
• Role of TDM in assessing loss of response is best established• TDM appears to be cost effective when dose-reduction
incorporated into treatment algorithm, but will be highly dependent upon cost and frequency of assay
• Growing interest in early TDM to dose optimize in severe disease (especially UC)