wheat streak mosaic virus—structural parameters for a potyvirus
TRANSCRIPT

www.elsevier.com/locate/yviro
Virology 340 (2
Wheat streak mosaic virus—Structural parameters for a Potyvirus
Lauren Parkera,1, Amy Kendalla, P.H. Bergerb,2, P.J. Shielb,2, Gerald Stubbsa,*
aCenter for Structural Biology, Vanderbilt University, Nashville, TN 37232, USAbDepartment of Plant, Soil and Entomological Sciences, University of Idaho, Moscow, ID 83844-2339, USA
Received 12 May 2005; returned to author for revision 8 June 2005; accepted 15 June 2005
Available online 18 July 2005
Abstract
Wheat streak mosaic virus is a Tritimovirus, a member of the Potyviridae family, which includes the very large Potyvirus genus. We have
examined wheat streak mosaic virus by electron microscopy and fiber diffraction from partially oriented sols, and analyzed the results to
estimate the symmetry and structural parameters of the viral helix. The virions have an apparent radius of 63 T 5 A. The viral helix has a pitchof 33.4 A T 0.6 A. There appear to be 6.9 subunits per turn of the helix, although we cannot completely eliminate values of 5.9 or 7.9 for this
parameter.
D 2005 Elsevier Inc. All rights reserved.
Keywords: Wheat streak mosaic virus; Potyvirus; Tritimovirus; Virus structure; Fiber diffraction; Electron microscopy
Introduction
The Potyviridae (Barnett, 1992; Shukla et al., 1994)
make up the largest single group of plant viruses, with
nearly 200 recognized members, and are the most important
economically. Full-length infectious clones are available for
several members of the group, making them increasingly
significant to biotechnology (Pogue et al., 2002). They are
also potentially valuable as models for flexible filamentous
assemblies in general.
Potyviridae coat proteins have essential roles in virus
replication, protection, and transport of the virus both within
the host and by vector transmission. Despite this importance
and the large size of the family, very little is known about
three-dimensional structures of the Potyviridae at the
atomic, or even at the subunit level. This lack of knowledge
0042-6822/$ - see front matter D 2005 Elsevier Inc. All rights reserved.
doi:10.1016/j.virol.2005.06.022
* Corresponding author. Department of Biological Sciences, Vanderbilt
University, Box 1634, Station B, Nashville, TN 37235, USA. Fax: +1 615
343 6707.
E-mail address: [email protected] (G. Stubbs).1 Present address: MRC Laboratory of Molecular Biology, Cambridge
CB2 2QH, UK.2 Present address: USDA-APHIS-PPQ, Center for Plant Health Science
and Technology, Raleigh, NC 27606, USA.
is in sharp contrast to the situation for the much more
tractable tobamoviruses (Namba et al., 1989; Wang et al.,
1997), or even the flexible potexviruses (Parker et al.,
2002).
Potyviridae virions are flexous rods, about 7500 A long
and 120 A in diameter, although these dimensions vary
among species. Early electron microscopic studies sug-
gested that the virions are helical assemblies of subunits,
with pitches of 34 T 1 A (Varma et al., 1968) or 32 T 1 A
(McDonald and Bancroft, 1977). Small aggregates of the
coat protein were shown to have sedimentation coefficients
corresponding to about 7 subunits (McDonald et al., 1976),
and this observation led early authors to suggest that the
viral helix contained 7 to 9 subunits per turn (for example,
Goodman et al., 1976). Such numbers in the early literature
are, however, very approximate, because of the considerable
uncertainties in both the parameters and the theory on which
they were based.
Wheat streak mosaic virus (WSMV) is an important
pathogen of wheat (Brakke, 1987), and a member of the
genus Tritimovirus in the family Potyviridae (Stenger et
al., 1998). The majority of the Potyviridae are aphid-
transmitted, but tritimoviruses are mite-transmitted. The
Tritimovirus genome shows consistent divergence from
other members of the Potyviridae, especially in the coat
005) 64 – 69
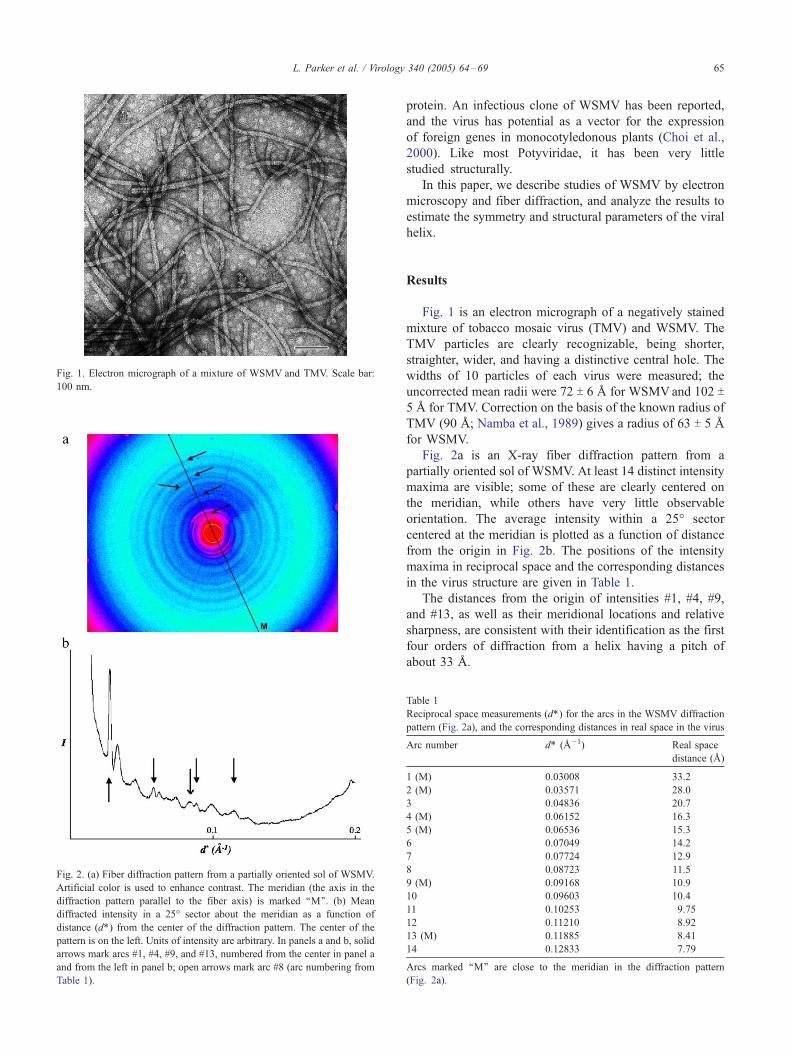
Fig. 1. Electron micrograph of a mixture of WSMV and TMV. Scale bar:
100 nm.
Fig. 2. (a) Fiber diffraction pattern from a partially oriented sol of WSMV.
Artificial color is used to enhance contrast. The meridian (the axis in the
diffraction pattern parallel to the fiber axis) is marked ‘‘M’’. (b) Mean
diffracted intensity in a 25- sector about the meridian as a function of
distance (d*) from the center of the diffraction pattern. The center of the
pattern is on the left. Units of intensity are arbitrary. In panels a and b, solid
arrows mark arcs #1, #4, #9, and #13, numbered from the center in panel a
and from the left in panel b; open arrows mark arc #8 (arc numbering from
Table 1).
L. Parker et al. / Virology 340 (2005) 64–69 65
protein. An infectious clone of WSMV has been reported,
and the virus has potential as a vector for the expression
of foreign genes in monocotyledonous plants (Choi et al.,
2000). Like most Potyviridae, it has been very little
studied structurally.
In this paper, we describe studies of WSMV by electron
microscopy and fiber diffraction, and analyze the results to
estimate the symmetry and structural parameters of the viral
helix.
Results
Fig. 1 is an electron micrograph of a negatively stained
mixture of tobacco mosaic virus (TMV) and WSMV. The
TMV particles are clearly recognizable, being shorter,
straighter, wider, and having a distinctive central hole. The
widths of 10 particles of each virus were measured; the
uncorrected mean radii were 72 T 6 A for WSMVand 102 T5 A for TMV. Correction on the basis of the known radius of
TMV (90 A; Namba et al., 1989) gives a radius of 63 T 5 A
for WSMV.
Fig. 2a is an X-ray fiber diffraction pattern from a
partially oriented sol of WSMV. At least 14 distinct intensity
maxima are visible; some of these are clearly centered on
the meridian, while others have very little observable
orientation. The average intensity within a 25- sector
centered at the meridian is plotted as a function of distance
from the origin in Fig. 2b. The positions of the intensity
maxima in reciprocal space and the corresponding distances
in the virus structure are given in Table 1.
The distances from the origin of intensities #1, #4, #9,
and #13, as well as their meridional locations and relative
sharpness, are consistent with their identification as the first
four orders of diffraction from a helix having a pitch of
about 33 A.
Table 1
Reciprocal space measurements (d*) for the arcs in the WSMV diffraction
pattern (Fig. 2a), and the corresponding distances in real space in the virus
Arc number d* (A�1) Real space
distance (A)
1 (M) 0.03008 33.2
2 (M) 0.03571 28.0
3 0.04836 20.7
4 (M) 0.06152 16.3
5 (M) 0.06536 15.3
6 0.07049 14.2
7 0.07724 12.9
8 0.08723 11.5
9 (M) 0.09168 10.9
10 0.09603 10.4
11 0.10253 9.75
12 0.11210 8.92
13 (M) 0.11885 8.41
14 0.12833 7.79
Arcs marked ‘‘M’’ are close to the meridian in the diffraction pattern
(Fig. 2a).

L. Parker et al. / Virology 340 (2005) 64–6966
Discussion
Diffraction patterns
Although the information content of the diffraction pattern
in Fig. 2a is limited, it is remarkably high for a member of the
Potyviridae. At least fourteen diffraction arcs are evident, and
most can be classified as near-meridional or off-meridional.
In contrast, there are no published fiber diffraction patterns
from any other potyvirus, and our own unpublished fiber
diffraction patterns from potato virus Y (PVY) show only a
single near-meridional diffraction peak, corresponding to arc
#1 in Fig. 2a. Optical diffraction patterns from electron
micrographs have been similarly limited, showing only a
single intensitymaximum (Varma et al., 1968;McDonald and
Bancroft, 1977).
A comparison of the coat protein (CP) amino acid
sequences of WSMV (GenBank accession no. AF034415;
Stenger et al., 1998) and PVY (Shukla et al., 1986) suggests
a structural explanation for the improved WSMV diffraction
pattern. Although the sequences show a high degree of
similarity, WSMV-CP includes an N-terminal extension of
about 70 residues, which is probably on the outer surface of
the virion (Shukla et al., 1988). The extension presumably
protrudes from the otherwise smooth surface of the virion,
and although it may be somewhat disordered, the protru-
sions could provide sufficient surface structure to give rise
to the more detailed diffraction pattern that we observe.
Fiber diffraction
Diffraction patterns from disoriented specimens such as
those used in this work may be better understood by
considering a diffraction pattern from a highly oriented
Fig. 3. Fiber diffraction pattern from tobacco mosaic virus (Namba et al.,
1989), illustrating the different parts of a fiber diffraction pattern, including
the equator (E, the R axis), the meridian (the Z axis), a near-meridional
layer line (M), and an off-meridional layer line (O).
helical assembly, TMV. The diffraction takes the form of
layer lines (Fig. 3). We define reciprocal space coordinates
R (distance from the meridian, or Z axis) and Z. The layer
line passing through the origin (E in Fig. 3) is called the
equator. ZN is the value of Z for layer line N. In Fig. 2, the
diffraction pattern is smeared into arcs and rings because the
particles in the diffracting specimen are not well aligned
with respect to each other.
The diffraction pattern of a helix is characterized by a
series of equally spaced near-meridional layer lines, the first
of which is marked M in Fig. 3. The spacing is inversely
proportional to the pitch of the helix, the distance between
consecutive turns (Chandrasekaran and Stubbs, 2001). If, as
is usually the case, the number of subunits in each turn of
the helix u is not integral, there are additional, off-
meridional layer lines between the near-meridional lines;
the first of these is marked O in Fig. 3. For the purposes of
this discussion, the first off-meridional layer line O is the
layer line closest to the meridian between the equator and
the first near-meridional layer line. It is not necessarily the
layer line closest to the equator. If u = ui + Du, where ui is
an integer and Du is between 0 and 1, then Du = ZO/ZM. If
Du < 0.5, the first off-meridional layer line is closer to the
equator, but if Du > 0.5, it is closer to the first near-
meridional layer line. In the diffraction pattern of a helix, ZO
is not only the position of the first off-meridional layer line,
but is also the distance in Z between any near-meridional
layer line and the adjacent off-meridional layer lines.
Morphology and dimensions of the virion: radius
The radius of the WSMV virion from the electron
micrographs (Fig. 1) is 63 T 5 A, comparable to the
values reported for other potyviruses. Potyviral radii
measured by electron microscopy vary somewhat, and
the coat protein molecular weights vary significantly, but
the variations are not well correlated. The source of the
inconsistency appears to be the fact that the N- and C-
terminal segments of the protein are exposed, and perhaps
disordered, so that stain can readily penetrate the virion.
In support of this hypothesis, removal of the N-terminal
segment of Johnson grass mosaic virus (JGMV) by trypsin
does not affect the morphology or apparent diameter of
the virion (Shukla et al., 1988). JGMV, like WSMV, is a
member of the Potyviridae with a relatively large coat
protein (303 residues).
Morphology and dimensions of the virion: helical pitch
Arcs #1, #4, #9, and #13 in Fig. 2a may be interpreted on
the basis of their locations, their sharpness, and their regular
spacing as near-meridional layer lines, orders of the
diffraction due to the helical pitch of the virus. The pitch
is the reciprocal of the spacing of these arcs in Z, but in a
diffraction pattern from a poorly oriented specimen, Z
cannot be measured directly. However, d*, the distance of

L. Parker et al. / Virology 340 (2005) 64–69 67
the intensity from the origin, can be measured accurately
(Fig. 2b; Table 1). Since Z = �(d*2 � R2), Z can be
determined if an estimate of R is available.
R can be estimated if we know the real space radius r of
the diffracting electron density and the Bessel order n
contributing to the layer line; the diffracted intensity is
assumed to be the first maximum of the Bessel function of
order n and argument 2krR (Chandrasekaran and Stubbs,
2001). For the series of near-meridional lines arising from
the helical pitch, n = 1, 2, 3, etc. At low resolution,
diffraction arises primarily from the high contrast between
the electron densities of protein and water, so r is close to
the outer radius of the virus. We considered values for r
between 40 A and 63 A; the choice of r within this range
was not found to be critical. The helical pitch determined in
this way from the position of each near-meridional layer line
is given in Table 2.
From Table 2, the pitch of the WSMV helix is 33.4 A T0.6 A. The uncertainty comes primarily from the variation
among the values from the different layer lines, with small
additional components from the uncertainties of measure-
ment and the choice of the value for r.
Symmetry of the virion from stoichiometry
We can make a rough estimate of the number of subunits
per turn of the viral helix, u, by considering the pitch of the
helix, the diameter of the virion, and the molecular weight
of the coat protein. We can ignore other parameters (such as
the shape and density of the protein and the mass of the
RNA) by making the reasonable assumption that the values
of these parameters in the Potyviridae are the same as those
in the better characterized tobamoviruses and potexviruses.
Given this assumption, if two viruses have helical
symmetries u1 and u2, helical pitches p1 and p2, viral radii
r1 and r2, and coat protein molecular weights M1 and M2,
then
u2 ¼r22 Ip2IM1
r21 Ip1IM2
u1:
The usefulness of this equation may be illustrated by
calculating the symmetry of potato virus X (PVX) fromTMV.
In this case, u1 (for TMV) = 16.34, p1 = 23 A, r1 = 90 A, and
M1 = 17,500 (references from Namba et al., 1989), while p2 =
Table 2
Helical pitch of the WSMV virion determined from the spacing of the near-
meridional layer lines
Arc d* (A�1) Rmax (A�1) Z (A�1) Pitch (A)
#1 0.0301 0.00585–0.00465 0.02950–0.02971 33.9–33.7
#4 0.0615 0.00974–0.00773 0.06074–0.06103 32.9–32.8
#9 0.0917 0.01337–0.01061 0.09070–0.09106 33.1–32.9
#13 0.1189 0.01693–0.01344 0.11764–0.11809 34.0–33.9
d* was measured from the diffraction pattern in Fig. 2a; R, Z, and pitch
were determined as described in the text. Ranges given are for r varying
between 40 A and 63 A.
34.5 A, r2 = 65 A, andM2 = 25,120 (Parker et al., 2002, and
references therein). u2 is calculated to be 8.9, in excellent
agreement with the experimentally determined value (Parker
et al., 2002).
For PVY, if p2 = 33 A (Varma et al., 1968; McDonald
and Bancroft, 1977), r2 = 60 A, and M2 = 29,945 (Shukla et
al., 1986), u2 is calculated by comparison with TMV to be
6.1. A similar calculation for WSMV, with p2 = 33.4 A, r2 =
63 A, andM2 = 42,540 (Stenger et al., 1998), gives u2 = 4.8.
This value is almost certainly too low, however: PVY and
WSMV should have very similar symmetries, as is the case
for all related viruses. Furthermore, from a comparison of
the coat protein molecular weights, we would expect the
radius of WSMV to be about 20% greater than that of PVY.
We do not observe any such difference by electron micro-
scopy (data not shown), again supporting the hypothesis that
the long N-terminal extension of WSMV-CP is not visible.
We can correct for three sources of systematic error in
these calculations. The first two are the value of the radius to
be used for a potyvirus and the appropriate value of M. A
more appropriate set of parameters for the calculation can be
taken from the trypsin-resistant core of PVY: we take M2 =
24,728, and r2 = 55 A (Shukla et al., 1988). The third source
of uncertainty is the shape of the virion surface. Electron
micrographs show the PVY virion to be smooth and
featureless, suggesting that it lacks the pronounced grooves
that are characteristic of potexviruses (Parker et al., 2002)
and tobamoviruses (Namba et al., 1989). This suggestion is
consistent with our observation that diffraction patterns
from PVY samples indicate very little low-resolution
contrast. It is therefore more appropriate to use r1 = 85 A
(the radius of a smooth virion having the symmetry, pitch,
and molecular weight of TMV). The principal remaining
source of uncertainty is in the viral radius determined by
electron microscopy, estimated to be T5 A.
With these parameters, the calculation above gives a
value of 6.9 T 1.3 for u.
Symmetry of the virion from the diffraction pattern
A precise but ambiguous estimate of u may be obtained
by considering off-meridional intensities in the diffraction
pattern. Intensity #8 (Fig. 2) is particularly informative: its
angular spread about the meridian is quite comparable to
that of #9 (the third order of the helical pitch diffraction),
but it is slightly closer to the origin. Even though the
disorientation is too great to allow layer lines to be
distinguished, intensity #8 must come from a layer line at
slightly lower Z than the near-meridional layer line giving
rise to #9. As discussed above (Fiber diffraction), determi-
nation of Z values for arcs #8 and #9 would allow us to
determine ZO and thus Du.
Z can be determined from d* and R as described
above (Helical pitch). For off-meridional intensities, n
depends on the helical symmetry of the diffracting object.
Again, at low resolution, r is close to the outer radius of

Table 3
Determination of u, the number of subunits per turn of the viral helix. u is
determined from the position of intensity #8 (Table 1), and depends upon
the values of ui and n that are assumed to give rise to this intensity
ui n R (A�1) Z (A�1) h (-) Du u
5 8 0.027–0.035 0.080–0.083 18–25 0.23–0.33 5.3
3 0.012–0.015 0.086–0.086 8–10 0.87–0.89 5.9
6 9 0.030–0.039 0.078–0.082 20–26 0.26–0.39 6.3
4 0.015–0.019 0.085–0.086 10–13 0.84–0.87 6.9
7 10 0.033–0.043 0.076–0.081 22–29 0.30–0.46 7.4
5 0.018–0.023 0.084–0.085 12–15 0.81–0.85 7.8
8 11 0.036–0.046 0.074–0.080 24–32 0.34–0.53 8.4
6 0.021–0.027 0.083–0.085 14–18 0.77–0.83 8.8
For any given u, there are two possible values of n, as discussed in the text.
Determination of R and Z is described in the text. h = tan�1 (R/Z) (the
angle between the meridian and the line between the origin and the
reflection. r is assumed to be between 44 A and 57 A; this range is the
reason for the ranges shown. The error in u is estimated to be about 0.1; this
uncertainty is derived primarily from uncertainties in measurement, with
only a small contribution from uncertainties in the value of r.
L. Parker et al. / Virology 340 (2005) 64–6968
the virus. Examination of TMV data shows that the
positions of off-meridional low-resolution peaks in the
TMV diffraction pattern are best predicted by taking r to
be 70–85% of the outside radius of the virion. We
therefore considered values of 44 A and 57 A for r in
WSMV. Once again, the choice of r is not critical. On the
basis of the stoichiometric data presented above, we
consider values for ui of 5, 6, 7, and 8.
It may be shown (Klug et al., 1958; Chandrasekaran and
Stubbs, 2001) that the off-meridional layer lines closest to
the meridian between the second and third near-meridional
lines have n = ui + 3 or ui � 2. In Table 3, values of u
calculated from the position of intensity #8 are given for
each possible n arising from this range of u values. Table 3
also includes the values of h, the expected angle between
the meridian and the center of the diffracted intensity. The
observed angular width of the arc will obviously be highly
correlated with h. Given the assumptions made here, u
could take any of the values given in the last column of
Table 3. However, the values of h for the higher values of n
in Table 3 are not consistent with the diffraction pattern; it is
evident from Fig. 2a that intensity #8 has an angular spread
about the meridian only slightly greater than intensity #9,
and h for intensity #9 (the third near-meridional) can be
calculated from the data in Table 2 to be close to 9-.
Conclusion
Notwithstanding the high disorientation of the WSMV
fiber, the diffraction pattern clearly shows that the virus is
helical, with a pitch of 33.4 T 0.6 A. Stoichiometric
considerations suggest that there are 6.9 T 1.3 subunits per
turn of the helix, and the diffraction pattern suggests that
this number is most probably 6.9 T 0.1, although we cannot
eliminate the possibility that there are 5.9 T 0.1 or 7.8 T 0.1
subunits per turn.
Materials and methods
Virus purification
WSMV (Washington isolate) was grown in Triticum
aestivum var. Stevens, and purified as described for
rymoviruses by Berger and Shiel (1998).
Electron microscopy
Electron micrographs were taken using a Philips CM12
transmission electron microscope operating at 80 kV. Ten Alof mixed WSMV and TMV at a total concentration of 0.5
mg/ml was placed on a 400-mesh carbon-coated copper grid
(EM Sciences), stained with 0.05% uranyl formate and 1%
uranyl acetate, and blotted. Images were recorded at a
nominal magnification of 110,000�.
Virion diameters were determined using the public
domain program NIH Image (developed at the U.S. National
Institutes of Health, http://rsb.info.nih.gov/nih-image/).
Images of individual virions were selected and the distances
between lines describing parallel edges of the virions were
determined. The reported diameters were averages of 10
virions from at least four different micrographs. Measure-
ments of TMV diameters (Namba et al., 1989) were used to
calibrate the system. While the method used to determine
diameters was subject to systematic technical and subjective
errors, these errors were minimized by the calibration, and
the most important measurements for the calculations in this
work are the relative radii of WSMV and TMV.
Fiber diffraction
Partially oriented sols for fiber diffraction were prepared
by the method of Yamashita et al. (1998), as described by
Parker et al. (2002). Soft pellets were prepared by
centrifuging virus solutions at 5000�g for 21 h. The
solutions were 7 mg/ml in virus, 0.5 M in NaCl, and 10
mM in sodium citrate pH 8.0. Virus from a pellet was drawn
into a glass capillary and moved back and forth by
aspiration (Gregory and Holmes, 1965). The capillaries
were sealed, then centrifuged at 4000�g for about 90 h.
About half of the column (the more dilute region at the top
of the sample) was removed, and the capillary was re-sealed.
The capillaries were exposed to a magnetic field of 18.8 T
(inside an 800 MHz NMR instrument, Bruker, Germany) for
4–8 weeks. Preliminary assessments of orientation were
made using a polarizing microscope (Gregory and Holmes,
1965).
Fiber diffraction data were collected at the BioCAT beam
line of the Advanced Photon Source synchrotron, Argonne
National Laboratory, as described by Parker et al. (2002).
Data were analyzed using NIH Image for direct measure-
ments and the program WCEN (H. Wang and G. Stubbs,
unpublished) for measurements in reciprocal space. Dis-
tances measured from the diffraction patterns were cali-

L. Parker et al. / Virology 340 (2005) 64–69 69
brated by recording a diffraction pattern from PVX using the
same camera; the uncertainty in these measurements was
estimated to be about 1%.
Acknowledgments
We thank Markus Voehler and the Vanderbilt University
Biomolecular NMR Facility for access to high-field
magnets, and Tom Irving and the staff of BioCAT for help
with data collection. This work was supported by grant
MCB-0235653 from the National Science Foundation.
Work performed at the University of Idaho was supported,
in part, by the Idaho Agricultural Experiment Station and
the Idaho Wheat Commission. Use of the Advanced Photon
Source was supported by the U.S. Department of Energy
under contract No. W-31-109-ENG-38. BioCAT is a
National Institutes of Health-supported Research Center
RR-08630.
References
Barnett, O.W., 1992. Potyvirus Taxonomy. Springer-Verlag, Vienna.
Berger, P.H., Shiel, P.J., 1998. Potyvirus isolation and RNA extraction.
Methods Mol. Biol. 81, 151–160.
Brakke, M.K., 1987. Virus disease in wheat. In: Heyne, E.G. (Ed.), Wheat
and Wheat Improvement, Am. Soc. Agronomy, Crop Sci. Soc. of
America, Soil Sci. Soc. of America, Madison, pp. 585–603.
Chandrasekaran, R., Stubbs, G., 2001. Fibre diffraction. In: Rossman,
M.G., Arnold, E. (Eds.), International Tables for Crystallography,
Crystallography of Biological Macromolecules, vol. F. Kluwer Aca-
demic Publishers, The Netherlands, pp. 444–450.
Choi, I.-R., Stenger, D., Morris, J., French, R., 2000. A plant virus
vector for systemic expression of foreign genes in cereals. Plant J.
23, 547–555.
Goodman, R.M., McDonald, J.G., Horne, R.W., Bancroft, J.B., 1976.
Assembly of flexuous plant viruses and their proteins. Philos. Trans. R.
Soc. London, B 276, 173–179.
Gregory, J., Holmes, K.C., 1965. Methods of preparing oriented tobacco
mosaic virus sols for X-ray diffraction. J. Mol. Biol. 13, 796–801.
Klug, A., Crick, F.H.C., Wyckoff, H.W., 1958. Diffraction by helical
structures. Acta Cryst. 11, 199–213.
McDonald, J.G., Bancroft, J.B., 1977. Assembly studies on potato virus Y
and its coat protein. J. Gen. Virol. 35, 251–263.
McDonald, J.G., Beveridge, T.J., Bancroft, J.B., 1976. Self-assembly of
protein from a flexuous virus. Virology 69, 327–331.
Namba, K., Pattanayek, R., Stubbs, G., 1989. Visualization of protein-
nucleic acid interactions in a virus; refinement of intact tobacco mosaic
virus structure at 2.9 A resolution by X-ray fiber diffraction. J. Mol.
Biol. 208, 307–325.
Parker, L., Kendall, A., Stubbs, G., 2002. Surface features of potato virus X
from fiber diffraction. Virology 300, 291–295.
Pogue, G.P., Lindbo, J.A., Garger, S.J., Fitzmaurice, W.P., 2002. Making an
ally from an enemy; plant virology and the new agriculture. Annu. Rev.
Phytopathol. 40, 45–74.
Shukla, D.D., Inglis, A.S., McKern, N.M., Gough, K.H., 1986. Coat protein
of potyviruses: 2. Amino acid sequence of the coat protein of potato
virus Y. Virology 152, 118–125.
Shukla, D.D., Strike, P.M., Tracy, S.L., Gough, K.H., Ward, C.W., 1988.
The N and C termini of the coat proteins of potyviruses are surface-
located and the N terminus contains the major virus-specific epitopes. J.
Gen. Virol. 69, 1497–1508.
Shukla, D.D., Ward, C.W., Brunt, A.A., 1994. The Potyviridae. CAB
International, Wallingford, UK.
Stenger, D.C., Hall, J.S., Choi, I.-R., French, R., 1998. Phylogenetic
relationships within the family Potyviridae: wheat streak mosaic virus
and brome streak mosaic virus are not members of the genus
Rymovirus. Phytopathology 88, 782–787.
Wang, H., Culver, J.N., Stubbs, G., 1997. Structure of ribgrass mosaic virus
at 2.9 A resolution. Evolution and taxonomy of tobamoviruses. J. Mol.
Biol. 269, 769–779.
Varma, A., Gibbs, A.J., Woods, R.D., Finch, J.T., 1968. Some observations
on the structure of the filamentous particles of several plant viruses.
J. Gen. Virol. 2, 107–114.
Yamashita, I., Suzuki, H., Namba, K., 1998. Multiple-step method for
making exceptionally well-oriented liquid-crystalline sols of macro-
molecular assemblies. J. Mol. Biol. 278, 609–615.