wheat price policy in the united states - agecon search
TRANSCRIPT

Wheat Price Policy in the United StatesBy George Montgomeryl
Policy denotes a course of action. Agricultural policy refersto actions of the federal government affecting the agriculturalindustry. Policy may be divided into two phases: direct price-income programs and general resource programs. This discussiondeals with one phase of agricultural policy; namely, price policy.Consideration is limited to one major commodity, wheat.
Appraisal of policy requires analysis of:
1. What we have; the situation or statement of the problem.2. What we want; objectives or goals.3. How to get what we want; means or programs.
Discussion of wheat price policy will be developed underthese three headings.
THE PAST
A historical review of the development of the wheat industrymay contribute to fuller understanding of the conditions creatingthe wheat surplus as it has existed during the last generation.Opening of the western Mississippi Valley after the Civil Warprovided opportunity for wheat to be pushed westward into theGreat Plains. Expansion of wheat farming in this area was en-couraged by:
1. Availability of large areas of fertile land.
2. The perfection of the binder and improved tillage equip-ment.
3. Railroads which provided access to world markets throughthe terminals of Chicago, Minneapolis, Omaha, andKansas City.
4. Development of future trading and warehousing whichprovided a continuous though not always satisfactory mar-ket.
5. Introduction of hard winter wheat and improved millingpractices.
1Assistant Professors James 0. Bray and John H. McCoy assisted in the prepara-tion of the information presented in this paper. The comments and conclusions arethe author's.
25

Available markets both at home and abroad existed for thewheat produced as a result of these favorable factors. The pop-ulation of the United States expanded rapidly during the latterpart of the last century and the early years of the current centuryas a result of immigration and a high domestic birth rate. Manu-facturing and industrial progress stimulated the growth of cities.Migration of farm population to urban areas increased the mar-ket demand for food. Bread was an important element in thediet of a growing active population. European countries wereactive buyers of United States wheat. Dollars were available fromthe principal and interest payments on loans made for industrialand commercial development of America. The United Stateshad not as yet become "100 percent self sufficient." It was nat-ural to exchange wheat for equipment and goods from othercountries. Even after Canada and Argentina entered the worldmarket in the early part of this century, we sold 20 to 25 percentof our wheat crop into the world market. Annual exports ofwheat, including flour, were in excess of 100 million bushels priorto the outbreak of World War I. Exports for the period 1914through 1922 exceeded 200 million bushels per year with theexception of 1917, a year of crop failure.
This golden era reached a climax with the end of WorldWar I. The crop failure of 1917 coincided with the period ofacute demand for food by the Allies, and wheat prices soared to$3.00 per bushel. During the war a guaranteed price of $2.20per bushel was established. This became in effect a fixed price.This guaranteed and favorable price encouraged the turning ofnative sod in the semi-arid areas in the western Great Plains intowheat fields during and immediately following the war. Theguaranteed price was withdrawn prior to the harvest of 1920,and during the summer of that year wheat prices declined ap-proximately 50 percent. However, new land continued to bebrought into production in the Great Plains. Mechanization, con-sisting of the rapid introduction of combines, tractors, and truckswas an important factor, but improved varieties, early plowing,better tillage practices, and summer fallow also contributed tolower per bushel cost of production.
After early 1920 demand factors were less favorable to wheatfarmers. The export market shrank after the United States be-came a creditor nation and dollars became scarce to European
26

buyers. Industrial expansion had progressed rapidly during andafter World War I, and American consumers preferred to buydomestically produced goods. Later, particularly during the de-pression period, many of our former customers, especially Ger-many and Italy, attempted to encourage production of wheatwithin their own countries by restricting imports and by guaran-teeing their farmers prices well above the free market price ofwheat. Canada and Argentina became more aggressive competi-tors in the world market. Canada was an effective competitor notonly in number of bushels exported but also in terms of qualityof wheat.
Exports were no longer able to take up the slack of domesticsurplus. Per capita consumption had declined during WorldWar I and continued to move downward. As prices declined,agitation for solution to the surplus problem resulted in numerousproposals of price supporting schemes. The Agricultural Market-ing Act of 1929 created the Federal Farm Board with a revolvingfund of a half billion dollars for the purpose of stabilizing pricesof farm products. However, the onset of world-wide depressionand abundant production in 1931 made these efforts futile. After1933 the surplus stocks accumulated during the early thirtieswere removed by successive crop failures. Acreages remainedlarge, and burdensome stocks accumulated again prior to the out-break of World War II. These stocks were utilized in the earlywar years for livestock feed and for industrial alcohol (Table 1).
THE PROBLEM
The wheat problem of the United States is one of surplusproduction. Wheat is basically a cereal crop or bread grain. Thequantity of wheat produced averages substantially more thanthe domestic consumption as human food. In several recent years,the annual production has been almost two and a half times thequantity consumed for food. Outlet for the surplus or excessoutput is to be found only in the demand for food in foreigncountries or in secondary uses such as livestock feed or industrialuses in the United States.
Production of wheat fluctuates widely from year to year as aresult of weather influences and variations in acreage seeded.Seeded acreage for the major wheat producing regions is shownin Table 2. In 1933 United States production was 552 million
27

bushels. In 1947 the crop was 1,359 million bushels or two anda half times the 1933 production (Table 3).
The demand for wheat is highly inelastic. Under free marketconditions a small increase in quantity produced or offered forsale causes a substantial decline in price. Conversely, a temporaryscarcity resulting from crop failure causes sharp price increases.Such price increases, even though of relatively short duration,may stimulate income expectations among farmers which are notjustified on the basis of long-run demand and supply relation-ships. Farmers' expectations, or hopes for prosperity, are stimu-lated also by periodic emergency conditions, such as in the lastten years when outlets at satisfactory prices were provided forthe output from expanded acreages. This, along with the varia-tions in yield resulting from weather influences, has complicatedthe problem of adjusting resources devoted to wheat production,either in line with domestic requirements or in line with domesticrequirements plus normal or subsidized exports.
The conditions under which wheat is produced and the na-ture of the demand curve result in wide variations in income towheat farmers, individually and by regions. Basically the requestof wheat farmers for assistance from the federal governmentarises from the desire for or need of protection from drastic varia-tions in income. Since income to individual farmers is highlyvariable, the stakes or rewards are large for those who have re-serves or who can "weather" adversity during periods of lowyields and low prices. This explains the large individual incomesin the specialized wheat regions during the last ten years. It alsomakes the adjustment of resources devoted to wheat productiondifficult. Wheat farmers who lived through the thirties to enjoythe rewards of the forties may be reluctant to reduce acreage by30 or 40 percent. Capitalization of income of the last ten yearsinto land prices and increased investment in equipment add tothe complexity of the problem.
Use of Resources-The Supply Problem
The wheat problem is primarily one of resource allocation onthe supply side and inelasticity of demand on the income side.These two phases of the problem will be examined in more de-tail. Allocation of resources devoted to wheat production isinfluenced by production uncertainty, price uncertainty, tech-
28

nological change, the competitive situation prevailing in theproduction and marketing of wheat, and the fluctuations in thesize of reserve stocks or carry-over from year to year.
Production uncertainty is a major risk for most wheat farm-ers, especially in the Great Plains states. The farmer has littleassurance about his crop until the combine has made the firstround. Unlike the manufacturer he cannot decide to produce agiven number of units. Total wheat production is a function ofyield and acreage seeded. Yield reflects the influence of a num-ber of factors, including natural phenomena (weather, insects,and disease) over which the farmer has little control, and pro-duction practices (fallow, tillage, fertilizer, and variety) overwhich he has control. Natural phenomena cause wide fluctua-tions in abandonment (Tables 4 and 5), which is reflected inyield per seeded acre. Acreage seeded is influenced by a numberof factors, such as price expectation and anticipation for normalor above average yields for the future. Price expectations areassumed to be related to past prices. In recent years they havebeen influenced by announced levels of price supports. In areaswhere moisture is the limiting factor, rainfall or soil moisture atseeding time affects anticipation or hope for normal yields.
In only one year prior to 1943 did we produce more than abillion bushels of wheat. In only one year since 1943 have wefailed to produce a billion bushels, and in that year the billionbushel mark was missed by only 19 million bushels. For the fouryears of 1933, 1934, 1935, and 1936 the average total productionin the United States was 584 million bushels, on a seeded acreageof 69 million acres. The largest production in this period was630 million bushels produced from 74 million seeded acres. Theaverage yield for the four years was slightly less than 8.5 bushelsper seeded acre. If we contrast these years with the four "best"years, we find the average annual production for the period 1945through 1948 was 1,228 million bushels or more than twice aslarge as the output for the four years of small crops. Seedings inthese years of large crops averaged about 74 million acres andthe yield per seeded acre was 16.5 bushels. The largest outputwas 1,358 million bushels in 1947 from 78.3 million acres seeded.
Acreage seeded to wheat has ranged from 53 million acresfor the 1942 crop to 84 million acres for the 1949 crop. Plant-ings for the 1953 crop were 78.6 million acres. On the basis of
29

straight line trends, the rate of increase has been essentially thesame for all regions since 1940. Prior to that differences wereevident.
In recent years variations in seeding of hard winter wheathave ranged from 23.2 million acres for the 1942 crop to 39.3million acres planted for the 1949 crop. Seedings in the fall of1952 were 34.3 million acres. Seeding of spring wheat has variedfrom 14.7 million to 22.7 million acres with current seedings esti-mated at 21.5 millions. Acreages of soft wheat varied from 8.2million to 11.1 million acres. Plantings for the current season are10.6 million acres. The Pacific Northwest has increased plantingsfrom 3.5 million acres in 1942 to 6 million acres for the currentseason (Table 2).
Farmer decision in regard to acreage to be seeded is an im-portant factor in the wheat problem. It is difficult to demonstratestatistically the factors entering into farmers' decisions. Pastprices and expectation of prices for the next season are assumedto be major factors in the decision-making process. However, ifacreage seeded is plotted with price the preceding season, for theperiod 1910 to date, evidence of association is not conclusive.There was an upward trend of acreage in the Great Plains statesduring the twenties as mechanization progressed, and acreagesremained large in spite of low prices and low yields during thedepression period. However, if the period since the depressionis analyzed, there does appear to be consistent association betweenacreage seeded and price (deflated) for the preceding season.2
Because of the importance of this question to the wheat sur-plus problem, study was given to the degree of association forthe period 1936 to 1951. Correlation analyses of acreage seededand the price the preceding season were made by regions forthis period (Table 6). The coefficient of correlation for theseareas was highly significant for the hard winter wheat area andthe Pacific Northwest, and significant for the spring wheat area.The correlation of acreage seeded and price the preceding sea-son (deflated) is highest in the hard red winter wheat area. For
2It is recognized that the period considered was one of generally rising prices.While it appears that rising prices were accompanied by increasing acreage, it does notnecessarily follow that declines in prices will be associated with similar decreases inacreage in the short run. High fixed costs incurred in a period of expansion, and pos-sibly other considerations, may tend to induce farmers to maintain production inperiods of declining prices.
30

the period 1936 to date, a 10 cent change in the deflated priceof wheat is associated with a change in plantings of 1.7 millionacres (equals 5.4 percent of average acreage). In the PacificNorthwest, the relationship is about the same as in the hard redwinter wheat area. For the period 1936 to date, a 10 cent changein the deflated price appears to be associated with a change inplantings of 280 thousand acres, or 5.7 percent of average acre-age. Percentage-wise the response is about the same in both re-gions. In the spring wheat area the degree of relationship is lesspronounced, and the amount of change is less than in either thehard winter wheat area or the Pacific Northwest. There aretwo periods of acreage increases-1936, 1937, and 1938; and1949 and 1951-which were not associated with prices the pre-ceding season. In the soft red winter wheat area there appearsto be little relationship between seeded acreage and price thepreceding year for the period 1936-51 as a whole. However, from1942 to 1951 the data indicate that higher prices were associatedwith increases in acreage.
Plantings of wheat are influenced also by price for longerperiods than the preceding season. The relationship of the price(deflated) for the second season preceding is similar to that ofthe preceding season. This suggests that a prolonged period offavorable prices tends to have an accumulative influence on acre-age planted.
In Ford County, Kansas, a 10 cent change in price (deflated)the preceding season appears to be associated with a change inacreage seeded of 17,230 acres or 4.6 percent of the averageacreage. 3 However, in this county acreages planted for the 1936,1937, and 1938 crops increased more than would have been ex-pected on the basis of price the preceding season. This may beexplained in part by previous crop failures and the urgent needfor cash income during that period. Comparable data were notavailable for a similar period for a county in the soft wheat area.
Annual yield is one of the two major factors determining in-come of wheat farmers. Yields and selling price determine grossincome. Net income, of course, is influenced by operating costs.
3In Ford County r = +.578, which is significant. The coefficient of regressionwas +1.723. This means that a change in price of one cent was associated with achange, in the same direction, of 1.723 thousand seeded acres. Therefore, a changein price of 10 cents was associated with a change of 17,230 seeded acres. A change of17,230 acres is 4.6 percent of the average acreage seeded to wheat.
31
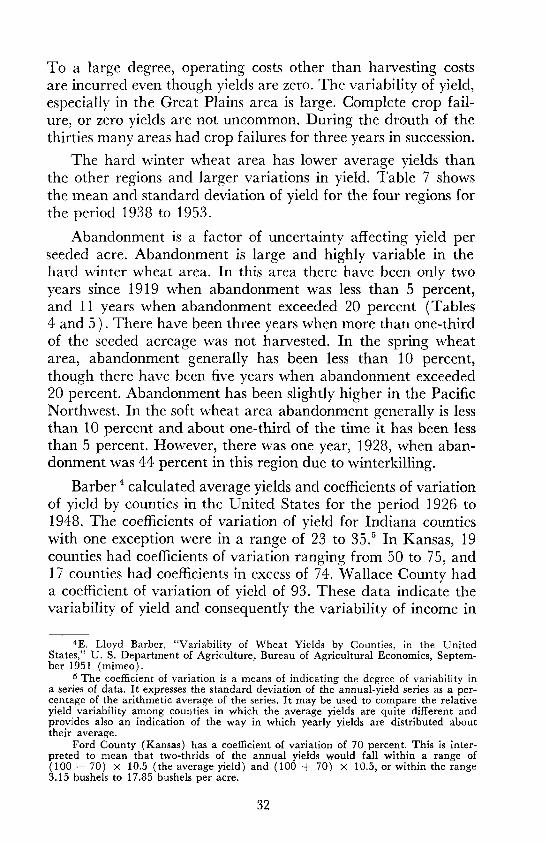
To a large degree, operating costs other than harvesting costsare incurred even though yields are zero. The variability of yield,especially in the Great Plains area is large. Complete crop fail-ure, or zero yields are not uncommon. During the drouth of thethirties many areas had crop failures for three years in succession.
The hard winter wheat area has lower average yields thanthe other regions and larger variations in yield. Table 7 showsthe mean and standard deviation of yield for the four regions forthe period 1938 to 1953.
Abandonment is a factor of uncertainty affecting yield perseeded acre. Abandonment is large and highly variable in thehard winter wheat area. In this area there have been only twoyears since 1919 when abandonment was less than 5 percent,and 11 years when abandonment exceeded 20 percent (Tables4 and 5). There have been three years when more than one-thirdof the seeded acreage was not harvested. In the spring wheatarea, abandonment generally has been less than 10 percent,though there have been five years when abandonment exceeded20 percent. Abandonment has been slightly higher in the PacificNorthwest. In the soft wheat area abandonment generally is lessthan 10 percent and about one-third of the time it has been lessthan 5 percent. However, there was one year, 1928, when aban-donment was 44 percent in this region due to winterkilling.
Barber 4 calculated average yields and coefficients of variationof yield by counties in the United States for the period 1926 to1948. The coefficients of variation of yield for Indiana countieswith one exception were in a range of 23 to 35.5 In Kansas, 19counties had coefficients of variation ranging from 50 to 75, and17 counties had coefficients in excess of 74. Wallace County hada coefficient of variation of yield of 93. These data indicate thevariability of yield and consequently the variability of income in
4 E. Lloyd Barber, "Variability of Wheat Yields by Counties, in the UnitedStates," U. S. Department of Agriculture, Bureau of Agricultural Economics, Septem-ber 1951 (mimeo).
5 The coefficient of variation is a means of indicating the degree of variability ina series of data. It expresses the standard deviation of the annual-yield series as a per-centage of the arithmetic average of the series. It may be used to compare the relativeyield variability among counties in which the average yields are quite different andprovides also an indication of the way in which yearly yields are distributed abouttheir average.
Ford County (Kansas) has a coefficient of variation of 70 percent. This is inter-preted to mean that two-thrids of the annual yields would fall within a range of(100 - 70) x 10.5 (the average yield) and (100 + 70) x 10.5, or within the range3.15 bushels to 17.85 bushels per acre.
32

areas of the hard winter wheat area, where risk and uncertaintyare great.
Price uncertainty is another risk over which farmers indi-vidually have little or no control. Fluctuations in wheat pricesare sudden and substantial. Ironically, for the last twenty yearslow prices appear to have been associated with low yields, andhigh prices with high yields. The period 1934 through 1936 wasa period of low yields in the Great Plains area. During thistwenty-year period prices were highest in 1947, a year of recordproduction. In that year production was more than two and ahalf times the average production of 1934, 1935, and 1936. Theprice was four times as high.
Variability of production and inelastic demand cause drasticfluctuations in wheat prices from season to season. Immediatelyprior to World War I the season's average farm price of wheatranged from 80 cents to one dollar. During and immediately fol-lowing World War I, the farm price exceeded or was near $2.00per bushel. For the 1922 and 1923 seasons, the farm price was92 cents and 96 cents. For the next four seasons, it averaged from$1.20 to $1.40. For the 1931 and 1932 seasons, the average farmprice was 38 cents. After three crop failures in the Great Plainsarea, the season's average price reached $1.02 in 1936, but de-clined to 55 cents in 1938. For the last seven seasons, the averagefarm price has been near or exceeded $2.00 per bushel. The high-est average was for the season of 1947 with a price of $2.29.During part of the recent period, the price has been held up bythe loan, but in other periods, as in 1947 and 1948, export de-mand pushed prices above support levels.
In addition to substantial fluctuations in average seasonalprices, wheat prices are subject to sudden and sharp fluctuationswithin seasons. Frequently these fluctuations, in farmers' mindsat least, cannot be associated with identifiable causes, i.e., theycannot be explained by changes in the supply or demand situa-tion. For example, wheat prices advanced sharply when WorldWar II began in September 1939, yet when the war spread asGermany moved into the low countries in May 1940, wheatprices declined sharply. There was no significant change in theactual supply situation, but psychological appraisals of the situa-tion changed sharply. Prior to the bank holiday cash wheatprices at Kansas City were less than 50 cents. On July 19, 1933,
33

No. 2 hard wheat at Kansas City was $1.18. Five days later, thetop price was 89.5 cents. For long periods farmers have beenunhappy about having their major source of income influencedin this manner.
Examination of variation in annual income from wheat byregions, by states, or by smaller areas indicates the magnitudeof the income problem to wheat farmers. Table 8 shows the an-nual income from wheat in the hard red winter wheat region,deflated by an index of prices farmers pay (including interest,taxes, and wages) for the period 1920 to 1952 inclusive. Table 9shows similar information for three major soft red winter wheatproducing states (i.e., Ohio, Indiana, and Illinois) and the softred winter wheat region as a whole.
Technological changes during the last generation have hadsignificant influences on the quantity of wheat produced. Tech-nological advances have lowered unit costs of production. Inall of the major wheat producing areas mechanical power hasreplaced horse power and horse drawn equipment. The use oftractors, combines, and trucks is universal. This has reduced perbushel costs, increased the scale of operation, and has made pos-sible tillage practices which previously were not feasible. Sum-mer fallow, improved varieties, and fertilizer have increasedyields and encouraged the expansion of acreage in areas previ-ously beyond the margin of cultivation.
The influence of technological changes are summarized byJohnson in data he presented on trends of man-hours per acre,yield, and man-hours per 100 bushels produced 6 (Table 10).These data show that in the 1945-48 period, man-hours of laborper 100 bushels were one-third those required in the 1910-14period. The effects of the higher efficiency are a factor in thewheat surplus problem. Changes of this kind are not adequatelyreflected in the formula used for calculating parity prices forwheat.
The competitive situation under which wheat is producedand marketed is a part of the wheat surplus problem. The indi-vidual producer cannot gain by restricting output as can manu-
6 Sherman E. Johnson, "Changes in American Farming," U. S. Department ofAgriculture, Miscellaneous Publication No. 707, December 1949.
34

facturers operating under conditions of imperfect competition.Wheat farmers are motivated to increase output until estimatedper bushel cost of production equals the anticipated selling price.
The production and sale of wheat from the viewpoint of theindividual farmer approaches the conditions characterized aspure competition. The individual wheat farmer has a perfectlyelastic demand for his output. His demand curve is horizontal.With only minor exceptions his product is undifferentiated. Indi-vidually he has no influence on price, regardless of quantity sold,and no bargaining power. He accepts the price and terms of saleestablished by others. Data in Table 11 indicate the wide fluctua-tions in prices experienced by farmers. By collective or coopera-tive action farmers have influenced handling margins and con-ditions of sale at the local shipping point. Regional cooperativeshave influenced handling, warehousing, and sale of cash grainin terminal markets and have made substantial savings to farm-ers, but their contribution to the solution of the total problem isminor.
Demand-The Income Problem
Turning to the demand for wheat we find two types of outletinfluence disappearance or utilization of wheat in the UnitedStates: the consumption of wheat as human food, and the utiliza-tion for secondary or nonfood uses. Two facts about the utiliza-tion of wheat stand out above all others: the extreme stability inthe quantity used as human food and the wide variations in thequantity taken for nonfood uses and exports.
The quantity of wheat processed annually for human foodduring the last twenty years has been slightly less than 500 mil-lion bushels. The smallest quantity used annually for human foodwas 473 million bushels in 1941 and the largest quantity was 500million bushels in 1943. In the period since the end of WorldWar II the annual variation in the quantity of wheat used forhuman food in the United States has fluctuated within a rangeof 1 percent. Prior to World War I per capita consumption ofwheat as flour exceeded 200 pounds annually (Table 12). Dur-ing and immediately after World War I annual per capita con-sumption declined sharply and remained at a level of about 175pounds during the twenties. Further declines occurred duringthe early years of the depression. During most of the thirties and
35

the early part of the forties annual per capita consumptionranged from 158 to 162 pounds. Further declines occurred afterWorld War II and the recent annual average has been about 135pounds. The decrease in per capita consumption has been offsetapproximately by increases in population, which explains thehighly stable total consumption of wheat as food (Table 13).
The quantity used for industrial needs, feed for livestock, andexports fluctuates widely. Prior to the beginning of World War IIthe quantity of wheat used for livestock feed averaged about 100million bushels annually. With a scarcity of corn and other feedgrains and the difficulty of obtaining supplies, the use of wheatfor livestock feed increased sharply in 1942 and 1943. DuringWorld War II the annual use of wheat for livestock feed aver-aged approximately 400 million bushels and in one year, 1943,exceeded 500 million bushels. This quantity was larger than thequantity used for food. Use of wheat for the manufacture of in-dustrial alcohol was large during World War II. In 1943 morethan 100 million bushels were used for this purpose. Exports fromthe United States in the last twenty years have ranged from 4.5million bushels in 1935 to 470 million bushels in 1951.
The wide fluctuations in exports and livestock feed have re-sulted in large fluctuations in the total disappearance in theUnited States in spite of the highly stable use for human food.Total disappearance in the last twenty years has ranged from668 million bushels in 1935 to 1,288 million bushels in 1945. Witha single exception, 1949, total disappearance of wheat has ex-ceeded a billion bushels in each season since 1943.
Henry Schultz 7 developed a technique for measuring the de-mand for wheat in the United States. His most reliable estimateis for the period 1921-34. His estimate of elasticity of demand is- .2143. This means that a 1 percent increase in quantity wouldbe accompanied by approximately a 5 percent decrease in price.
This highly inelastic demand for wheat suggests that schemesfor expanding outlets for wheat by increasing human consump-tion are unrealistic. Wheat producers have often held the hopethat advertising might expand the outlets for wheat, as it hasdone for many manufactured foods and some special crops such
7 The Theory and Measurement of Demand, University of Chicago Press, 1938.
36

as citrus fruits. The income elasticity of wheat as food is low also.Level of personal income has relatively little, if any, effect on percapita consumption. In fact there is some evidence that per cap-ita consumption of wheat declines as level of income and levelof living improve. The availability of other foods and the in-creased consumption of fresh fruits, vegetables, and luxury foodsas income increases apparently have limited the per capita con-sumption of cereals, especially wheat.
The rapid shifts in utilization resulting in temporary demandfor wheat for secondary uses adds to the complexity of the wheatincome problem. Concern over the wheat surplus problem afterWorld War I arose from the fact that production was expandedduring and immediately after World War I in response to theabnormal demand arising from military and postwar needs forfood. The disappearance of this demand and the decline of theexport demand in the thirties were responsible for continuationof the wheat surplus problem. Similar expansion in nonfooddemands occurred during World War II as a result of efforts toexpand livestock production. This demand was replaced laterby the need for food for relief in Europe. This was followed bysubsidized exports with emphasis upon the use of wheat for ob-taining the cooperation of various areas of the world.
Wheat is an excellent livestock feed and can be readily sub-stituted for other grains in the rations for many kinds of livestock.Outlets might be found for substantial quantities of wheat as feedfor livestock in the United States if the level of livestock produc-tion is expanded as population increases and per capita consump-tion of meat and livestock products is maintained. However, tobe competitive in price with other feed grains, wheat apparentlywould need to be priced substantially below the current level of90 percent of parity. Data on cost of production in the low-costareas of the Great Plains (Table 14) indicate that wheat mightbe priced competitively with feed grains and still yield a reason-able return to labor and investment in these areas.
Variations in production, such as occurred in the forties ascontrasted to the thirties, and extreme variations in the nonfooduses and exports of wheat have resulted in alternate periods ofscarcity and abundance of stocks. A carry-over of nearly 400million bushels was on hand July 1, 1933. By 1936 we were im-porting wheat, and at the end of that season carry-over reached
37

a record low of about 80 million bushels. On July 1, 1942, reservestocks exceeded 600 million bushels. This was a valuable reservefor the war emergency, but it was soon used up and by 1947, inspite of record crops, we were short of wheat in relation to needfor food relief overseas. Now we have near record reserve stocksagain. These facts indicate the fluctuating production and util-ization of wheat. They should provide the basis for the develop-ment of a consistent, well-planned, long-range program of re-serve stocks to accompany and undergird price policy relatingto wheat.
GOALS OF WHEAT PRICE POLICY
Goals are the criteria or standards against which actions im-plementing policy may be appraised. It is not feasible to evaluateor appraise programs except in terms of the goals which suchprograms are set up to achieve. It is not the economist's functionto establish goals of price policy, but rather to determine whetheror not given actions will achieve the goals which have been estab-lished.
Goals of General Economic Policy
Price policy is one phase of agricultural policy, and agricul-tural policy is only one part of general economic policy. How-ever, it is essential to evaluate specific price programs in termsof the goals of general economic policy. Some of the goals of gen-eral economic policy which appear to be widely desired are:
1. Consumer sovereignty. This means that consumers shouldbe free to express their preferences through a system ofrelative prices.
2. Freedom of resource ownership and use. Private propertyand individual freedom to assume risk and to make pro-duction decisions are basic institutions of our economy.
3. Economic progress. This refers to an increase in real percapita income through time, arising from technologicaladvances and changing consumption habits.
4. High-level production and employment.
5. Expanded world trade. The belief is that trade will fostereconomic progress in underdeveloped areas while allow-
38

ing the principle of comparative advantage to operate athome and abroad.
6. Efficient use of resources. This ideal involves the greatestdegree of consumer satisfaction consistent with the exist-ing supply of resources and the state of technology.
7. Equitable distribution of income.
8. Economic security. This idea refers to expectations regard-ing future economic welfare.
It is recognized that there is conflict or inconsistency amongthese goals. For example, consumer sovereignty at times may con-flict with the goal of high-level production and employment.Likewise, freedom of resource use may not promote full produc-tion and employment. The determination of priorities in casesof conflicting goals is achieved by political processes. The exist-ence of conflicts in goals and the necessity of determining prior-ities tempts the economist to make recommendations which ap-propriately are the sphere of those engaged in political activities.
Specific Goals for Agricultural Policy
Agricultural programs and actions implementing agriculturalpolicy need to be consistent with the goals of general economicpolicy, but such actions are also designed to achieve certain ob-jectives or goals that are desired by persons engaged in agricul-ture. It is essential to have an understanding of the specific goalsor objectives of agricultural policy if an attempt is made to deter-mine whether given actions achieve the results which farmersdesire.
The more specific goals which farmers appear to desire fortheir industry are:
1. Maintenance of a farming industry capable of producingfood and fiber to provide a high level of domestic living inpeace and war, and to export when profitable and forsome political reasons.
2. Protection of agricultural producers' incomes from:a. Low prices resulting from depression.b. Low prices resulting from large crops due to unusually
favorable weather.c. Unfair foreign competition, i.e., dumping.
39

3. Protection of farmers from monopoly in:a. The manufacture and sale of goods for production and
for living.b. The marketing of farm products.
4. Agricultural research and education for training agricul-tural scientists, adult leaders, and rural youth.
The list, of course, is not comprehensive. Others may setforth other goals or give variation of emphasis, but the abovegoals are a set of objectives against which wheat price policymay be appraised.
ANALYSIS OF ALTERNATIVE POLICIES
It should be the function of extension economists to assistfarm leaders to determine whether or not given actions or pro-grams will achieve the goals or objectives which they desire. Aneffective means of doing this is to evaluate or appraise specificprograms in terms of general economic goals and specific goalsfor agriculture. This process consists of examining and evaluat-ing past and existing programs and then comparing them withpossible alternative programs which might be adopted in thefuture.
The Traditional Approach: The Free Market
The traditional approach or means of achieving economicobjectives in this country has been the "free market." UntilWorld War I and also quite generally until the depression ofthe thirties agriculture operated under conditions characteristicof the free market. While many modifications influencing pricesand other economic mechanisms have been introduced in thelast twenty years, the philosophy of the free market still prevailsquite generally in agriculture. It is assumed that farmers stillhold the free market system in high regard even though theyhave asked for many modifications of the system.
The free market is one way to organize economic activity.This organization is based on the belief that land and capitalshould be private property and controlled by individuals whoare free to use them as they choose. It also involves the beliefthat consumers should be free to choose among the various prod-ucts in the market and buy whatever they choose. Thus respon-sibility for setting the pattern of demand is left to consumers.
40
Producers assume the responsibility of predicting which prod-ucts in what quantities consumers will demand. The main basison which producers can predict future demand is past prices.Outlook information attempts to improve this decision-makingprocess. It is assumed that prices will direct resources into theirmost valuable use.
It is further assumed that the economy will achieve full em-ployment when organized along the principles of the free mar-ket. Another assumption is that the value of the total productwill be distributed among producers in accordance with the valueof their contribution, i.e., that everyone will get the value of hisproduct and that this is "just" and "fair." In practice we havenot had a free market which satisfies all these assumptions. Somesectors of the economy have adjusted output to regulate prices.In the short run farmers are unable to control output and influ-ence prices. This puts them at a disadvantage compared withindustry.
Experience has shown that the kind of free market we haveattained in fact has not brought consistently high employment.Also, we have not been pleased with the distribution of incomeresulting from the kind of free market we have experienced. Inaddition, especially for wheat farmers, differences betweenplanned production and actual production due to natural causesand the nature of the demand for bread and cereals have re-sulted in year to year price fluctuations which are not adequateguides to future needs of consumers.
For these and other reasons, we have had legislation designedto modify the price structure and the pattern of income distribu-tion in agriculture from what the free market would give.
The free market has many great merits. It also has someshortcomings.
The Existing Program: Rigid Price Supportsat 90 Percent of Parity
The existing farm program consists of a number of separateprograms, many of which do not bear directly on price butwhich have numerous indirect price implications. In this cate-gory are agricultural credit, soil conservation, crop insurance,rural electrification, cooperative marketing, and similar pro-grams. In addition, the current program includes specific actions
41

relating to prices, reserve stocks, and disposal of surpluses. Thesephases of the agricultural program may be described briefly as aprogram of price support for basic commodities, including wheat,at 90 percent of parity through a system of non-recourse loansand purchase agreements to producers. Accompanying this price-support program is provision for acreage allotments and a systemof marketing quotas to be implemented when approved by two-thirds of the voting producers. Stocks of storable commodities,such as wheat, acquired under this program are held as reservesby the Commodity Credit Corporation or utilized as determinedby administrative decision. In the past, stocks of wheat so ac-cumulated have been used primarily as feed for livestock toincrease the production of meat and livestock products duringthe war emergency, as raw material for the production of indus-trial alcohol, for the manufacture of synthetic rubber during thewar, and for food relief overseas in the postwar period. Morerecently excess stocks have been moved into the world market bysubsidy from treasury funds.
Since the existing program of price support is based uponparity, a few comments concerning the parity concept are appro-priate in appraisal of the existing program. The term "parity"was chosen to represent prices on a "par" with other prices. Theterm implies a "fair" price. The idea of defining farm products interms of their fairness is an effort to do something to combat allthe forces which from time to time have contributed to relativelylow farm prices. Some of the forces which have caused these lowprices are:
1. General depression.2. Loss of export market.3. Overproduction of farm products.
The idea that the agricultural producing industry shouldreceive some particular fraction of the national income is anothergoal which parity prices were intended to achieve.
In terms of economic analysis, the function of relative pricesis to guide production and distribute income. Viewed in theseterms, it is unreasonable to apply the moral test of "fairness" toa price. It is reasonable, however, to investigate the causes ofinstability and low farm prices. Such investigations reveal thatlegislated prices fail to correct the underlying economic causes
42

of low prices and eventually even tend to accentuate some of thecauses. This is why economists generally argue that the parityconcept is not an appropriate means of solving the problem ofagricultural income.
Full parity price for any farm product meant, until 1950, aprice in dollars that would buy the same amount of goods thatfarmers spend their money for in both production and familyconsumption plus taxes and interest, as a bushel or pound ofthat product bought in 1910-14.
The Agricultural Act of 1948 provided that in 1950 a mod-ernized parity be calculated by moving the base period to themost recent ten-year period. For 1953 the base period is 1943-52.The effect of modernized parity was in general to raise the parityprice of livestock and livestock products but to lower the parityprice of crops. Before the 1948 Act went into effect, the Act of1949 was passed. It provided that the parity price of any basiccommodity-corn, cotton, wheat, peanuts, rice, and tobacco-as of any date during the four-year period beginning January 1,1950, shall not be less than its parity price computed in the man-ner used prior to the enactment of the Agricultural Act of 1949.In other words, the basic commodities were to be supported onthe basis of the old or new parity, whichever was higher. It fur-ther provided for "transitional parity prices" for nonbasic com-modities. The idea was to limit the reduction in the level ofsupport for such commodities to 5 percentage points a year asthe transition from old to new parity was made for commoditieshaving lower parity prices when calculated by the new method.
It is possible to mention many limitations on the use of parityas the mechanism for providing price assurance to agriculture.It is a backward-looking rather than a forward-looking relation-ship. For many commodities, but especially for wheat, one mayquestion the extent to which the economic relationships involvedin parity apply to the current situation. Does it account ade-quately for technological changes and desirable shifts in produc-tion? For wheat, does it reflect adequately the basic supply anddemand relationships which underlie the wheat surplus problem?Has use of the parity concept aggravated rather than alleviatedthe wheat surplus problem? Does the use of parity, even in themodernized form, encourage the production adjustments betweenwheat and livestock products which consumers desire? These
43

and many similar questions may be raised concerning the use ofparity for establishing rigid price supports for wheat.
The existing program has given wheat farmers assurance ofprices at which they may dispose of their products not only withina given marketing season, but it also has provided a price bench-mark or basis for planning future operations and the number ofacres to be planted. Relating supported prices to a fixed per-centage of parity stabilizes prices received by farmers relative toprices paid for commodities used in production and living, but itdoes not stabilize income. The program, except for a short timeduring the drouth period, has given consumers assurance of ade-quate supplies of wheat although consumers may contend thatthe price has been higher than necessary to call forth an outputadequate to meet the needs for human food. The program hasprotected wheat farmers from major loss of income resultingfrom seasonal and sharp fluctuations in price arising from largecrops and transportation and storage gluts. The relatively favor-able level of price support and the assurance of protection fromloss have helped to maintain a high level of wheat productionduring periods of above average needs, such as during WorldWar II and in the postwar period.
The program has produced some results which are not inharmony with either the general economic goals or the economicgoals of farmers. It has encouraged the use of land for producingwheat when wheat already was in surplus supply. It has resultedin expansion of wheat acreages which are not justified in termsof the long-run supply and demand relationships. It has contrib-uted to increases in land prices, especially in areas such as westernKansas, where the cost of production in years of favorable yieldsis low relative to the supported price of wheat. Land prices inthe United States are approximately two and a half times 1940prices. In the western third of Kansas land prices are more thanfour times as high as in 1940. It is recognized that increases inland values since 1940 were due largely to capitalization of in-creased income, which was a reflection of both price and yield,and that yield during the forties was influenced in large part byfavorable weather. However, the rigid support program tendedto maintain wheat prices and thereby contributed to higher landvalues. In one type of farming area, in which wheat is the majorsource of income, land prices were about $20 per acre in 1941.
44

It is estimated that land prices averaged more than $100 peracre in this area on March 1, 1953. In another area, land pricesaveraged $11 per acre in 1941. Prices in that area averaged $86,per acre on March 1 of this year. These facts are evidence thata substantial portion of the financial benefits of price support at90 percent of parity has accrued to owners of land.
The program has contributed to additional investment inmachinery and equipment, which will tend to result in "excesscapacity" for many wheat farmers if they are required to reduceacreage substantially. Wheat price supports at 90 percent of par-ity have been of greatest benefit to those owning most resources.In effect, the amount of financial benefit is tied to the scale ofoperations and the volume of production. Furthermore, the finan-cial advantage tends to be largest in those years of large cropswhen additional income is least needed by wheat farmers.
Owing to the fact that acreage allotments and marketingquotas have been imposed for only relatively short periods oftime, there has been relatively little loss of freedom of decisionin planning production. However, with the establishment ofacreage allotments and with the imposition of marketing quotasthere will be substantial restriction of freedom of individual de-cision with respect to resource use. Resistance to this loss of free-dom will create many administrative headaches when marketingquotas are imposed. Observation indicates that the favorablesituation under which wheat farmers have operated during thepast ten years in regard to guaranteed prices and freedom toproduce a maximum amount has dulled their vision with respectto the "cost" of supported prices in terms of loss of freedom ofaction.
The system of price supports which has been established forwheat has not resulted in output being obtained from lowest costproducers. Some estimates of the per bushel cost of productionbased on 1941-50 yields and 1926-47 yields for selected areas inKansas, northern Indiana, and southern Michigan were madeat the Kansas Station. These calculations show an estimated costof less than 80 cents a bushel in southwestern Kansas throughthe use of summer fallow as compared with costs ranging from$1.50 to $1.75 in eastern Kansas and northern Indiana. Thisindicates wide variations of costs among the various areas pro-ducing wheat. These estimates indicate also that the level of
45

supports prevailing at present is well above the level necessary tocall forth a volume of wheat production to meet adequately thedomestic needs for human food.
Supports at 90 percent of parity have held domestic wheatprices substantially above the world level of wheat prices andabove the prices specified in the International Wheat Agreement.Sale under the International Wheat Agreement and movementof additional reserve stocks into export have required substantialamounts of public funds for disposing of stocks of wheat notneeded for domestic requirements. More than one-half billiondollars has been paid to subsidize the exports of wheat during thelast four years. In spite of this substantial subsidy excess stockshave continued to accumulate and on June 30 of the current yearwere 559 million bushels. This is near an all-time record. Con-sumers have questioned the program of rigid price supports toproducers, especially on commodities such as potatoes and eggs,where prices received by farmers make up a substantial portionof the price paid by consumers. Consumers of bread and cerealshave not been particularly critical of the wheat price-supportprogram primarily because the price which farmers receive forwheat used in these products is a relatively small proportion ofthe retail price which the housewife pays for bread and cereals.
Flexible Price Supports
The Agricultural Act of 1949 provides for a system of flexibleprice supports for basic commodities. The scale of supports estab-lished in the Act ranges from 75 to 90 percent of parity, varyinginversely with changes in total stocks of the commodity.
The purpose of a system of flexible price supports related tototal stocks is an attempt to adjust the support price to the inelas-ticity of the demand curve, In practical testing of flexible sup-ports for a commodity such as wheat it is essential to consider thedegree to which the scale of flexible supports takes into accountthe elasticity of the demand curve. The hypothesis to be testedis that the demand for wheat in the domestic market is moreinelastic than the scheduled demand established in the Agri-cultural Act of 1949 under the flexible price-support provision.If estimates of these two schedules could be developed, oneshould be able to make some estimate of the quantity of wheatwhich would go into storage for crops of various sizes correspond-
46

ing to any given level of price support which might be provided.Reference has already been made to the demand curve developedby Henry Schultz for wheat which has a coefficient of elasticityof demand of -. 2143.
Using Schultz' procedure a multiple regression was computedfor data in the United States for the years 1935-51 excluding theyears 1943, 1944, and 1945. These years were excluded on thegrounds that per capita utilization was unusually high as a resultof subsidized feeding and commercial use of wheat. The priceseries used was the season average farm price given in Agricul-tural Statistics deflated by an index of wholesale prices, 1913=100. The calculated elasticity was found to be -. 1209, which isvery low. This calculation involves the assumption that the elas-ticity of demand is constant throughout the demand schedule,which is possibly unrealistic at lower prices where wheat wouldbecome competitive as a feed grain. Estimates on the price elas-ticity of demand for corn range from -. 4 to -. 5. This meansthat the demand for wheat would have a similar elasticity at therange of prices in which wheat would be substituted for corn.
Estimates of the amount of wheat that would be carried overunder various levels of price supports are shown in Table 15. Theestimates on carry-over were calculated on the assumption that300 million bushels could be sold in the export market.
A system of flexible price supports varying inversely withstocks would retain a substantial degree of the price assurancefeatures of the system of rigid support prices but should modifysubstantially the quantity of surplus stocks accumulated. Theamount of funds required for subsidy should be smaller. Theeffects of flexible supports on farm income and resource use wouldbe in the same direction as the effects of rigid high-level supports,but the degree of effect would be modified.
Flexible price supports would not solve all of the wheat sur-plus problem.Wheat surpluses would be modified but not avoided.Production controls on wheat would be required in some sit-uations but not as frequently as with rigid supports.Flexible loan rates would tend to stabilize total income forgroups of producers as compared with income under a systemof rigid supports.
47
Flexible supports varying in the opposite direction from totalstocks would promote the exporting of wheat and would en-courage feeding of wheat to livestock.
The idea has been advanced that stocks of all grains might be'combined to serve as a composite basis for supporting prices ofgrains. Stocks of wheat and stocks of the four feed grains mightbe combined in establishing the basis for support. This idea hasnot been analyzed adequately to determine the effects on farmincome, influence on the substitution of wheat and feed grains,and the prospective cost of such a program compared to the cur-rent system of price supports.
Two-Price Systems
Two-price systems have long been suggested as solutions tothe wheat problem. The McNary-Haugen plan, which was advo-cated in the twenties, and the various export subsidy schemesbelong to this category. The United States has had a two-pricesystem for wheat during the last four years. This program hascost approximately one-half billion dollars in export subsidies.
A two-price or multiple-price system is a form of price dis-crimination. Price discrimination is a term (used in the simplestsense) applied to the practice of charging different buyers differ-ent prices for the same product. Successful price discriminationrests upon the following conditions:
1. Monopoly or collusion among sellers. Otherwise individualsellers could always profit by selling their output in thehigher priced market. Monopoly implies control of pro-duction.
2. The total market must be capable of subdivision into sep-arate markets such that reaction of buyers to price changesvaries from one market to another.
3. The cost of preventing persons who buy in the lower-pricedmarket from reselling in the higher-priced market must beless than the gain to be derived from price discrimination.
Where these conditions can be met, a particular group, suchas wheat growers, can increase the average price of its productabove that which would prevail in a freely competitive marketand thereby gain an advantage relative to other groups in theeconomy, provided production is strictly controlled.
48
Chronic surpluses are taken to be evidence of too manyresources engaged in production of agricultural products. Thisis considered to be an agricultural problem. If the average priceunder a two-price system were less than that received underpresent support programs with no reduction in price uncertainty,then such price discrimination would tend to discourage the useof some resources in agriculture and thereby tend to alleviate thisproblem. On the other hand, if the average price were increasedunder a two-price system, resources would be attracted to agri-culture. This would tend to worsen the already existing problemunless production were strictly controlled.
A disparity of agricultural producers' incomes compared tothat of producers in other sectors of the national economy is alsoconsidered to be a problem. If, as stated above, the average priceunder a two-price system were less than present support prices,farmers' net income would drop in the short run because receiptswould drop more rapidly than costs. In the long run, farmers'net income for particular groups could be maintained above thelevel possible in a free market operation as long as productionwas rigidly controlled. With production controls a market prob-ably would spring up in production rights (such as acreage allot-ments or quotas). The value of these rights would be capitalizedinto value of land and other factors of production.
Price discrimination might assist in easing the shock of lowerfarm incomes that result from temporary overproduction. Thereare, however, alternative ways of dealing with this problem,which might prove superior to price discrimination. Weatherfluctuations are another agricultural problem.
Self Regulation by Producer Groups
Wheat farmers have long had the desire for greater controlover the movement into market channels and the pricing of theircommodity. The efforts of The United Grain Growers followingWorld War I, the state wheat pools, and the international wheatpool conferences of the early thirties were actions growing out ofthis fundamental desire. The establishment by the Federal FarmBoard of a national sales agency for wheat known as the FarmersNational Grain Corporation was a response to the demand onthe part of farmers to have governmental assistance in achievinggreater control over the marketing and pricing of wheat. In
49

Canada the provincial and dominion wheat pools with a centralselling agency and a system of orderly marketing during thetwenties was the outgrowth of a similar desire among Canadianfarmers. These unsuccessful attempts in the decade followingWorld War I raise the question whether this approach ever canbe successful for a basic food commodity, such as wheat, producedover wide geographical areas and under widely divergent circum-stances. However, unsuccessful attempts in the past are not anindication that this approach may not be attempted again atsome time in the future.
Some commodity groups, such as the citrus fruit producersand walnut growers, have achieved a substantial degree of con-trol over output and price through cooperative action or market-ing agreements. Fluid milk producers have influenced prices andquantity marketed by collective bargaining.
Group action in the control of wheat output would be difficultto achieve because of the number of producers and the diversegeographical areas involved. In the past, producer groups havenot been successful in influencing prices for substantial periodsof time when large numbers and large areas were involved. How-ever, Canadian wheat farmers gained substantial control overthe marketing of their crop prior to the depression period, andlabor unions have been successful in maintaining collective actioninvolving large numbers of individuals.
Self regulation would give wheat farmers the opportunity todecide for themselves by democratic action how much wheat theywished to market and the price at which it would be moved intomarketing channels. Such action, unless supported by effectivestate or federal legislation, would involve undesirable policingactivities such as have been characteristic of collective bargainingof labor and the collective bargaining of milk prices.
The possibility of self regulation is mentioned here becauseof fundamental desires of farmers. They seek a minimum of gov-ernment regulation and a maximum of freedom to make theirown decisions. They also seek equality of bargaining power in themarket place. Cooperative or collective action would give wheatfarmers a degree of independence and a feeling of status whichwill not prevail under marketing quotas and government estab-lished support prices. Independence, equality, and bargaining
50

power have been traditional desires among farmers. It is con-ceivable that they might be willing to sacrifice some economicadvantage to gain these goals. This approach, of course, raisesthe question of monopoly control.
The Canadiai System of Price Support
In the major wheat producing areas of Canada the marketingof wheat is under government control. There is only one agencyto which farmers can sell their wheat. This is the CanadianWheat Board which sets prices paid to farmers and prices atwhich wheat is sold on the domestic market. The initial paymentto farmers is a conservative estimate of what the Board considersmay be the price at which it will later resell the wheat. Theamount of the forthcoming initial payment is announced prior toseeding time. This is a guaranteed minimum.
If the price at which the Board resells the wheat turns out tobe greater than estimated or if the estimate was too conservative,and returns accrue to the Wheat Board, these returns may be dis-tributed subsequently to farmers as participating payments.
Export prices obviously cannot be dictated by the WheatBoard. With the exception of International Wheat Agreementcommitments, export wheat is sold at prevailing world prices.
In Canada there is no direct control of acreage seeded. Farm-ers are free to plant as much or as little as they please. There isno provision in the current legislation for acreage control. How-ever, in 1941 and 1942 such controls were in effect. There arecontrols on the marketing of wheat. Farmers market their wheatunder a delivery quota system which is based upon seeded acre-age. Ordinarily the first delivery quota for a given crop is aboutfive bushels per seeded acre. Later deliveries are geared to theavailability of storage and transportation. Farmers are respon-sible for the maintenance of quality as long as the wheat is onthe farm. No payments are received by farmers until delivery ismade, and delivery cannot be made until authorized by theWheat Board.
Grain marketing facilities are owned and operated by privateand cooperative interests. However, margins for handling grainare fixed by the Board so that dealers are in effect little more thangovernment agents.
51

The Canadian program relies on the judgment of the WheatBoard for the initial payment and to a certain extent on the dis-cretion of government for participating payments. Farmers arenever entirely sure about the final price until long after theyhave disposed of their wheat. In some instances participatingpayments have been made retroactive for several years. A possi-bility exists that timely distribution of these payments may beused to exert political influence on wheat farmers.
It might be noted that in comparison to free market oper-ations the Canadian marketing program is under almost com-plete governmental control. There are conflicting reports onthe program's reception in Canada. Unofficially, it is reportedthat the private grain trade is almost unanimously opposed tothe program. On the same basis it is reported that many farmersapprove and endorse it.
In comparing the Canadian program with that of the UnitedStates, it appears that attention should be directed to the differ-ence in objectives of the two programs. The major objectivein Canada apparently is to "stabilize the market." There is noexplicit reference to parity or redistribution of national incomein favor of agriculture. In the United States the objectivesinclude both stability of income and a concept of establishingfarm income on a parity with other segments of the economy.
Even if it were granted that the centralized program is work-ing with a reasonable degree of satisfaction in Canada, that wouldnot necessarily insure an equal degree of success in the UnitedStates. Unless the objectives or goals were the same and unlessUnited States citizens held value judgments regarding the order-ing or weighing of goals that were similar to those held byCanadians, there would be no assurance of similar results. Fur-thermore, the relative importance of the agricultural sector to thetotal national economy is substantially different in Canada thanit is in the United States. In Canada, agriculture is relativelymore important than the industrial sector. Under such circum-stances, even though incomes in the industrial sector might begreater than in agriculture, an attempt to obtain parity bysubsidizing agriculture from public funds would to a large extentbe asking agriculture to lift itself by its own boot straps. Thebase of the industrial sector from which agriculture might be sub-sidized simply is too small to be effective. This also is tied up with
52

the fact that Canadian wheat prices are dominated to a largeextent by export prices. This means that the well-being ofCanadian wheat farmers is determined largely by world wheatprices and the remainder of the Canadian economy is not ofsufficient relative importance to carry agriculture, so to speak.This is not true to the same extent in the United States, althoughin principle the situation is similar and eventually the sameforces might prevail.
The Canadian program is primarily a pricing and market-ing system to assist Canadian farmers to move their productioninto the world market in an orderly manner at stable prices. Itis doubtful if United States wheat producers would be willingto accept a price which would permit our surplus productionto move into the world market without subsidy.
In examining governmental programs to assist farmers, men-tion should be made of the British agricultural program. TheBritish program was improvised piecemeal to meet specificemergencies but an attempt was made in the Agricultural Actof 1947 to systematize the plan into a coordinated scheme. Twoprimary features of the program are guaranteed fixed pricesand various forms of direct and indirect subsidies.
The objective of the program is to establish stability ofnet farm income for British agriculture as a whole. The Act doesnot specify the level at which net income is to be stabilized. How-ever, the government's policy is stated to be the promotion of a"stable and efficient agricultural industry capable of producingsuch part of the nation's food and other agricultural produce asin the national interest it is desirable to produce in the UnitedKingdom, and of producing it at minimum prices consistent withproper remuneration and living conditions for farmers and work-ers in agriculture and an adequate return on capital invested inthe industry."
The Act provides that the government fix prices for statedperiods ahead for all the main farm products. Some are an-nounced for as much as four years in advance. These prices arereviewed once a year. Thus, prices are fixed for the year imme-diately following the review. Guaranteed prices beyond the im-mediate year are in effect minimum prices. Subsequent reviewsmay increase them. In a few cases maximum prices are alsoannounced. In the case of wheat, prices are fixed in February for
53
the crop to be harvested the year following that in which thereview is held.
Before determining the annual price schedules the govern-ment is under obligation to consider, in consultation with repre-sentatives of the farmers, "the general economic conditions andprospects of the agricultural industry." In effect, the outcome isa negotiated price. However, the ultimate price is the responsi-bility of the government alone and it is not essential that the re-view should result in agreed prices. Nevertheless, great impor-tance is attached to these consultations between the governmentand farmers' representatives.
The British system was designed to give producers not onlya guaranteed fixed price but an assured market for their outputat that price. This is accomplished through a system of centralpurchase by the government either directly (as for livestock) orthrough accredited agents (as for cereals, sugar beets, milk, andeggs). The Act of 1947 provides the right to fix quantitive limitsbut so far this has not been used. Thus, there are no direct pro-duction controls. The price mechanism is used by the governmentto direct the use of resources into what is believed to be the mostdesirable uses from the standpoint of national economy.
Forward Prices
Forward pricing is a system of pricing that might be adaptedto wheat. Forward prices are employed in the British agricul-tural program. Wheat is a commodity that has charactersticsof production and use which lend themselves to a specified orguaranteed price for given production periods. As indicatedearlier, one of the major problems of the wheat industry is thelarge fluctuation in price from season to season resulting fromvariations in natural influences, such as weather. Forward pricingwould reduce price uncertainty to wheat farmers by improvingestimates of demand. Guaranteed prices for a production periodwould reduce price uncertainty for wheat farmers by trans-ferring responsibility for market demand from wheat farmersto consumers of flour and cereal products. This method of pricingwould reduce the effects of fluctuations in production (fromsurplus to shortages) and would improve the welfare of con-sumers by giving them protection from shortages and high prices.This would be accomplished by charging deficiency payments
54

and storage costs (if they exceeded gains) to the general treasury.It can be argued that the cost transferred to consumers of wheatis a type of insurance premium against shortages and attendanthigh prices. To operate effectively a system of forward pricingwould need to be accompanied by a storage program or a pro-gram of adequate reserve stocks. The physical characteristicsof wheat lend themselves to storage and economical trans-portation.
Forward pricing would provide opportunity to continue thefreedom of individual farmers to own and control resources usedin the production of wheat. A board of competent technicianshaving access to information on utilization, export outlets, andproduction costs and techniques in various areas should be ableto set forward prices which would result in fewer mistakes inadjusting production to utilization than have characterized thefree market as a mechanism for controlling resources applied towheat production.
Forward pricing would not cure all the economic ills of thewheat industry. The system would not compensate for extremesof weather or unemployment. There could be political pressureon the price setting board, and there would be error in the pre-dicted prices.
Socialized Wheat Production
The traditional approach for pricing of farm commodities inthe United States has been the free market operating throughcompetitive prices. At the other end of the range of possibilitiesis centralized planning with all production, pricing, and use de-cisions being vested in a central board or commission havingauthority to say how much should be produced, who should pro-duce, and the price at which the product should be delivered.Use of this system in varying degree has been attempted bytotalitarian countries. Experiences of Germany and Italy in pro-viding food for their populations and the current food situationin the once productive agricultural regions of eastern Europe in-dicate that this system is not effective for a substantial period oftime. The basic economic institutions of private property, free-dom of contract, and personal liberty plus the traditional inde-pendence and the democratic philosophy of this country indicatethat such a system would have little acceptance or effectiveness
55
in the United States. However, the nature of the surplus problemin wheat and the need for food in other areas of the world sug-gest centralized planning as a possible approach.
CONCLUDING APPRAISAL
When attempting a summary appraisal of suggested orpossible schemes for implementing price policy for a commoditysuch as wheat, one is confronted with conflict or inconsisten-cies among the general economic goals and the specific goals ofagricultural policy. If primary consideration is given to con-sumer sovereignty, freedom of resource ownership, and efficiencyof resource use, the traditional approach of the free market withcompetitive prices has first priority. On the other hand, ifeconomic security and protection of farmers' incomes from lowprices and monopoly influence are given primary consideration,rigid high-level supports appear to give the best prospect ofachieving these goals. The ranking or priority given to the vari-ous means is determined primarily by the relative emphasis orimportance given to economic goals.
In the choice of means, considerations other than those ofeconomic goals also enter the picture. Political feasibility, con-sumer reaction, and financial cost to taxpayers are importantconsiderations. Considering the political strength of agriculture,the political influence of wheat farmers, the importance of wheatin the economy of the country, and the importance of wheatin terms of defense and political strategy, it is assumed that thewheat industry will continue to receive consideration as pricepolicies and programs are modified or replaced. On the otherhand, when consideration is directed to the magnitude of thewheat surplus problem, the relatively minor progress towardachieving real solutions, and financial costs to taxpayers, it isquestionable if transfers of income comparable to those of thelast four years will continue to be approved for the wheatindustry. There is reason to believe that the substantial transfersof income to wheat farmers through subsidies from the treasuryduring the last ten years of excellent yield and full employmentmay have jeopardized the farmer's position with taxpayers andconsumers. There may be subsequent periods of low yields andlow prices similar to those of the thirties when the good will andassistance of taxpayers and consumers generally will be neededmore urgently than during recent years.
56

If an attempt is made to compromise or harmonize basicgoals, such as freedom of resource ownership and efficiency ofresource use, with other goals, such as economic security andprice assurance, and if possible programs are appraised in termsof political feasibility and taxpayer tolerance, it appears thatsome modification of the existing scheme of price supports, suchas flexible supports, are probable. The high degree of inelastic-ity of demand for wheat, the large quantities of resources avail-able for wheat production, the recent response of acreage toincreases in prices, and the price uncertainty characteristic ofthe competitive market appear to rule out a return to the freemarket for wheat which prevailed prior to the depression period.
On the other hand, emphasis upon freedom of decision, de-mocracy in political actions, and the traditional independenceof farmers appear to preclude the development of any program ofhighly regimented actions such as centralized planning, or evenprograms similar or comparable to the Canadian or British plans.A two-price or multiple-price system falls within the realm ofpolitical feasibility and taxpayer tolerance, but economic anal-ysis of such schemes leaves much to be desired in terms of long-run contributions to real solution of basic problems. In the longerrun as a possible successor to a system of flexible prices, a schemeof forward pricing offers substantial possibilities. Forward pricinghas some of the advantages, in terms of stability of income andprice assurance, characteristic of the system of pricing of theproducts of industry and the system of wage determination. Atthe same time it provides opportunity for flexibility of adjustmentfrom season to season to take into account the variability ofyield resulting from natural influences and the variability inutilization arising from fluctuations in nonfood uses of wheat.
Modifications over time or changing emphasis on economicgoals may reduce the inconsistency or conflicts in goals. Thismay make it easier to develop and plan action programs in thefuture. The current generation of citizens apparently gives lessemphasis or priority to freedom of ownership and resourceuse and relatively more emphasis to economic security and priceassurance than did the generation of our fathers and grand-fathers. This indicates that understanding and acceptance of basicgoals may make it easier to determine the means or method ofimplementing goals in the future.
57

In an opening paragraph of this paper, it was recognized thatactions implementing agricultural policy may be designatedas direct price-income programs and general programs affectinguse of resources. When consideration is given to the long-runinterests of agriculture and the social welfare, one may contendthat an undue emphasis has been given to price policy duringthe last twenty years with relatively insufficient emphasis andconsideration to programs relating to resource use. When thecontribution of agricultural research and agricultural educa-tion, including the efforts of extension workers, is considered,one is inclined to conclude that more long-run benefits mighthave been obtained for agriculture if a portion of the half billiondollars used to subsidize exports of wheat had been directedtoward expansion of fundamental research and adult education.This is not intended to minimize past accomplishments. Ratherit is a tribute to scientists and educators who have contributed tothe sound and efficient use of agricultural resources in America.It is through these means rather than through direct financialassistance that real improvement in the welfare of wheat farmersis to be achieved. The real solution to the wheat surplus problemlies in this direction. This road is long and progress may not bespectacular.
58

0 \ oO \ -0 CM O t- \e c\ so CM r^
00 r ^ c<" <-(\ O O O N^0 rN 00 00 rN
0 l- CN cn 000- 00 00o o in
) I 00 O C\d c- cc o00 Lf)
,C 00 LOf00
o o ^t-
I \3- GN C mo oo m oo
0- O o cn
e 00 CN \o
r- r- o Cq 0000 -Cm Cq 00\O CO00 - Ln3
00 O T- "t C\V- r- -- 4
r- O en q- -i-n cN T-i T-i en-i Len -L 00
e no- CM CM^ GCO Ni 00 00 en
t \S Cs CM N
r-- o C ss o0 oo <- O00 00 00 00en" r" O CM csen M n T
e en cl oCn N- un \0
0 en r 00 LrO eL- en C- cn00 Ln SO Go nLn Or en scr- LM tcq enCSO \O C\\ CN
0 O L so O
T-I -»- enl tn ten
L N C eON C O O f-LO cL oo oo o , eon C' en
Lr- 00 oLn o 00
ON \o 0 L sor-~ C \so CM ̂tdt 00 o Cl ON
00oo o t. t-
0o t en en L Lm rf e 00 T-
r^ t4 It oo It
en ONG r r- O0 00 o0 ON CON
11 14 f I - - d'
en 00 LO V- 00Ce ,T O\ 00
00 t N- C> e-oC Lo r- ON00 00 CO O ON
CM 00 T-
00 00 ON C -
ON eC cN C-N-T
0 00 t 0
00d LO LnT- T- T-4 CM
m ON o L sot CN C>0- v- e o
Le) CN00 LeC)Le \ s so entI so oo rl- CM00 C4N\ 00 No CM N oONONt - Ooo N00
00 T-C00
O -o -I N
ON e) o o T-O en so CN Lt
s- \0 0 n-
,\ C> 00tfi T ON" en
00 O OS 00 O
c- en \0c L)NCM en t O uO
t\ 00 en T- T-CM en so so cc
o00 t Ln C SIC\ CM en so r-oo '- G\ oC -O00 00 1OO Lnr en00 \O 't- 00 00C -- CM "- C\
,-(' T--» "-< <-q-
V) Lr
C\ Llr)
Lr) Lr
C 0 ClM CM L-( C0 CM CM o eC)i r
CMq CM l CM r en r-en ef n en e -e Cn
l CM \sO 00 o 0 Ooo m N- C 00 Lo00 o Ln m 0 o-
O O v- 00 C ^ -
00 t- 00 ON 0 T-I 0
- Lf r- r- 00 \o00 t- oo- \O 0 \o so
\ soo 0- t 0-e 0t-0L O Il 0 00 e
CN 00 en cs -l CN OCM Lf \ C O C\l CC)
CTl
so en It m * -n r 00 C OS\ N- - C O
0 00 C0 0 00 00 00
l^ een in M 00 oo"d- 00o C Lr C
t-i 00c0 o- C0 000
t d I- " 'd d- lt-
,t r- 00 - O000 o t- L m ONN- CN 00 en 0000 Cl CNT CMN-
0e0 M C ON 0
en 00 T- T-_ u
CO w- Os ON )
T C 00 M 00
0 0 4 - j
oo o) en ) oo
00 00 e st 00
-I O00 ON Clq o 00 o O
CM 6[ T- e
m so N- 00 o o -N C) en e tI Lr \0 r- 00 oNCc cnc Ce n ennc - "t-·T-^ f- - qq- T I t I "dON ON ON ON O N ON OC % O N ON\ Ci ON\ ON
o'oo '"
o00C-) O
d -
00 +-4''c 00 tO O '1
n- en C
CI. CM,
O 0\ 0\
T Ol T-
n en CM
O ON ON.- . -- i
59
I10
I0t
P.
w
0H
10UZ4)
5-
'-4
10
to
0
0C/2
"1'.
ts
iR
-4
C1
Ut
LO)
m
F-4
,4
Pcen
w
-4
m/
»\
>4
1.a4
I)
i4
14
1-4
I--V>
&04
0O
.E2U0-4
00

TABLE 2. WHEAT: SEEDED ACREAGE IN SPECIFIED WHEAT GROWINGREGIONS, UNITED STATES, 1919-53
Region
Year Hard Winter Spring Soft Winter PacificWheatl Wheat2 Wheat3 Northwest 4
Average1929-33
19191920192119221923192419251926192719281929
1930193119321933193419351936193719381939
1940194119421943194419451946194719481949
195019511952519536
Thousands of Acres
27,636
24,72722,06623,83025,47823,91020,17722,89323,93526,53727,20427,234
28,32728,43427,10927,07826,61528,14529,93134,93335,35628,028
26,11227,50823,28023,52528,96131,95233,83737,55336,50939,385
32,89035,43634,78034,316
20,416
21,70619,90520,52618,06517,53316,00618,29518,05619,48721,13020,687
19,95919,11620,78321,53517,71820,60521,80620,08620,90415,929
17,24816,76214,73717,08319,19318,61620,03720,64820,24422,693
18,96722,09122,06021,325
10,568
20,66017,10615,48115,40415,43912,41411,94511,26411,68114,49810,623
10,60910,78710,06510,75511,74512,60813,04215,73313,62011,392
10,65810,736
8,3398,2389,978
10,2949,034
10,28911,15611,165
9,96710,12810,11510,635
5,202
4,7744,8174,2884,2683,9743,9585,4364,2564,6124,6995,186
5,3614,6624,8535,9464,2934,3655,1175,3494,8053,941
4,1714,1293,5024,2054,6024,7935,1435,3735,5825,950
5,1685,8485,8255,995
1Kansas, Oklahoma, Texas, Nebraska, and Colorado.2North Dakota, Montana, South Dakota, and Minnesota.30hio, Missouri, Indiana, Illinois, Pennsylvania, North Carolina, Virginia, Kentucky,
Tennessee, Maryland, South Carolina, Georgia, and West Virginia.4Washington, Oregon, and Idaho.5Preliminary.6 December 1952 winter estimate and March 1953 spring prospective plantings.
Source: Wheat Situation, USDA, Bureau of Agricultural Economics.
60

TABLE 3. WHEAT: SUPPLY AND DISTRIBUTION INCONTINENTAL UNITED STATES, 1909-53
Total Total Do- NetYear Stocks New Total Total Do- Net StocksBeginning 1 Crop Domestic mestic Dis-
July Supply appearance
Millions of Bushels1909
1910191119121913191419151916191719181919
1920192119221923192419251926192719281929
1930193119321933193419351936193719381939
1940194119421943194419451946194719481949
19501951195251953
55
110125110125115
67225
804085
170124
96132137108
97109113227
291313375378273146140
834153250
280385631619317279100
84196307
425396256559
684
625618730751897
1,009635620904952
843819847759842669832875914824
887942756552526628630874920741
815942969844
1,0601,1081,1521,3591,2951,098
1,019981
1,2911,175
739
735743840876
1,0121,076
860700944
1,037
1,013943943891979777929984
1,0271,051
1,1781,2551,131
930799774770957
1,073991
1,0951,3271,6001,4631,3771,3871,2521,4431,4911,405
1,4441,3771,5471,734
538
537552568612607609596555580647
574579603620613584611677656622
759760722633659661689701713663
676668949
1,237992894767757678679
690673672
91
7381
147149338242184105279220
315268208134258
96209194144138
106120
3124
- 63-273-223103110
48
342832
-913106393401490506301
358448316
110
125110125115
67225
804085
170
12496
132137108
97109113227291
313375378273146140103153250280
385631619317279100
84196307425
396256559
1Stocks 1909-22 partly estimated to include same positions as currently reported.2Includes products in terms of wheat and includes shipments to territories of the United
States, which currently total about 4 million bushels.3Net imports.41909-36, some new wheat included in commercial and merchant mill stocks; 1937 to
date, only old crop is shown in all stocks positions.5Preliminary.Source: Wheat Situation, USDA, Bureau of Agricultural Economics.
61

TABLE 4. PERCENTAGE OF WHEAT ACREAGE ABANDONMENT,MAJOR REGIONS, 1919-52
Hard Soft PacificFor Crop of: Winter Winter Spring Northwest
Percent
1919
1920192119221923192419251926192719281929
1930193119321933193419351936193719381939
1940194119421943194419451946194719481949
195019511952
1
116
1823
5209
19167
859
43334532251626
261778
15784
1113
223812
1
92369845
445
8253437767
3108
11765544
8126
14
4516157134
4344
24592161291915
6326544577
446
2
7243
1328
3348
19109
331512161678
455
156556
1211
595
62

TABLE 5. FREQUENCY DISTRIBUTION OF PERCENTAGE OF WHEAT ACREAGEABANDONED, MAJOR WHEAT REGIONS, UNITED STATES, 1919-52
RegionPercentage of ReAbandonment Hard Soft Pacific
Winter Winter Spring Northwest
Number of rears
0- 4 2 11 14 85- 9 11 19 11 14
10-14 4 3 1 515-19 6 2 520-24 3 225-29 3 1 130-34 2 1 135-39 140-44 1 145-49 150-5455-59 1
60 and more 1Total 34 34 34 34
TABLE 6. COEFFICIENTS OF CORRELATION AS CALCULATED FOR THEFOUR MAJOR WHEAT PRODUCING REGIONS
Region r Degree of Significance of rl
Hard Red Winter +.75 Highly significant, i.e., 1% levelPacific Northwest +.73 Highly significant, i.e., 1% levelSpring +.59 Significant, i.e., 5% levelSoft Red Winter -. 13 Nonsignificant
1The degree of significance is based upon probability estimates. Its meaning may beexpressed as follows, using the coefficient of correlation of the hard red winter area as anexample: If there actually is no relationship between two variates of a population, thechances of getting a sample r as large as .75 (with 15 degrees of freedom) are less thanone in one hundred. Therefore, it may be concluded that there is a relationship betweenthe variates in question.
No adjustments have been made for possible effects of trend. The calculations werebased on data for years, 1936 to 1951. It is likely that trend effect in that period wouldbe negligible as the wheat industry was well established and no major innovations wereintroduced.
TABLE 7. MEAN AND STANDARD DEVIATION, YIELD PER SEEDED ACRE,MAJOR WHEAT REGIONS, UNITED STATES, 1938-53
Region
Hard Red Soft Red PacificWinter Winter Spring Northwest
Bushels per Acre
Mean 12.7 18.2 14.4 24.7Standard
deviation 3.3 2.5 3.6 2.3
63

TABLE 8. INCOME (VALUE OF PRODUCTION) FROM WHEAT,
HARD RED WINTER WHEAT REGION (KANSAS, OKLAHOMA,
TEXAS, NEBRASKA, COLORADO), 1920-52
Deflatedl Income
Millions
$250189152107221148241202215198
1501207096
118109184248146137
137223296249314348444615409344
290211437
64
For Crop of:
1920192119221923192419251926192719281929
1930193119321933193419351936193719381939
1940194119421943194419451946194719481949
195019511952
1Deflated by index of prices paid by farmers, interest, taxes, and wages, 1910-14=100.
Source: 1920-44, Wheat Production, Farm Disposition and Value, 1904-44, USDA,Bureau of Agricultural Economics, March 1948; 1945-51, Agricultural Statistics, USDA(production times average season's price received by farmers); 1952, calculated.

TABLE 9. INCOME (VALUE OF PRODUCTION) FROM WHEAT,OHIO, INDIANA, AND ILLINOIS, 1920-52
Deflated 1 Income
For Crop of: Total ofOhio Indiana Illinois TThree States
Millions
192019211922192319241925192619271928192919301931193219331934193519361937193819391940194119421943194419451946194719481949195019511952
$3020232431233023
8221519143027303436232327382823354848484672372639
$23192022252528238
2214149
1822192626141417261113212928343028202325
$443338363033342817181915102426203035202322261015202118283434232630
$977281828681927433624848337275699097576066904951769894
110110134807594
1Deflated by index of prices paid by farmers, interest, taxes, and wages, 1910-14=100.Source: 1920-44, Wheat Production, Farm Disposition and Value, 1904-44, USDA,
Bureau of Agricultural Economics, March 1948; 1945-51, Agricultural Statistics, USDA(production times average season's price received by farmers); 1952, calculated.
TABLE 10. AVERAGE HOURS OF LABOR USED PER ACRE, AND PER UNIT OFPRODUCTION AND YIELD PER ACRE OF WHEAT FOR SELECTED PERIODS, 1910-48
1910-14 1925-29 1935-39 1940-44 1945-48
Man-hours per acre 15 11 9 7 6Yield, bushels 14.4 14.1 13.2 17.1 17.7Man-hours per 100
bushels 106 74 67 43 34
65
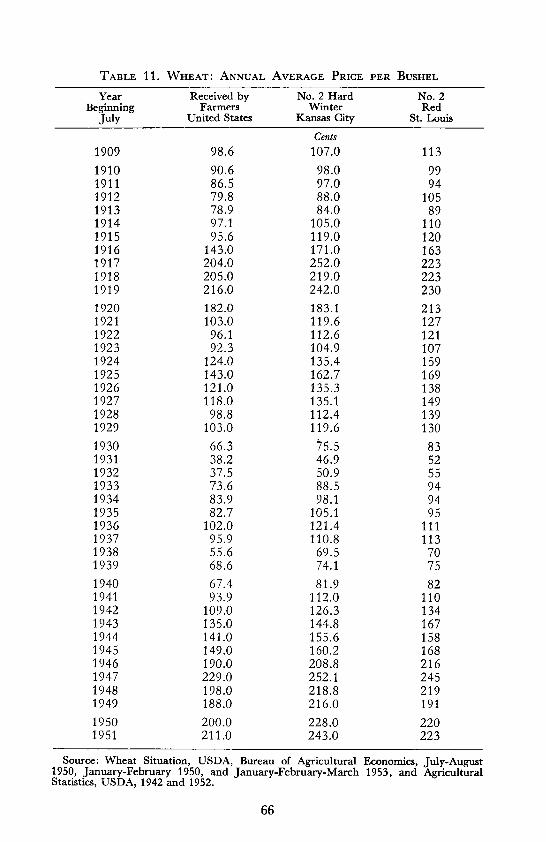
TABLE 11. WHEAT: ANNUAL AVERAGE PRICE PER BUSHEL
Year Received by No. 2 Hard No. 2Beginning Farmers Winter Red
July United States Kansas City St. Louis
Cents
1909 98.6 107.0 113
1910 90.6 98.0 991911 86.5 97.0 941912 79.8 88.0 1051913 78.9 84.0 891914 97.1 105.0 1101915 95.6 119.0 1201916 143.0 171.0 1631917 204.0 252.0 2231918 205.0 219.0 2231919 216.0 242.0 2301920 182.0 183.1 2131921 103.0 119.6 1271922 96.1 112.6 1211923 92.3 104.9 1071924 124.0 135.4 1591925 143.0 162.7 1691926 121.0 135.3 1381927 118.0 135.1 1491928 98.8 112.4 1391929 103.0 119.6 130
1930 66.3 75.5 831931 38.2 46.9 521932 37.5 50.9 551933 73.6 88.5 941934 83.9 98.1 941935 82.7 105.1 951936 102.0 121.4 1111937 95.9 110.8 1131938 55.6 69.5 701939 68.6 74.1 751940 67.4 81.9 821941 93.9 112.0 1101942 109.0 126.3 1341943 135.0 144.8 1671944 141.0 155.6 1581945 149.0 160.2 1681946 190.0 208.8 2161947 229.0 252.1 2451948 198.0 218.8 2191949 188.0 216.0 1911950 200.0 228.0 2201951 211.0 243.0 223
Source: Wheat Situation, USDA, Bureau of Agricultural Economics, July-August1950, January-February 1950, and January-February-March 1953, and AgriculturalStatistics, USDA, 1942 and 1952.
66

TABLE 12. PER CAPITA CIVILIAN CONSUMPTION OF WHEATFLOUR AND CEREAL, UNITED STATES
Year 1 Wheat Flour Cereal
Pounds
1909
1910191119121913191419151916191719181919
1920192119221923192419251926192719281929
1930193119321933193419351936193719381939
1940194119421943194419451946194719481949
1950
209.4
211.9206.8212.5206.6207.2200.0205.1198.4164.3196.8
186.5177.7181.4176.3175.1176.9177.7173.5177.3174.0
172.0167.0161.0158.0157.0157.0162.0158.0159.0157.0
154.0155.0156.0162.0148.0160.0156.0138.0137.0135.0
134.0
3.0
3.03.03.03.03.13.13.13.23.23.2
3.33.43.53.53.63.63.63.63.53.5
3.53.53.53.53.53.63.53.63.73.9
3.83.83.83.83.73.73.33.33.33.3
3.3
l Calendar year.
Source: Agricultural Statistics, USDA.
67

TABLE 13. WHEAT PROCESSED FOR FOOD, DOMESTIC DISAPPEARANCE,AND NET EXPORTS, UNITED STATES
Year Processed TotalBeginning for Domestic Expo
July Food Disappearance Exports
Millions of Bushels
1909 538 911910 537 731911 552 811912 568 1471913 612 1491914 607 3381915 609 2421916 596 1841917 555 1051918 580 2791919 647 2201920 574 3151921 579 2681922 603 2081923 620 1341924 613 2581925 584 961926 611 2091927 677 1941928 656 1441929 622 1381930 500 759 1061931 498 760 1201932 508 722 311933 465 633 241934 475 659 - 621935 484 661 -2721936 489 689 -2221937 485 701 1031938 496 713 1101939 490 663 481940 492 676 341941 473 668 281942 500 949 321943 482 1,237 -91 2
1944 472 992 1061945 473 894 3931946 483 767 4011947 488 757 4901948 479 678 5061949 484 679 3011950 482 690 3581951 481 673 4481952 6693 2981953 6863
lIncludes products in terms of wheat and includes shipments to territories of the UnitedStates, which currently total about 4 million bushels.
2Net imports.SPreliminary.
68

\ oo Lt3 e'\ c, O '
Go Gri c i
GIN M CcC N
- C', (' 000O t, )('
GC O0 N t
cl cl ooo t CV e-
1o 4 cli6 * .4C 3 c e
rn
Z
zZ
E-4
0
vOrD
Z
Z <
Co
3vo3
:: a
Z
a <
o
o<u
vt
¢
31-4
cn
3.--
e
CA
O
01
CIN T \.O CN
cIi ' 0
oo t- C s l
-i c. .
tl N Lr 00
oo " m Co00 Cq Lr) cn~cli ci · :* *
IL)
co
Wr
I=0
Wo
Ei3
0a
f,-{
.5
rA
o
m
ONk
c, ok q .
o U 0
PY a r
'o °.rb rwcS gY
7 c XI- 3
bl
o..ct
Ur./
'd 0
edkd
P, o
0 O0 x .,.A
c, M r o _ 5
ox Z f F: v O c69
Cd
69
-d4
c;o
_s=f
'I _
g -.-
o z
v oC> 0
-4 r-
_n+
', -
rr
.o . ~ ~-
¢.)
Z r
* 0 gU)( r O
P., Ct 0 CtC
s..,-4 o -
.o E m 's ; oO QQ
VO~~~~~~~4
· rl a E~~
cn E
o4-1
on4-4
CX
._ ._
O1 >1
Cn t-
ltd cq
CN CN
4 Ge*_4 *_4
4 aVM CA
U U
C3 E:=O et V
$4 4
CI O T- cn OC C, O i t- Go IW-t 00 b
Lf) 00 v- It C) 0O 00) SO G\ qj- N( cq Cq Lr) Lur F
, -: cc; cl 'G 0' 0' 06 00 '0 '4
· V--4; 'C '~ 'f T o o ',Lf O 4OC T- N N r t- le) O) r
C> oo r- - C clq N MI o. CD o: Go4 C4
a cc, oO oO ct Cri 00 00 4t CVa oO ~ t~ a CV C\1 c, ~ a a ~--' C~ v*1
r- C) 0 C 4S ql c) M t- C) C,( ) -
1-4 I O 00 G 0 cn c " LO Ce )
Cr C c c o 11 06i . * .. * * .
cq cn -e O 0 d CS N cq \o C1 )C"I Lf) u3 Cc en ) \C c en \0 a Ljr) r.
· 11
Cli 4 eT~r~0 oeIGt6 r114 r4CS m m e 1 4 r- 1< c101
·cI 00 GI o r CN C- C> C-, N 00* C * * .C ) C.f . * . -.14 Cr; \6 0 Lt~ · ·
r 4 14 oN

t oo n oN O N
Ln t cN o oN
o u-) CD O C
Ln Lf Ln u, Ln u-
M oo tn 0o ON N
m LI L- n O &r- N,
c* N iNC iN ) C^ MN
mt cc IN -ON otiN tiN ^- M ON
'--4-co i-n o c CM
»-nccnin-0cON N'-4 ^-4 t~- Cti o c- 0nON cc nCM
t- oo'--4C
NuI
Ln
I
G\c\
00
0,0
Lnr-
0
NON"
c\ONo"
o
[-.0r--CN
r--r--
00
I
000o"
0GC
000C\
C-
o0
C)o00
M CO t-- CN \0 <-4- C 00 . CM-- o cc · t N
cN N NC '-4 -1 1-4
0 0 '0 N 0 0O C r0 LO
70
0000
0
000
0
0d0
LIN
0
0
0*
O
)-
c.
rn
ccCO0
0
-
1)
0
Pc
u
I)
30
0w
z
4i0
z
tiN
H
F--
aCF0
S
0
0
L,04
II
Coo Ie
inI c?
in *^
bo
+9^
§ -n
o 11
Co II5 cn
I'
^II
c ;
.l-r X
I.Sn
4)0 0U
a ,,
, 1 $
t-
0st3
0f
(A
x0 c
0 4) c.^O. v
o.U4C-i