whdfklqj kdyh kljk h[shfwdwlrqv dqg iru ... in 10 high school teachers (81%) attend after-school and...
TRANSCRIPT

AMERICA’S TEACHERS ON AMERICA’S SCHOOLSPRIMARY SOURCES:
A PROJECT OF SCHOLASTIC AND THE BILL & MELINDA GATES FOUNDATION
This report is a collaboration of Scholastic and the Bill & Melinda Gates Foundation. Copyright © 2010 Bill & Melinda Gates Foundation.
All Rights Reserved. Published by Scholastic Inc. Printed in the U.S.A. Item Number: 279011

1 | PRIMARY SOURCES
We all remember at least one teacher who made us think, who challenged us, who encouraged us, who
prepared us for tomorrow and who helped to make us the person we are today.
Teachers play a critical role in students’ academic achievement, in our workforce’s skills and in our
nation’s future. They dedicate their lives to educating, inspiring and preparing today’s youth for life
beyond high school and yet, according to the 2010 MetLife Survey of the American Teacher, 69% of
teachers believe that their voices are not heard in the debate on education. The goal of Primary Sources
is to place the views of our nation’s public school teachers at the center of the discussion on education
reform. As our nation grapples with how to dramatically improve student academic achievement, we
must ask ourselves—if teachers are left out of the conversation on school reform, can the movement
ultimately succeed?
When Scholastic and the Bill & Melinda Gates Foundation reached out to teachers with a blind
questionnaire on American education, more than 40,000 of them responded, making this a landmark
undertaking—what we believe is the largest-ever national survey of America’s teachers. We heard from
educators in every state and at every grade level. We heard from those who teach in one-room schools
in rural communities, in affluent suburbs and in large, urban districts. We heard from teachers in
classrooms with children who are learning English, those with gifted students and those with children
who have special needs. Indeed, the diversity and variety of our surveyed teachers reflects the challenge
and opportunity inherent in addressing policy for America’s schools.
We asked teachers about the state of American education—about the challenges facing students and
the variety of supports and tools that teachers need to tackle those challenges. The response was
overwhelming, confirming what we have always known to be true: that teachers are fully engaged
in the hard work of educating our children; that they have strong ideas on how best to raise student
achievement; and that they are vocal advocates for students, with thoughtful opinions on education
reform, rooted in the realities of the classroom. They have powerful views on a number of issues that are
central to the conversation around American schools—from performance pay and standardized tests to
academic standards and teacher tenure.
Public school teachers were nearly unanimous in telling us that a high school diploma simply is not enough
for today’s students: 93% of teachers say that schools must prepare students for more than high school
graduation. At the same time, 9 in 10 teachers say that not all of their students could leave high school
prepared to succeed in a 2– 4-year college. Indeed, they are not far off—according to Education Week’s
A LETTER FROM SCHOLASTIC AND THE BILL & MELINDA GATES FOUNDATION

2 | A LETTER FROM SCHOLASTIC AND THE BILL & MELINDA GATES FOUNDATION
2009 Diploma’s Count, less than 70% of American high school students graduate from high school and,
of those who do, far too many are unprepared for the rigors of higher education and today’s workplace.
Citing this disconnect, teachers identified five ways that we can address the challenges facing today’s
schools and ensure that all students achieve at their highest level:
1. Establish Clear Standards, Common Across States — Teachers see the role standards can play in
preparing students for their future, but want clearer standards and core standards that are the same
across all states. Nationwide, 74% of teachers say that clearer standards would make a strong or
very strong impact on student achievement, with only 4% saying they would have no impact at all.
60% of teachers say that common standards would have a strong or very strong impact on student
achievement, with only 10% saying that they would have no impact at all.
2. Use Multiple Measures to Evaluate Student Performance — From ongoing assessments throughout
the year to student participation in individual classes, teachers are clear that these day-to-day
assessments are a more reliable way to measure student performance than one-shot standardized
tests. Ninety-two percent of teachers say ongoing in-classroom assessment is either very important
or absolutely essential in measuring student performance, while only 27% say the same of state-
required standardized tests.
3. Innovate to Reach Today’s Students — To keep today’s students engaged in learning, teachers
recognize that it is essential for instruction to be tailored to individual students’ skills and interests.
More than 90% of teachers say that differentiated assignments are absolutely essential for improving
student achievement and engaging students in learning. Also, showing a clear understanding of the
world students inhabit outside of school, 81% of teachers say that up-to-date information-based
technology that is well integrated into the classroom is absolutely essential or very important in
impacting student achievement.
4. Accurately Measure Teacher Performance and Provide Non-Monetary Rewards — Teachers are
skeptical of current measures of teacher performance, with only 22% indicating that principal
observation is a very accurate measure. At the same time, more than half of teachers indicate
that student academic growth (60%) and student engagement (55%) are very accurate measures
of teacher performance—much more so than teacher tenure, which a significant number of
teachers said is not at all accurate. When asked about teacher retention, nearly all teachers say
that non-monetary rewards like supportive leadership and collaborative working environments
are the most important factors to retaining good teachers. Fewer than half of teachers say higher
salaries are absolutely essential for retaining good teachers and only 8% say pay for performance is
absolutely essential.
5. Bridge School and Home to Raise Student Achievement — Teachers know what is necessary to
build a sustainable culture of achievement in their schools: the right mix of academic instruction,
family support and student engagement. Eight in 10 high school teachers (81%) attend after-school
and weekend events of their students, and more than half (51%) of elementary school teachers are

3 | PRIMARY SOURCES
willing to have parent-teacher conferences at students’ homes. This report breaks down the above
data and much more, revealing the diverse opinions of America’s teachers. Teachers’ strong but
nuanced views on education are called out, particularly across teacher characteristics in two key
dimensions: grade level taught and the length of time they have been teaching. Similarly, state-level
data reflecting teachers’ views on education policy and practice are discussed where interesting
differences were found. The data tables in the appendix of the report further segment the findings by
state and grade level. The quotes throughout reflect the wide range of views of the tens of thousands
of teachers who participated in the survey and focus groups.
It is important to note that despite the added challenges for teachers in low-income communities, there
is little difference between their views on these solutions and the views of their peers in high-income
communities. The message from Primary Sources is clear—a good school is a good school for all
children, regardless of income level.
While the report reflects the wide range of voices and opinions of teachers across the country, one
thing is constant: teachers teach for the love of their students and the chance to make a difference in
those young lives. Throughout this survey, we heard teachers declare their commitment to developing
the potential of each and every child. Our goal as a nation should be to do all we can to support them
in this endeavor.
Primary Sources is the beginning of an ongoing dialogue with America’s Teachers; we are already
planning the next step in this important exchange of ideas. We welcome your thoughts and opinions
on the report at www.scholastic.com/primarysources.
Sincerely,
Margery Mayer Vicki L. Phillips
President, Scholastic Education Director of Education, College ReadyScholastic Inc. United States Program
Bill & Melinda Gates Foundation

4 | TABLE OF CONTENTS / OBJECTIVES
TABLE OF CONTENTS
Methodology ............................................................................................................6
The Challenge .........................................................................................................9
The Solutions ........................................................................................................16
Solution 1: Establish Clear Standards, Common Across States ................ 17
Solution 2: Use Multiple Measures to Evaluate Student Performance ...... 25
Solution 3: Innovate to Reach Today’s Students ...................................... 33
Solution 4: Accurately Measure Teacher Performance
and Provide Non-Monetary Rewards ......................... 39
Solution 5: Bridge School and Home to Raise Student Achievement ....... 47
Appendix ...............................................................................................................53
Appendix A: Selected Survey Results ........................................................ 53
Appendix B: Teachers’ Views on Student Achievement (by state) ............... 77
Appendix C: Teachers’ Views on the Impact of Standards on Improving
Student Academic Achievement (by state) ................. 80
Appendix D: Teachers’ Views on State Standards (by state) ....................... 89
Appendix E: Teachers’ Views on Important Factors
in Retaining Teachers (by state) ................................. 92
Demographics.............. ............................................................................. Back Cover

5 | PRIMARY SOURCES
OBJECTIVES
• Place teachers’ voices at the center of discourse around education reform by sharing their thoughts and opinions with the public, the media and education leaders through the largest-ever survey of teachers in American public schools.
• Identify various supports and tools that directly impact teachers’ ability to improve student achievement and help students to realize their full potential.
• Explore teachers’ views on academic standards and assessments for measuring student and teacher performance.
• Accurately represent the diverse and nuanced opinions of America’s teachers — highlighting their powerful, complex ideas about both the challenges of preparing children for success and the solutions to those challenges.

6 | METHODOLOGY
METHODOLOGYPrimary Sources: America’s Teachers on America’s Schools consisted of several research phases, culminating in what is believed to be the largest-ever national survey of more than 40,000 public school classroom teachers.
Phase 1: Foundational Research with Many Stakeholders
Focus Groups with Teachers — October 2008
Twelve in-person focus groups were conducted with 108 K–12 teachers in Schaumburg, Ill., and Fort
Lee, N.J. (four groups with elementary school teachers, four groups with middle school teachers and
four groups with high school teachers). In addition, in-depth follow-up interviews were conducted with
several of the teachers who had participated in the focus groups. Throughout this report, when we use the
phrases “in conversation” or “in conversations with teachers,” we are specifically referencing information
and insights gleaned from the teachers we spoke with as part of this foundational research.
In-Depth Interviews with Education Stakeholders — November 2008
To build on focus-group research and ensure that we were moving in the right direction, in-depth
interviews were conducted with K–12 education experts, including education policy leaders and
advocates, educational researchers, public school administrators and teachers.
Phase 2: National Survey
The national survey, conducted by Harris Interactive, utilized telephone, mail-to-Web and email-to-
Web survey methods to ensure the inclusion of the broadest and best representation of teachers. The
list of teachers was sourced from Market Data Retrieval’s (MDR) database of public school teachers.
The survey was conducted by telephone (15,038 participated in the survey by telephone) and online
(25,452 participated in the survey online) from mid-March to mid-June 2009 among 40,490 preK–12
public school classroom teachers.1
The sponsors of the research were not revealed to respondents. Respondents were incented to participate
with a gift certificate to an online education store, which was revealed to be the Scholastic Teacher Store
Online only after they completed the survey.
1 Public school teachers who teach full-time in the classroom in grades preK-12, excluding those who teach physical education exclusively.
7 | PRIMARY SOURCES
Figures were weighted where necessary for gender, years of teaching experience, school level, region
and urbanicity to bring them into line with their actual proportions in the population. Propensity score
weighting was also used to adjust for any attitudinal/behavioral biases inherent in the sample of those
who responded in each mode (telephone or online).
Throughout this report, we display data on teachers who teach in mutually exclusive grade ranges, the
most common being elementary, middle and high school grades. Specifically:
• “Elementary school teachers” are teachers who teach grades K–5 and
no other grades (except preK).
• “Middle school teachers” are teachers who teach grades 6–8 and
no other grades.
• “High school teachers” are teachers who teach grades 9–12 and
no other grades.
Creating mutually exclusive groups allows for a more straightforward comparison between teachers and,
when the groups are based on common ranges such as the ones described previously, the vast majority
of teachers are captured in one of these three mutually exclusive groups.
Additionally, certain terms were defined in the actual survey to ensure that teachers were responding
with a clear and consistent understanding of the topic. These included:
• “By academic achievement we mean your students’ preparedness for the next level
of education.”
• “By student performance data we mean things such as performance on class assignments,
class participation and performance on standardized tests, etc.”
NOTE: In some cases, percentages may not sum to 100%, due to rounding and small no-answer rates.


9 | PRIMARY SOURCES
THE CHALLENGE Teachers overwhelmingly agree that a high school diploma is not enough to prepare students for success in a changing world. Teachers understand the unprecedented challenges facing this generation, and they recognize the disconnect between students’ current levels of achievement and the levels at which they must perform to achieve success in an increasingly competitive global economy.
Teachers Are Concerned that Students Are Not Adequately Prepared for
College and Careers
When asked to choose the single most important goal of schools and teaching from a list
of four possible goals, nearly all teachers (93%) — regardless of the grades they currently
teach — say that schools must prepare students for more than high school graduation.
Teachers’ Views on the Most Important Goal of Schools and Teaching Total %
More than a high school diploma (NET) 93
To prepare all students so they are ready for careers in the 21st Century 71
To prepare all students to be successful in a 2- or 4-year college 11
To provide all students with life skills such as managing a bank account, applying for a job and understanding a mortgage
11
To graduate all students with a high school diploma 6
In conversation, teachers are quick to address the complexities of this goal. They
understand the shifting social and economic landscape of the 21st Century: students
need rigorous, relevant curricula; they need to go on to college; and, most importantly,
they need to be prepared to face the unknown challenges of the future.
“Internationally, we are competingfor jobs and careers. We need to be more aware of what the world needs, and start thinking globally. I think the educational system is totally missing out on just howinterconnectedwe are.”
— HIGH SCHOOL TEACHER
“What’s going tohappen to these kids in college?I don’t know if they can make it.”
— HIGH SCHOOL TEACHER

10 | THE CHALLENGE
“College isn’t theway for everyone. My students want so much more forthemselves, but they don’t want college. I think we do students a huge disservice by offering only college-prep education.”
— HIGH SCHOOLTEACHER
Teachers recognize and are concerned about the disconnect between the level
of preparedness students will need to succeed in the future and the actual level of
achievement that those students currently reach. Their concerns are grounded
in the realities teachers face every day: Only 16% of teachers “agree strongly” that
students enter their classroom prepared for on-grade-level work. Only 28% rate student
achievement at their school as “excellent.” And, while 79% of secondary school students
plan to attend a 2- or 4-year college after high school,2 only about half of teachers think
that 75% or more of their students could leave high school prepared to succeed in a
2- or 4-year college. Only 9% of teachers say that all of their students could leave high
school prepared to succeed in a 2- or 4-year college.
Teachers’ Views on Student Achievement and Preparedness
Q. How much do you agree or disagree withthe following statement?
Q. Overall how would you rate student academic achievement at your school?
Q. In your view, what percentage of the students currently in your classes could leave high school prepared to succeed in a 2- or a 4-year college?
Agreement with Statement: “In general, students enter my classroom prepared for on-grade-level work.”
Rating of Student Academic Achievement at their School
Percentage of Current Students Who Teachers Believe Could Leave High School Prepared to Succeed in a 2- or 4-year College
Disagree strongly
Agree stronglyAgree somewhatDisagree somewhat
Poor
ExcellentGoodFair
Under 25% of students
Over 75% of students51-75% of students26-50% of students
14%
44%
26%
16%
3%
50%
19%
28%
9%
26%
17%
46%
2 The Metropolitan Life Survey of the American Teacher, 2000: Are We Preparing Students for the 21st Century.

11 | PRIMARY SOURCES
Challenges Grow as Students Move from Elementary to Middle to High School
According to the teachers surveyed, levels of academic achievement and potential
college success drop dramatically from elementary to middle school, with levels falling
even lower in high school — a trend that is mirrored in data from research on student
achievement, literacy rates and graduation rates. A number of factors are likely to
contribute to this trend, not the least of which is time. In conversation, teachers of older
students express concern that there is simply too narrow a window of time in which they
can tackle the challenges facing their students.
Teachers’ Views on Student Achievement and Preparedness (by grade taught)
Rate student academic achievement at your school as excellent
Q. Overall how would you rate student academic achievement at your school?
Believe over 75% of students in current classes could leave HS prepared to succeed in a 2- or 4-year college
Q. In your view, what percentage of the students currently in your classes could leave high school prepared to succeed in a 2- or 4- year college?
Strongly agree that in general, students enter my classroom prepared for on-grade-level work
Q. How much do you agree or disagree with the following statement?
Elementary School High SchoolMiddle School
18% 14% 12%
34%
23% 19%
52%
38% 38%
“We need betterintervention in the primary grades. First and second. By fifth and sixth grade, it’s too late.”
— MIDDLE SCHOOL TEACHER
“I can only do the best I can, especially by the time they are seniors. I can’t re-teach them English.”
— HIGH SCHOOL TEACHER
“If we don’t convince students in sixth, seventh, and eighth gradesthat education is important, they’re going to tune us out and move on.”
— MIDDLE SCHOOL TEACHER

12 | THE CHALLENGE
“Regardless oftheir background, students have theopportunity toachieve through education. Treat all students equally,provide high-quality teaching, have high expectations and students will succeed.”
— HIGH SCHOOLTEACHER
“With low-incomestudents, you haveto celebrate yourwins and mourn your lossesquickly.”
— ELEMENTARY SCHOOL TEACHER
Challenges in Low-Income Communities Are More Severe
It is well documented that teachers in low-income communities are faced with some
of the most significant challenges in American education. Among teachers who teach
in low-income communities (those with median household incomes under $40,000),
about 40% teach in urban areas and 40% teach in rural areas/small towns. While
the challenges across these communities are unique, teachers in low-income areas
are working against inherent social and economic inequities to ensure success for
their students.
Due in part to these inequities, achievement and college-preparedness measures
vary dramatically according to the median household incomes of the communities in
which teachers teach. A comparison of low- and high-income schools points to stark
differences in teachers’ perceptions of their students’ ability to meet the challenges of
the 21st Century.
Specifically, teachers in low-income schools are about:
• One-third as likely as teachers in high-income schools to agree strongly
that their students enter class ready for on-grade-level work;
• One-third as likely to rate student academic achievement
at their schools as excellent; and
• Half as likely to say that more than three-quarters of their students could
leave high school ready for postsecondary school success.
The response of teachers in low-income communities reflects the startling reality of
our most underserved schools — 50% of students in low-income communities will not
graduate from high school by the time they are 18 years old,3 and, of the 13 million
children growing up in poverty, only 1 in 10 will graduate from college.4
3 “Diplomas Count,” Editorial Projects in Education (Education Week), 2007.4 Mortensen, Tom. “Family Income and Higher Education Opportunity,” Postsecondary Education Opportunity,
2005 with updated data from 2006.
59% of teachers—
regardless of school
income level—believe
that high expectations
for students are either
absolutely essential
or very important in
impacting student
achievement.

13 | PRIMARY SOURCES
“Regardless of how the students come in, it’s our job topick up and do thebest that we can.”
—MIDDLE SCHOOL TEACHER
“You can be a good teacher no matterwhere you teach. You can reach kids no matter wherethey come from.”
—HIGH SCHOOL TEACHER
Teachers’ Views on Student Achievement and Preparedness (by schools median household income)
Rate student academic achievement at your school as excellent
Q. Overall how would you rate student academic achievement at your school?
Believe over 75% of students in current classes could leave HS prepared to succeed in 2- or 4-year college
Q. In your view, what percentage of the students currently in your classes could leave high school prepared to succeed in a 2- or 4-year college?
Strongly agree that in general, students enter my classroom prepared for on-grade-level work
Q. How much do you agree or disagree with the following statement?
<$40K $50K-$69.9K$40K-$49.9K $70K+
16%10% 12%
27% 29%23%
18%
50% 49%
36%39%
64%
At the State Level, Teachers’ Views on Achievement and Preparedness Vary
Widely, Largely Aligned with the Nation’s Report Card
There is significant diversity among teachers at the state level across the three measures
of student academic achievement and preparedness indicated above. Averages at the
high end of the response range for student preparedness for on-grade-level work and
for overall student academic achievement are more than double the average response
rates at the low end of each range. There is less diversity around the percentage of
students who teachers think could leave high school ready to succeed in college, but
the range is still wide enough to be significant.
When considering the high and low ends of each of these three measures of achievement
and preparedness, the differences become even more clear.

14 | THE CHALLENGE
“I visited a nearbyuniversity, and theprofessors told mehalf of the studentswho take FreshmanComp (which is arequired class) failit and have to takeit again.”
— HIGH SCHOOLTEACHER
Teachers’ Views on Student Achievement and Preparedness (by state)
Strongly agree that “In general, students enter my classroom prepared for on-grade-level work.”
Rate student academic achievement at school as “excellent”
Percentage of current students teachers believe could leave high school prepared to succeed in a 2- or 4-year college
HIGH END
IA
MA
ND
NH
NJ
PA
Average: 23%
KS
MN
MT
ND
NH
SD
Average: 38%
MA
ND
NJ
SD
VT
Average: 76.2%
LOW END
AK
DE
HI
MS
NC
NM
Average: 9%
AK
DE
HI
NV
WV
Average: 15%
AK
HI
LA
NV
WV
Average: 61.9%
Q. How much do you agree or disagree with the following statement?
Q. Overall, how would you rate student academic achievement at your school?
Q. In your view, what percentage of the students currently in your classes could leave high school prepared to succeed in a 2- or 4-year college?
NOTE: The states with the five highest and five lowest numbers are shown in alphabetical order. In some cases, there are more than five states listed because responses from several states were tied.
At the state level, teachers’ perceptions of their students’ academic achievement align
with the National Assessment of Educational Progress (NAEP) scores for math and
reading at the fourth- and eighth-grade levels. The states that receive the highest ratings
according to the perceptions of teachers within those states tend to have higher-than-
average NAEP scores. Conversely, those that receive low ratings among teachers tend
to be at the lower end of NAEP scores.5
5 Additional state-level views on student achievement can be found in Appendix B.

15 | PRIMARY SOURCES
Teachers Who Teach Exclusively 11th and 12th Grade Students Report Higher
Levels of Achievement and Preparedness among Those Students
An interesting dynamic occurs during high school in terms of teachers’ views on
achievement and preparedness; ratings on both factors increase among those teachers
who teach only 11th and/or 12th grade, versus those who teach only 9th and/or 10th grade.
• Half of exclusively 9th–10th-grade teachers (49%) report that students enter
their classroom prepared for on-grade-level work. This is higher among
exclusively 11th–12th-grade teachers, at 60%.
• One-third of exclusively 9th–10th-grade teachers (32%) say that at least
three-quarters of their students could leave high school prepared to succeed in
college. This rises to nearly half (45%) of exclusively 11th–12th-grade teachers.
While it is important to note that teachers who teach only 11th- and 12th-grade students
are more likely to be veteran teachers and teach subjects that typically include more
elective coursework, it is likely that this trend is also impacted by lower-performing
students dropping out of high school before the 11th grade.
“Our studentpopulation takesa massive dipbetween ninth andeleventh grades, and then it levels. If I’m 16, and there’s no way I’m going to college when I graduate high school, what’sgoing to keep me in college-preparatory coursework for the next two years?”
— HIGH SCHOOL TEACHER


17 | PRIMARY SOURCES
SOLUTION 1: Establish Clear Standards, Common Across StatesTeachers recognize the role of academic standards6 in improving student academic achievement and helping students prepare for college, careers and life in the 21st Century. There is strong support among teachers for making standards clearer than they currently are and many say that common standards across states would have a strong impact on improving student academic achievement. Additionally, there is support for tougher standards, particularly among high school teachers.
Teachers Value the Role Academic Standards Can Play in Improving Achievement
There is broad acceptance among teachers of the impact academic standards can have
on improving student academic achievement. A vast majority say that having clearer
academic standards (95%), establishing common standards across states (90%) and
having tougher academic standards (85%) would make at least a moderate impact on
improving academic achievement:
Teachers’ Views on the Impact that Changes to Current Standards Would Have on Improving Academic Achievement
Strong impactVery strong impact No impact at allModerate impact
100(%) 0 20 40 60 80
Clearer academic standards for students
The establishment of commonstandards across all states
Tougher academic standards for students
Fewer academic standards for students
Q. How much of an impact do you believe the following efforts would have on improving student academic achievement?
30 43 22 4
24 35 31 10
13 32 40 14
11 23 36 28
“We owestudents aconsistency across their education.”
— MIDDLE SCHOOL TEACHER
“Standards areabout equity andexpectation.”
— HIGH SCHOOLTEACHER
“Students need to have high standardsand they need toknow what those standards are. They need to know whatthey will be held accountable for.”
— ELEMENTARYSCHOOL TEACHER
6 Academic standards set forth educational goals in terms of what students should know and what skills they should have in order to succeed in school and beyond. Current standards vary from state to state.

18 | THE SOLUTIONS
“Nationalizededucation standards would provide a level playing field forall teachers and learners. Common assessments and collaboration on a professional level would blossom because the goals would be clearto everyone.”
— MIDDLE SCHOOL TEACHER
Teachers are less inclined (although it is still a majority) to favor fewer standards, with
71% of teachers saying that fewer academic standards would make a moderate or
greater impact on improving academic performance and 28% saying it would make no
impact at all. In conversations, teachers express concern that “fewer standards” might
mean a “less rigorous” or “less comprehensive” curriculum.
Note that when the more stringent measure of “very strong” or “strong” impact on
improving academic achievement is considered, nearly 3 in 4 teachers (74%) favor
clearer standards and about 6 in 10 (60%) favor standards common across states.
Tougher standards drops to just under half of all teachers (45%) while fewer standards
drops to 1 in 3 (34%). In step with 59% of teachers believing that common standards
across states would strongly impact achievement, 52% of teachers think the same of
common assessments across states.
Teachers’ Views on Standards Shift as Students Progress in Grade Level
As the grade level they teach increases, teachers are more likely to say tougher standards
would improve student achievement and less likely to say that common standards would
do the same.
Specifically, 57% of high school teachers say tougher academic standards would make
a strong/very strong impact on improving student achievement — this is about 20%
higher than the percentage of elementary school teachers who say the same. However,
high school teachers are significantly less likely (46% compared to 66% of elementary
school teachers and 59% of middle school teachers) to say that establishing common
standards across states would improve achievement.
59% of teachers
think standards common
across states would have
a strong or very strong
impact on improving
student achievement.
52% say the same of
common assessments
across states.

19 | PRIMARY SOURCES
Teachers’ Views on Changes to Standards as Having a Very Strong/Strong Impact on Improving Academic Achievement (by grade taught)
Elementary School High SchoolMiddle School
Q. How much of an impact do you believe the following efforts would have on improving student academic achievement?
Clearer academic standards for students
Tougher academic standards for students
Fewer academic standards for students
The establishment of standards commonacross all states
76% 73%68% 66%
59%
46%39%
49%57%
37% 34%28%
In conversations, high school teachers are keenly aware of the burden of preparing
students for postsecondary education. Some think that having students exposed to
tougher standards throughout elementary and secondary school would result in students
being better prepared for the next level of their education.
“I’m not really sureabout common standards...I think it’s important for communities to decide for themselves whattheir kids learn.”
— MIDDLE SCHOOL TEACHER
“You have to haveflexibility so thatwhen a teachablemoment comesup, you don’t feelguilty about takingthe time. I feltguilty every timeI talked aboutthe presidentialelection becausemy students werenot being testedon it. It’s not inthe curriculum.”
— MIDDLE SCHOOL TEACHER

20 | THE SOLUTIONS
“My first eightyears of teaching,there were nostate standards.Standards havegiven me a lot ofdirection, but to behonest, it was morefun to teach without standards.”
— MIDDLE SCHOOL TEACHER
Teachers’ Views on Their Own State Standards Vary
The number of and clarity of current state standards is problematic for many teachers.
Fifty percent say their states have too many standards and 54% say their state’s
standards are not clear enough. While both of these measures are consistent across
grades taught, they are not consistent across states, particularly with regard to the
number of state standards.
This disparity might help to explain the broad desire of teachers nationwide for common
standards that might mitigate the vast inter-state differences in clarity, number and rigor
of state standards.
Teachers’ Views on Own State’s Standards
Think their state has too many standardsAgree with statement: “My state’s standards are not clear enough.”
Think their state’s standards are too low
HIGH END
CA
HI
IN
KY
MI
OH
Average: 63%
HI
KY
ME
MT
NM
Average: 67%
AK
AZ
ID
NV
TN
Average: 25%
LOW END
AL
IA
MS
MT
ND
UT
Average: 31%
CA
KS
MD
VA
VT
Average: 44%
AR MI
CA MN
DE MO
HI RI
IN SC
Average: 7%
Q. Do you think your state has too many standards, the right amount of standards or too few standards?
Q. How much do you agree or disagree with the following statement: “My state’s standards are not clear enough”?
Q. Do you think your state’s standards are too high, about right or too low?
NOTE: The states with the five highest and five lowest numbers are shown in alphabetical order. In some cases, there are more than five states listed because responses from several states were tied.

21 | PRIMARY SOURCES
“There are so many statestandards thatyou can’t possibly get students to mastery in any topic because you are so rushed to get to all the standards. We are trying to dabble in everything instead of concentrating.”
— ELEMENTARYSCHOOL TEACHER
Each state has a different “starting place” when it comes to the type, volume and clarity
of the standards they already have. When considering teachers’ views on standard
reforms at the state level, teachers across states differ on the degree to which they
believe different kinds of reforms would improve student academic achievement.7
Teachers’ Views on Changes to Standards as Having a Very Strong/Strong Impact on Improving Academic Achievement (by state)
Clearer academic standardsCommon standards across all states
Tougher academic standards Fewer academic standards
HIGH END
FL
GA
KY
MS
NM
WY
Average: 82%
FL
GA
KY
MS
SC
Average: 73%
KY
MD
MS
NE
WV
Average: 55%
CA
GA
HI
KY
SC
WV
Average: 44%
LOW END
AK
CA
IN
ND
PA
SD
VA
VT
Average: 67%
IA
ME
MT
NE
VT
WI
Average: 47%
CA
HI
IN
OH
VT
WA
Average: 37%
IA
ID
IL
ME
MT
OK
RI
Average: 27%
Q. How much of an impact do you believe the following efforts would have on improving student academic achievement?
NOTE: The states with the five highest and five lowest numbers are shown in alphabetical order. In some cases, there are more than five states listed because responses from several states were tied.
7 Additional state-level views on standards can be found in Appendices C & D.

22 | THE SOLUTIONS
“Where are thestandards coming from? If we’re going to movetoward common standards then weneed people with real classroomexpertise to create them.”
— MIDDLE SCHOOL TEACHER
“Shrink the standards. It’sridiculous.”
— HIGH SCHOOL TEACHER
“We’re teachingstandards and we should be teachingstudents.”
— MIDDLE SCHOOL TEACHER
Proponents of “Clearer, Common, Higher Standards”S P O T L I G H T O N :
With standards so central to the conversation around education reform, it is critical
to include the teacher voice on this important issue. Since teachers’ top three most
supported efforts regarding standards include creating clearer, common and higher (or
tougher) standards, we examined the 27% of teachers who say that all three of these
categories would have a strong or very strong impact on improving student academic
achievement (“Proponents”). These teachers were compared to the 12% of teachers
who say all three would have “moderate” or “no impact at all” in improving student
achievement (“Non-proponents”).
Proponents and Non-proponents of clearer, common, higher standards generally do not
differ by the grades they teach or the level of their current students’ academic achievement.
Nor do they differ according to the length of time they have been teaching.
Proponents of clearer, common, higher standards differ from Non-proponents in several
key ways: they are more likely to embrace the use of technology in the classroom and
they are far more likely to use student performance data in a variety of ways to improve
student instruction.
Specifically:
• Proponents of clearer, common and higher standards are more likely than
are Non-proponents to state that up-to-date information-based technology
that is well integrated into the classroom has a strong/very strong impact on
improving student academic achievement (90% vs. 55%).
• Proponents of clearer, common and higher standards are more likely than
are Non-proponents to use student performance data very often to adjust
their teaching.

23 | PRIMARY SOURCES
“Every other developed nation has an idea of what their students should look like— good or bad, at least they have a vision. We don’t have a vision for students; we want them to be better, but we don’t know what ‘better’ is.”
— HIGH SCHOOL TEACHER
“Make standards few, but make them really rigorous.”
— HIGH SCHOOL TEACHER
Teachers Who Use Student Performance Data for Various Instructional Purposes Very Often (by support for clearer, higher and common standards)
Non-proponentsProponents
Q. How often do you use student performance data for each of the following instructional purposes? Base: Online sample
Alter your lesson plans
Discuss a student’s performance with the student and/or the student's parents
Discuss a student’s performance with other teachers in your school
Assess students’ progress compared to their prior-year academic performance
Compare students’ performance to that of other students in your school or district
57%
68%56%
69%
35%
48%
20%
36%
18%
32%
Proponents also have different opinions on their own state’s standards and are more
likely than Non-proponents to think that statewide testing is of great importance in
measuring student achievement.
Specifically:
• Proponents are more likely to say their own state’s standards are too low
(19% vs. 7%), and that their state’s standards are not clear enough (54% vs.
48%). Interestingly, they are less likely to say that their state has too many
standards (43% vs. 55%).
• Proponents see statewide testing as more relevant in measuring student
achievement than do Non-proponents. Even among Proponents, however,
only 39% (vs. 15% of Non-proponents) say that state-required tests
are absolutely essential/very important in measuring student
academic achievement.


25 | PRIMARY SOURCES
“District-required tests help. Theymake teachers accountable.”
— MIDDLE SCHOOLTEACHER
“I like benchmark testing at the beginning, middle and end of the year. The results aresomething concrete to show parents.”
— ELEMENTARYSCHOOL TEACHER
SOLUTION 2: Use Multiple Measures to Evaluate Student Performance While teachers value the role standards play in improving academic achievement, they are very clear that standardized tests should not be the sole measure of student achievement. Rather, they say assessment should be driven by classroom experiences including formative, ongoing assessments during class, performance on class assignments and class participation. Having clear measures of student achievement is critical to teachers; they rely on student performance data to innovate and differentiate instruction in a variety of ways.
Teachers Say that Ongoing Assessment Is the Most Important Measure of
Student Achievement
Teachers indicate that formative, ongoing assessments during class, along with class
participation and performance on class assignments, are the most important measures
of student achievement. Assessments that are scored and discussed by teams of
teachers are seen as being less important — but are still viewed as far more important
than state- or district-required tests.
Teachers’ Views on Importance of Student Performance Measures
Very important Absolutely essential Not at all important Do not use this
Somewhat Important
100(%) 0 20 40 60 80
Formative, ongoing assessmentduring class
Class participation
Performance on class assignments
Assessments scored and discussedby teams of teachers
District-required tests
Data from software programs
State-required standardized tests
Tests from basal textbooks
Q. In your opinion, how important is each of the following in measuring students’ academic achievement?
54
47
37
27
6
6
6
3
38
42
51
42
25
23
21
20
8
11
11
24 2 5
53
10 10
54
52 12 12
16 3
51
11 5
As is the case with
common standards across
states, elementary school
teachers are most likely to
see common assessments
as contributing to student
achievement: 58%
of elementary teachers
say having common
assessments across states
would make a strong or very
strong impact in improving
academic achievement vs.
50% of middle school
and only 38% of high
school teachers.
26 | THE SOLUTIONS
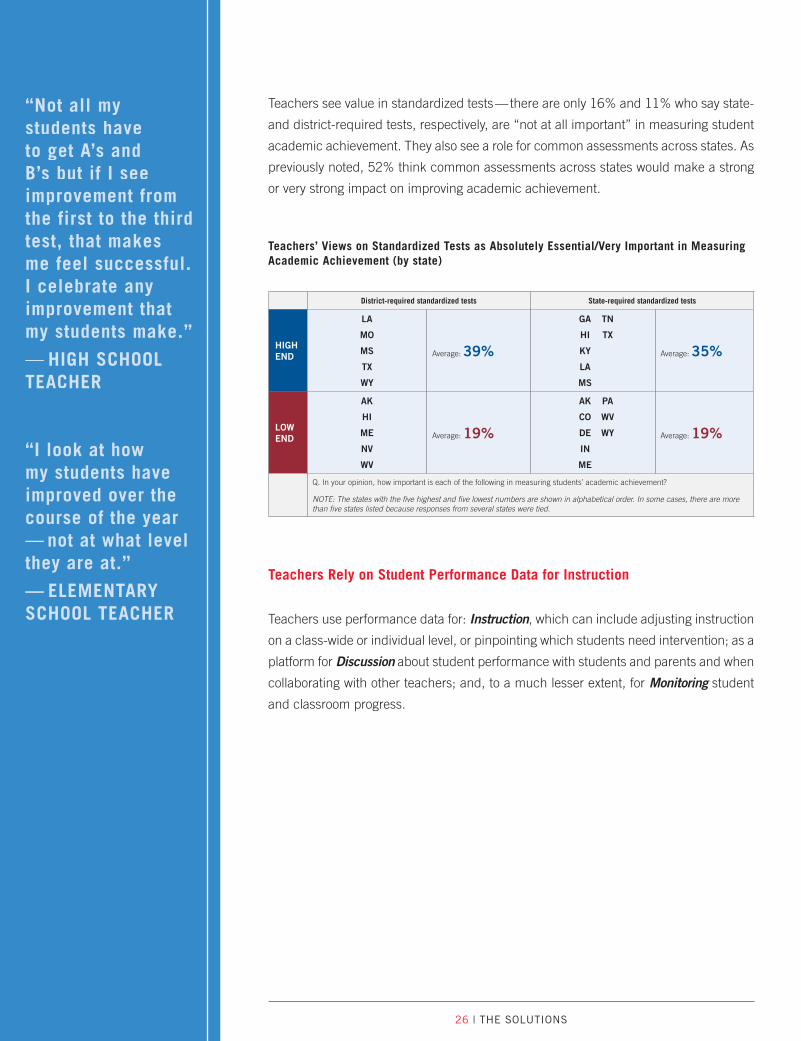
Teachers see value in standardized tests — there are only 16% and 11% who say state-
and district-required tests, respectively, are “not at all important” in measuring student
academic achievement. They also see a role for common assessments across states. As
previously noted, 52% think common assessments across states would make a strong
or very strong impact on improving academic achievement.
Teachers’ Views on Standardized Tests as Absolutely Essential/Very Important in Measuring Academic Achievement (by state)
District-required standardized tests State-required standardized tests
HIGH END
LA
MO
MS
TX
WY
Average: 39%
GA TN
HI TX
KY
LA
MS
Average: 35%
LOW END
AK
HI
ME
NV
WV
Average: 19%
AK PA
CO WV
DE WY
IN
ME
Average: 19%
Q. In your opinion, how important is each of the following in measuring students’ academic achievement?
NOTE: The states with the five highest and five lowest numbers are shown in alphabetical order. In some cases, there are more than five states listed because responses from several states were tied.
Teachers Rely on Student Performance Data for Instruction
Teachers use performance data for: Instruction, which can include adjusting instruction
on a class-wide or individual level, or pinpointing which students need intervention; as a
platform for Discussion about student performance with students and parents and when
collaborating with other teachers; and, to a much lesser extent, for Monitoring student
and classroom progress.
“Not all mystudents have to get A’s andB’s but if I see improvement fromthe first to the third test, that makesme feel successful. I celebrate any improvement that my students make.”
— HIGH SCHOOLTEACHER
“I look at howmy students have improved over thecourse of the year— not at what levelthey are at.”
— ELEMENTARY SCHOOL TEACHER

27 | PRIMARY SOURCES
“If you can barely convincea teacher that a test is valuable, it’s hopeless trying to convincea 16-year-old.”
— HIGH SCHOOL TEACHER
“If you don’t discuss students’ performance with them, they don’t take ownership and they don’t care. If you don’t tellstudents how they’re doing, how do they improve?”
— MIDDLE SCHOOL TEACHER
Teachers’ Frequency of Use of Student Performance Data
SometimesVery Often NeverRarely
100(%) 0 20 40 60 80
Identify students who needintervention or supplemental services
Instruction
Discussion
Monitoring
Differentiate instruction
Alter your lesson plans
Discuss a student’s performance withstudent and/or the student’s parents
Monitor your classroom’s progress inhelping your school meet AYP targets
Discuss a student’s performancewith other teachers in your school
Assess students’ progress compared totheir prior-year academic performance
Compare students’ performance to that ofother students in your school or district
Q. How often do you use student performance data for each of the following instructional purposes? Base: Online sample
75
71
64
64
49
44
29
25
22
26
33
33
34
46
45
48
3
2
2
3
11
1
19
20 6
6
9
5
Overall, elementary and middle school teachers use student performance data to a much
greater degree than do high school teachers. Still, over half of high school teachers use
performance data to alter lesson plans, differentiate instruction and discuss student
performance with students and/or their parents.
Teachers Who Use Student Performance Data Very Often (by grade taught)
Elementary School High SchoolMiddle School
Q. How often do you use student performance data for each of the following instructional purposes? Select items shown. Base: Online sample
Differentiate instruction
Alter lesson plans Assess students’ progress compared to their prior-year academic performance
Discuss a student’s performance with the student and/or the student's parents
80%
66%
54%
70%61%
54%
68% 64%56%
32% 30%
19%

28 | THE SOLUTIONS
Teachers in Low-Income Schools Are More Likely to Use Student Performance
Data for Select Purposes
Teachers in low-income schools are more likely than their counterparts in high-income
schools to use student performance data to monitor their classroom’s progress in
helping their school meet their Adequate Yearly Progress (AYP) targets8 and to assess a
student’s progress compared to the student’s prior-year academic performance.
Teachers Who Use Student Performance Data for Various Instructional Purposes Very Often (by school’s median household income)
$70,000+<$40,000
Monitor your classroom’s progress in helping your school meet AYP targets
Assess students’ progress compared to their prior-year academic performance
Q. How often do you use student performance data for each of the following instructional purposes? Select items shown. Base: Online sample
41%
56%
33%26%
“In my opinion, the one change that would most improve student achievement inAmerican schools would be to use student data driveninstruction to meet the needs of the student so that no child is leftbehind.”
— MIDDLE SCHOOL TEACHER
8 Adequate Yearly Progress is the annual improvement each school must achieve under No Child Left Behind to bring all students in schools to states’ proficient or advanced levels of achievement.

29 | PRIMARY SOURCES
Heavy Users of Student Performance DataS P O T L I G H T O N :
In the past decade, data-driven instruction has become a critical component to the
school-reform debate at both the national and local levels. Teachers have always relied
on student performance data for a wide range of instructional purposes, but given the
increase in good, reliable educational data in recent years, we considered those teachers
who are the heaviest users of student performance data.
To do this, we constructed a score to reflect the degree to which teachers use performance
data across the eight activities asked about in this study. Those that scored in the top
quartile (24%) are considered “heavy users.” The remaining 76% of teachers were split
into “moderate” (38%) and “light” (38%) user groups. In this analysis, we compare
Heavy Users to Light Users.
Heavy Users of performance data are more likely than are Light Users to be elementary
school teachers (73% vs. 45%) and they are more likely to teach in lower-income
schools (28% vs. 23%). At the high school level, they are more likely to teach English
Language Arts/Reading (34% of High Users vs. only 18% of Light Users). They are also
more likely to have English Language Learners in their class (70% vs. 61%). There is no
difference in years of teaching experience between these two groups.
While it should absolutely be expected that teachers in the Heavy Users of student
performance data group use student data more frequently and for more purposes than
do Light Users, the magnitude of these differences is dramatic.
“Benchmark tests are meant to inform your instruction so that you know where the child is and you know where to bring them next. The tests are not meant as punishment.”
— ELEMENTARY SCHOOL TEACHER
“It’s another full-time job to create, gather, analyze and input data, and then discuss it with colleagues, kids and parents. Testing has taken so much time that I’m no longer instructing.”
— MIDDLE SCHOOL TEACHER

30 | THE SOLUTIONS
Teachers Who Use Student Performance Data for Various Instructional Purposes Very Often (by frequency of use)
Light Users of Student Performance DataHeavy Users of Student Performance Data
100(%) 0 20 40 60 80
Identify students who need intervention or supplemental services
Differentiate instruction
Alter lesson plans
Discuss a student’s performance withthe student and/or the student's parents
Monitor your classroom’s progressin helping your school meet AYP targets
Discuss a student’s performance withother teachers in their school
Assess students’ progress compared totheir prior-year academic performance
Compare students’ performance to that of other students in their school or district
Q. How often do you use student performance data for each of the following instructional purposes? Base: Online sample
9946
9645
9140
93
9016
8218
727
656
37
Finally, Heavy Users of student performance data are more likely than are Light Users to
feel that all types of student performance measurements are very important or absolutely
essential in measuring academic achievement. The most dramatic differences between
Heavy and Light Users are seen in teachers’ views on the importance of district and
state standardized tests in measuring academic achievement. Note, however, that
even among Heavy and Light Users of student performance data, only 48% and 41%,
respectively, believe these are absolutely essential or very important in measuring
academic achievement.
“Nobody wants one test to be the stamp on a child for the whole next year. But that’s the reality.”
— ELEMENTARY SCHOOL TEACHER
“There’s a big pushto differentiate instruction, butthe tests don’t differentiate. If we’re being asked to present ourinformation in a different way, then the state’s going to have to presentits tests in a different way.”
— MIDDLE SCHOOL TEACHER

31 | PRIMARY SOURCES
Teachers’ Views on Measures of Student Academic Achievement as Absolutely Essential/Very Important (by frequency of use of student performance data)
Light Users of Student Performance DataHeavy Users of Student Performance Data
100(%) 0 20 40 60 80
Formative, ongoing assessmentduring class
Class participation
Performance on classassignments
Assessments scored/discussedby teams of teachers
District-required tests
Data from software programs
State-requiredstandardized tests
Tests from basal textbooks
Q. In your opinion, how important is each of the following in measuring students’ academic achievement?
9690
9487
9489
84
4823
4622
4122
3123
56
“Technology saves teachers time on gathering data. If I have to go through 27 sets of math tests, that’s a waste of my teaching time. If there is technology that can do that for me, then I can use that time todevelop lessons and improve instruction.”
— MIDDLE SCHOOL TEACHER


33 | PRIMARY SOURCES
SOLUTION 3: Innovate to Reach Today’s StudentsNearly all teachers say learning experiences that provide students with the skills they need for today’s world are absolutely essential or very important in impacting student achievement. Providing innovative experiences that develop and sharpen relevant skills and careers can only be accomplished through instruction that is engaging and has real-world relevance—both in actuality and in students’ point of view. Differentiation plays a key role in this, as does the use of technology and non-textbook classroom materials.
Innovation in the Classroom Helps Teachers Meet a Wide Range of Student
Interests and Achievement Levels
Teachers know that if students are unable to see the “real world” importance in a
lesson, the instruction falls flat. Fully 94% of teachers across all grade levels say learning
experiences that provide students with 21st Century skills are absolutely essential (54%)
or very important (40%) in impacting achievement.
In conversation, teachers identify two key ways of providing these kinds of relevant
experiences: 1) differentiate assignments to, in effect, meet students “where they are”
in terms of both personal interest and individual ability; and 2) use technology and
other materials to keep students engaged while teaching them the material they need
to learn in order to advance academically. These ideas were clearly reinforced by the
survey findings.
“In this day and age if you’re not tech-savvy, you can’t compete in theglobal marketplace at all.”
— HIGH SCHOOL TEACHER
“We needa motivatingcurriculum thatenhances a student’spreparednessfor life.”
— MIDDLE SCHOOLTEACHER

34 | THE SOLUTIONS
Teachers Say Differentiation Supports Engagement and Academic Achievement
Nearly all (95%) teachers think that using differentiated assignments engages their
students in learning (56% strongly agree with this statement) and 90% say teaching
resources to help differentiate instruction are absolutely essential (53%) or very
important (37%) in impacting achievement. These data vary fairly significantly by grade
taught, which may be due to the fact that teachers in upper grades do not have as great
a need to differentiate for individual students since many high schools level their classes
by student academic achievement to some degree.
Q. Please indicate whether you agree or disagree with the following statement: “Differentiated assignments engage my students in learning.”
NOTE: Percentage saying “Disagree strongly” is not shown since the data is 2% or less across all subgroups.
Q. Please tell us how important each is in impacting a student's academic achievement (Teaching resources to help differentiate instruction).
Note: Percentage saying “not important at all” is not shown since the data is 1% or less across all subgroups.
Elementary school
Middleschool
Highschool
Agree somewhatAgree strongly
Disagree somewhat
Base: Online sample
Elementary school
Middleschool
Highschool
Very importantAbsolutely important
Somewhat important
Teachers’ Agreement on Whether
Differentiated Assignments Engage
Their Students in Learning
(by grade taught)
Teachers’ Views on Importance
of Having Resources to Help
Differentiate Instruction
(by grade taught)
34%2%
64%
42%5%
52%
50%8%
40%
33%5%
62%
40%10%
49%
45%
18%
35%
81% of teachers
say that up-to-date
information-based
technology that is well
integrated into the
classroom is absolutely
essential (38%) or
very important (43%)
in impacting student
achievement.
“We need materials that help differentiate instruction so all students can be taught at their individual levels of achievement.”
— ELEMENTARY SCHOOL TEACHER
“Recognize that kids areindividuals.”
— MIDDLE SCHOOL TEACHER
“We’re losing kidsbecause we don’t differentiate in high school.”
— HIGH SCHOOLTEACHER

35 | PRIMARY SOURCES
“My directive is to use the textbook every day and I refuse. A textbook is so easy: ‘Turn to page 57, answerthe questions at the end.’ Kids are bored, but they like it because it’s easy. It doesn’t matter if they understand the material, becausethe answer is right there.”
— HIGH SCHOOL TEACHER
Teachers Acknowledge the Limitations of Traditional Textbooks for
Today’s Students
In conversations with teachers, they consistently say that having technology in the
classroom is one of the keys to engaging today’s digital natives and preparing them
for success in the today’s global marketplace. When asked about the value of more
traditional resources, few teachers think that traditional textbooks can do the same, with
only 12% strongly agreeing that textbooks help students’ academic achievement and
only 6% saying they strongly agree that textbooks engage their students in learning.
Both digital and non-digital resources— like classroom magazines and books other
than textbooks — receive greater support from teachers. Both of these categories are
viewed as far more powerful modes of engagement and far more effective ways to help
academic achievement than are traditional textbooks.
Teachers’ Views on the Impact of Classroom Resources on Student Achievement and Engagement
(%) 0
20
40
60
80
100
Strongly agreeSomewhat agree
Engage my students in learning
Help my students’ academic achievement
Engage my students in learning
Help my students’ academic achievement
Engage my students in learning
Help my students’ academic achievement
Digital resources, like classroom technology and Web-based programs
Classroom magazines and books other than textbooks
Traditional textbooks
Q. Please indicate whether you agree or disagree with each of the following statements. Base: Online sample
38
57
49
44
48
43
53
3840
6
57
12
In conversations, teachers say that textbooks do not call on critical thinking and higher-
level reasoning, instead relying on rote memorization and fact recall. They describe
supplementing their textbooks with project-based instruction that requires additional
resources and encourages students to make judgments and show evidence of
their learning.

36 | THE SOLUTIONS
New Teachers Are More Likely to Say Technology Assists in Engagement and
Academic Achievement
New teachers9 have a greater affinity toward technology for both engagement and
academic support when compared to veteran teachers.10 Age is likely a factor (the average
age of new and veteran teachers is 32.2 and 54.1 years, respectively), since younger
teachers have grown up in the digital era and been educated with the aid of technology.
While the vast majority of all teachers recognize the important role digital resources play
in today’s classrooms — new teachers favor technology to a greater degree.
Specifically:
• New teachers are more likely than veteran teachers to strongly agree that
digital resources engage their students in learning and that digital resources
help their students’ academic achievement.
• New teachers are also more likely than veteran teachers to say that having
up-to-date information-based technology that is well integrated into the
classroom is “absolutely essential” in impacting students’ academic
achievement (44% vs. 35%).
Teachers’ Views on Digital Resources, Strongly Agree to Statements (by experience)
Veteran TeachersNew Teachers
Digital resources engage my students in learning
Digital resources help my students’ academic achievement
Q. Please indicate whether you agree or disagree with each of the following statements. Base: Online sample
45%
66%
34%
51%
“I work in an affluent districtand my science curriculum is from 1995.”
— HIGH SCHOOLTEACHER
“In my first year of teaching, I was using the same textbook I usedwhen I was in middle school.”
— MIDDLE SCHOOL TEACHER
“Everybody’stalking about technology, but by the time students graduate, thingswill look different. Students need to have the baseline skills of reading, writing, speaking, listening, understanding and communicating.”
— MIDDLE SCHOOL TEACHER
9 “New teachers” are defined as those with three or fewer years of experience.10 “Veteran teachers” are defined as those with more than 20 years of experience.

37 | PRIMARY SOURCES
“My students have access to unbelievabletechnology and they can create all kinds of great work, but the substance is not always there. How much are they really engaging with the ideas?”
— HIGH SCHOOL TEACHER
“I would never presume that technology would replace the knowledge that we bring to teaching. But man, it can be a real nice way to supplement it.”
— MIDDLE SCHOOL TEACHER
Teachers Who Strongly Favor Digital Resources for Engagement and Academic AchievementS P O T L I G H T O N :
Since the use of digital resources is an activity that has broad teacher appeal and
broad student application, Primary Sources considered the characteristics of those
teachers who say digital resources are important for both engagement and academic
achievement. This analysis includes the 42% of teachers who strongly agree that “Digital
resources engage my students in learning” and strongly agree that “Digital resources
help my students’ academic achievement” (Proponents) and compares that group to
the 41% who did not strongly agree to both of these statements (Non-proponents).11
Proponents are more likely to be new rather than veteran teachers (25% vs. 17%). They
also have a much stronger belief that students must be given opportunities to acquire
21st Century skills in the classroom (68% vs. 38%).
These teachers are not single-mindedly focused on technology, however. Instead, they
seem to view technology as a key part of a well-rounded system of supports from all
areas of the school.
Teachers’ Views on the Impact of Educational Resources as Absolutely Essential in Impacting Student Academic Achievement (by level of support for digital resources)
Non-proponentsProponents
Learning experiences that provide students with 21st Century skills
Teaching resources to help differentiate instruction
Academic supports that supplement classroom instruction
Up-to-date information-based technology that is well integrated into the classroom
In-school behavioral supports such as guidance counselors and social workers
Q. Please tell us how important each is in impacting a student’s academic achievement.
38%
68%
42%
67%
38%
59%
19%
59%
37%
56%
11 Seventeen percent of teachers strongly agreed to one statement but not the other—this group was not considered in this analysis.
Teachers who strongly
favor digital resources
for engagement and
achievement are less likely
to be high school teachers
than are those teachers
who do not strongly
favor those resources
(22% are high school
teachers vs. 30% in the
comparison group).


39 | PRIMARY SOURCES
SOLUTION 4: Accurately Measure Teacher Performance and Provide Non-Monetary Rewards In conversations with teachers, it is clear that the most satisfying part of their work is their time with students. As in any industry, overall job satisfaction is the result of multiple factors, and supportive leadership is the standout, top-ranked item contributing to teacher retention. Teachers say higher salaries, while important, are not as critical in retaining effective teachers as other, non-monetary rewards. Teachers say that the most accurate measures of their own performance are student engagement and student growth over the academic year.
Non-Monetary Rewards Top the List of Ways to Retain Effective Teachers
When asked about the things that are most important in retaining good teachers,
supportive leadership, time for collaboration and a high-quality curriculum top the list,
with supportive leadership by far the most important factor in teacher retention. Higher
salaries fall squarely in the middle — important, but less so than non-monetary factors.
Pay tied to teachers’ performance12 — which will be discussed in greater detail within this
section — is the lowest-ranked item, with 36% of teachers saying it is not at all important
and 25% saying it is absolutely essential or very important in retaining good teachers.
Teachers’ Views on Factors Impacting Teacher Retention
Very important Absolutely essential Not at all importantSomewhat important
100(%) 0 20 40 60 80
Supportive leadership
Time for teachers to collaborate
Access to high-quality curriculumand teaching resources
Higher salaries
Professional development that isrelevant to personal and school goals
Clean and safe building conditions
Collegial work environment
Opportunities for alternate careers inthe classroom, like mentor teaching
Pay tied to teachers’ performance
Q. How important do you think each of these items is in retaining good teachers?
68
54
49
45
45
45
42
18
8
28
35
41
36
40
43
44
35
17
3
10 1
10
17
14
12
1
40
38 36
7
13
1
1
12 While the survey used the phrase “pay tied to teacher performance,” in conversations, teachers do not distinguish between “merit pay,” “performance pay” and “pay for performance.”
“Keep teaching your teachers.”
— ELEMENTARYSCHOOL TEACHER
“Teaching can be isolating becausewe’re with children all day — we allneed to work with adults from time to time.”
— MIDDLE SCHOOL TEACHER
“Great teachers are leaving education and taking all their expertise with them. We need a better environment for collaboration to share what works and what doesn’t.”
— ELEMENTARYSCHOOL TEACHER
40 | THE SOLUTIONS
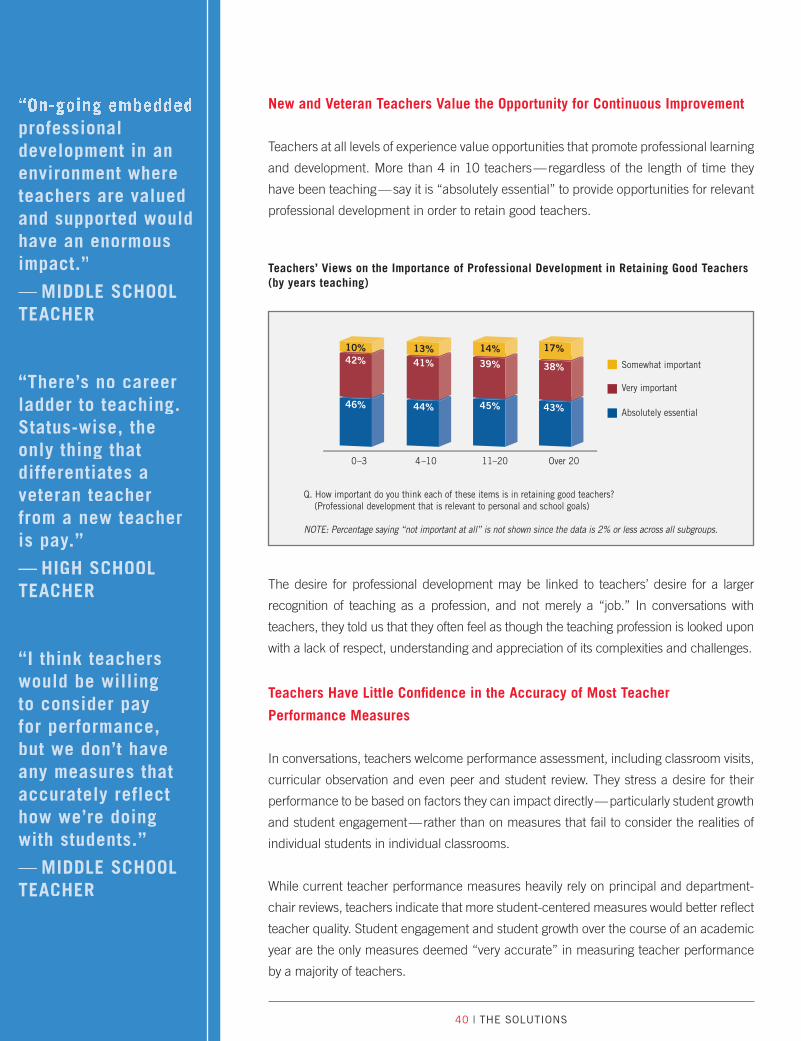
New and Veteran Teachers Value the Opportunity for Continuous Improvement
Teachers at all levels of experience value opportunities that promote professional learning
and development. More than 4 in 10 teachers — regardless of the length of time they
have been teaching — say it is “absolutely essential” to provide opportunities for relevant
professional development in order to retain good teachers.
Teachers’ Views on the Importance of Professional Development in Retaining Good Teachers (by years teaching)
Somewhat important
Very important
Absolutely essential
0–3 4–10 11–20 Over 20
Q. How important do you think each of these items is in retaining good teachers? (Professional development that is relevant to personal and school goals) NOTE: Percentage saying “not important at all” is not shown since the data is 2% or less across all subgroups.
42%10%
46%
41%
13%
44%
39%
14%
45%
38%
17%
43%
The desire for professional development may be linked to teachers’ desire for a larger
recognition of teaching as a profession, and not merely a “job.” In conversations with
teachers, they told us that they often feel as though the teaching profession is looked upon
with a lack of respect, understanding and appreciation of its complexities and challenges.
Teachers Have Little Confidence in the Accuracy of Most Teacher
Performance Measures
In conversations, teachers welcome performance assessment, including classroom visits,
curricular observation and even peer and student review. They stress a desire for their
performance to be based on factors they can impact directly — particularly student growth
and student engagement — rather than on measures that fail to consider the realities of
individual students in individual classrooms.
While current teacher performance measures heavily rely on principal and department-
chair reviews, teachers indicate that more student-centered measures would better reflect
teacher quality. Student engagement and student growth over the course of an academic
year are the only measures deemed “very accurate” in measuring teacher performance
by a majority of teachers.
professional development in anenvironment whereteachers are valuedand supported wouldhave an enormous impact.”
— MIDDLE SCHOOL TEACHER
“There’s no career ladder to teaching. Status-wise, the only thing that differentiates a veteran teacher from a new teacher is pay.”
— HIGH SCHOOLTEACHER
“I think teachers would be willing to consider payfor performance, but we don’t have any measures that accurately reflecthow we’re doing with students.”
— MIDDLE SCHOOL TEACHER

41 | PRIMARY SOURCES
“Teachers shouldbe measured by the growth of their students. ‘Wherewas the child when he entered my classand what did I help him achieve?’ That’s how I should be judged.”
— ELEMENTARY SCHOOL TEACHER
“Teachers must be held accountable whether or not they are tenured.”
— HIGH SCHOOL TEACHER
“I love tenure. I love that security.”
— HIGH SCHOOL TEACHER
“I would be all forgetting rid of tenure because I know I’m a good teacher.”
— MIDDLE SCHOOL TEACHER
Teachers’ Views on the Degree of Accuracy of Measures of Teacher Performance
Somewhat AccurateVery Accurate Not at All Accurate
100(%) 0 20 40 60 80
Parent evaluation
Student grades onstandardized tests
Teacher tenure
Student evaluations
Department Chair or Team Leaderobservation and review
Principal observation and review
Teacher exercising a leadershiprole among peers
Self-evaluation
Teacher/peer observationand review
Student growth over the courseof an academic year
Student engagementProportion who say“Very accurate”:
Over half
Between 1 in 3and 1 in 5
Less than 1 in 5
Q. How accurate do you think each of the following measures of teacher performance can be?
7 62 30
7 66 27
10 47 42
18 66 16
20 67 11
22 70 8
28 60 12
31 63 6
32 61 6
55 42 2
60 38 2
Teachers at All Levels Are Skeptical of Tenure as a Measure of
Teacher Performance
Only 10% of teachers say that teacher tenure is a “very accurate” measure of teacher
performance, with 47% saying it is “somewhat accurate” and 42% saying that it is
“not at all accurate.” Veteran teachers are more likely than new teachers to say that
tenure is at least somewhat accurate. These results do not indicate teacher opposition
to the tenure system, but rather skepticism that tenure is an accurate measure of
teacher performance.
Teachers’ Views on Degree of Accuracy of Tenure as a Measure of Teacher Performance (by years teaching)
0 – 3 4 –10 11 –20 Over 20 years
Very/somewhat accurate (NET) 55% 54% 57% 63%
Very accurate 9% 9% 10% 13%
Somewhat accurate 46% 45% 47% 50%
Not at all accurate 45% 46% 42% 36%

42 | THE SOLUTIONS
Teachers’ Views on Monetary Compensation Vary
As noted in the chart on page 39 of this report, teachers are about three times as
likely to say that higher salaries are absolutely essential or very important in retaining
good teachers as they are to say the same of pay tied to performance (82% vs. 26%,
respectively). Given teachers’ lack of confidence in most performance measurements,
this is not surprising.
While teachers’ support of higher salaries does not vary significantly across the key
dimensions of grade level taught, years of teaching experience or school median
household income, views on pay for performance do vary across some subgroups,
including years of teaching experience and, to a lesser extent, school income.
Teachers’ Views on Pay Tied to Performance as Absolutely Essential/Very Important in Retaining Good Teachers
<$40K $40K–$49.9K
$50K–$69.9K
$70K+ 0–3years
4–10years
11–20years
Over 20years
(by years teaching) (by school’s median household income)
29%24% 24% 24%
35%
29%
22% 20%
Q. How important do you think each of these items is in retaining good teachers? (Pay tied to teachers’ performance)
Note that veteran teachers are the least likely to think that pay tied to performance is
either very important or absolutely essential in retaining good teachers. In conversations,
teachers express concern that merit-based pay systems might discourage collaborative
work, which they say positively impacts student achievement. Additionally, with
collaboration being such an important factor in teachers’ job satisfaction, skepticism of
pay for performance is understandable.
In Primary Sources, teachers also shared their views on the impact that monetary
rewards for teacher performance would have on improving student achievement. In
short, about as many teachers say this would make a very strong/strong impact (28%)
on improving student achievement as do those who say this would make no impact at
all (30%).
Teachers in charter
schools are more likely
than other teachers
to say that pay tied to
teacher performance is
absolutely essential/very
important in retaining
good teachers (36%
vs. 25%) and more
likely to say monetary
rewards for teacher
performance would make
a very strong/strong
impact on improving
academic achievement
(36% vs. 28%).
“You’re getting paid for test scores. What if you got a kid to talk who hasn’t talked for a year? Shouldn’t that get you merit pay?”
— MIDDLE SCHOOL TEACHER

43 | PRIMARY SOURCES
“Pay forperformancedemonstratesrespect for theteacher.”
— MIDDLE SCHOOLTEACHER
“Pay tied to teacherperformance doesnot work. It breedscompetitiveness,jealousy, andnegativity inteachers.”
— MIDDLE SCHOOLTEACHER
Teachers’ Views on the Impact that Monetary Rewards for Teacher Performance Would Have on Improving Academic Achievement
A strong impact
A moderate impact
No impact at all
A very strong impact
Q. How much of an impact do you believe the following efforts would have on improving student academic achievement? (Monetary rewards for teachers for their performance)
18%
41%
10%
30%
The impact that monetary rewards would have on improving student academic
achievement also varies by years teaching and by income. New teachers are more
likely than are veteran teachers to say this would make a very strong/strong impact on
improving academic achievement, which could be a result of veteran teachers’ salaries
being higher than those of their younger counterparts. To a lesser degree, teachers
in schools with lower household incomes say monetary rewards would have a greater
impact on academic achievement than do other teachers.
Teachers’ Views on Monetary Rewards for Teacher Performance as Having a Very Strong/Strong Impact on Improving Academic Achievement
<$40K $40K–$49.9K
$50K–$69.9K
$70K+ 0–3years
4–10years
11–20years
Over 20years
(by years teaching) (by school’s median household income)
32%27% 27% 26%
36%31%
24% 23%
Q. How much of an impact do you believe the following efforts would have on improving student academic achievement? (Monetary rewards for teachers for their performance)
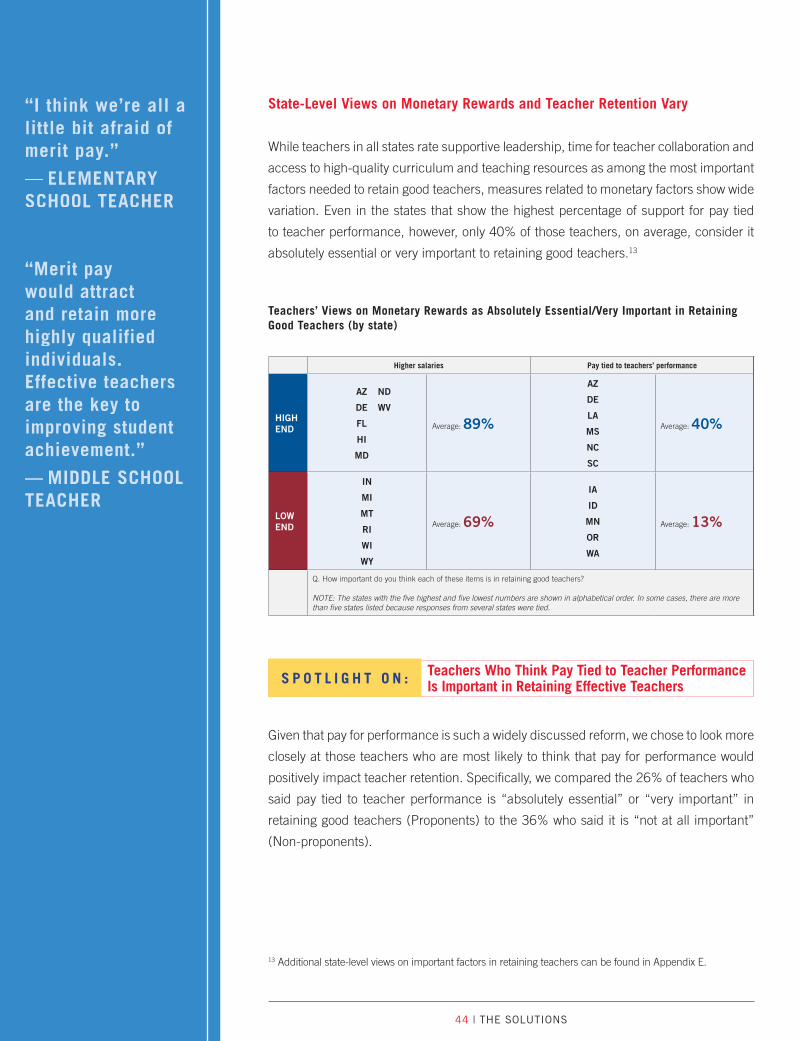
44 | THE SOLUTIONS
“I think we’re all a little bit afraid of merit pay.”
— ELEMENTARYSCHOOL TEACHER
“Merit pay would attract and retain more highly qualifiedindividuals.Effective teachersare the key to improving student achievement.”
— MIDDLE SCHOOL TEACHER
State-Level Views on Monetary Rewards and Teacher Retention Vary
While teachers in all states rate supportive leadership, time for teacher collaboration and
access to high-quality curriculum and teaching resources as among the most important
factors needed to retain good teachers, measures related to monetary factors show wide
variation. Even in the states that show the highest percentage of support for pay tied
to teacher performance, however, only 40% of those teachers, on average, consider it
absolutely essential or very important to retaining good teachers.13
Teachers’ Views on Monetary Rewards as Absolutely Essential/Very Important in Retaining Good Teachers (by state)
Higher salaries Pay tied to teachers’ performance
HIGH END
AZ ND
DE WV
FL
HI
MD
Average: 89%
AZ
DE
LA
MS
NC
SC
Average: 40%
LOW END
IN
MI
MT
RI
WI
WY
Average: 69%
IA
ID
MN
OR
WA
Average: 13%
Q. How important do you think each of these items is in retaining good teachers?
NOTE: The states with the five highest and five lowest numbers are shown in alphabetical order. In some cases, there are more than five states listed because responses from several states were tied.
Teachers Who Think Pay Tied to Teacher Performance Is Important in Retaining Effective TeachersS P O T L I G H T O N :
Given that pay for performance is such a widely discussed reform, we chose to look more
closely at those teachers who are most likely to think that pay for performance would
positively impact teacher retention. Specifically, we compared the 26% of teachers who
said pay tied to teacher performance is “absolutely essential” or “very important” in
retaining good teachers (Proponents) to the 36% who said it is “not at all important”
(Non-proponents).
13 Additional state-level views on important factors in retaining teachers can be found in Appendix E.

45 | PRIMARY SOURCES
“Paying teachers for performance seems undoable. The one thing that alwaysmakes an impact on education within a school is a spiritof collaboration —not competition —between teachers.”
— MIDDLE SCHOOL TEACHER
When compared to Non-proponents of pay for performance, Proponents are:
• More likely to be new teachers with 0 –3 years of experience (22% vs. 12%)
• More likely to teach in communities with median household incomes
under $40,000 (28% vs. 23%)
Aside from these differences, Proponents and Non-proponents of pay for performance
essentially value the same kinds of non-monetary rewards to ensure teacher retention
and they say the same kinds of measurements are most accurate in measuring
teacher performance. In terms of the latter, student engagement and growth over the
course of the academic year are thought to be the most accurate measures of teacher
performance among both groups. And while Proponents are significantly more likely
than Non-proponents to say that student grades on standardized tests are accurate
ways of measuring teacher performance, only 13% (vs. 4% of Non-proponents) believe
these are very accurate measures of teacher performance.
Proponents are, not surprisingly, more likely to support other salary-related incentives.
Teachers’ Views on Salaries and Monetary Rewards (by support for pay tied to performance)
Non-proponents of pay tied to performance
Proponents of pay tied to performance
Think higher salaries are absolutely essential/very important in retaining good teachers
Think monetary rewards for teachers would have a very strong/strong impact on improving student achievement
Q. How important do you think each of these items is in retaining good teachers?Q. How much of an impact do you believe the following efforts would have on improving student academic achievement?
75%
94%
7%
64%

47 | PRIMARY SOURCES
SOLUTION 5: Bridge School and Home to Raise Student AchievementTeachers are keenly aware of the variety of factors, both in and out of school, impacting student achievement. From high-quality curriculum and instructional materials to a culture and community of support, teachers know what works to raise student achievement and build a sustainable culture of learning in America’s schools.
Teachers Recognize Multiple Contributors to Students’ Success
Nine in 10 teachers say that not all of their students could leave high school prepared
to succeed in college. When asked to choose the one out of five possible reasons why,
teachers across all grade levels are fairly evenly dispersed across three core components
needed for success, which include both in-school and out-of-school elements:
• Academic instruction — promoting critical thinking, problem solving, reading
and communication skills and coursework designed to prepare students
for college;
• A social support system — including family and friends — that values and
promotes learning; and
• Student motivation — a factor that teachers embrace as their responsibility
and attempt to address at all teaching levels.
Single Most Likely Reason Teachers Say Some Students in Their Classes Won’t Leave High School Prepared to Succeed in a 2- or 4-Year College
Lack of academic preparation*
Lack of student motivation
Lack of encouragement from family and friends
Q. Which one of the following do you believe is the most likely reason that some of the students in your classes won’t leave high school prepared to succeed in a 2- or 4-year college?
Base: Say less than 100% of students currently in teachers’ classes could leave high school prepared to succeed in a 2- or 4-year college.
*Includes three responses: Poor reading and communication skills (19%), lack of critical thinking/problem-solving skills (17%) and lack of participation in college preparatory coursework (2%).
27%38%
34%
“Motivation is the biggest thing—getting them to see the bigger picture and realizingit’s attainable.”
— MIDDLE SCHOOL TEACHER
“We should make time outside of the traditional school day for parents to be more able to come to school—especially the low-income families with parents who might be working three or four jobs. We should try to accommodate them so that they can see what’s going on.”
— ELEMENTARY SCHOOL TEACHER

48 | THE SOLUTIONS
Barriers to Success Shift Across Grade and Income Levels
Motivating students is seen as an even greater challenge among high school teachers,
who are twice as likely as their elementary school counterparts to list motivation as the
single most likely reason students will not leave high school prepared to succeed in
college (49% vs. 25%).
Single Most Likely Reason Teachers Say Some Students in Their Classes Won’t Leave High School Prepared to Succeed in a 2- or 4-Year College (by grade taught)
Lack of academic preparation*
Lack of student motivation
Lack of encouragement from family and friends
Elementary school Middle school High school
Q. Which one of the following do you believe is the most likely reason that some of the students in your classes won’t leave high school prepared to succeed in a 2- or 4-year college?
Base: Say less than 100% of students currently in teachers’ classes could leave high school prepared to succeed in a 2- or 4-year college.
*Includes three responses: Poor reading and communication skills (19%), lack of critical thinking/problem-solving skills (17%) and lack of participation in college preparatory coursework (2%).
25%
40%
34%
43%
35%
22%
49%
35%
15%
While all three factors remain relevant to students in disparate income brackets, teachers
in low-income schools are more likely than are those in high-income schools (31% vs.
19%) to say that lack of encouragement from friends and family is the most likely reason
some of their students will not leave high school prepared for college success.
“One of my pains as a teacher is when I know there are a few students who just don’t get it. I can’t bring thecurriculum level down too much, but I can see that they are lost. That’swhen, as teachers, we have to be creative.”
— HIGH SCHOOLTEACHER
“The school shouldbe a community center. The community needs to feel ownership of its school.Education cannotmove forward without thesupport of those stakeholders.”
— MIDDLE SCHOOL TEACHER

49 | PRIMARY SOURCES
Single Most Likely Reason Teachers Say Some Students in Their Classes Won’t Leave High School Prepared to Succeed in a 2- or 4-Year College (by school’s median household income)
Lack of academic preparation*
Lack of student motivation
Lack of encouragement from family and friends
Q. Which one of the following do you believe is the most likely reason that some of the students in your classes won’t leave high school prepared to succeed in a 2- or 4- year college?
Base: Say less than 100% of students currently in teachers’ classes could leave high school prepared to succeed in a 2- or 4-year college.
*Includes three responses: Poor reading and communication skills (19%), lack of critical thinking/problem solving skills (17%) and lack of participation in college preparatory coursework (2%).
<$40K $40K–$49.9K $50–$69.9K $70K+
30%
38%
31%
34%
35%
30%
36%
38%
25%
37%
43%
19%
Teachers Agree that a High-Quality Curriculum Is Essential to Student Success
Regardless of their views on the single most likely reason for their students’ lack of
preparedness, teachers are largely united in their views on the in-classroom resources
necessary to sustain academic success. Nearly 9 in 10 teachers agree that a high-
quality curriculum ensures academic success for their students (88%). Ninety-three
percent agree that digital resources like classroom technology and Web-based programs
help academic achievement, with a similar percentage (91%) agreeing that classroom
magazines and books other than textbooks do the same.
“Many of my students’ parentswork at jobs that require little skill beyond a high school diploma, and the studentsthink they can do a similar job and make a living. I’m afraid that’s not the case anymore —a high school diploma is not enough.”
— HIGH SCHOOL TEACHER
“I am a firm believer that students will absolutely rise to the academic level you set.”
— ELEMENTARY SCHOOL TEACHER

50 | THE SOLUTIONS
Academic Achievement Is Fostered by a Community of Committed Individuals
Academic resources are only one piece of the puzzle. Teachers know they set the stage
for student achievement: 82% of teachers say that “effective and engaged teachers”
are “absolutely essential” in impacting student achievement — no other measure
included in the study was rated higher. But they also know they can’t do it alone. Three
in 4 teachers say that family involvement and support is also absolutely essential in
impacting student academic achievement. Within the school setting, teachers need
effective and engaged leaders along with specialty services like guidance counselors
and social workers to help create and reinforce a culture of high expectations where
learning is valued.
Teachers’ Views on People Who Impact Student Academic Achievement, Total Agree to Statements
Very important Absolutely essential Somewhat important
100(%) 0 20 40 60 80
In-school behavioral supports such as guidance counselors and social workers
Effective and engaged principalsand building-level leaders
Family involvement and support
Effective and engaged teachers
Q. Please tell us how important each is in impacting a student’s academic achievement.
NOTE: Percentage saying “not important at all” is not shown since the data is 1% or less across all subgroups.
48 37 14
58 33 8
75 24 2
82 17 1
“Leaders needto be visible forstudents—not justwhen students get in trouble, but inthe classrooms sothe kids know that their education isimportant enough that those in chargewant to see what’sgoing on.”
— MIDDLE SCHOOLTEACHER
“We don’t have enough counselors,but we have a lot of struggling kids.”
— ELEMENTARYSCHOOL TEACHER

51 | PRIMARY SOURCES
Teachers Go Above and Beyond to Strengthen the School-to-Home Connection
Many teachers go out of their way to establish an out-of-school environment that nurtures
academic achievement. Specifically:
• Nearly half (47%) make themselves available to students outside of school
hours by giving students their phone numbers and/or personal email
addresses (remembering that some teachers are prohibited from sharing
personal information with students by their schools or districts).
• Seven in 10 teachers show their support for their students by attending
students’ after-school and weekend events.
• Forty-five percent of teachers are willing to have parent/teacher conferences
at their students’ homes to strengthen the school-to-home connection, and
the number increases to 51% for elementary school teachers.
Teachers’ Views on Connecting with Students and Parents During Out-of-School Time, Total Agree to Statements (by grade taught)
I attend my students’ after-school and weekend events.
My students have my phone number and personal email address so they can reach me if they need to.
I am willing to have parent/teacher conferences at my students’ homes.
Elementary School High SchoolMiddle School
Q. How much do you agree with each of the following statements? Base: Online sample
65%
75%80%
46% 43%
50% 51%
41%
34%
While teachers are committed to building the school-to-home connection across all
income levels, this is even more true of teachers in low-income communities. These
teachers are more likely than are their counterparts in high-income communities to
provide students with their personal phone number or email address (51% vs. 41%),
and to be willing to have parent/teacher conferences at their students’ homes (54%
vs. 35%).
“I want to give my students and their parents what theyneed to succeed, and if what theyneed is more access to me,then I’m going to provide that.”
— HIGH SCHOOL TEACHER
“At my school, students can beplaced in a higher-level class in two ways. They can opt-in and anyone who wants the challenge can take the class regardless of scores. The other way is to score high enough on the test. If they’ve opted to take theclass, I make it very hard for them to drop out.”
— HIGH SCHOOL TEACHER

52 | THE SOLUTIONS
Teachers’ Views on Connecting with Students and Parents During Out-of-School Time(by school’s median household income)
<$40K $50K–$69.9K$40K-$49.9K $70K+
I attend my students’ after-school and weekend events.
My students have my phone number and personal email address so they can reachme if they need to.
I am willing to have parent/teacher conferences at my students’ homes.
Q. How much do you agree with each of the following statements? Base: Online sample
70%71%
51%
71% 67%
45%48%
41% 42%
54%47%
35%
High Expectations Are Critical to Student SuccessWith all the factors impacting academic achievement, teachers are near universal in their
understanding of the impact high expectations can have on their students. Ninety-seven
percent of teachers say that setting high expectations for students is either “absolutely
essential” or “very important” in positively impacting student academic achievement.
This firm commitment to helping students reach their potential resonates throughout
conversations with teachers. Over and over we hear them talk about their confidence
in the potential of all of their students and their role as teachers in helping them find
success. “Students need people to believe in them, so they can believe in themselves,”
one teacher told us, “When kids have confidence, they excel.”
“Set the bar high, for heaven’s sake.”
— HIGH SCHOOLTEACHER
“In today’s worldit is absolutely necessary for students to achieve at the highest level their ability allows, and then go beyond.”
— MIDDLE SCHOOL TEACHER

53 | PRIMARY SOURCES
APPENDIX A:Selected Survey Results
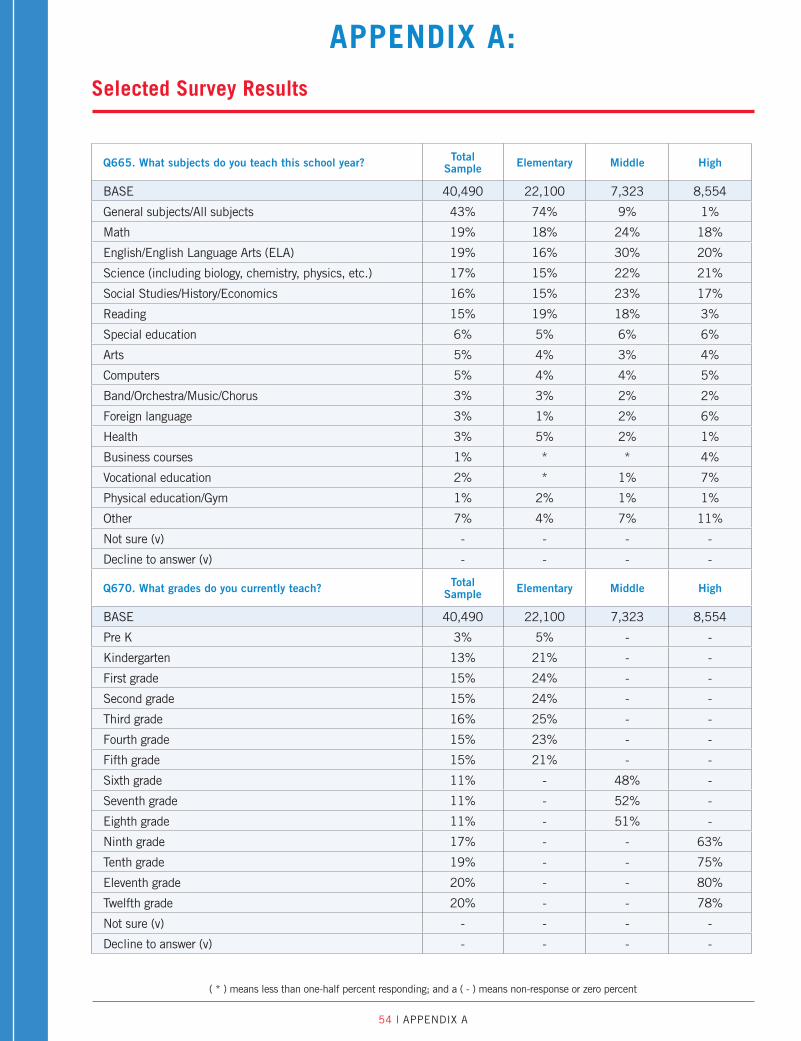
54 | APPENDIX A
APPENDIX A: Selected Survey Results
( * ) means less than one-half percent responding; and a ( - ) means non-response or zero percent
Q665. What subjects do you teach this school year? Total Sample Elementary Middle High
BASE 40,490 22,100 7,323 8,554
General subjects/All subjects 43% 74% 9% 1%
Math 19% 18% 24% 18%
English/English Language Arts (ELA) 19% 16% 30% 20%
Science (including biology, chemistry, physics, etc.) 17% 15% 22% 21%
Social Studies/History/Economics 16% 15% 23% 17%
Reading 15% 19% 18% 3%
Special education 6% 5% 6% 6%
Arts 5% 4% 3% 4%
Computers 5% 4% 4% 5%
Band/Orchestra/Music/Chorus 3% 3% 2% 2%
Foreign language 3% 1% 2% 6%
Health 3% 5% 2% 1%
Business courses 1% * * 4%
Vocational education 2% * 1% 7%
Physical education/Gym 1% 2% 1% 1%
Other 7% 4% 7% 11%
Not sure (v) - - - -
Decline to answer (v) - - - -
Q670. What grades do you currently teach? Total Sample Elementary Middle High
BASE 40,490 22,100 7,323 8,554
Pre K 3% 5% - -
Kindergarten 13% 21% - -
First grade 15% 24% - -
Second grade 15% 24% - -
Third grade 16% 25% - -
Fourth grade 15% 23% - -
Fifth grade 15% 21% - -
Sixth grade 11% - 48% -
Seventh grade 11% - 52% -
Eighth grade 11% - 51% -
Ninth grade 17% - - 63%
Tenth grade 19% - - 75%
Eleventh grade 20% - - 80%
Twelfth grade 20% - - 78%
Not sure (v) - - - -
Decline to answer (v) - - - -

55 | PRIMARY SOURCES
APPENDIX A: Selected Survey Results
( * ) means less than one-half percent responding; and a ( - ) means non-response or zero percent
Q675. Altogether, how many years have you worked as a teacher?
Total Sample Elementary Middle High
BASE 40,490 22,100 7,323 8,554
0 –1 year 5% 5% 5% 4%
2 – 3 years 12% 13% 11% 8%
4 –10 years 33% 32% 35% 33%
11–15 years 14% 13% 14% 15%
16 – 20 years 11% 10% 11% 11%
21+ years 26% 25% 24% 29%
Not sure (v) * * * *
Decline to answer (v) * * - *
MEAN 13.9 13.5 13.4 14.9
Q701. Below is a list of four possible goals of schools and teaching. Which one do you consider to be the most important goal of schools and teaching?
Total Sample Elementary Middle High
BASE 40,490 22,100 7,323 8,554
To graduate all students with a high school diploma 6% 6% 5% 5%
To prepare all students to be successful in a 2- or 4-year college
11% 11% 9% 15%
To prepare all students so they are ready for careers in the 21st Century
71% 72% 74% 69%
To provide all students with life skills such as managing a bank account, applying for a job and understanding a mortgage
11% 11% 11% 10%
Not sure (v) * * * 1%
Decline to answer (v) * * * *
Q710. Now of the other three possible goals, which one do you consider to be the next most important goal of schools and teaching?
(Base: online respondents)
Total Sample Elementary Middle High
BASE 25,452 14,239 4,648 5,092
To graduate all students with a high school diploma 20% 21% 20% 17%
To prepare all students to be successful in a 2- or 4-year college
27% 27% 26% 29%
To prepare all students so they are ready for careers in the 21st Century
17% 16% 16% 21%
To provide all students with life skills such as managing a bank account, applying for a job and understanding a mortgage
36% 36% 37% 34%

56 | APPENDIX A
APPENDIX A: Selected Survey Results
( * ) means less than one-half percent responding; and a ( - ) means non-response or zero percent
Q720. In your view, what percentage of the students currently in your classes could leave high school prepared to succeed in a 2- or 4-year college?
Total Sample Elementary Middle High
BASE 40,490 22,100 7,323 8,554
0% 1% 1% 1% 1%
1– 25% 8% 6% 10% 12%
26 – 50% 17% 14% 20% 21%
51–75% 26% 25% 31% 27%
76 –99% 37% 40% 34% 34%
100% 9% 12% 4% 5%
Not sure (v) 1% 2% 1% *
Decline to answer (v) * 1% * *
MEAN 69.5% 73.0% 66.0% 64.3%
Q730. Below is a list of five possible reasons that some students don’t leave high school prepared to succeed in a 2- or 4-year college. Which one do you believe is the most likely reason that some of the students in your classes won’t leave high school prepared to succeed in a 2- or 4-year college?
(Base: believe less than 100% could leave HS prepared to succeed)
Total Sample Elementary Middle High
BASE 37,029 19,546 6,987 8,122
Lack of participation in college preparatory coursework 2% 2% 2% 3%
Poor reading and communication skills 19% 20% 17% 15%
Lack of critical thinking and problem-solving abilities 17% 18% 16% 17%
Lack of encouragement from family and friends 27% 34% 22% 15%
Lack of student motivation 34% 25% 43% 49%
Not sure (v) 1% 1% * 1%
Decline to answer (v) * * * *
Q740. Now, of the remaining four items, which one do you believe is the next most likely reason that some of the students in your classes won’t leave high school prepared to succeed in a 2- or 4-year college?
(Base: online respondents who believe less than 100% could leave HS prepared to succeed)
Total Sample Elementary Middle High
BASE 23,448 12,717 4,446 4,889
Lack of participation in college preparatory coursework 5% 5% 5% 7%
Poor reading and communication skills 22% 22% 22% 23%
Lack of critical thinking and problem-solving abilities 24% 23% 24% 27%
Lack of encouragement from family and friends 22% 21% 24% 20%
Lack of student motivation 27% 29% 24% 23%

57 | PRIMARY SOURCES
APPENDIX A: Selected Survey Results
( * ) means less than one-half percent responding; and a ( - ) means non-response or zero percent
Q800. Overall, how would you rate student academic achievement at your school?
Total Sample Elementary Middle High
BASE 40,490 22,100 7,323 8,554
Excellent 28% 34% 23% 19%
Good 50% 50% 50% 49%
Fair 19% 14% 23% 26%
Poor 3% 2% 4% 6%
Not sure (v) * * * *
Decline to answer (v) * - * *
Q810. In your experience, how important is each of the following in measuring students’ academic achievement?
State-required standardized tests
Total Sample Elementary Middle High
BASE 40,490 22,100 7,323 8,554
Absolutely essential 6% 6% 7% 4%
Very important 21% 23% 21% 17%
Somewhat important 54% 53% 55% 54%
Not at all important 16% 14% 16% 23%
I don't use this 3% 4% 1% 3%
Not sure (v) * * * *
Decline to answer (v) * * * *
District-required tests Total Sample Elementary Middle High
BASE 40,490 22,100 7,323 8,554
Absolutely essential 6% 7% 5% 3%
Very important 25% 29% 24% 16%
Somewhat important 53% 52% 55% 51%
Not at all important 11% 8% 11% 19%
I don't use this 5% 3% 5% 9%
Not sure (v) * * * *
Decline to answer (v) * * - *
Performance on class assignments Total Sample Elementary Middle High
BASE 40,490 22,100 7,323 8,554
Absolutely essential 37% 38% 35% 35%
Very important 51% 51% 52% 51%
Somewhat important 11% 10% 13% 14%
Not at all important * * * *
I don't use this * * * *
Not sure (v) * * * *
Decline to answer (v) * * * *

58 | APPENDIX A
APPENDIX A: Selected Survey Results
( * ) means less than one-half percent responding; and a ( - ) means non-response or zero percent
(continued) Class participation Total Sample Elementary Middle High
BASE 40,490 22,100 7,323 8,554
Absolutely essential 47% 51% 43% 40%
Very important 42% 41% 44% 44%
Somewhat important 11% 8% 13% 15%
Not at all important * * 1% 1%
I don't use this * * * *
Not sure (v) * * * *
Decline to answer (v) * * - *
Formative, ongoing assessment during class Total Sample Elementary Middle High
BASE 40,490 22,100 7,323 8,554
Absolutely essential 54% 58% 51% 44%
Very important 38% 35% 39% 44%
Somewhat important 8% 6% 9% 11%
Not at all important * * * 1%
I don't use this * * * *
Not sure (v) * * * *
Decline to answer (v) * * * *
Tests from basal textbooks Total Sample Elementary Middle High
BASE 40,490 22,100 7,323 8,554
Absolutely essential 3% 4% 3% 3%
Very important 20% 20% 18% 18%
Somewhat important 52% 53% 52% 50%
Not at all important 12% 12% 14% 13%
I don't use this 12% 11% 13% 15%
Not sure (v) * * * 1%
Decline to answer (v) * * * *
Data from software programs Total Sample Elementary Middle High
BASE 40,490 22,100 7,323 8,554
Absolutely essential 6% 6% 6% 5%
Very important 23% 25% 24% 18%
Somewhat important 51% 52% 51% 50%
Not at all important 10% 8% 9% 14%
I don't use this 10% 9% 9% 13%
Not sure (v) 1% * 1% 1%
Decline to answer (v) * * * *
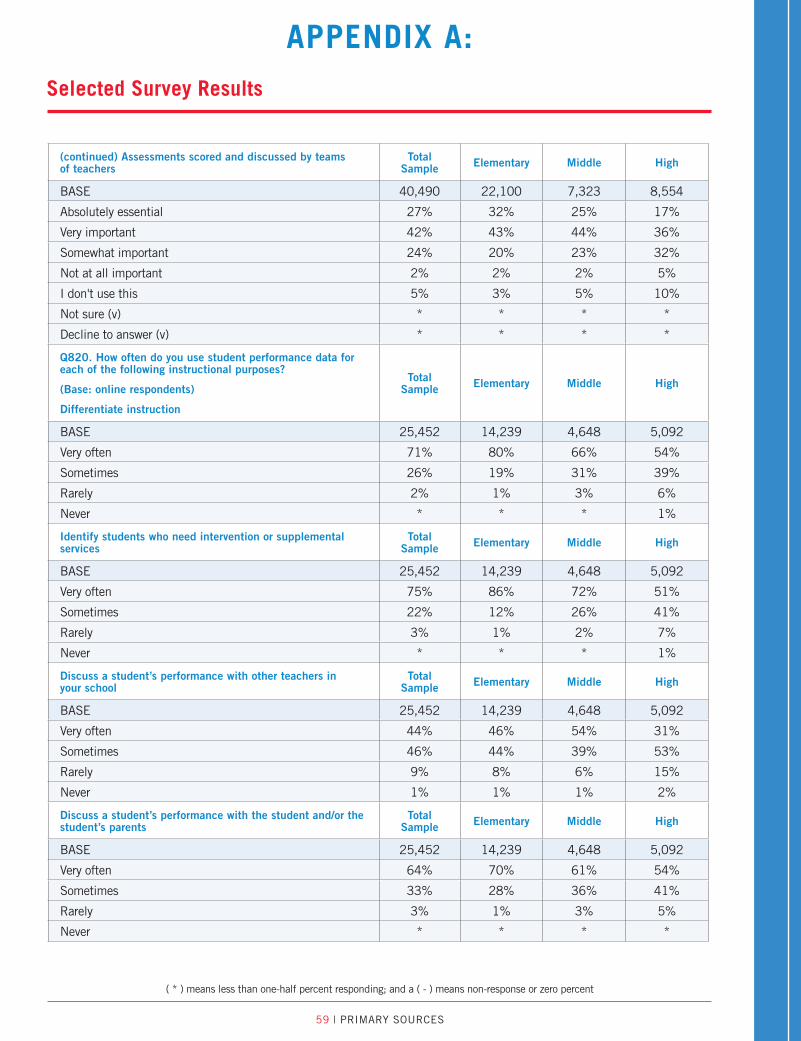
59 | PRIMARY SOURCES
APPENDIX A: Selected Survey Results
( * ) means less than one-half percent responding; and a ( - ) means non-response or zero percent
(continued) Assessments scored and discussed by teams of teachers
Total Sample Elementary Middle High
BASE 40,490 22,100 7,323 8,554
Absolutely essential 27% 32% 25% 17%
Very important 42% 43% 44% 36%
Somewhat important 24% 20% 23% 32%
Not at all important 2% 2% 2% 5%
I don't use this 5% 3% 5% 10%
Not sure (v) * * * *
Decline to answer (v) * * * *
Q820. How often do you use student performance data for each of the following instructional purposes?
(Base: online respondents)
Differentiate instruction
Total Sample Elementary Middle High
BASE 25,452 14,239 4,648 5,092
Very often 71% 80% 66% 54%
Sometimes 26% 19% 31% 39%
Rarely 2% 1% 3% 6%
Never * * * 1%
Identify students who need intervention or supplemental services
Total Sample Elementary Middle High
BASE 25,452 14,239 4,648 5,092
Very often 75% 86% 72% 51%
Sometimes 22% 12% 26% 41%
Rarely 3% 1% 2% 7%
Never * * * 1%
Discuss a student’s performance with other teachers in your school
Total Sample Elementary Middle High
BASE 25,452 14,239 4,648 5,092
Very often 44% 46% 54% 31%
Sometimes 46% 44% 39% 53%
Rarely 9% 8% 6% 15%
Never 1% 1% 1% 2%
Discuss a student’s performance with the student and/or the student’s parents
Total Sample Elementary Middle High
BASE 25,452 14,239 4,648 5,092
Very often 64% 70% 61% 54%
Sometimes 33% 28% 36% 41%
Rarely 3% 1% 3% 5%
Never * * * *
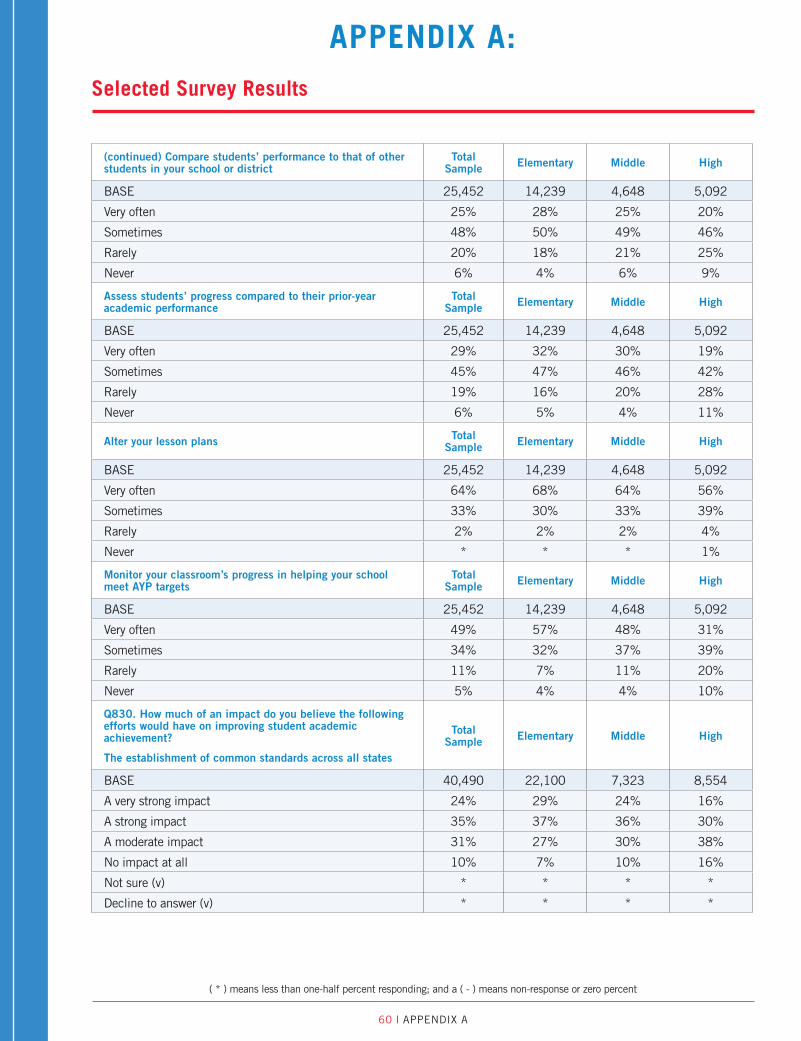
60 | APPENDIX A
APPENDIX A: Selected Survey Results
( * ) means less than one-half percent responding; and a ( - ) means non-response or zero percent
(continued) Compare students’ performance to that of other students in your school or district
Total Sample Elementary Middle High
BASE 25,452 14,239 4,648 5,092
Very often 25% 28% 25% 20%
Sometimes 48% 50% 49% 46%
Rarely 20% 18% 21% 25%
Never 6% 4% 6% 9%
Assess students’ progress compared to their prior-year academic performance
Total Sample Elementary Middle High
BASE 25,452 14,239 4,648 5,092
Very often 29% 32% 30% 19%
Sometimes 45% 47% 46% 42%
Rarely 19% 16% 20% 28%
Never 6% 5% 4% 11%
Alter your lesson plans Total Sample Elementary Middle High
BASE 25,452 14,239 4,648 5,092
Very often 64% 68% 64% 56%
Sometimes 33% 30% 33% 39%
Rarely 2% 2% 2% 4%
Never * * * 1%
Monitor your classroom’s progress in helping your school meet AYP targets
Total Sample Elementary Middle High
BASE 25,452 14,239 4,648 5,092
Very often 49% 57% 48% 31%
Sometimes 34% 32% 37% 39%
Rarely 11% 7% 11% 20%
Never 5% 4% 4% 10%
Q830. How much of an impact do you believe the following efforts would have on improving student academic achievement?
The establishment of common standards across all states
Total Sample Elementary Middle High
BASE 40,490 22,100 7,323 8,554
A very strong impact 24% 29% 24% 16%
A strong impact 35% 37% 36% 30%
A moderate impact 31% 27% 30% 38%
No impact at all 10% 7% 10% 16%
Not sure (v) * * * *
Decline to answer (v) * * * *

61 | PRIMARY SOURCES
APPENDIX A: Selected Survey Results
( * ) means less than one-half percent responding; and a ( - ) means non-response or zero percent
(continued) Common assessments across all states Total Sample Elementary Middle High
BASE 40,490 22,100 7,323 8,554
A very strong impact 20% 24% 20% 13%
A strong impact 31% 34% 31% 24%
A moderate impact 35% 32% 35% 40%
No impact at all 13% 9% 14% 21%
Not sure (v) * * * *
Decline to answer (v) * * * *
A longer school day or longer school year Total Sample Elementary Middle High
BASE 40,490 22,100 7,323 8,554
A very strong impact 9% 10% 10% 8%
A strong impact 20% 21% 21% 18%
A moderate impact 40% 40% 39% 39%
No impact at all 30% 28% 30% 34%
Not sure (v) * * * *
Decline to answer (v) * * * *
Up-to-date information-based technology that is well integrated into the classroom
Total Sample Elementary Middle High
BASE 40,490 22,100 7,323 8,554
A very strong impact 37% 37% 39% 34%
A strong impact 41% 42% 40% 40%
A moderate impact 20% 19% 19% 24%
No impact at all 2% 1% 2% 2%
Not sure (v) * * * *
Decline to answer (v) * * * *
Monetary rewards for teachers for their performance Total Sample Elementary Middle High
BASE 40,490 22,100 7,323 8,554
A very strong impact 10% 10% 10% 11%
A strong impact 18% 18% 18% 17%
A moderate impact 41% 41% 41% 42%
No impact at all 30% 30% 30% 29%
Not sure (v) * * * *
Decline to answer (v) * * * *

62 | APPENDIX A
APPENDIX A: Selected Survey Results
( * ) means less than one-half percent responding; and a ( - ) means non-response or zero percent
(continued) Tougher academic standards for students Total Sample Elementary Middle High
BASE 40,490 22,100 7,323 8,554
A very strong impact 13% 10% 16% 18%
A strong impact 32% 29% 33% 39%
A moderate impact 40% 43% 38% 33%
No impact at all 14% 17% 12% 9%
Not sure (v) * * * *
Decline to answer (v) * * * *
Clearer academic standards for students Total Sample Elementary Middle High
BASE 40,490 22,100 7,323 8,554
A very strong impact 30% 32% 31% 26%
A strong impact 43% 44% 43% 42%
A moderate impact 22% 20% 22% 25%
No impact at all 4% 4% 4% 6%
Not sure (v) * * * *
Decline to answer (v) * * * *
Fewer academic standards for students Total Sample Elementary Middle High
BASE 40,490 22,100 7,323 8,554
A very strong impact 11% 12% 12% 8%
A strong impact 23% 25% 22% 20%
A moderate impact 36% 37% 36% 35%
No impact at all 28% 25% 29% 36%
Not sure (v) 1% 1% 1% 1%
Decline to answer (v) * * * *
Q840. Below is a list of characteristics. Please tell us how important each is in impacting a student’s academic achievement.
Effective and engaged teachers
Total Sample Elementary Middle High
BASE 40,490 22,100 7,323 8,554
Absolutely essential 82% 86% 81% 75%
Very important 17% 14% 18% 24%
Somewhat important 1% * 1% 1%
Not at all important * * * -
Not sure (v) * * - *
Decline to answer (v) * * - *

63 | PRIMARY SOURCES
APPENDIX A: Selected Survey Results
( * ) means less than one-half percent responding; and a ( - ) means non-response or zero percent
(continued) Family involvement and support Total Sample Elementary Middle High
BASE 40,490 22,100 7,323 8,554
Absolutely essential 75% 78% 74% 68%
Very important 24% 21% 24% 29%
Somewhat important 2% 1% 2% 3%
Not at all important * * * *
Not sure (v) - - - -
Decline to answer (v) * * - *
Up-to-date information-based technology that is well integrated into the classroom
Total Sample Elementary Middle High
BASE 40,490 22,100 7,323 8,554
Absolutely essential 38% 40% 39% 33%
Very important 43% 43% 43% 44%
Somewhat important 18% 16% 17% 22%
Not at all important 1% 1% 1% 1%
Not sure (v) * * * *
Decline to answer (v) * * * *
Learning experiences that provide students with 21st Century skills
Total Sample Elementary Middle High
BASE 40,490 22,100 7,323 8,554
Absolutely essential 54% 57% 53% 46%
Very important 40% 38% 40% 44%
Somewhat important 6% 5% 6% 9%
Not at all important * * * *
Not sure (v) * * * *
Decline to answer (v) * * * *
Effective and engaged principals and building-level leaders Total Sample Elementary Middle High
BASE 40,490 22,100 7,323 8,554
Absolutely essential 58% 63% 58% 47%
Very important 33% 31% 34% 38%
Somewhat important 8% 6% 8% 13%
Not at all important 1% * 1% 1%
Not sure (v) * * * *
Decline to answer (v) * * * *

64 | APPENDIX A
APPENDIX A: Selected Survey Results
( * ) means less than one-half percent responding; and a ( - ) means non-response or zero percent
(continued) Teaching resources to help differentiate instruction
Total Sample Elementary Middle High
BASE 40,490 22,100 7,323 8,554
Absolutely essential 53% 62% 49% 35%
Very important 37% 33% 40% 45%
Somewhat important 9% 5% 10% 18%
Not at all important 1% * 1% 1%
Not sure (v) * * * *
Decline to answer (v) * * * *
High expectations for all students Total Sample Elementary Middle High
BASE 40,490 22,100 7,323 8,554
Absolutely essential 71% 76% 69% 61%
Very important 26% 22% 28% 35%
Somewhat important 3% 2% 3% 4%
Not at all important * * * *
Not sure (v) * * * *
Decline to answer (v) * * - *
In-school behavioral supports such as guidance counselors/social workers
Total Sample Elementary Middle High
BASE 40,490 22,100 7,323 8,554
Absolutely essential 48% 54% 48% 36%
Very important 37% 35% 38% 41%
Somewhat important 14% 11% 13% 21%
Not at all important 1% 1% 1% 1%
Not sure (v) * * - *
Decline to answer (v) * * - *
Academic supports that supplement classroom instruction Total Sample Elementary Middle High
BASE 40,490 22,100 7,323 8,554
Absolutely essential 47% 54% 44% 33%
Very important 43% 40% 45% 49%
Somewhat important 9% 6% 10% 16%
Not at all important * * * *
Not sure (v) * * * *
Decline to answer (v) * * * *

65 | PRIMARY SOURCES
APPENDIX A: Selected Survey Results
( * ) means less than one-half percent responding; and a ( - ) means non-response or zero percent
Q850. Now, of the characteristics that you consider to be absolutely essential or very important, which two do you think are the most important in impacting a student’s academic achievement?
(Base: rated more than two items as absolutely essential or very important)
Total Sample Elementary Middle High
BASE 40,386 22,066 7,308 8,506
Effective and engaged teachers 66% 66% 65% 67%
Family involvement and support 60% 60% 60% 59%
High expectations for all students 28% 27% 28% 29%
Learning experiences that provide students with 21st Century skills
10% 8% 13% 13%
Teaching resources to help differentiate instruction 10% 12% 8% 5%
Academic supports that supplement classroom instruction 7% 8% 6% 5%
Up-to-date information-based technology that is well integrated into the classroom
6% 5% 7% 7%
Effective and engaged principals and building-level leaders 6% 5% 6% 6%
In-school behavioral supports such as guidance counselors and social workers
5% 5% 6% 4%
Not sure (v) * * * *
Decline to answer (v) * * * *
Q860. In your opinion, what is the one change that would most improve student achievement in American schools?
(Base: online respondents)
Total Sample Elementary Middle High
BASE 25,452 14,239 4,648 5,092
Involvement/Support (Net) 39% 39% 40% 38%
Teaching methods and standards (Net) 27% 26% 27% 28%
Standardized testing (Net) 7% 7% 7% 5%
Effective teachers/Administrative leaders (Net) 5% 6% 5% 5%
Funding/Opportunities (Net) 4% 5% 4% 3%
Other 8% 7% 8% 11%
None * * * *
Not sure * * * *
Decline to answer * * * *

66 | APPENDIX A
APPENDIX A: Selected Survey Results
( * ) means less than one-half percent responding; and a ( - ) means non-response or zero percent
Q900. How much do you agree or disagree with the following statements?
In general, students enter my classroom prepared for on-grade-level work.
Total Sample Elementary Middle High
BASE 40,490 22,100 7,323 8,554
Agree strongly 16% 18% 14% 12%
Agree somewhat 44% 44% 43% 43%
Disagree somewhat 26% 26% 27% 29%
Disagree strongly 14% 13% 15% 16%
Not sure (v) * * * *
Decline to answer (v) * * * *
In general, students leave my classroom prepared for the next level of their education.
Total Sample Elementary Middle High
BASE 40,490 22,100 7,323 8,554
Agree strongly 46% 51% 38% 38%
Agree somewhat 48% 44% 53% 54%
Disagree somewhat 5% 4% 7% 7%
Disagree strongly 1% 1% 2% 1%
Not sure (v) * * * *
Decline to answer (v) * * * *
Q910. Do you think your state’s standards are too high, about right or too low?
Total Sample Elementary Middle High
BASE 40,490 22,100 7,323 8,554
Too low 13% 8% 14% 22%
About right 69% 71% 70% 65%
Too high 17% 20% 15% 12%
Not sure (v) 1% 1% 1% 1%
Decline to answer (v) * * * *
Q920. Do you think your state has too many standards, the right amount of standards or too few standards?
Total Sample Elementary Middle High
BASE 40,490 22,100 7,323 8,554
Too few standards 4% 2% 3% 7%
The right amount of standards 46% 46% 45% 44%
Too many standards 50% 51% 51% 49%
Not sure (v) * * * 1%
Decline to answer (v) * * * *

67 | PRIMARY SOURCES
APPENDIX A: Selected Survey Results
( * ) means less than one-half percent responding; and a ( - ) means non-response or zero percent
Q930. How much do you agree or disagree with the following statement?
My state’s standards are not clear enough.
Total Sample Elementary Middle High
BASE 40,490 22,100 7,323 8,554
Strongly agree 14% 12% 14% 17%
Somewhat agree 40% 40% 39% 39%
Somewhat disagree 30% 32% 30% 29%
Strongly disagree 15% 16% 16% 15%
Not sure (v) * * * *
Decline to answer (v) * * * *
Q940. Please indicate whether you agree or disagree with each of the following statements.
(Base: online respondents)
Traditional textbooks help my students’ academic achievement.
Total Sample Elementary Middle High
BASE 25,452 14,239 4,648 5,092
Agree strongly 12% 11% 12% 13%
Agree somewhat 57% 57% 57% 57%
Disagree somewhat 24% 24% 24% 23%
Disagree strongly 7% 8% 7% 7%
Traditional textbooks engage my students in learning. Total Sample Elementary Middle High
BASE 25,452 14,239 4,648 5,092
Agree strongly 6% 6% 5% 6%
Agree somewhat 40% 42% 38% 38%
Disagree somewhat 39% 37% 41% 42%
Disagree strongly 15% 14% 16% 14%
Digital resources such as classroom technology and Web-based programs help my students’ academic achievement.
Total Sample Elementary Middle High
BASE 25,452 14,239 4,648 5,092
Agree strongly 44% 45% 46% 40%
Agree somewhat 49% 48% 49% 52%
Disagree somewhat 6% 6% 5% 7%
Disagree strongly 1% 1% 1% 1%
Digital resources such as classroom technology and Web-based programs engage my students in learning.
Total Sample Elementary Middle High
BASE 25,452 14,239 4,648 5,092
Agree strongly 57% 60% 60% 47%
Agree somewhat 38% 36% 36% 45%
Disagree somewhat 4% 3% 3% 6%
Disagree strongly 1% 1% 1% 1%

68 | APPENDIX A
APPENDIX A: Selected Survey Results
( * ) means less than one-half percent responding; and a ( - ) means non-response or zero percent
(continued) Classroom magazines and books other than textbooks help my students’ academic achievement.
Total Sample Elementary Middle High
BASE 25,452 14,239 4,648 5,092
Agree strongly 38% 46% 34% 24%
Agree somewhat 53% 50% 55% 57%
Disagree somewhat 8% 4% 10% 16%
Disagree strongly 1% 1% 2% 3%
Classroom magazines and books other than textbooks engage my students in learning.
Total Sample Elementary Middle High
BASE 25,452 14,239 4,648 5,092
Agree strongly 43% 52% 38% 25%
Agree somewhat 48% 44% 52% 55%
Disagree somewhat 7% 3% 8% 16%
Disagree strongly 1% 1% 2% 4%
Differentiated assignments engage my students in learning. Total Sample Elementary Middle High
BASE 25,452 14,239 4,648 5,092
Agree strongly 56% 64% 52% 40%
Agree somewhat 39% 34% 42% 50%
Disagree somewhat 4% 2% 5% 8%
Disagree strongly 1% * 1% 2%
High-quality curriculum ensures my students’ academic achievement.
Total Sample Elementary Middle High
BASE 25,452 14,239 4,648 5,092
Agree strongly 44% 48% 42% 35%
Agree somewhat 45% 43% 45% 47%
Disagree somewhat 10% 8% 10% 15%
Disagree strongly 2% 1% 2% 3%
Q1000. Below is a list of factors that some people say may be associated with retaining good teachers. How important do you think each of these items is in retaining good teachers?
Higher salaries
Total Sample Elementary Middle High
BASE 40,490 22,100 7,323 8,554
Absolutely essential 45% 48% 43% 40%
Very important 36% 35% 37% 38%
Somewhat important 17% 16% 18% 20%
Not at all important 1% 1% 1% 1%
Not sure (v) * * * *
Decline to answer (v) * * * *

69 | PRIMARY SOURCES
APPENDIX A: Selected Survey Results
( * ) means less than one-half percent responding; and a ( - ) means non-response or zero percent
(continued) Pay tied to teachers’ performance Total Sample Elementary Middle High
BASE 40,490 22,100 7,323 8,554
Absolutely essential 8% 8% 8% 8%
Very important 17% 17% 17% 18%
Somewhat important 38% 38% 39% 39%
Not at all important 36% 36% 36% 35%
Not sure (v) * * * *
Decline to answer (v) * * * *
Supportive leadership Total Sample Elementary Middle High
BASE 40,490 22,100 7,323 8,554
Absolutely essential 68% 71% 70% 61%
Very important 28% 26% 28% 34%
Somewhat important 3% 2% 3% 5%
Not at all important * * * *
Not sure (v) * * * *
Decline to answer (v) * * * *
Professional development that is relevant to personal and school goals
Total Sample Elementary Middle High
BASE 40,490 22,100 7,323 8,554
Absolutely essential 45% 49% 43% 35%
Very important 40% 39% 40% 42%
Somewhat important 14% 11% 15% 20%
Not at all important 1% 1% 1% 3%
Not sure (v) * * * *
Decline to answer (v) * * * *
Access to high-quality curriculum and teaching resources Total Sample Elementary Middle High
BASE 40,490 22,100 7,323 8,554
Absolutely essential 49% 54% 47% 40%
Very important 41% 39% 42% 44%
Somewhat important 10% 8% 11% 15%
Not at all important * * * 1%
Not sure (v) * * * *
Decline to answer (v) * * * *

70 | APPENDIX A
APPENDIX A: Selected Survey Results
( * ) means less than one-half percent responding; and a ( - ) means non-response or zero percent
(continued) Collegial work environment Total Sample Elementary Middle High
BASE 40,490 22,100 7,323 8,554
Absolutely essential 42% 44% 42% 36%
Very important 44% 43% 44% 46%
Somewhat important 13% 12% 13% 16%
Not at all important 1% 1% 1% 1%
Not sure (v) * * * *
Decline to answer (v) * * * *
Time for teachers to collaborate Total Sample Elementary Middle High
BASE 40,490 22,100 7,323 8,554
Absolutely essential 54% 61% 54% 41%
Very important 35% 32% 35% 40%
Somewhat important 10% 7% 10% 18%
Not at all important 1% * 1% 2%
Not sure (v) * * - *
Decline to answer (v) * * * *
Clean and safe building conditions Total Sample Elementary Middle High
BASE 40,490 22,100 7,323 8,554
Absolutely essential 45% 47% 44% 41%
Very important 43% 42% 42% 45%
Somewhat important 12% 11% 13% 14%
Not at all important * * * *
Not sure (v) * * * *
Decline to answer (v) * * * *
Opportunities for alternate careers in the classroom, like mentor teaching
Total Sample Elementary Middle High
BASE 40,490 22,100 7,323 8,554
Absolutely essential 18% 20% 17% 13%
Very important 35% 36% 35% 32%
Somewhat important 40% 38% 41% 43%
Not at all important 7% 6% 7% 11%
Not sure (v) * * * *
Decline to answer (v) * * * *
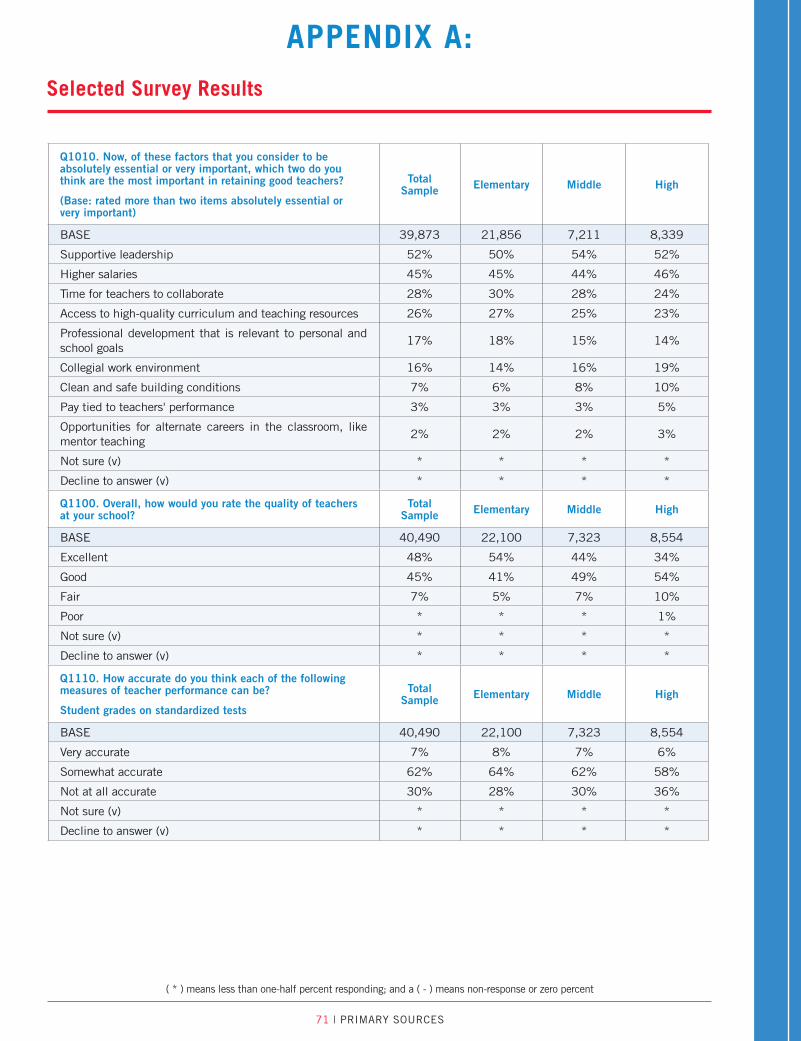
71 | PRIMARY SOURCES
APPENDIX A: Selected Survey Results
( * ) means less than one-half percent responding; and a ( - ) means non-response or zero percent
Q1010. Now, of these factors that you consider to be absolutely essential or very important, which two do you think are the most important in retaining good teachers?
(Base: rated more than two items absolutely essential or very important)
Total Sample Elementary Middle High
BASE 39,873 21,856 7,211 8,339
Supportive leadership 52% 50% 54% 52%
Higher salaries 45% 45% 44% 46%
Time for teachers to collaborate 28% 30% 28% 24%
Access to high-quality curriculum and teaching resources 26% 27% 25% 23%
Professional development that is relevant to personal and school goals
17% 18% 15% 14%
Collegial work environment 16% 14% 16% 19%
Clean and safe building conditions 7% 6% 8% 10%
Pay tied to teachers' performance 3% 3% 3% 5%
Opportunities for alternate careers in the classroom, like mentor teaching
2% 2% 2% 3%
Not sure (v) * * * *
Decline to answer (v) * * * *
Q1100. Overall, how would you rate the quality of teachers at your school?
Total Sample Elementary Middle High
BASE 40,490 22,100 7,323 8,554
Excellent 48% 54% 44% 34%
Good 45% 41% 49% 54%
Fair 7% 5% 7% 10%
Poor * * * 1%
Not sure (v) * * * *
Decline to answer (v) * * * *
Q1110. How accurate do you think each of the following measures of teacher performance can be?
Student grades on standardized tests
Total Sample Elementary Middle High
BASE 40,490 22,100 7,323 8,554
Very accurate 7% 8% 7% 6%
Somewhat accurate 62% 64% 62% 58%
Not at all accurate 30% 28% 30% 36%
Not sure (v) * * * *
Decline to answer (v) * * * *

72 | APPENDIX A
APPENDIX A: Selected Survey Results
( * ) means less than one-half percent responding; and a ( - ) means non-response or zero percent
(continued) Student growth over the course of an academic year
Total Sample Elementary Middle High
BASE 40,490 22,100 7,323 8,554
Very accurate 55% 59% 50% 50%
Somewhat accurate 42% 39% 46% 46%
Not at all accurate 2% 2% 3% 3%
Not sure (v) * * * *
Decline to answer (v) * * * *
Parent evaluation Total Sample Elementary Middle High
BASE 40,490 22,100 7,323 8,554
Very accurate 7% 9% 6% 5%
Somewhat accurate 66% 69% 64% 58%
Not at all accurate 27% 22% 30% 36%
Not sure (v) * * * *
Decline to answer (v) * * * *
Self-evaluation Total Sample Elementary Middle High
BASE 40,490 22,100 7,323 8,554
Very accurate 31% 33% 30% 28%
Somewhat accurate 63% 62% 64% 64%
Not at all accurate 6% 5% 5% 8%
Not sure (v) * * * *
Decline to answer (v) * * * *
Teacher exercising a leadership role among peers Total Sample Elementary Middle High
BASE 40,490 22,100 7,323 8,554
Very accurate 28% 29% 28% 25%
Somewhat accurate 60% 60% 61% 59%
Not at all accurate 12% 10% 11% 15%
Not sure (v) * * * *
Decline to answer (v) * * * *
Student engagement Total Sample Elementary Middle High
BASE 40,490 22,100 7,323 8,554
Very accurate 60% 65% 56% 52%
Somewhat accurate 38% 34% 41% 44%
Not at all accurate 2% 1% 2% 4%
Not sure (v) * * * *
Decline to answer (v) * * * *

73 | PRIMARY SOURCES
APPENDIX A: Selected Survey Results
( * ) means less than one-half percent responding; and a ( - ) means non-response or zero percent
(continued) Teacher tenure Total Sample Elementary Middle High
BASE 40,490 22,100 7,323 8,554
Very accurate 10% 11% 9% 8%
Somewhat accurate 47% 49% 45% 43%
Not at all accurate 42% 39% 45% 48%
Not sure (v) 1% 1% 1% *
Decline to answer (v) * * * *
Principal observation and review Total Sample Elementary Middle High
BASE 40,490 22,100 7,323 8,554
Very accurate 22% 25% 19% 15%
Somewhat accurate 70% 69% 72% 71%
Not at all accurate 8% 6% 8% 14%
Not sure (v) * * * *
Decline to answer (v) * * * *
Teacher/peer observation and review Total Sample Elementary Middle High
BASE 40,490 22,100 7,323 8,554
Very accurate 32% 33% 32% 32%
Somewhat accurate 61% 61% 61% 61%
Not at all accurate 6% 6% 6% 7%
Not sure (v) * * * *
Decline to answer (v) * * * *
Department Chair or Team Leader observation and review Total Sample Elementary Middle High
BASE 40,490 22,100 7,323 8,554
Very accurate 20% 19% 20% 24%
Somewhat accurate 67% 69% 68% 64%
Not at all accurate 11% 12% 11% 11%
Not sure (v) 1% 1% 1% *
Decline to answer (v) * * * *
Student evaluations Total Sample Elementary Middle High
BASE 40,490 22,100 7,323 8,554
Very accurate 18% 18% 16% 17%
Somewhat accurate 66% 66% 67% 66%
Not at all accurate 16% 15% 16% 17%
Not sure (v) * * * *
Decline to answer (v) * * * *

74 | APPENDIX A
APPENDIX A: Selected Survey Results
( * ) means less than one-half percent responding; and a ( - ) means non-response or zero percent
Q1500. How much do you agree or disagree with each of the following statements?
(Base: online respondents)
I keep extra snacks in my classroom for hungry students.
Total Sample Elementary Middle High
BASE 25,452 14,239 4,648 5,092
Agree strongly 32% 42% 23% 15%
Agree somewhat 33% 35% 35% 28%
Disagree somewhat 17% 13% 21% 21%
Disagree strongly 18% 9% 22% 35%
My curriculum includes issues around bullying, friendships and healthy relationships.
Total Sample Elementary Middle High
BASE 25,452 14,239 4,648 5,092
Agree strongly 40% 52% 31% 19%
Agree somewhat 39% 38% 44% 37%
Disagree somewhat 12% 7% 15% 24%
Disagree strongly 9% 4% 10% 20%
My students have my phone number and personal email address so they can reach me if they need to.
Total Sample Elementary Middle High
BASE 25,452 14,239 4,648 5,092
Agree strongly 21% 21% 18% 23%
Agree somewhat 26% 25% 25% 27%
Disagree somewhat 21% 22% 21% 18%
Disagree strongly 32% 32% 36% 32%
I attend my students’ after-school and weekend events. Total Sample Elementary Middle High
BASE 25,452 14,239 4,648 5,092
Agree strongly 20% 17% 21% 26%
Agree somewhat 50% 47% 54% 55%
Disagree somewhat 19% 22% 16% 13%
Disagree strongly 11% 13% 8% 7%
I am willing to have parent/teacher conferences at my students’ homes.
Total Sample Elementary Middle High
BASE 25,452 14,239 4,648 5,092
Agree strongly 16% 19% 15% 11%
Agree somewhat 29% 32% 26% 23%
Disagree somewhat 24% 24% 25% 25%
Disagree strongly 31% 25% 34% 41%
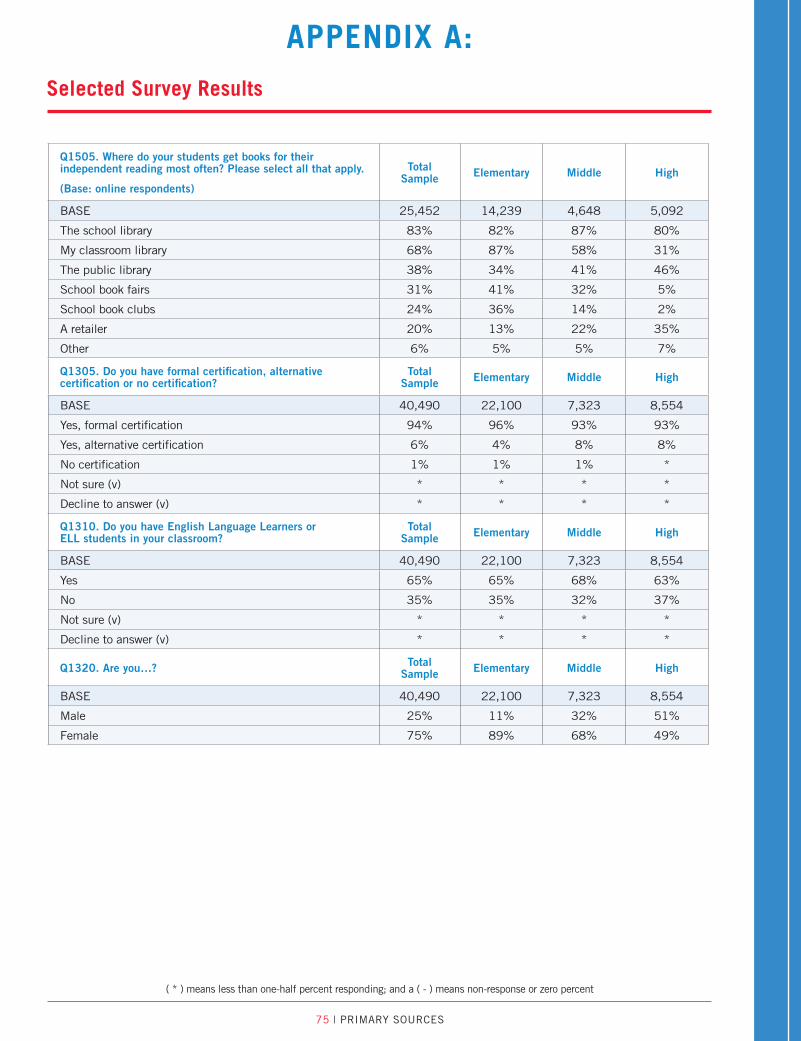
75 | PRIMARY SOURCES
APPENDIX A: Selected Survey Results
( * ) means less than one-half percent responding; and a ( - ) means non-response or zero percent
Q1505. Where do your students get books for their independent reading most often? Please select all that apply.
(Base: online respondents)
Total Sample Elementary Middle High
BASE 25,452 14,239 4,648 5,092
The school library 83% 82% 87% 80%
My classroom library 68% 87% 58% 31%
The public library 38% 34% 41% 46%
School book fairs 31% 41% 32% 5%
School book clubs 24% 36% 14% 2%
A retailer 20% 13% 22% 35%
Other 6% 5% 5% 7%
Q1305. Do you have formal certification, alternative certification or no certification?
Total Sample Elementary Middle High
BASE 40,490 22,100 7,323 8,554
Yes, formal certification 94% 96% 93% 93%
Yes, alternative certification 6% 4% 8% 8%
No certification 1% 1% 1% *
Not sure (v) * * * *
Decline to answer (v) * * * *
Q1310. Do you have English Language Learners or ELL students in your classroom?
Total Sample Elementary Middle High
BASE 40,490 22,100 7,323 8,554
Yes 65% 65% 68% 63%
No 35% 35% 32% 37%
Not sure (v) * * * *
Decline to answer (v) * * * *
Q1320. Are you…? Total Sample Elementary Middle High
BASE 40,490 22,100 7,323 8,554
Male 25% 11% 32% 51%
Female 75% 89% 68% 49%

76 | APPENDIX A
APPENDIX A: Selected Survey Results
( * ) means less than one-half percent responding; and a ( - ) means non-response or zero percent
Q1325. Age Total Sample Elementary Middle High
BASE 40,490 22,100 7,323 8,554
20 – 24 4% 5% 4% 2%
25 – 29 13% 14% 12% 10%
30 – 34 12% 12% 13% 12%
35 – 39 12% 12% 13% 12%
40 – 44 12% 12% 12% 11%
45 – 49 12% 12% 13% 13%
50 – 54 15% 14% 14% 16%
55 – 59 13% 13% 13% 15%
60 – 64 5% 5% 5% 7%
65 and over 1% * 1% 1%
Not sure (v) * * * -
Decline to answer (v) 1% 1% 1% 1%
MEAN 42.8 42.0 42.6 44.4
Q1330. Are you of Latino origin, such as Mexican American, Latin American, Puerto Rican, or Cuban?
Total Sample Elementary Middle High
BASE 40,490 22,100 7,323 8,554
Yes, of Latino origin 5% 6% 5% 4%
No, not of Latino origin 89% 89% 89% 89%
Not sure (v) * * * 1%
Decline to answer (v) 5% 4% 6% 6%
Q1335. Do you consider yourself…? Total Sample Elementary Middle High
BASE 40,490 22,100 7,323 8,554
White 83% 84% 81% 83%
Black 2% 2% 3% 2%
African American 2% 2% 3% 2%
Asian or Pacific Islander 1% 1% 2% 2%
Native American or Alaskan native 1% 1% 1% *
Mixed racial background 2% 2% 2% 2%
Other race 3% 3% 2% 2%
Not sure (v) * * * *
Decline to answer (v) 6% 5% 7% 7%

Teachers’ Views on Student Achievement (by state)
APPENDIX B:Teachers’ Views on Student Achievement (by state)

78 | APPENDIX B
APPENDIX B:
( * ) means less than one-half percent responding; and a ( - ) means non-response or zero percent
Teachers’ Views on Student Achievement (by state)
State Student Achievement RatingStudents Enter Class Prepared for On-Grade-Level Work
Percent of Students Prepared to Succeed in College
Excellent Good Fair Poor % Agree Strongly Mean
Alabama (n=554) 34% 49% 16% 2% 18% 69.4%
Alaska (n=91) 13% 60% 18% 8% 8% 61.6%
Arizona (n=866) 25% 49% 21% 5% 13% 67.0%
Arkansas (n=437) 21% 56% 21% 3% 15% 65.5%
California (n=3285) 24% 45% 24% 7% 12% 64.4%
Colorado (n=852) 24% 50% 21% 4% 14% 71.5%
Connecticut (n=511) 28% 48% 22% 3% 17% 72.8%
Delaware (n=118) 18% 53% 22% 6% 6% 63.4%
Florida (n=2358) 31% 46% 19% 3% 14% 66.9%
Georgia (n=1375) 29% 51% 18% 2% 14% 71.3%
Hawaii (n=100) 11% 48% 34% 7% 11% 60.3%
Idaho (n=319) 33% 51% 16% * 18% 70.4%
Illinois (n=1495) 29% 52% 15% 4% 17% 71.8%
Indiana (n=1059) 23% 51% 23% 3% 15% 68.4%
Iowa (n=612) 30% 54% 15% 1% 21% 72.6%
Kansas (n=767) 38% 48% 12% 2% 20% 73.9%
Kentucky (n=394) 30% 53% 15% 2% 16% 68.6%
Louisiana (n=555) 25% 43% 28% 4% 16% 62.9%
Maine (n=244) 28% 52% 17% 2% 13% 71.3%
Maryland (n=681) 30% 46% 20% 4% 20% 72.1%
Massachusetts (n=809) 30% 49% 19% 2% 21% 75.7%
Michigan (n=1218) 27% 55% 15% 2% 19% 71.6%
Minnesota (n=751) 36% 50% 13% 1% 18% 71.8%
Mississippi (n=326) 24% 50% 22% 4% 10% 68.4%
Missouri (n=827) 27% 50% 20% 3% 17% 69.7%

79 | PRIMARY SOURCES
APPENDIX B:
( * ) means less than one-half percent responding; and a ( - ) means non-response or zero percent
Teachers’ Views on Student Achievement (by state)
State Student Achievement RatingStudents Enter Class Prepared for On-Grade-Level Work
Percent of Students Prepared to Succeed in College
Excellent Good Fair Poor % Agree Strongly Mean
Montana (n=184) 35% 53% 12% * 20% 72.5%
Nebraska (n=384) 33% 58% 8% 1% 18% 73.8%
Nevada (n=339) 19% 52% 25% 5% 13% 62.4%
New Hampshire (n=169) 35% 51% 15% * 21% 73.6%
New Jersey (n=951) 34% 45% 18% 3% 23% 75.0%
New Mexico (n=329) 22% 51% 25% 3% 10% 64.4%
New York (n=1906) 27% 49% 20% 4% 15% 71.2%
North Carolina (n=1678) 21% 53% 22% 4% 11% 67.8%
North Dakota (n=136) 46% 45% 10% - 29% 79.6%
Ohio (n=1613) 32% 48% 17% 3% 18% 69.9%
Oklahoma (n=578) 26% 58% 14% 2% 12% 68.1%
Oregon (n=541) 27% 52% 18% 2% 15% 67.3%
Pennsylvania (n=1493) 33% 49% 15% 3% 21% 71.4%
Rhode Island (n=117) 25% 46% 25% 4% 13% 69.6%
South Carolina (n=692) 26% 51% 20% 4% 14% 66.8%
South Dakota (n=266) 38% 46% 14% 1% 20% 76.5%
Tennessee (n=881) 28% 51% 18% 4% 14% 66.4%
Texas (n=3390) 30% 49% 18% 3% 13% 69.5%
Utah (n=654) 31% 51% 15% 2% 15% 71.2%
Vermont (n=104) 20% 66% 10% 4% 15% 74.4%
Virginia (n=1171) 30% 53% 15% 2% 15% 71.3%
Washington (n=915) 25% 50% 23% 3% 16% 66.5%
West Virginia (n=267) 15% 62% 20% 2% 13% 62.4%
Wisconsin (n=916) 29% 55% 14% 1% 20% 71.3%
Wyoming (n=139) 30% 48% 16% 6% 20% 70.0%

APPENDIX C:Teachers’ Views on the Impact of Standards on
Improving Student Academic Achievement (by state)
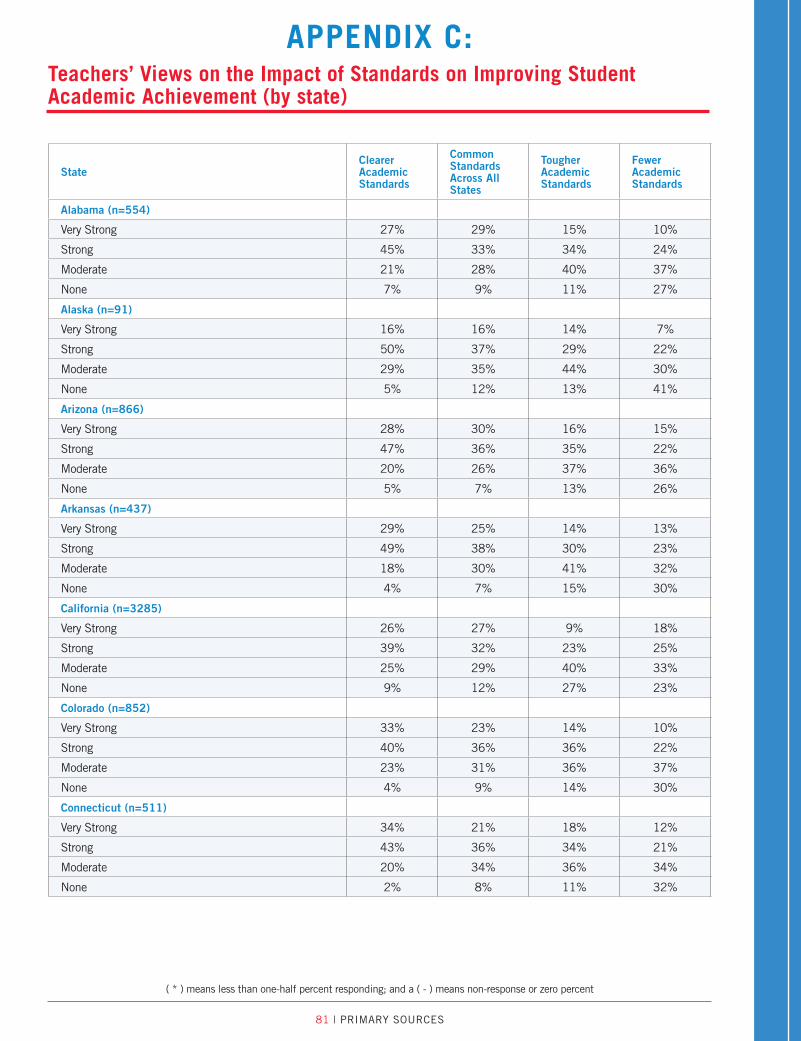
81 | PRIMARY SOURCES
APPENDIX C:
( * ) means less than one-half percent responding; and a ( - ) means non-response or zero percent
Teachers’ Views on the Impact of Standards on Improving Student Academic Achievement (by state)
StateClearer Academic Standards
Common Standards Across All States
Tougher Academic Standards
Fewer Academic Standards
Alabama (n=554)
Very Strong 27% 29% 15% 10%
Strong 45% 33% 34% 24%
Moderate 21% 28% 40% 37%
None 7% 9% 11% 27%
Alaska (n=91)
Very Strong 16% 16% 14% 7%
Strong 50% 37% 29% 22%
Moderate 29% 35% 44% 30%
None 5% 12% 13% 41%
Arizona (n=866)
Very Strong 28% 30% 16% 15%
Strong 47% 36% 35% 22%
Moderate 20% 26% 37% 36%
None 5% 7% 13% 26%
Arkansas (n=437)
Very Strong 29% 25% 14% 13%
Strong 49% 38% 30% 23%
Moderate 18% 30% 41% 32%
None 4% 7% 15% 30%
California (n=3285)
Very Strong 26% 27% 9% 18%
Strong 39% 32% 23% 25%
Moderate 25% 29% 40% 33%
None 9% 12% 27% 23%
Colorado (n=852)
Very Strong 33% 23% 14% 10%
Strong 40% 36% 36% 22%
Moderate 23% 31% 36% 37%
None 4% 9% 14% 30%
Connecticut (n=511)
Very Strong 34% 21% 18% 12%
Strong 43% 36% 34% 21%
Moderate 20% 34% 36% 34%
None 2% 8% 11% 32%

82 | APPENDIX C
APPENDIX C:
( * ) means less than one-half percent responding; and a ( - ) means non-response or zero percent
Teachers’ Views on the Impact of Standards on Improving Student Academic Achievement (by state)
StateClearer Academic Standards
Common Standards Across All States
Tougher Academic Standards
FewerAcademic Standards
Delaware (n=118)
Very Strong 27% 30% 12% 12%
Strong 45% 37% 31% 20%
Moderate 24% 24% 43% 35%
None 4% 8% 15% 33%
Florida (n=2358)
Very Strong 36% 32% 15% 14%
Strong 43% 38% 35% 25%
Moderate 17% 23% 38% 34%
None 3% 6% 12% 27%
Georgia (n=1375)
Very Strong 35% 35% 15% 14%
Strong 46% 38% 34% 28%
Moderate 16% 22% 39% 35%
None 3% 5% 12% 21%
Hawaii (n=100)
Very Strong 36% 28% 13% 9%
Strong 41% 36% 26% 35%
Moderate 18% 27% 43% 41%
None 5% 9% 18% 15%
Idaho (n=319)
Very Strong 30% 20% 11% 7%
Strong 44% 34% 40% 20%
Moderate 23% 34% 40% 35%
None 3% 12% 9% 35%
Illinois (n=1495)
Very Strong 27% 22% 12% 8%
Strong 45% 36% 36% 19%
Moderate 23% 30% 41% 40%
None 4% 11% 10% 33%
Indiana (n=1059)
Very Strong 29% 23% 7% 12%
Strong 40% 35% 24% 26%
Moderate 26% 32% 43% 37%
None 5% 9% 25% 24%

83 | PRIMARY SOURCES
APPENDIX C:
( * ) means less than one-half percent responding; and a ( - ) means non-response or zero percent
Teachers’ Views on the Impact of Standards on Improving Student Academic Achievement (by state)
StateClearer Academic Standards
Common Standards Across All States
Tougher Academic Standards
Fewer Academic Standards
Iowa (n=612)
Very Strong 22% 10% 14% 6%
Strong 50% 29% 38% 19%
Moderate 25% 45% 41% 38%
None 4% 14% 7% 36%
Kansas (n=767)
Very Strong 30% 24% 12% 8%
Strong 46% 36% 31% 24%
Moderate 20% 29% 42% 40%
None 4% 10% 13% 27%
Kentucky (n=394)
Very Strong 39% 33% 18% 16%
Strong 47% 39% 35% 28%
Moderate 12% 24% 37% 35%
None 2% 4% 9% 20%
Louisiana (n=555)
Very Strong 32% 30% 15% 12%
Strong 46% 36% 31% 22%
Moderate 17% 28% 40% 31%
None 4% 6% 13% 34%
Maine (n=244)
Very Strong 33% 20% 11% 7%
Strong 44% 31% 31% 21%
Moderate 22% 37% 42% 42%
None 1% 12% 16% 29%
Maryland (n=681)
Very Strong 30% 25% 18% 9%
Strong 46% 31% 38% 20%
Moderate 18% 33% 34% 35%
None 5% 10% 10% 35%
Massachusetts (n=809)
Very Strong 28% 20% 11% 12%
Strong 44% 36% 32% 19%
Moderate 25% 33% 42% 39%
None 3% 11% 15% 30%

84 | APPENDIX C
APPENDIX C:
( * ) means less than one-half percent responding; and a ( - ) means non-response or zero percent
Teachers’ Views on the Impact of Standards on Improving Student Academic Achievement (by state)
StateClearer Academic Standards
Common Standards Across All States
Tougher Academic Standards
FewerAcademic Standards
Michigan (n=1218)
Very Strong 29% 22% 12% 12%
Strong 44% 32% 29% 27%
Moderate 22% 33% 44% 31%
None 5% 12% 15% 29%
Minnesota (n=751)
Very Strong 29% 18% 10% 8%
Strong 44% 34% 31% 24%
Moderate 22% 36% 47% 41%
None 5% 12% 11% 26%
Mississippi (n=326)
Very Strong 33% 32% 20% 11%
Strong 47% 44% 38% 20%
Moderate 18% 21% 34% 33%
None 2% 2% 8% 36%
Missouri (n=827)
Very Strong 32% 25% 14% 11%
Strong 43% 34% 31% 22%
Moderate 22% 31% 41% 39%
None 3% 9% 14% 27%
Montana (n=184)
Very Strong 39% 15% 11% 9%
Strong 32% 37% 39% 18%
Moderate 27% 35% 41% 35%
None 2% 12% 8% 36%
Nebraska (n=384)
Very Strong 32% 15% 16% 8%
Strong 42% 30% 39% 24%
Moderate 25% 42% 39% 45%
None 2% 13% 5% 22%
Nevada (n=339)
Very Strong 26% 32% 14% 13%
Strong 46% 30% 32% 18%
Moderate 22% 34% 40% 40%
None 6% 3% 14% 28%

85 | PRIMARY SOURCES
APPENDIX C:
( * ) means less than one-half percent responding; and a ( - ) means non-response or zero percent
Teachers’ Views on the Impact of Standards on Improving Student Academic Achievement (by state)
StateClearer Academic Standards
Common Standards Across All States
Tougher Academic Standards
Fewer Academic Standards
New Hampshire (n=169)
Very Strong 27% 21% 14% 13%
Strong 46% 39% 36% 28%
Moderate 24% 28% 37% 35%
None 2% 11% 13% 24%
New Jersey (n=951)
Very Strong 22% 21% 12% 8%
Strong 49% 35% 39% 22%
Moderate 24% 32% 36% 35%
None 5% 12% 12% 34%
New Mexico (n=329)
Very Strong 41% 32% 15% 14%
Strong 39% 33% 32% 23%
Moderate 17% 25% 33% 35%
None 2% 9% 18% 27%
New York (n=1906)
Very Strong 30% 20% 12% 9%
Strong 43% 36% 31% 21%
Moderate 23% 32% 42% 38%
None 4% 11% 14% 31%
North Carolina (n=1678)
Very Strong 31% 26% 13% 10%
Strong 47% 40% 33% 25%
Moderate 19% 28% 40% 38%
None 3% 6% 13% 26%
North Dakota (n=136)
Very Strong 30% 28% 19% 10%
Strong 39% 26% 30% 20%
Moderate 23% 33% 40% 30%
None 8% 11% 9% 37%
Ohio (n=1613)
Very Strong 28% 22% 10% 14%
Strong 43% 35% 27% 26%
Moderate 23% 32% 44% 35%
None 6% 11% 18% 25%

86 | APPENDIX C
APPENDIX C:
( * ) means less than one-half percent responding; and a ( - ) means non-response or zero percent
Teachers’ Views on the Impact of Standards on Improving Student Academic Achievement (by state)
StateClearer Academic Standards
Common Standards Across All States
Tougher Academic Standards
FewerAcademic Standards
Oklahoma (n=578)
Very Strong 32% 23% 11% 9%
Strong 40% 36% 32% 17%
Moderate 24% 30% 45% 40%
None 4% 11% 12% 34%
Oregon (n=541)
Very Strong 33% 21% 11% 12%
Strong 42% 33% 31% 23%
Moderate 19% 33% 44% 36%
None 5% 13% 14% 28%
Pennsylvania (n=1493)
Very Strong 21% 17% 9% 7%
Strong 43% 35% 31% 23%
Moderate 29% 36% 44% 43%
None 7% 12% 15% 27%
Rhode Island (n=117)
Very Strong 35% 27% 13% 8%
Strong 38% 38% 35% 20%
Moderate 24% 26% 38% 32%
None 2% 8% 13% 40%
South Carolina (n=692)
Very Strong 36% 42% 14% 16%
Strong 39% 30% 30% 28%
Moderate 20% 21% 37% 33%
None 5% 7% 19% 22%
South Dakota (n=266)
Very Strong 28% 18% 15% 8%
Strong 40% 37% 36% 24%
Moderate 26% 34% 36% 38%
None 5% 10% 11% 28%
Tennessee (n=881)
Very Strong 35% 31% 15% 14%
Strong 42% 39% 31% 26%
Moderate 20% 24% 40% 34%
None 3% 6% 14% 24%

87 | PRIMARY SOURCES
APPENDIX C:
( * ) means less than one-half percent responding; and a ( - ) means non-response or zero percent
Teachers’ Views on the Impact of Standards on Improving Student Academic Achievement (by state)
StateClearer Academic Standards
Common Standards Across All States
Tougher Academic Standards
Fewer Academic Standards
Texas (n=3390)
Very Strong 32% 24% 16% 9%
Strong 46% 38% 36% 21%
Moderate 19% 31% 36% 35%
None 3% 8% 11% 34%
Utah (n=654)
Very Strong 35% 22% 15% 9%
Strong 45% 37% 35% 25%
Moderate 17% 32% 39% 32%
None 4% 9% 10% 32%
Vermont (n=104)
Very Strong 33% 14% 10% 11%
Strong 33% 28% 30% 22%
Moderate 23% 39% 38% 39%
None 11% 19% 22% 27%
Virginia (n=1171)
Very Strong 25% 25% 12% 9%
Strong 43% 34% 35% 24%
Moderate 27% 30% 37% 39%
None 4% 11% 15% 27%
Washington (n=915)
Very Strong 38% 23% 15% 11%
Strong 38% 34% 25% 23%
Moderate 20% 32% 44% 33%
None 4% 10% 15% 30%
West Virginia (n=267)
Very Strong 29% 33% 13% 18%
Strong 47% 34% 40% 28%
Moderate 22% 25% 34% 29%
None 2% 8% 12% 26%
Wisconsin (n=916)
Very Strong 29% 17% 14% 9%
Strong 43% 34% 30% 21%
Moderate 25% 37% 46% 37%
None 4% 11% 11% 31%

88 | APPENDIX C
APPENDIX C:
( * ) means less than one-half percent responding; and a ( - ) means non-response or zero percent
Teachers’ Views on the Impact of Standards on Improving Student Academic Achievement (by state)
StateClearer Academic Standards
Common Standards Across All States
Tougher Academic Standards
FewerAcademic Standards
Wyoming (n=139)
Very Strong 38% 14% 12% 10%
Strong 44% 40% 29% 24%
Moderate 14% 33% 45% 38%
None 4% 13% 12% 25%

APPENDIX D:Teachers’ Views on State Standards (by state)

90 | APPENDIX D
APPENDIX D:
( * ) means less than one-half percent responding; and a ( - ) means non-response or zero percent
Teachers’ Views on State Standards (by state)
StateAmount of State Standards
State Standards Not Clear Enough
Rigor of State Standards
Too Few
About Right
Too Many
% Agree
Too Low
About Right
Too High
Alabama (n=554) 7% 62% 31% 51% 15% 76% 8%
Alaska (n=91) 5% 55% 40% 53% 26% 72% 2%
Arizona (n=866) 3% 41% 55% 60% 23% 65% 11%
Arkansas (n=437) 3% 45% 51% 54% 7% 75% 17%
California (n=3285) 2% 34% 64% 45% 7% 58% 35%
Colorado (n=852) 4% 46% 49% 61% 13% 76% 10%
Connecticut (n=511) 4% 48% 47% 49% 8% 72% 20%
Delaware (n=118) 2% 47% 51% 51% 7% 77% 14%
Florida (n=2358) 4% 42% 54% 57% 17% 69% 14%
Georgia (n=1375) 3% 45% 52% 53% 15% 67% 17%
Hawaii (n=100) 1% 27% 71% 68% 6% 65% 29%
Idaho (n=319) 8% 48% 43% 55% 21% 72% 5%
Illinois (n=1495) 5% 47% 47% 61% 14% 73% 11%
Indiana (n=1059) 2% 39% 60% 59% 5% 71% 22%
Iowa (n=612) 9% 65% 21% 55% 9% 81% 4%
Kansas (n=767) 2% 55% 42% 46% 10% 78% 11%
Kentucky (n=394) 1% 37% 60% 66% 13% 68% 18%
Louisiana (n=555) 6% 51% 43% 52% 20% 68% 11%
Maine (n=244) 3% 37% 59% 65% 9% 71% 19%
Maryland (n=681) 4% 49% 46% 44% 18% 70% 12%
Massachusetts (n=809) 2% 44% 54% 49% 8% 68% 23%
Michigan (n=1218) 3% 32% 65% 61% 6% 65% 28%
Minnesota (n=751) 2% 43% 54% 61% 6% 73% 20%
Mississippi (n=326) 9% 58% 33% 58% 19% 69% 12%
Missouri (n=827) 1% 48% 51% 60% 7% 68% 24%

91 | PRIMARY SOURCES
APPENDIX D:
( * ) means less than one-half percent responding; and a ( - ) means non-response or zero percent
Teachers’ Views on State Standards (by state)
StateAmount of State Standards
State Standards Not Clear Enough
Rigor of State Standards
Too Few
About Right
Too Many
% Agree
Too Low
About Right
Too High
Montana (n=184) 6% 59% 34% 68% 13% 79% 8%
Nebraska (n=384) 3% 52% 43% 55% 13% 81% 4%
Nevada (n=339) 6% 47% 47% 54% 30% 61% 9%
New Hampshire (n=169) 4% 51% 45% 54% 9% 79% 13%
New Jersey (n=951) 4% 46% 50% 53% 10% 74% 15%
New Mexico (n=329) 3% 39% 57% 68% 19% 61% 18%
New York (n=1906) 5% 51% 44% 54% 16% 69% 14%
North Carolina (n=1678) 4% 48% 48% 58% 13% 63% 24%
North Dakota (n=136) * 65% 34% 54% 10% 81% 9%
Ohio (n=1613) 3% 37% 60% 53% 9% 71% 19%
Oklahoma (n=578) 4% 58% 37% 53% 14% 74% 11%
Oregon (n=541) 5% 48% 46% 50% 13% 78% 9%
Pennsylvania (n=1493) 3% 43% 53% 56% 9% 72% 17%
Rhode Island (n=117) 2% 46% 51% 55% 7% 72% 21%
South Carolina (n=692) 2% 48% 50% 54% 7% 67% 26%
South Dakota (n=266) 5% 57% 37% 58% 12% 83% 4%
Tennessee (n=881) 4% 40% 55% 59% 27% 56% 16%
Texas (n=3390) 5% 51% 44% 51% 17% 68% 15%
Utah (n=654) 5% 61% 33% 49% 16% 78% 5%
Vermont (n=104) 5% 50% 43% 47% 11% 68% 17%
Virginia (n=1171) 5% 48% 46% 40% 17% 63% 19%
Washington (n=915) 2% 41% 56% 53% 8% 71% 20%
West Virginia (n=267) 4% 39% 56% 54% 15% 62% 23%
Wisconsin (n=916) 3% 49% 48% 60% 14% 79% 6%
Wyoming (n=139) 3% 53% 43% 56% 17% 75% 8%

APPENDIX E:Teachers’ Views on Important Factors in Retaining Teachers (by state)

93 | PRIMARY SOURCES
APPENDIX E:
( * ) means less than one-half percent responding; and a ( - ) means non-response or zero percent
Teachers’ Views on Important Factors in Retaining Teachers (by state)
State
Higher Salaries
Pay Tied to Teachers’ Performance
Supportive Leadership
Access to High-Quality Curriculum & Teaching Resources
Time for Teachers to Collaborate
Alabama (n=554)
Absolutely essential 46% 15% 70% 47% 49%
Very important 32% 19% 27% 40% 38%
Somewhat important 19% 38% 3% 13% 12%
Not at all important 3% 27% - * *
Alaska (n=91)
Absolutely essential 57% 3% 65% 52% 61%
Very important 28% 17% 30% 42% 29%
Somewhat important 15% 37% 5% 6% 10%
Not at all important - 43% - - -
Arizona (n=866)
Absolutely essential 60% 15% 69% 50% 53%
Very important 32% 26% 29% 40% 37%
Somewhat important 7% 38% 2% 9% 10%
Not at all important 1% 20% - * -
Arkansas (n=437)
Absolutely essential 48% 8% 72% 56% 50%
Very important 39% 16% 25% 36% 34%
Somewhat important 12% 38% 3% 7% 15%
Not at all important 1% 37% * 1% 2%
California (n=3285)
Absolutely essential 45% 5% 66% 48% 54%
Very important 34% 12% 30% 40% 34%
Somewhat important 19% 32% 4% 12% 11%
Not at all important 2% 50% * * 1%
Colorado (n=852)
Absolutely essential 46% 8% 65% 45% 57%
Very important 34% 19% 30% 42% 33%
Somewhat important 19% 42% 5% 12% 9%
Not at all important 1% 30% * * 1%
Connecticut (n=511)
Absolutely essential 39% 3% 72% 49% 62%
Very important 36% 17% 25% 42% 33%
Somewhat important 25% 37% 3% 9% 5%
Not at all important 1% 43% * * *

94 | APPENDIX E
APPENDIX E:
( * ) means less than one-half percent responding; and a ( - ) means non-response or zero percent
Teachers’ Views on Important Factors in Retaining Teachers (by state)
State
Higher Salaries
Pay Tied to Teachers’ Performance
Supportive Leadership
Access to High-Quality Curriculum & Teaching Resources
Time for Teachers to Collaborate
Delaware (n=118)
Absolutely essential 52% 12% 73% 56% 66%
Very important 36% 25% 25% 38% 28%
Somewhat important 11% 39% 2% 6% 5%
Not at all important - 24% - - -
Florida (n=2358)
Absolutely essential 61% 11% 71% 54% 50%
Very important 27% 22% 26% 37% 38%
Somewhat important 11% 39% 3% 8% 11%
Not at all important 1% 27% - 1% 1%
Georgia (n=1375)
Absolutely essential 48% 10% 74% 50% 57%
Very important 36% 21% 24% 42% 35%
Somewhat important 15% 42% 2% 9% 7%
Not at all important 1% 27% * * *
Hawaii (n=100)
Absolutely essential 52% 8% 71% 54% 63%
Very important 38% 26% 25% 40% 26%
Somewhat important 10% 50% 4% 5% 11%
Not at all important - 17% - 2% -
Idaho (n=319)
Absolutely essential 41% 2% 58% 44% 46%
Very important 40% 12% 38% 39% 37%
Somewhat important 17% 33% 4% 15% 16%
Not at all important 2% 52% - 2% *
Illinois (n=1495)
Absolutely essential 40% 7% 70% 50% 58%
Very important 41% 16% 28% 41% 34%
Somewhat important 18% 40% 2% 9% 8%
Not at all important 1% 36% * * 1%
Indiana (n=1059)
Absolutely essential 35% 6% 67% 44% 53%
Very important 39% 14% 30% 40% 36%
Somewhat important 23% 35% 3% 16% 11%
Not at all important 3% 45% * * 1%

95 | PRIMARY SOURCES
APPENDIX E:
( * ) means less than one-half percent responding; and a ( - ) means non-response or zero percent
Teachers’ Views on Important Factors in Retaining Teachers (by state)
State
Higher Salaries
Pay Tied to Teachers’ Performance
Supportive Leadership
Access to High-Quality Curriculum & Teaching Resources
Time for Teachers to Collaborate
Iowa (n=612)
Absolutely essential 37% 3% 58% 46% 55%
Very important 41% 11% 38% 43% 34%
Somewhat important 21% 41% 3% 11% 11%
Not at all important 1% 45% - * *
Kansas (n=767)
Absolutely essential 47% 8% 64% 43% 54%
Very important 38% 17% 34% 45% 33%
Somewhat important 13% 39% 2% 12% 12%
Not at all important 1% 35% - * 1%
Kentucky (n=394)
Absolutely essential 42% 10% 68% 51% 51%
Very important 39% 17% 29% 38% 40%
Somewhat important 18% 41% 2% 11% 9%
Not at all important 1% 32% - * *
Louisiana (n=555)
Absolutely essential 51% 12% 73% 57% 55%
Very important 33% 24% 25% 34% 34%
Somewhat important 14% 40% 1% 9% 11%
Not at all important 1% 23% - - *
Maine (n=244)
Absolutely essential 45% 6% 69% 52% 60%
Very important 38% 23% 28% 37% 30%
Somewhat important 16% 44% 3% 11% 9%
Not at all important * 28% - - *
Maryland (n=681)
Absolutely essential 53% 8% 77% 53% 56%
Very important 35% 21% 21% 38% 35%
Somewhat important 12% 41% 2% 9% 7%
Not at all important * 30% - * 1%
Massachusetts (n=809)
Absolutely essential 40% 8% 66% 53% 53%
Very important 40% 13% 31% 38% 37%
Somewhat important 18% 37% 3% 8% 9%
Not at all important 1% 42% * 1% 1%

96 | APPENDIX E
APPENDIX E:
( * ) means less than one-half percent responding; and a ( - ) means non-response or zero percent
Teachers’ Views on Important Factors in Retaining Teachers (by state)
State
Higher Salaries
Pay Tied to Teachers’ Performance
Supportive Leadership
Access to High-Quality Curriculum & Teaching Resources
Time for Teachers to Collaborate
Michigan (n=1218)
Absolutely essential 33% 6% 66% 51% 59%
Very important 39% 12% 31% 37% 32%
Somewhat important 26% 37% 4% 11% 9%
Not at all important 2% 45% * 1% 1%
Minnesota (n=751)
Absolutely essential 35% 3% 62% 46% 57%
Very important 44% 12% 34% 43% 34%
Somewhat important 20% 44% 3% 11% 9%
Not at all important 1% 41% * * 1%
Mississippi (n=326)
Absolutely essential 48% 13% 73% 60% 52%
Very important 35% 24% 25% 34% 38%
Somewhat important 17% 43% 3% 5% 10%
Not at all important 1% 21% - - *
Missouri (n=827)
Absolutely essential 48% 7% 69% 45% 53%
Very important 38% 20% 29% 44% 37%
Somewhat important 14% 39% 2% 10% 10%
Not at all important 1% 34% - * 1%
Montana (n=184)
Absolutely essential 37% 6% 69% 44% 50%
Very important 37% 18% 28% 41% 40%
Somewhat important 24% 43% 3% 15% 10%
Not at all important 1% 33% - - *
Nebraska (n=384)
Absolutely essential 55% 7% 70% 47% 51%
Very important 31% 15% 28% 40% 38%
Somewhat important 14% 43% 2% 13% 10%
Not at all important - 35% * * 1%
Nevada (n=339)
Absolutely essential 53% 9% 67% 45% 50%
Very important 34% 16% 31% 41% 29%
Somewhat important 13% 35% 2% 14% 19%
Not at all important * 40% - - 1%

97 | PRIMARY SOURCES
APPENDIX E:
( * ) means less than one-half percent responding; and a ( - ) means non-response or zero percent
Teachers’ Views on Important Factors in Retaining Teachers (by state)
State
Higher Salaries
Pay Tied to Teachers’ Performance
Supportive Leadership
Access to High-Quality Curriculum & Teaching Resources
Time for Teachers to Collaborate
New Hampshire (n=169)
Absolutely essential 39% 8% 63% 51% 63%
Very important 47% 20% 33% 39% 31%
Somewhat important 13% 35% 3% 10% 5%
Not at all important 1% 35% - - -
New Jersey (n=951)
Absolutely essential 40% 8% 67% 47% 51%
Very important 43% 18% 29% 43% 39%
Somewhat important 17% 36% 3% 10% 9%
Not at all important 1% 37% * * 1%
New Mexico (n=329)
Absolutely essential 47% 6% 70% 50% 53%
Very important 36% 18% 28% 39% 36%
Somewhat important 16% 40% 2% 11% 11%
Not at all important 1% 35% - - *
New York (n=1906)
Absolutely essential 40% 7% 69% 52% 58%
Very important 38% 16% 27% 39% 33%
Somewhat important 20% 38% 4% 8% 8%
Not at all important 2% 38% - 1% 1%
North Carolina (n=1678)
Absolutely essential 54% 15% 75% 49% 54%
Very important 34% 29% 23% 42% 36%
Somewhat important 12% 39% 2% 8% 9%
Not at all important 1% 17% * * 1%
North Dakota (n=136)
Absolutely essential 47% 9% 68% 54% 51%
Very important 43% 15% 25% 37% 39%
Somewhat important 10% 35% 6% 9% 10%
Not at all important * 40% - - *
Ohio (n=1613)
Absolutely essential 34% 4% 64% 47% 52%
Very important 44% 13% 33% 42% 37%
Somewhat important 21% 40% 2% 10% 10%
Not at all important 1% 43% * * 1%

98 | APPENDIX E
APPENDIX E:
( * ) means less than one-half percent responding; and a ( - ) means non-response or zero percent
Teachers’ Views on Important Factors in Retaining Teachers (by state)
State
Higher Salaries
Pay Tied to Teachers’ Performance
Supportive Leadership
Access to High-Quality Curriculum & Teaching Resources
Time for Teachers to Collaborate
Oklahoma (n=578)
Absolutely essential 51% 8% 71% 46% 50%
Very important 34% 18% 27% 41% 38%
Somewhat important 14% 39% 2% 13% 12%
Not at all important 1% 35% - * *
Oregon (n=541)
Absolutely essential 36% 1% 69% 46% 61%
Very important 42% 7% 28% 45% 29%
Somewhat important 21% 28% 3% 9% 8%
Not at all important 1% 63% * * 2%
Pennsylvania (n=1493)
Absolutely essential 36% 4% 65% 47% 53%
Very important 41% 14% 31% 43% 37%
Somewhat important 22% 38% 4% 10% 10%
Not at all important 1% 43% * * *
Rhode Island (n=117)
Absolutely essential 28% 10% 66% 46% 48%
Very important 27% 14% 26% 49% 39%
Somewhat important 40% 47% 7% 5% 12%
Not at all important 5% 29% * - 1%
South Carolina (n=692)
Absolutely essential 50% 20% 75% 49% 52%
Very important 33% 26% 24% 41% 37%
Somewhat important 16% 38% 1% 9% 10%
Not at all important * 16% - * *
South Dakota (n=266)
Absolutely essential 43% 8% 68% 37% 50%
Very important 39% 14% 28% 43% 35%
Somewhat important 17% 37% 5% 20% 14%
Not at all important * 37% - - 1%
Tennessee (n=881)
Absolutely essential 48% 12% 71% 51% 51%
Very important 34% 22% 26% 39% 36%
Somewhat important 17% 41% 3% 10% 12%
Not at all important 1% 25% * - 1%

99 | PRIMARY SOURCES
APPENDIX E:
( * ) means less than one-half percent responding; and a ( - ) means non-response or zero percent
Teachers’ Views on Important Factors in Retaining Teachers (by state)
State
Higher Salaries
Pay Tied to Teachers’ Performance
Supportive Leadership
Access to High-Quality Curriculum & Teaching Resources
Time for Teachers to Collaborate
Texas (n=3390)
Absolutely essential 55% 12% 73% 53% 56%
Very important 31% 19% 25% 39% 34%
Somewhat important 13% 39% 2% 7% 10%
Not at all important 1% 29% * * *
Utah (n=654)
Absolutely essential 48% 8% 62% 46% 52%
Very important 37% 21% 32% 41% 37%
Somewhat important 14% 40% 6% 12% 11%
Not at all important 1% 30% * * 1%
Vermont (n=104)
Absolutely essential 42% 6% 63% 39% 56%
Very important 35% 15% 33% 47% 33%
Somewhat important 19% 38% 4% 15% 11%
Not at all important 3% 41% - - -
Virginia (n=1171)
Absolutely essential 52% 13% 72% 50% 55%
Very important 35% 21% 26% 42% 34%
Somewhat important 13% 35% 2% 8% 10%
Not at all important 1% 31% * * 1%
Washington (n=915)
Absolutely essential 41% 6% 62% 43% 51%
Very important 34% 9% 31% 44% 33%
Somewhat important 23% 37% 7% 12% 15%
Not at all important 1% 47% * 1% *
West Virginia (n=267)
Absolutely essential 59% 11% 63% 52% 51%
Very important 29% 24% 32% 40% 32%
Somewhat important 9% 34% 4% 8% 16%
Not at all important 3% 31% - - -
Wisconsin (n=916)
Absolutely essential 27% 6% 63% 43% 55%
Very important 44% 17% 34% 46% 33%
Somewhat important 27% 41% 3% 11% 11%
Not at all important 2% 35% - 1% *

100 | APPENDIX E
APPENDIX E:
( * ) means less than one-half percent responding; and a ( - ) means non-response or zero percent
Teachers’ Views on Important Factors in Retaining Teachers (by state)
State
Higher Salaries
Pay Tied to Teachers’ Performance
Supportive Leadership
Access to High-Quality Curriculum & Teaching Resources
Time for Teachers to Collaborate
Wyoming (n=139)
Absolutely essential 30% 5% 62% 40% 54%
Very important 40% 14% 34% 47% 30%
Somewhat important 29% 36% 5% 13% 15%
Not at all important - 41% - - 1%
101 | PRIMARY SOURCES
NOTES

102 | PRIMARY SOURCES
NOTES

103 | PRIMARY SOURCES
NOTES

104 | PRIMARY SOURCES
NOTES

A PORTRAIT OF AMERICA’S TEACHERS
75%OF TEACHERS ARE WOMEN, BUT THIS VARIES DRAMATICALLY BY SCHOOL LEVEL
Female
Male
High schoolMiddle schoolElementary school
89%
11%
68%
32%
49%
51%
THE AVERAGE AGE OF TEACHERS IN THE SURVEY
ON AVERAGE, TEACHERS HAVE ABOUT
YEARS OF TEACHING EXPERIENCE
14
42.8
34% 29%
36%
Under 3535-4950 or older
33%
16%
25%
26%
0–3 years4–10 years11–20 yearsMore than 20 years
Note: Metro status, school size and median school income provided by MDR. All other information was self-reported by teachers in the survey.

A PORTRAIT OF AMERICA’S TEACHERS
94% OF TEACHERS TOLD US THEY HAVE FORMAL TEACHER CERTIFICATION,
WHILE 6% HAVE ALTERNATIVE CERTIFICATION.
17% OF NEW TEACHERS
(WITH 0-3 YEARS OF EXPERIENCE)
IDENTIFIED THEMSELVES AS HISPANIC,
AFRICAN AMERICAN OR OF ANOTHER
RACIAL/ETHNIC BACKGROUND VS.
ONLY 9% OF VETERAN TEACHERS
(WITH 21+ YEARS OF EXPERIENCE)
% OF TEACHERS WITH ALTERNATIVE CERTIFICATION BY YEARS OF EXPERIENCE
STATES WITH MORE THAN 10% OF TEACHERS ALTERNATELY CERTIFIED
TEACHER, SCHOOL AND CLASSROOM STATS BY SCHOOL METRO STATUS:
WHERE TEACHERS TEACH…
4-10 years
11-20 years
More than 20 years
0-3 years 14%
8%
3%
1%NHTX LA MS DE FL
14%
21%17%
13% 12% 11%
35% 27%
36%
Urban or city areaSuburban area Small town or rural area
URBAN SUBURBAN SMALL TOWN/RURAL
Hispanic, African American or other racial/ethnic background 22% 13% 8%
Have worked as a teacher for 0-3 years 19% 15% 14%
School household income is <$40,000 per year 39% 12% 29%
Have English Language Learners (ELL) in their class 75% 69% 53%
Note: Metro status, school size and median school income provided by MDR. All other information was self-reported by teachers in the survey.

A PORTRAIT OF AMERICA’S TEACHERS
25% OF TEACHERS TEACH IN
COMMUNITIES WITH A MEDIAN
HOUSEHOLD INCOME OF LESS THAN
$40,000, WHILE 17% TEACH
IN COMMUNITIES WITH A MEDIAN
HOUSEHOLD INCOMES OF
MORE THAN $70,000.
% OF TEACHERS WHO TEACH IN EACH TYPE OF COMMUNITY,
BY SCHOOL’S MEDIAN HOUSEHOLD INCOME:
SCHOOL SIZE BY SCHOOL METRO STATUS:
AVERAGE NUMBER OF STUDENTS IN TEACHERS’ SCHOOLS
(BY SCHOOL LEVEL)
OF TEACHERS SAID THEY HAVE ONE OR
MORE ENGLISH LANGUAGE LEARNERS
(ELL) IN THEIR CLASSROOM. THIS RISES
TO 95% OF TEACHERS IN CALIFORNIA, 77% IN TEXAS AND 75% IN FLORIDA.
65%
550768
1,443
URBAN SUBURBAN SMALL TOWN/RURAL
Fewer than 500 students 30% 27% 46%
500-999 students 44% 47% 39%
1,000 students or more 26% 26% 14%
Elementary School Middle School High School
In a small town or rural area
In a suburban area next to a city
In an urban or city area
<$40K $40K−$49.9K $50−$69.9K $70K+
17%
40%
41%
29%
40%
28%
45%
29%
23%
60%
24%
14%
Note: Metro status, school size and median school income provided by MDR. All other information was self-reported by teachers in the survey.

PRIMARY SOURCES is the beginning of an ongoing dialogue with America’s Teachers.
We welcome your thoughts and opinions on the report at www.scholastic.com/primarysources.