what’s wrong with my airsar data? · pdf filewhat’s wrong with my airsar data?...
TRANSCRIPT

What’s Wrong With My AIRSAR Data?
David A. Imel∗
Jet Propulsion Laboratory 300-2434800 Oak Grove Drive, Pasadena, CA 91109
AIRSAR Earth Science and Applications Workshop4–6 March 2002
1 Introduction
AIRSAR data sets can be contaminated with arti-facts or glitches: systematic phase or magnitude er-rors. These artifacts can come from instrument orsignal processing, or can be intrinsic to SAR datacollection. Some of these errors can be almost com-pletely corrected by post-processing, others cannot,and some are so severe that they can be a cause ofdata non-delivery. In this paper, I describe each ar-tifact and characterize its impact on the data qualityas well as the frequency of its occurrence in AIRSARdata sets.
1.1 Sources of Error
Just about any part of the instrument and processingoperation, if not functioning correctly, can lead toartifacts in the data. For example:
Antenna A mis-calibrated antenna pattern, an-tenna pattern with inadequate side-lobe suppres-sion, or damage to the antenna during the mis-sion. The latter can happen especially duringtakeoff and landing if there is debris on the run-way which can be kicked up by the aircraft tiresand shot towards the (exterior) antenna panels.
Cabling An improperly fastened cable can lead tounexpected variations in the antenna pattern,unexpected phase variations during the courseof a data acquisition campaign, or even swapped
channels. Even with properly fastened cables,the phase delay is temperature sensitive.
Receivers If the gain is set incorrectly, the data maybe saturated or buried in the noise. This mayhappen even for proper gain settings if there isa large variation of the backscatter brightness inthe scene being imaged. We use a calibrationtone injected into the receiver to monitor gainand phase stability, but extreme changes in gainor phase may not be correctable.
Transmitter Includes both the pulse generators,diode switches, RF multiplier stages and high-power amplifiers (whether solid-state, as in P-band, or travelling-wave tube amplifiers, as inC- and L-band). Typical failures in the pasthave included a diode switch (used to alter-nate between top and bottom antennas, verticaland horizontal polarizations, or aft and fore an-tennas) transmit being shorted to one position.This obviously leads to incorrect interferometric(or polarimetric) signatures. Errors in triggeringthe pulse generation will introduce phase errorsin the transmitted pulses, damaging or makingimpossible the formation of the synthetic aper-ture. Damaged (but not completely failed) com-ponents in the RF multiplier chain can lead toa loss of bandwidth, and thus a loss of resolu-tion and also incomplete pulse compression (in-creased ISLR).
Digital System Consisting of the analog-to-digitalconverters (ADC’s), their buffers, and the data
1
Imel, AIRSAR Data Problems 2
routing and recording system, most of the non-catastrophic errors introduced at this stage canbe corrected in software. For example, since thecaltone signal is routed through the ADC’s (aspart of the receiver video output) with a knownphase, any mis-triggering of the ADC’s is usu-ally correctable by calculating the time shift (insamples) required to alter the observed caltonephase. This is illustrated later in this paper. Er-rors in the buffer readout can cause the loss ofsome or all of an entire pulse. But since it takesthousands of pulses to form a synthetic aper-ture, the loss of any few pulses is usually not no-ticeable. The data recording system has built-inerror correction. If this error correction is over-whelmed, then entire blocks of data can be lost.This is more serious, but is observable duringdata acquisition. The AIRSAR system acquiresdata on two recorders simultaneously (one pri-mary, one redundant) to guard against this kindof data loss, as well as later media degredation.
Motion Monitoring System In synthetic aper-ture radar, the location of the phase center ofeach antenna must be known precisely in or-der reconstruct the “synthetic aperture” alonga straight reference path. The AIRSAR relieson a Honeywell Embedded GPS / Inertial Nav-igation Unit (Embedded GPS/INU, or “EGI”)to report both the position and attitude of theplatform at all times. The lever-arms, fixed inthe platform-fixed reference frame, are surveyedinitially, then fine-tuned during calibration post-processing. Errors in the position or attitude re-ported by the EGI translate into defocussing ofthe SAR image, radiometric errors, and in thecase of TOPSAR data, height errors. Moreover,misalignment of the time tagging of this plat-form state vector and the time tagging of theradar pulses will lead to the same kinds of prob-lems.
Algorithms There are approximations in the sig-nal processing algorithms used to generate thedata sets from the raw signal data and teleme-try. Some of these approximations break downwhen the “squint” of the system is too large (i.e.,
severe cross-winds lead to crabbing of the plat-form). Other approximations break down whenthe platform attitude is varying too rapidly, andby too much.
Calibration Errors in calibration can lead to radio-metric and height errors. These can be due ei-ther to anomalous calibration data sets, or hu-man error. The section on Misregistration in thispaper (Section 3.2) describes one such case.
Moreover, there are some kinds of “artifacts” whichare not truly errors in either instrument performanceor signal processing operations, but are related tothe nature of SAR data acquisition. These are alsodescribed, in Section 4 of this paper.
2 Instrument Data Glitches
The data artifacts described in this section are causedby incorrect functioning of the instrument hardware.The impact of these kinds of errors ranges from neg-ligible to causing non-delivery of a data set. Theartifacts are listed here roughly in order of decreas-ing severity. Note that some kinds of artifacts maybe more severe for certain applications, so that thisordering is not precise.
2.1 DCG Jitter
In order to form a good synthetic aperture, i.e., inorder to focus the imagery using the coherent phaseof each target as it passes through the radar antennabeam, the exact timing between each pulse must beknown. This is accomplished with the AIRSAR in-strument by locking both the pulse-transmit and thepulse-recording circuitry to a stable local oscillator(STALO). The frequency stability of the STALO en-sures that the phase of each return signal relative toeach transmit event, and of one transmit event withina synthetic aperture to any other transmit event, isknown.
During the PacRim 2000 data collection campaign,it was occasionally noticed that the timing of thetransmit pulses would go out of sync with the record-ing system, and with each other. The symptom of

Imel, AIRSAR Data Problems 3
this problem would be that the caltone phase fora given channel would cease to be constant. The“caltone” is a single frequency “tone” injected bythe pulse generator at the beginning of each receiverchain to monitor the gain and phase stability of thereceivers. Since the same tone is injected to moremore than one receive chain, if the phase jumps inboth receivers by the same amount, it is more likelythat the phase jump was caused at the source of thesignal, not at both receivers separately but simulta-neously. So far as we know, we detected this situa-tion in real-time whenever it occurred, and correctedthe problem before acquiring science data. How-ever, if this problem had not been detected and toomany pulses had been contaminated with an incor-rect transmit phase, it would be difficult or impossi-ble to focus the synthetic aperture image.
An example of this kind of problem is shown inFigure 1, where the phase of the C-band and L-bandpulses is occasionally wrong. Note that the C-bandand L-band pulses both have the wrong phase at thesame time. This eliminates the problem as being thatof the digital system or the receivers – it would betoo much of a coincidence for two different receiveor ADC channels to err on precisely the same pulses.The C-band and L-band radars share the same digitalchirp generator (DCG). Thus, when the trigger tim-ing on the DCG is wrong, it affects both the L-bandand the C-band data at the same time.
Name: DCG JitterImpact: Severe, can destroy imageCorrection: Not possibleOccurrence: None (detected and reflown
in real-time)Reprocessing: (N/A)
2.2 LH Receiver Phase Jump
During two of the data lines we acquired duringPacRim 2000, we observed a sudden jump in the L-band H-pol channel caltone phase. Since the phasejump occurred only in one channel, we know it wasnot the caltone signal itself, but the LH receive chain.
Figure 1: Caltone phase (in degrees) as a function ofpulse number. The L-band caltone phase (darker lines)is super-imposed over the C-band caltone phase (lighterlines). The signal for both C- and L-band caltone’s isgenerated by the same digital chirp generator. (P-banduses a separate DCG.) This plot shows a clear signatureof a “jittering” chirp-generator.

Imel, AIRSAR Data Problems 4
Once back in the lab, we were eventually able to re-produce this effect, which is strongly temperature-dependent. On the occasions we observed this dur-ing the mission, it seems that the instrument hadeither been shut down during a long transit and nothad sufficient warm-up time, or had been severely“cold-soaked” (in Alaska) the night before the dataacquisition flight. The source of the phase jump waseventually isolated to an amplifier, which has beenreplaced.
Meanwhile, for the data lines with the phase jump,we are processing the data on either side of the phasejump separately, and mosaicking the two pieces to-gether. If this were not done, then the L-band DEMgenerated from these data (XTI2 mode) would havea large discontinuity in height.
Name: LH Phase JumpImpact: Serious, must divide sceneCorrection: Via mosaicking or
new caltone algorithmOccurrence: Two datasets (so far)Reprocessing: (N/A)
2.3 CV Antenna Pattern CalibrationError
Unique to the Pacific Rim 2000 data acquisitioncampaign is an anomaly in the antenna pattern inthe POLSAR C-band V-pol receive channel. (Theanomaly does not appear in TOPSAR data, whichuses a different set of antennas and cables.) Darkbands (see Figure 2) appear at particular look anglesat each pulse along-track in the CVV (i.e., C-band,V-pol transmit, V-pol receive) image. For contrast,Figure 3 shows the same scene’s CHH channel image,which does not have this same banding. (There is asmall motion-related banding in both scenes which isdiscussed in subsection 3.4, below.) This banding ismost evident over very bright, uniform scenes, suchas that of the figures shown, and is more difficult todetect over typical scenes with a variety of vegetationtypes and topographic features—and also over darkscenes such as the Rosamond calibration site used forthe PacRim 2000 calibration.
Figure 2: AIRSAR C-band Polarimetric data acquiredover Fly River, Papua New Guinea, illustrating the an-tenna pattern calibration errors. This heavily forestedlocation is an almost uniform scattering scene. From leftto right: CHH channel, CVH channel and CVV channelfor the uncorrected Fly River scene. The platform flewfrom the top of the strips to the bottom; slant range in-creases to the right for these strips. See Figures 4 and 5for the difference of averaged profiles across these scenes.

Imel, AIRSAR Data Problems 5
Figure 3: The results of applying the CV-calibration cor-rection to the data of Figure 2 are shown here. From leftto right: CHH channel, CVH channel and CVV channelfor the corrected Fly River scene. Notice that the verticalbanding is much less pronounced for the CVH and CVVchannels in these data than that of Figure 2 The platformflew from the top of the strips to the bottom; slant rangeincreases to the right for these strips. See Figures 4 and 5for the difference of averaged profiles across these scenes.
Figure 4: Plot of the CVV/CHH ratio for the Fly Riverscene (Figures 2 and 3) before (solid curve) and after (dot-ted curve) correction for the CV-antenna pattern prob-lem.
The C-band POLSAR antenna pattern was mea-sured on the JPL antenna range just prior to thedeployment, and no anomalous antenna pattern suchas that seen in these data was noted. We believe thatthere may have been a problem with the cabling be-tween the C-band antenna and the aircraft bulkheadwhich went undetected during the radar upload andengineering checkout.
We have developed a correction for this anomaly,based on the observation that the anomaly appears tobe stable for all of the data sets analyzed for the Pa-cific Rim 2000 mission, including data sets acquiredboth at the beginning and the end of the deploy-ment. The size of the anomaly is shown in Figure 4,where the ratio of the CVV-return to that of theCHH-return is averaged over a thousand pulses for auniform scattering scene. The error introduced intothe radiometric calibration by this anomaly (prior tocorrection) is almost 2 dB. The anomaly has a smallereffect on the CVH channel, i.e., H-pol transmit andV-pol receive, predictably because only one “path”through the CV antenna chain is required for theCVH channel. The same correction curve is appliedto correct both CVV and CVH data—in the former

Imel, AIRSAR Data Problems 6
Figure 5: Plot of the CVH/CHH ratio for the Fly Riverscene (Figures 2 and 3) before (solid curve) and after (dot-ted curve) correction for the CV-antenna pattern prob-lem.
case, the correction is applied twice.Starting with version 6.34 of the AIRSAR inte-
grated processor, POLSAR data will be deliveredwith the CV-anomaly correction applied. Data de-livered with earlier versions of the processor do nothave the correction applied, but can be re-processedif requested by investigators. The correction is com-plicated by the fact that the anomaly is a function oflook angle which is not accurately known in the caseof POLSAR data, since the determination of the lookangle requires knowledge of the target location—onlyobtainable in the TOPSAR mode. POLSAR dataare processed using an elevation reference on whichall scatterers are assumed to lie. This elevation refer-ence can be used to obtain an approximate look angle,but depending upon the actual topography, the lookangle can be incorrect by as much as a few degrees.The implementation of the CV-anomaly correction1
correlates the observed CVV/CHH ratio against thetemplate correction measured for the mission at every
1“POLSAR-CV antenna path anomaly in PacRim 2000deployment”, by Yunling Lou, AIRSAR Internal memo.Available on docushare at http://eis-lib.jpl.nasa.gov/eis-lib/dscgi/ds.py/Get/File-16961/CV ant anomaly 2000.pdf.
block of 600 pulses in a scene, allowing the locationof the match to vary by a few2 degrees of look anglein order to find the best match.
Name: CV Pattern ErrorImpact: ≤ 2 dB Radiometric ErrorCorrection: New correction availableOccurrence: Every POLSAR data setReprocessing: By request for data from
AIPT Version ≤ 6.34
2.4 ADC Jitter
Occasionally, our analog-to-digital converters(ADC’s) trigger a pulse either one sample late orone sample early, or drop a sample at the beginningof a pulse when the data a read out to data storage.When this happens, the phase of the entire pulse isaltered by the missing or extra time correspondingto the number of samples either removed or added,respectively.
We can write that the samples in the frequencydomain for a single calibration “tone” are given by:
gj =N∑
k=0
fke2πijkl/N , (1)
i.e., g is the z-transform of f . For the examples in Fig-ure 6 and 7), the sampling frequency is Fs = 90 MHzand the calibration tone frequecy Fc = 43.5 MHz.A shift by one sample in the time-domain leads to aphase-ramp in the frequency domain, i.e., a changein phase at each frequency sample given by:
g′j =N∑
k=0
fke2πij(k+1)l/N = e2πij/Ngj . (2)
A one-sample shift corresponds to a change inphase at the AIRSAR caltone frequency of 2π ×(43.5 MHz/90 MHz), or about 174 degrees. An ex-ample of this shift is given in Figure 6. Similarly, a
2Total variation for the scene, that is. The variation allowedfrom one patch to the next is much less, to enforce continu-ity and minimize the possibility of introducing artificial patchboundaries from the correction.

Imel, AIRSAR Data Problems 7
Figure 6: Phase of a single-frequency “caltone” in theL-band VV-pol receive channel. The phase jumps corre-spond to a shift of one sample. The vertical scale is indegrees of phase and the horizontal scale is pulse number.
two-sample shift corresponds to 348 degrees of phase,which “wraps” to −12 degrees. This is illustrated inFigure 7.
Fortunately, this artifact is pretty well understood(though not well-enough to prevent it from ever hap-pening at the source!), readily detected and easilycorrected. Once corrected, it has no impact on ourability to process or deliver data, and also no impacton the data quality.
Name: ADC JitterImpact: Serious, can defocus imageCorrection: Automated detect/correctOccurrence: OccasionalReprocessing: (N/A)
2.5 Geo-location Errors
For TOPSAR data, the three-dimensional coordinateof each pixel is given by knowledge of the positionvector of the radar platform and antenna phase cen-ters at the time each pixel was imaged as well as the
Figure 7: Phase of a single-frequency “caltone” in theL-band HV-pol receive channel. The phase jumps corre-spond to a shift of two samples. The vertical scale is indegrees of phase and the horizontal scale is pulse number.
vector from the platform to the pixel. The latter isgiven for an interferometric SAR by range (from tim-ing the return), azimuth angle (from the Doppler his-tory of the targets in the pixel) and elevation (usingthe interferometric phase difference). The positionvector of the antenna phase centers is obtained forthe AIRSAR system with an embedded GPS and in-ertial navigation unit (INU) system, or EGI, whichgives the position of the EGI within the aircraft andmonitors the attitude of the platform: roll, pitch andyaw. The lever arms from the EGI to the antennaphase centers are first surveyed, then fine-tuned dur-ing calibration.
The EGI has an absolute spherical position ac-curacy of about 15 meters under nominal condi-tions. There are some conditions under which thesphere can increase substantially: for example, dur-ing PacRim 2000 we observed a loss of GPS lock, anda subsequent worsening of the EGI ”Figure of Merit(FOM)” which indicates the absolute position accu-racy, when the aircraft would undergo a tight turn,with a roll angle of greater than about 25 degrees.
Imel, AIRSAR Data Problems 8
We tried to avoid this as much as possible. However,data acquisition lines which took us to internationalborders and occasional redirection by air-traffic con-trol sometimes made these turns unavoidable.
During PacRim 2000, we acquired GPS data with a12-channel Ashtek receiver, which with one exceptionduring the entire three-month deployment never lostlock. These data are being merged with the EGI posi-tion data in the hopes of improving the position accu-racy of the combined sensor. Meanwhile, we have alsoimplemented a post-processing geo-location check foreach TOPSAR data set. In cases where there is sig-nificant geo-location error (i.e., greater than 30 me-ters), the absolute location of the data are shiftedappropriately, re-processed, and the correction con-firmed with a final geo-location check. This shiftonly involves changing the peg-point location (lati-tude and longitude) in the data headers, and doesnot involve changing any of the magnitude or phasedata.
Name: Geo-locationImpact: SignificantCorrection: Straightforward if detectedOccurrence: Frequent, especially when
EGI shows poor FOMReprocessing: By request
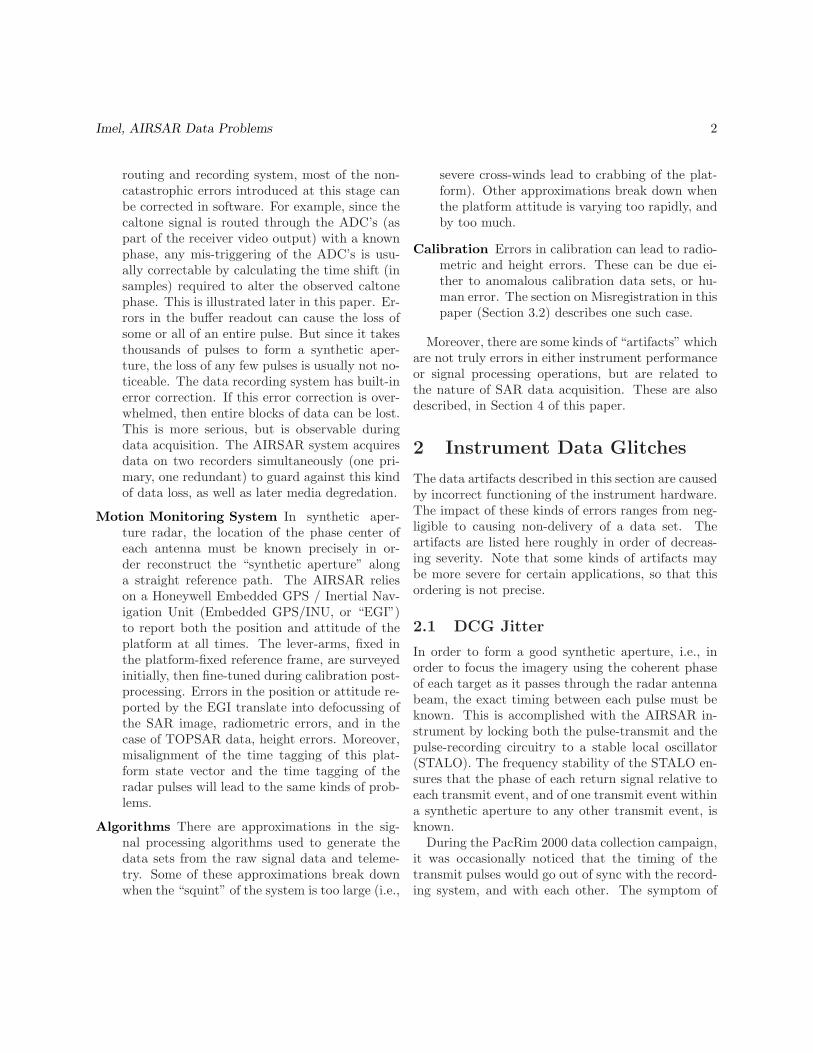
2.6 Digital Artifacts in the Raw Sig-nal Data
There are “digital artifacts” which are introducedinto the raw signal data from time to time. Themost common artifacts are pulses, or parts of pulses,which have been filled in with zeroes instead of theproper byte value corresponding to the voltage ob-served by the receiver. Other artifacts include shortsnippets of digital-data. In either case, these artifactshave a byte-value histogram lying far outside the nor-mal histogram of values for the radar scene, and thushave an average power far exceeding the scene. If notcorrected, this “digital noise” is multiplied by boththe range-compression function and the azimuth ref-erence function during image formation, contaminat-ing a portion of the radar image corresponding to the
Figure 8: Example of the effect of uncorrected digitalartifacts in an AIRSAR C-band along-track interferogramacquired over the Rosamond dry lake bed (the AIRSARcalibration site).
pulse-duration (in range) and the synthetic aperture(along-track). This is illustrated in Figure 8.
Because the power spectrum of the “digital noise”is different than that of the radar scenery, we havebeen able to develop a signal processing filter forthis noise. At first, we checked pulse-by-pulse witha median filter whose level was set by the brightnessin the scene. Any pulse with a significantly largerpower than the other pulses within the window ofthe filter was replaced with a copy of the preceedingpulse. This algorithm was later optimized by track-ing the pulse in n separate segments, since the returnin the near range is much stronger than that in thefar range, and the digital noise was sometimes con-fined to only one part of the pulse. (The entire pulseis replaced even if only one part of the pulse is con-taminated.) We have found that n = 3 seems to doan adequate job of eliminating this digital noise. Afurther refinement would be to replace the pulses (oreven, just pulse segments) with random noise of thelevel appropriate to the radar scene, rather than du-plicating the previous pulse. However, at the rates ofcontamination we observe (0.1% is typical) the dif-ference is not significant.
The contamination does involve loss of informa-tion, but has so far been an insignificant fraction ofthe total data. As long as the digital noise is detectedand eliminated, there is no impact of this artifact ondata quality.

Imel, AIRSAR Data Problems 9
Name: Digital NoiseImpact: Minimal after correctionCorrection: Automated detect/filterOccurrence: About 0.1% of all pulsesReprocessing: (N/A)
3 Signal Processing Errors
The errors listed in this section come from imperfectsignal processing. In some cases, the errors are due toactual bugs in the processing software which have yetto be corrected, in other cases, the errors come fromlimitations or unwarranted approximations made bythe signal processing algorithms. This section alsoincludes calibration errors or uncertainties.
3.1 Phase Bars
An artifact afflicting five of the PacRim 2000 TOP-SAR data sets processed so far has been labelled,“phase bars”. The problem is not yet completely un-derstood. The symptoms are: small segments (alongtrack) of incorrect interferometric phase which extendacross most or all of the slant range. These segments,or bars, occur at patch boundaries. The AIRSARprocessor is a “patch processor”, meaning that therange-compressed data are brought into a buffer acertain number of along-track pulses at a time, e.g.,at least twice the longest synthetic aperture lengthused, and azimuth compression is performed on thedata in the buffer. A portion of the resulting im-age in the buffer (a patch) is written out, and thebuffer is re-filled with new data for the next patch.The patches are then joined together to make the fullsingle-look complex SAR image.
We have found that we can reduce, or even elim-inate, these “patch bars” by decreasing the azimuthreference length used for azimuth compression. Thisis the same procedure used to decrease the impact ofazimuth ambiguities. The decreased azimuth refer-ence length means that the intrinsic azimuth resolu-tion is worsened. Obviously, this interim “fix” is notsatisfying. It sems likely that there is some sort of
Figure 9: Portion of a C-band DEM showing the coast ofWest Samoa. The “phase bars” are the horizontal streaksof phase which are most visible as they extend off of thecoast. These bars actually extend all the way across theland in this scene, but are difficult to make out visuallyover land. Here, the platform is moving from top to bot-tom of the scene, and the range increases to the right.
software problem in the azimuth compression mod-ule of the processor having to do with array boundsbeing exceeded. Our initial investigations have notbeen successful in pinning down the source of thisproblem, but we are still working on it. Figures 9and 10 illustrate the problem and the workaround,respectively.
Name: Phase BarsImpact: SmallCorrection: By decreasing az. res.Occurrence: Two datasets so farReprocessing: (N/A)

Imel, AIRSAR Data Problems 10
Figure 10: The same scene as Figure 9, where the az-imuth bandwidth has been reduced, worsening the az-imuth resolution but also greatly reducing the “phasebar” contamination.
3.2 Misregistration
An error in the range-delay for the L-band and P-band 40 MHz data calibration led to a inter-frequencyco-registration error: in pre-corrected 40 MHz POL-SAR data, there is a slant range offset betweenthe C-band and L-band data sets of about 1 pixel,and between C-band and P-band, 4 pixels. ThePacRim 2000 40 MHz POLSAR data sets were eas-ily corrected by applying the appropriate shift in theslant range.
This error also affected TOPSAR data sets. How-ever, in this case, the correction is more complicated.Because the error was made in the slant-range, theoffset projected onto the ground for TOPSAR datais not a constant shift. Thus, the P-band data (forXTI2 and XTI2P acquisition modes) and both L-band and P-band data (for XTI1 and XTI1P acqui-sition modes) had to be re-processed with the cor-rection to the slant range and then re-projected ontothe ground. In the process, we discovered that therewas often a small misregistration error for TOPSARdata even after the proper slant-range calibration hadbeen made. This is probably due to limitations inthe accuracy of the motion-compensation correction.Since the L-band, P-band and C-band antennas areall located in different places on the fuselage, anymotion-compensation approximation can affect thethree radars differently, leading to a misregistrationamong them.
In order to ensure that all TOPSAR data are cor-rectly registered, an automated co-registration pro-gram3 is now used to detect TOPSAR misregistrationbetween radar bands in the slant-range intermediateproducts, apply any necessary range-correction to allof the P-band (and L-band in the case of XTI1 andXTI1P) data, reprocess and re-check the registration.
The re-processing and re-delivery of data sets af-fected by the misregistration error is now complete.All data sets are now automatically checked to detectany possible multi-frequency registration error.
3Built on Scott Hensley’s ubiquitous “magcor” program,which finds the appropriate shift between two real-valued im-ages.

Imel, AIRSAR Data Problems 11
Name: MisregistrationImpact: L-band: 1 pixel
P-band: 4 pixelsCorrection: Automated detect/correctOccurrence: ≤ 6.32 AIPT VersionReprocessing: Completed
3.3 Patch-boundaries
As described in Section 3.1, the AIRSAR IntegratedProcessor (AIPT) is a patch-based processing sys-tem. This has the advantage that it can handle largersections of data than can fit in memory all at once,but has the disadvantage that these patches haveto be sewn together to form the final image. Thepatch boundaries are typically not completely seem-less. This can be due to many factors. For example,during image formation, the squint (i.e., the dopplercentroid determined by the yaw and pitch of the plat-form) is determined for each patch and used to de-termine the look angle and, for TOPSAR data, thebaseline. If the platform attitude is varying rapidly,then the approximation that the attitude is constantduring a synthetic aperture will fail. This is illus-trated in Figure 11, where the height correspondingto a full color-wrap is greatly exaggerated in orderto display the patch boundary discontinuities. Thediscontinuities are quantified in Figure 12, and showthat in this case their magnitude can be as large as1 meter across the patch transition. Obviously, theseare only noticeable in very flat terrain, which is whythis Angkor, Cambodia scene was chosen to highlightthe artifact.
At the Jet Propulsion Laboratory, new processingtechnology is becoming available4 which may allowa reduction in the magnitude of the patch-boundarydiscontinuities.
4Improved Processing for AIRSAR Data Based on theGeoSAR Processor, by Scott Hensley, Elaine Chapin, andThierry Michel, elsewhere in this workshop proceedings.
Figure 11: Patch Boundary Discontinuities in theAngkor, Cambodia C-band digital elevation model. Here,the height wrap has been increased to 5 meters in orderto highlight the artifacts. The artifacts are the roughlyhorizontal discontinuities in the color coding of the im-age. (The multipath effects are the seen as well as thesmoothly-varying vertical bands.)

Imel, AIRSAR Data Problems 12
Figure 12: Vertical cut through the C-band DEM of Fig-ure 11. The red curve is a smoothed version, highlightingthe size of the patch boundary discontinuities.
Name: Patch boundariesImpact: Minor height errorsCorrection: Not availableOccurrence: TOPSAR dataReprocessing: No
3.4 Motion Compensation Errors
Motion-compensation errors can arise from either er-rors in the knowledge of the aircraft position andattitude, (necessary) approximations in the motion-compensation correction algorithms, or platform mo-tion that varies too rapidly. In the latter case, just asin the section above, the assumption that the squintfor each patch is constant breaks down, and a ra-diometric error can be introduced. An example ofthis situation is plotted in Figure 13, where an aver-age across all ranges has been calculated for the veryuniform scatterer brightness Fly River scene shownin Figure 2, and the mean subtracted, for each point
Figure 13: Vertical profile through the CHH scene of Fig-ure 2, showing the amplitude variation due to imperfectcompensation for position of the antenna phase centers asthe platform’s position and attitude varies from a perfect“reference path”.
along-track. The undulating variations are due notto intrinsic scatter brightness variations but are dueto calibration errors introduced by the breakdown ofthe signal processing algorithm’s ability to deal with arapidly-varying platform attitude. The cross-sectionerrors can be seen to be as much as 0.5 dB peak-to-peak in this case.
Name: Mocomp ErrorsImpact: ≤ 0.5 dB radiometric errorsCorrection: Not currently availableOccurrence: During severe platform motionReprocessing: (N/A)
3.5 Annotation Errors
These kinds of errors are not data artifacts in thatthey do not actually affect data quality. However,for some kinds of analyses by investigators, incor-rect data annotation can lead to incorrect analysis.The most recent error of this sort occurred when weexpanded the potential number of range samples in

Imel, AIRSAR Data Problems 13
an output image. The radiometric correction vector,which is included in the header data had a hard-codedlength (version 6.31 of the processor). We correctedthis problem to provide the full radiometric correc-tion vector (version 6.32) but then found that somecommercial software used for AIRSAR data analy-sis (ENVI) assumed the radiometric correction vectorlength, and actually crashed when fed data wih theproper vector embedded in the header. Therefore wereturned the correction vector to its previous lengthbut also wrote a separate file with the full correctionvector (version 6.33). None of this had any effecton the polarimetric data themselves, but could affectcertain kinds of post-processing analysis of the data.
Name: Annotation ErrorsImpact: Post-procesing analysesCorrection: Separate files providedOccurrence: All data setsReprocessing: (N/A)
4 Intrinsic Artifacts
These contaminants to AIRSAR data sets come fromthe nature of SAR itself or from the environment inwhich the data are acquired. They are not truly “er-rors”, in the sense that the instrument and the signalprocessing algorithms may be working perfectly, andthe data will still have these kinds of artifacts.
4.1 Radio-Frequency Interference
AIRSAR P-band data is especially susceptibleto radio-frequency interference (RFI) from airportradars and various kinds of telecommunications, usu-ally associated with urban environments. An exam-ple of this kind of interference can be found in Fig-ure 14, where the P-band total power is display in red,LVV in green and CVV in blue. The RFI shows upas red streaks at particular along-track (slow-time)coordinates.
Typically, the RFI contamination appears to bemore prominent in the far range. This is due to theway the SAR processor interprets the data: for any
Figure 14: Example of a dataset (Rotorua, NZ) withP-band RFI contamination. Range increases towards theright in both images, while the platform is travelling fromtop to bottom. Total P-band power is in red, CVV in blueand LVV in green. On the left is the data set before RFIfiltering and on the right, after. The red-streaks on theleft are the clear RFI signature in this scene.

Imel, AIRSAR Data Problems 14
Figure 15: Spectrum for p-band VV-pol channel in theRotorua, New Zealand scene. Even after filtering toremove radio-frequency interference, there is significantresidual contamination in the frequency spectrum whichis not, however, evident in the imagery.
given pulse, signals at earlier times are assumed tocome from a nearer range, while later times corre-spond to the farther range in the data swath. Thus,when the range correction is applied, signals from far-ther away are amplified to compensate for the 1/r3
losses. However, the timing of the RFI signals isusually not5 correlated with the pulse timing. Thismeans that the RFI signals which happen to fall intothe far range are amplified by the SAR processormuch more than signals which fall into the near range.
In order to compensate for radio-frequency inter-ference, we have incorporated the algorithm devel-oped by Scott Hensley and Charles Le6 The morerecent versions of this filter can go a long way to-wards reducing (though not eliminating, see Fig-ure 15) the RFI-contamination in the scenes, with rel-atively small impact to the overall calibration. Nev-ertheless, there is usually some small overall changein the relative brightness of the different P-band po-larimetric channels, as can be seen in Figures 16–18.Therefore, when the RFI-filter is applied, we deliverboth the filtered and the unfiltered data sets.
5We have occasionally observed a “lock-on” by radar instal-lations, in which case the timing can be quite correlated.
6RFI Removal from AIRSAR Polarimetric Data, by CharlesLe and Scott Hensley, elsewhere in the proceedings of thisworkshop.
Figure 16: The original PVV image from a data setcollected over Rotorua, New Zealand, during the Pa-cific Rim 2000 campaign. Radio-frequency contaminationcan be seen as approximately horizontal bright streaksacross the image.

Imel, AIRSAR Data Problems 15
Figure 17: The PVV image of Figure 16, after filteringfor RFI. In this case, the RFI removal has done a good jobof removing most of the visual contamination, but mayhave changed the overall calibration—See Figure 18. Figure 18: P-band polarimetric image for the Rotorua,
New Zealand scene: PVV brightness is in red, PHV ingreen, and PHH in blue. On the left is the original im-age, and on the right, the image after RFI-filtering. Thefiltering has removed most of the obvious contamination,but has also changed the overall ratio of PVV to PHH inthe scene.

Imel, AIRSAR Data Problems 16
Name: RFIImpact: Usually P-band only; can
destroy P-band cal.Correction: Via RFI-filteringOccurrence: Near populated
areas and airportsReprocessing: (N/A)
4.2 Multi-path
When TOPSAR data are acquired, the phase differ-ence between the top and bottom antennas of theinterferometric pair are used to calculate the eleva-tion angle of the scattering center in each pixel. Thebaseline at each point along the platform’s path is re-constructed, given the record of the platform attitudeand knowledge of the antenna phase center positionsin the platform-fixed coordinate system. The inter-ferometric phase is due to the difference in the pathsbetween the pixel scattering center and each antennaphase center:
Φ = 2πd/λ, (3)
where d is the path difference, λ is the radar wave-length and Φ is the interferometric phase. In the ab-sence of contamination by multipath or switch leak-age, this path difference is:
d = pn · B (4)
where n is a unit vector in the look direction fromthe radar to the pixel, B is the vector from one an-tenna phase center to the other (the “baseline vec-tor”), p = 1 for “common-transmitter” mode whereonly one antenna is used to transmit, and p = 2(so-called “baseline doubling“) for “ping-pong” modewhere transmit alternates from each antenna.
Now, if a multi-path signal is present, say from sig-nals returning from the scattering scene which bounceoff of a wing or an engine before arriving at the re-ceive antenna, then some fraction of the signal will bepresent with an interferometric phase correspondingto
d′ = n · B′ + lm (5)
where d′ is the path length travelled by the multi-path signal, B′ is the baseline between the transmit
antenna and the source of the multipath (wing orengine) and lm is the distance between the multi-path source and the receive antenna. To compute thephase actually measured by the system, one wouldhave to sum over all such possible paths, scaling thecontributions by the relative scattering cross sectionsof each source of multipath. This is a difficult prob-lem, and one not attempted here.
Nevertheless, the result of having a signal contri-bution from a baseline other than the expected oneis that there will be height variations with range notcorresponding to the scattering topography.
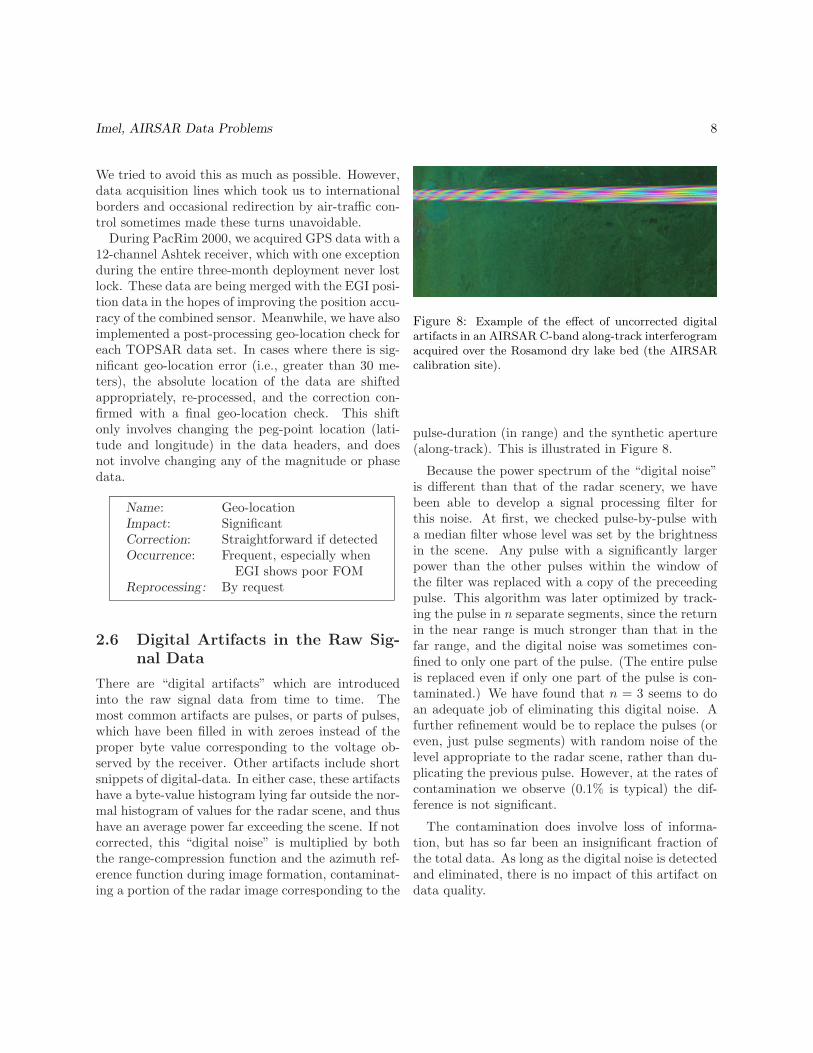
Figures 19–21 illustrate this effect as observed ina data set acquired over Angkor, Cambodia. Thisarea is especially good for highlighting multipath er-rors because it is very flat. In Figure 21, the ef-fect was quantified by taking the first few kilometersof the scene, making a horizontal slice through theDEM, subtracting the mean elevation, and averagingthis operation along-track. The multipath errors herevary from close to zero to as much as ±3 meters.
We are examining whether or not this multipathpattern is stable over the course of a deployment. Itmay be only a function of look angle. If so, it may bepossible to apply a correction to reduce this sourceof error. However, it could conceivably be a functionof more complicated variables such as fuel loading ofthe aircraft, altitude and airspeed, in which case anaccurate correction will be very difficult.
Name: MultipathImpact: Small height errorsCorrection: Not available yetOccurrence: All TOPSAR data, but
impacts flat areas mostReprocessing: (N/A)
4.3 Unwrapping Problems
The interferometric phase is only observed modulo2π. The process of phase-unwrapping allows the re-construction of the absolute phase difference7 and
7—to within one global ambiguous number of of 2π’s, whichcan be obtained if any single height in the scene is known.

Imel, AIRSAR Data Problems 17
Figure 19: Multipath effects on a TOPSAR C-band dig-ital elevation model (DEM). The purple, roughly verticalbands, or fingers extending from the bottom of the scenetowards the top, are the multipath height errors in thisscene. They show up most clearly in very flat areas, suchas the top of this scene, and disappear (visually) in signif-icant relief, such as near the bottom. A full color wrap inthis image corresponds to 100 meters of height variation.
Figure 20: Detail of the upper part of the scene shownin Figure 19 in the region where the plot in Figure 21has been generated. The alternating bands of purple andblue, corresponding to a meter or two of topography, aredue not to the terrain, which is flat, but to multipathcontamination of the interferometric phase.
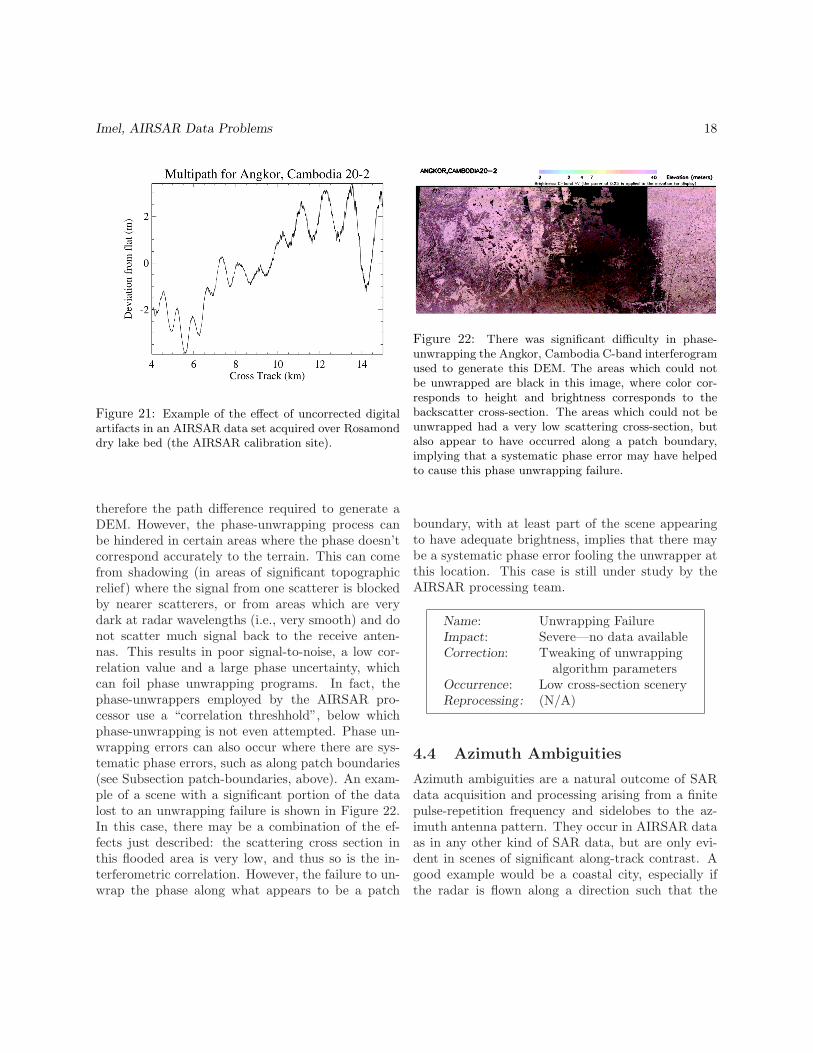
Imel, AIRSAR Data Problems 18
Figure 21: Example of the effect of uncorrected digitalartifacts in an AIRSAR data set acquired over Rosamonddry lake bed (the AIRSAR calibration site).
therefore the path difference required to generate aDEM. However, the phase-unwrapping process canbe hindered in certain areas where the phase doesn’tcorrespond accurately to the terrain. This can comefrom shadowing (in areas of significant topographicrelief) where the signal from one scatterer is blockedby nearer scatterers, or from areas which are verydark at radar wavelengths (i.e., very smooth) and donot scatter much signal back to the receive anten-nas. This results in poor signal-to-noise, a low cor-relation value and a large phase uncertainty, whichcan foil phase unwrapping programs. In fact, thephase-unwrappers employed by the AIRSAR pro-cessor use a “correlation threshhold”, below whichphase-unwrapping is not even attempted. Phase un-wrapping errors can also occur where there are sys-tematic phase errors, such as along patch boundaries(see Subsection patch-boundaries, above). An exam-ple of a scene with a significant portion of the datalost to an unwrapping failure is shown in Figure 22.In this case, there may be a combination of the ef-fects just described: the scattering cross section inthis flooded area is very low, and thus so is the in-terferometric correlation. However, the failure to un-wrap the phase along what appears to be a patch
Figure 22: There was significant difficulty in phase-unwrapping the Angkor, Cambodia C-band interferogramused to generate this DEM. The areas which could notbe unwrapped are black in this image, where color cor-responds to height and brightness corresponds to thebackscatter cross-section. The areas which could not beunwrapped had a very low scattering cross-section, butalso appear to have occurred along a patch boundary,implying that a systematic phase error may have helpedto cause this phase unwrapping failure.
boundary, with at least part of the scene appearingto have adequate brightness, implies that there maybe a systematic phase error fooling the unwrapper atthis location. This case is still under study by theAIRSAR processing team.
Name: Unwrapping FailureImpact: Severe—no data availableCorrection: Tweaking of unwrapping
algorithm parametersOccurrence: Low cross-section sceneryReprocessing: (N/A)
4.4 Azimuth Ambiguities
Azimuth ambiguities are a natural outcome of SARdata acquisition and processing arising from a finitepulse-repetition frequency and sidelobes to the az-imuth antenna pattern. They occur in AIRSAR dataas in any other kind of SAR data, but are only evi-dent in scenes of significant along-track contrast. Agood example would be a coastal city, especially ifthe radar is flown along a direction such that the

Imel, AIRSAR Data Problems 19
Figure 23: Multi-frequency polarimetric data collectedover the AIRSAR calibration site at Rosamond dry lakebed: P-band total power is in red, L-band in green and C-band in blue. The bright targets with large side-lobes dis-tributed in a line from the left lower-center to the lower-right corner are corner reflectors. The small red dots lo-cated about one-quarter of the scene above and just tothe right of each corner reflector are azimuth ambiguouscorner-reflector responses.
sidelobes image the city perpendicular to the streetsin the city, giving rise to very bright “double-bounce”returns for the side-lobes. An example of this isshown in Figure 24 at the beginning of the data lineover Mt. Fuji, Japan. Azimuth ambiguities can usu-ally be reduced by decreasing the azimuth referencefunction (the synthetic aperture) used to form theimage. However, this also means worsening the az-imuth resolution of the data. Typically, if we feel itis necessary to reduce the azimuth resolution, bothbefore- and after-reduction sets of data are delivered.
Name: Azimuth AmbiguitiesImpact: “ghost images”
(−13 to −20 dB)Correction: Reduce azimuth resolutionOccurrence: High contrast areas
(coastline)Reprocessing: By request
Figure 24: Coastal scene (MtFuji180-1) displaying par-ticularly severe effects of azimuth ambiguity noise as thefirst sidelobe of the C-band azimuth antenna pattern linesup perpendicular to the city streets along a section of thecurving coastline. The upper image shows the azimuthambiguities and noise at the normal processing resolution.In the lower image, the azimuth bandwidth has been re-duced by 40%. The degradation in azimuth resolution isapparent, as well as some reduction in the azimuth am-biguity noise.

Imel, AIRSAR Data Problems 20
4.5 Cross-Talk Removal Failure
One of the steps in the AIRSAR polarimetric pro-cessor is “cross-talk removal”, where compensation8
for any polarimetric leakage is applied to the cross-polarized channels. For each polarimetric scene ac-quired, a single correction which is a function of rangeonly is applied. However, this correction relies onsome minimal signal-to-noise ratio (SNR) in orderto function correctly. In situations where the SNRis poor at a particular range everywhere along-track,the cross-talk removal algorithm can be fooled. (Basi-cally, there is no true cross-polarization signal—onlynoise remains in the data for these cases.) Such acase is shown in Figure 25, where the near-range isocean everywhere in the scene, and the correction isin error. In cases like these, operator interventionis required to avoid making the correction over thespecific low-SNR areas.
Name: Cross-Talk RemovalImpact: Local radiometric cal. errorsCorrection: “by hand”Occurrence: Mixed ocean/land scenesReprocessing: By request
4.6 Uncompensated Topography
In along-track interferometry (ATI) data, the phaseis interpreted as motion in of the scatterers in eachpixel, rather than topography. But in fact, since thealong-track baseline usually includes at least a smallcross-track component, any topography in the scenewill lead to a phase signature even for stationary scat-terers. This phase signature arises in the context ofmotion compensation, where a constant elevation ref-erence is used in order to correct the phases receivedat the actual antenna phase centers to those whichwould have been received at the reference track. Inorder to make this correction, the location of the scat-terers must be assumed; therefore a reference eleva-tion is chosen. In general, for ATI data, sea-level is
8“Calibration of Polarimetric Radar Images Using OnlyImage Parameters and Trihedral Corner Reflectors”, byJakob J. Van Zyl, IEEE Transactions on Geoscience and Re-mote Sensing , 28, No. 3, May 1990, pp. 337–348.
Figure 25: Example (Savaii293-1) where the cross-talkremoval algorithm has obtained an incorrect result for theHV-pol scene in the near range due to low signal-to-noise.The failure is highlighted by the bright near-range (leftside) streaking. The implication is that all of the signalover the ocean in the near range for the cross-pol channelis cross-talk noise. The cross-pol terms in the scatteringmatrix here are below the AIRSAR noise threshhold.

Imel, AIRSAR Data Problems 21
Figure 26: C-band along-track interferogram showinguncompensated phase signatures over significant relief.
a good choice for this reference elevation. However,many ATI scenes also have land in the scene. (Infact, land is helpful to obtain the absolute phase, orthe absolute velocity offset.) The phase error intro-duced for scatterers located away from the elevationreference is given by:
∆φ =4πbzh
λr, (6)
where bz is the vertical component of the baseline, his the height difference between the scatterer and theelevation reference, λ is the wavelength, and r is therange to the scatterer.
This effect is illustrated in Figure 26, a C-bandinterferogram of San Francisco Bay showing theGolden Gate Bridge and the hills beyond. The topog-raphy in the hills is as much as a few hundred metersaway from sea-level. For PacRim 2000, all ATI datawere collected in the ”common-transmitter” mode,i.e., always transmit aft, and receive both aft andforward antennas. For these data, using (6), a full360 degrees of phase error occurs when the deviationof the topography from the elevation reference (sea-level) is:
C-band 800-1300 mL-band 6600-10000 m
where no pitch has been assumed in the C-band case,while the L-band case corresponds to one degree ofpitch. (bz comes strictly from platform attitude inthe case of L-band, while there is a “built-in” C-bandvertical baseline in ATI mode.)
Although the topography is not compensated inthe ATI processor, the effect on ocean scenes shouldbe negligible. If (6) is used, assuming a 10 m signif-icant wave-height, then the velocity error introduceddue to the vertical component of the baseline is:
C-band 5–7 degreesL-band < 0.5 degree
These errors are similar in magnitude to the uncer-tainty in the ATI velocity measurement due to thesignal-to-noise ratio of the system.
Name: ATI TopographyImpact: Negligible for ocean currentsCorrection: Not implementedOccurrence: ATI with targets at height
far from referenceReprocessing: (N/A)
5 Summary and Outlook
We have described here most of the data prob-lems which we observe in recent AIRSAR data sets,especially those collected during the PacRim 2000mission. In most of these cases, there are signal-processing workarounds which allow us to process anddeliver these data sets. However, ideally, we wouldlike to address these data problems at the source. Thefollowing is a summary of the steps we are taking toaddress these data problems.
5.1 New Digital Chirp Generators
As mentioned in the previous section, errors in thetiming of the chirp generation can be fatal to dataacquisition. Therefore, immediately upon our returnfrom the PacRim 2000 deployment, we began to buildnew digital chirp generators. These will have muchcleaner timing distribution, which should prevent thekinds of errors we saw during PacRim 2000. The newDCG’s are being used during the AirSci’02 data ac-quisition campaign. These have the added advantagethat we have built extras, which can not only be usedas ”in-flight spares”, but can be used to indepently

Imel, AIRSAR Data Problems 22
control all three (or more) radars, once the appro-priate additional RF stage is built. This will allowus to use completely independent chirps for the threeradars, for example, 80 MHz at L-band, 40 MHz atC-band, and 20 MHz at P-band. Currently, the C-band radar must be turned off when we transmit an80 MHz chirp for the high-resolution L-band mode.Finally, the DGS’s are VME-based, allowing us tofurther miniaturize the radar system. (The previousDCG’s were rack-mounted.)
5.2 New Digital System
AIRSAR is building a new digital system in order tosupport the high-data rates desired for the OpticalCommunication experiment9. The higher data rateswill also be a boon to AIRSAR investigators, sincethe current system is data-rate limited. Some of thecurrent components of the AIRSAR digital systemare over 15 years old; others which are newer werenevertheless uneasily integrated with the older com-ponents. The new system will be a coherent whole,including an integrated COTS ADC and data record-ing system. We anticipate that the “digital noise” de-scribed in this paper will be greatly reduced or elim-inated with the advent of this new system.
5.3 New P-band Transmitter
Starting with the AirSci’02 data acquisition cam-paign (IceSAR), AIRSAR is deploying a new P-bandtransmitter. The radiated power in the new systemis 3 dB more than that of the old. We anticipatethat the combination of a significant increase in P-band signal-to-noise, combined with continued im-provements in the RFI-rejection filtering10 will re-duce, though certainly not eliminate, the impact ofRFI contamination of AIRSAR data.
9Rapid-Response Disaster Management DemonstrationsUsing In-flight Laser Downlinks of AIRSAR Data: Currentand Future Plans, by David Pieri, elsewhere in the proceed-ings of this workshop.
10RFI Removal from AIRSAR Polarimetric Data, by CharlesLe and Scott Hensley, elsewhere in the proceedings of thisworkshop.
5.4 Improved Motion Sensing
One of the operational difficulties during thePacRim 2000 mission was the embedded GPS-INU(EGI) which seemed to have trouble integrating theGPS and inertia data to produce accurate positionand attitude information. After PacRim 2000 wasconcluded, Honeywell engineers uploaded a newerversion of the EGI firmware. This may reduce some ofthe problems we experienced during the PacRim 2000mission, and should reduce the geo-location errors weexperienced for the PacRim 2000 data sets.
Improved accuracy GPS corrections are now be-ing made available in real-time. The AIRSAR in-strument has been outfitted to receive and recordthe improved-accuracy positions with a 12-channelAshtec GPS receiver. These positions are integratedwith the EGI position and attitude information inthe AIRSAR processor, and should reduce the EGIposition errors (15–30 m) substantially.
5.5 New Processing Technology
The processing technology developed11 (and alreadypartially implemented in the AIRSAR ATI proces-sor12) recently will be incorporated into the AIRSARintegrated processor. The improved motion com-pensation, pulse-resampling and regridding schemesshould help to reduce the motion-related artifacts andpatch-boundaries described in this paper. Initially,the improved technology processor may only be avail-able for TOPSAR DEM data (without co-registeredpolarimetry) which we concede is a limitation. Wehope that this limitation will eventually be lifted.
Acknowledgement
The research described in this paper was car-ried out by the Jet Propulsion Laboratory, Califor-nia Institute of Technology, under a contract withthe National Aeronautics and Space Administration.Several members of the AIRSAR processing teamhave contributed both to the detection as well as to
11Improved Processing for AIRSAR Data Based on theGeoSAR Processor, by Scott Hensley, Elaine Chapin, andThierry Michel, elsewhere in this workshop proceedings.
12PacRim 2000 ATI Calibration, by David A. Imel, else-where in this workshop proceedings.

Imel, AIRSAR Data Problems 23
the correction of the data problems described here.In particular, Yunling Lou has developed the CV-banding correction and Anhua Chu has developedmany of the other processing workarounds describedhere.