what’s the cost to...
TRANSCRIPT
What’s the Cost to Society?
November 2011
CRASHES VS. CONGESTION


Crashes vs. Congestion – What’s the Cost to Society?
prepared for
AAA
prepared by
Cambridge Systematics, Inc. 4800 Hampden Lane, Suite 800 Bethesda, Maryland 20814
November 2011


Crashes vs. Congestion: What’s the Cost to Society?
Cambridge Systematics, Inc. i
Table of Contents
Executive Summary .............................................................................................................. ES-1 Methodology .................................................................................................................. ES-1 Crash Costs Summary Results .................................................................................... ES-2 Key Findings .................................................................................................................. ES-3 Report Recommendations ............................................................................................ ES-3
Introduction ........................................................................................................................... 1
Methodology .......................................................................................................................... 4
Costs of Crashes and Congestion ....................................................................................... 10 Total Cost of Crashes .................................................................................................... 11 Cost of Crashes per Person .......................................................................................... 11 Cost of Crashes and Cost of Congestion .................................................................... 11 Comparison between 2008 and 2011 Studies ............................................................ 13
Key Findings .......................................................................................................................... 15
Report Recommendations ................................................................................................... 16
Appendix A – Complete Statistics ..................................................................................... A-1
Appendix B – Safety and Congestion – The Conventional Wisdom .......................... B-1 Crashes, Congestion, and System Performance ....................................................... B-2 Crashes, Congestion, and Institutional Capacity ..................................................... B-5 References ...................................................................................................................... B-7
Crashes vs. Congestion: What’s the Cost to Society?
ii Cambridge Systematics, Inc.
List of Tables
1. Metropolitan Areas Analyzed ..................................................................................... 2
2. Metropolitan Area Groupings by Population Size ................................................... 7
3. Ranges in the Total Cost of Crashes by Population Category ................................ 10
4. Ranges in the Cost of Crashes on a per Person Basis by Population Category .... 11
5. Crash Cost versus Congestion Cost per Person Ratios ........................................... 12
A.1 Fatalities and Injuries by City in Alphabetical Order .............................................. A-1
A.2 Total Cost of Crashes and Cost per Person, Very Large Metropolitan Areas ........... A-4
A.3 Total Cost of Crashes and Cost per Person, Large Metropolitan Areas .................... A-5
A.4 Total Cost of Crashes and Cost per Person, Medium Metropolitan Areas ............... A-6
A.5 Total Cost of Crashes and Cost per Person, Small Metropolitan Areas ................... A-7
A.6 Total Cost of Congestion and Cost per Person, Very Large Metropolitan Areas .... A-8
A.7 Total Cost of Congestion and Cost per Person, Large Metropolitan Areas ............. A-9
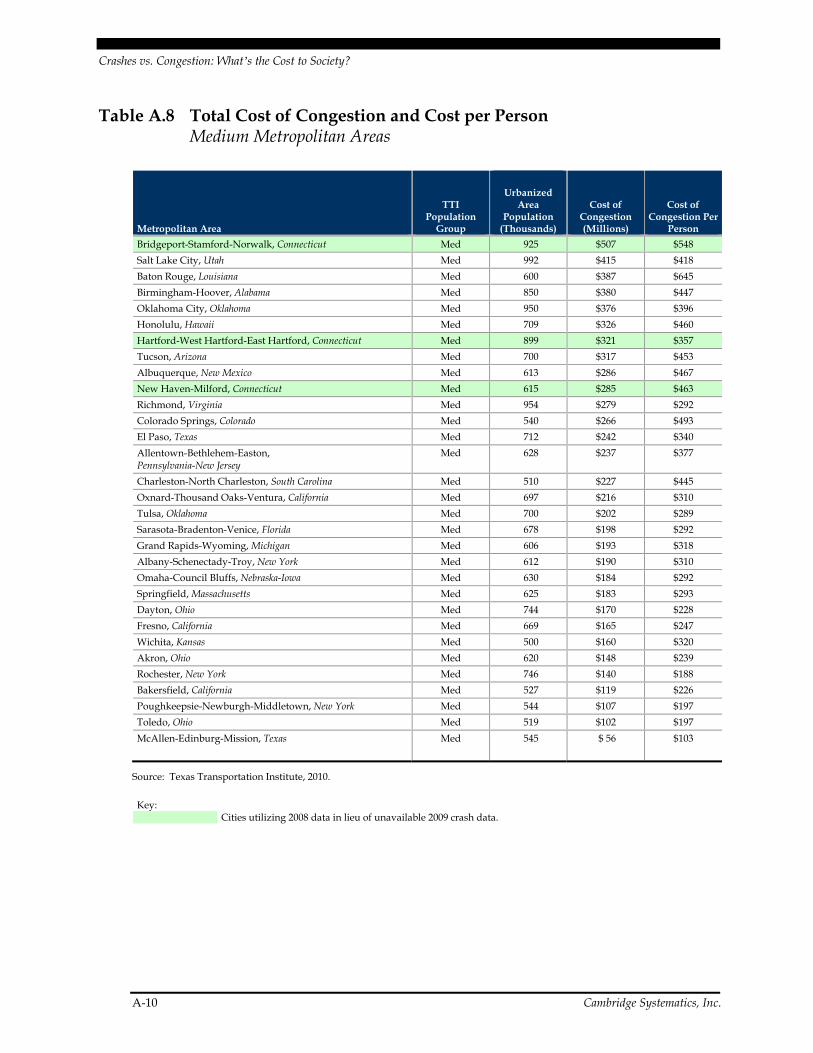
A.8 Total Cost of Congestion and Cost per Person, Medium Metropolitan Areas ......... A-10
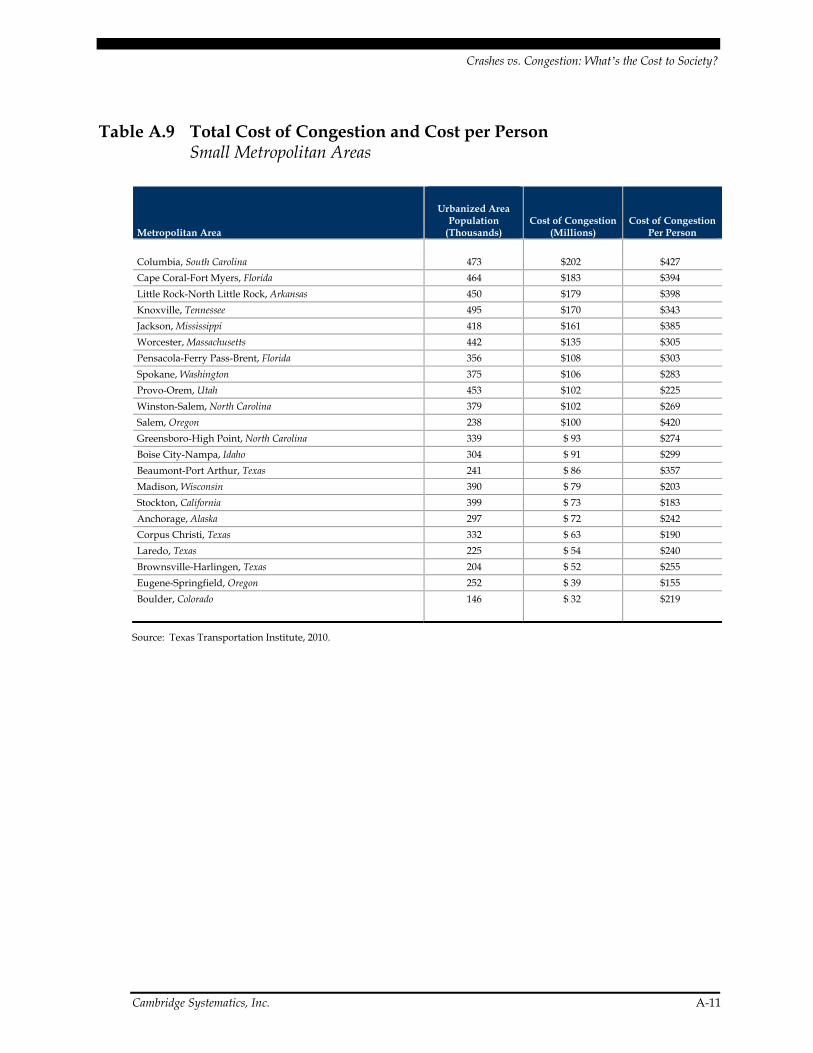
A.9 Total Cost of Congestion and Cost per Person, Small Metropolitan Areas ............. A-11
A.10 Cost of Crashes versus Cost of Congestion, Very Large Metropolitan Areas ......... A-12
A.11 Cost of Crashes versus Cost of Congestion, Large Metropolitan Areas .................. A-13
A.12 Cost of Crashes versus Cost of Congestion, Medium Metropolitan Areas ............. A-14
A.13 Cost of Crashes versus Cost of Congestion, Small Metropolitan Areas .................. A-15
Crashes vs. Congestion: What’s the Cost to Society?
Cambridge Systematics, Inc. iii
List of Figures
ES.1. Annual Cost of Crashes and Congestion per Person ............................................... ES-2
1. Urbanized Area versus Metropolitan Statistical Area in Tucson ........................... 5
2. Annual Cost of Crashes and Congestion per Person 2009 ................................................................................................................................. 12
3. Ratio of Cost of Crashes per Person to Cost of Congestion per Person ................ 13
4. Cost of Crashes and Cost of Congestion (in Billions) 2005 versus 2009 ............................................................................................................. 14
5. Cost of Crashes per Person and Cost of Congestion per Person Comparison 2005 versus 2009 ............................................................................................................. 14

Crashes vs. Congestion: What’s the Cost to Society?
Cambridge Systematics, Inc. ES-1
Executive Summary
When American motorists talk about transportation problems, they generally key in on traffic. Snarled highways, epic commutes, and gridlocked business and commercial districts mar our suburban existence, weighing heavily upon our elected leaders, our policymakers, and our families. Yet a more costly problem needs to be addressed on America’s roads: motor vehicle crashes. In 2009, traffic crashes killed 33,808 people in the United States – about 93 deaths per day, and nearly four every hour. These figures have been on the decline, in part, due to legislative changes (e.g., state highway safety improvement programs) and advances in the science of safety (e.g., vehicle crash avoidance systems) that have ushered in new approaches for states, regions, and localities to address safety issues and challenges. However, motor vehicle crashes remain the leading cause of death among ages 5-34 in the United States and, in terms of years of life lost, rank third, behind only cancer and heart disease. Most Americans would be surprised to learn the societal costs associated with motor vehicle crashes significantly exceed the costs of congestion.
AAA released a report in 2008 examining the costs of crashes to society. The study, along with recommendations for improvements, was designed to raise awareness among policy-makers, departments of transportation, and the public about the magnitude of the safety problem and the importance of transportation investments for reducing the number and severity of crashes. AAA embarked on an update to this study in 2011 to revisit results based on the most recent available data.
Methodology
The AAA study compares the costs of crashes to the costs of congestion on a per person level in the same urban areas used by the Texas Transportation Institute (TTI) in the annual Urban Mobility Report 2010. The costs of crashes are based on the Federal Highway Administration’s (FHWA) comprehensive costs for traffic fatalities and injuries (excluding property damage only crashes), which place a dollar value on 11 components.
The 11 comprehensive cost components include property damage; lost earnings; lost household production (non-market activities occurring in the home); medical costs; emergency services; travel delay; vocational rehabilitation; workplace costs; administrative costs; legal costs; and pain and lost quality of life. According to FHWA, in 2009 dollars, the cost of a single motor vehicle fatality is $6,000,000. For the purpose of this study, the 2009 cost of an injury is estimated at $126,000. This is based on the most recent estimate provided by FHWA in 2002 and adjusted to maintain the same fatality to injury cost ratio using FHWA’s 2009 cost of a fatality estimate. Congestion costs, as
Crashes vs. Congestion: What’s the Cost to Society?
ES-2 Cambridge Systematics, Inc.
reported in the Urban Mobility Report, are based on delay estimates combined with value of time and fuel costs.
Crash Costs Summary Results
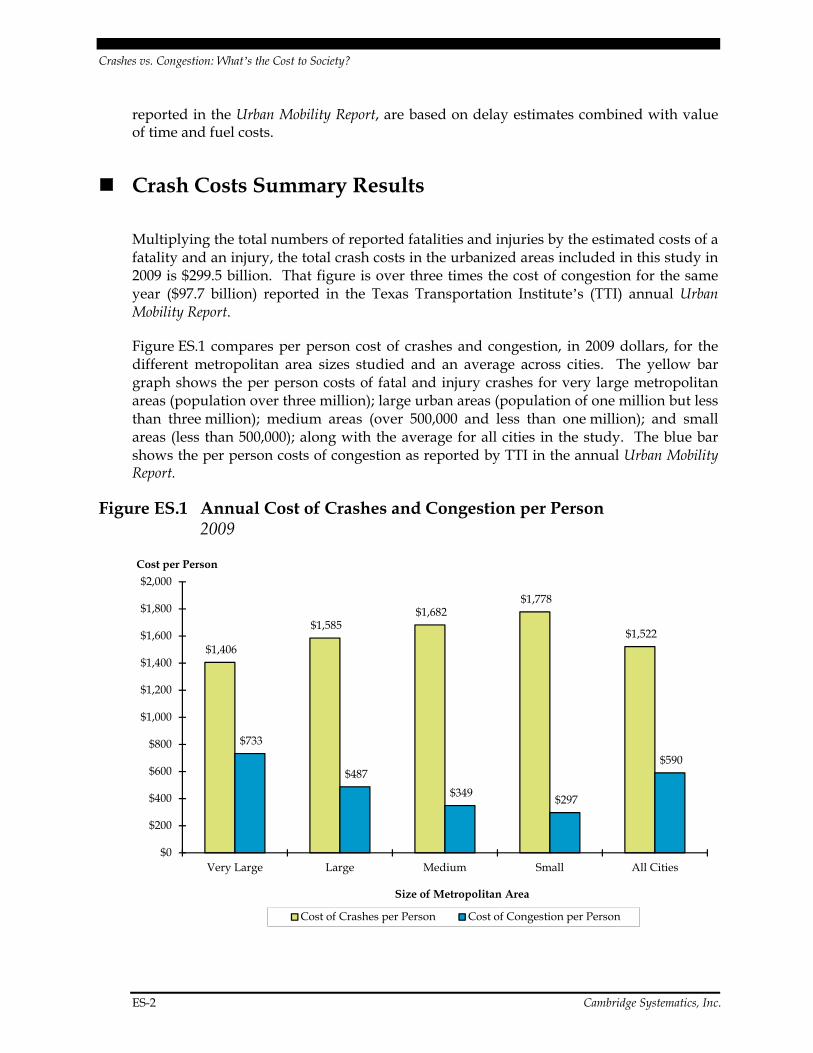
Multiplying the total numbers of reported fatalities and injuries by the estimated costs of a fatality and an injury, the total crash costs in the urbanized areas included in this study in 2009 is $299.5 billion. That figure is over three times the cost of congestion for the same year ($97.7 billion) reported in the Texas Transportation Institute’s (TTI) annual Urban Mobility Report.
Figure ES.1 compares per person cost of crashes and congestion, in 2009 dollars, for the different metropolitan area sizes studied and an average across cities. The yellow bar graph shows the per person costs of fatal and injury crashes for very large metropolitan areas (population over three million); large urban areas (population of one million but less than three million); medium areas (over 500,000 and less than one million); and small areas (less than 500,000); along with the average for all cities in the study. The blue bar shows the per person costs of congestion as reported by TTI in the annual Urban Mobility Report.
Figure ES.1 Annual Cost of Crashes and Congestion per Person 2009
$1,406
$1,585 $1,682
$1,778
$1,522
$733
$487
$349 $297
$590
$0
$200
$400
$600
$800
$1,000
$1,200
$1,400
$1,600
$1,800
$2,000
Very Large Large Medium Small All Cities
Cost per Person
Size of Metropolitan Area
Cost of Crashes per Person Cost of Congestion per Person

Crashes vs. Congestion: What’s the Cost to Society?
Cambridge Systematics, Inc. ES-3
Normalizing the data for a more direct comparison in the urban areas studies, the cost of crashes on a per person basis decreases as the size of the metropolitan area increases, while an increase in the size of the metropolitan area relates to an increase in congestion. However, in every city studied, the crash costs still exceed the congestion costs on a per person basis.
Key Findings
In the urbanized areas in this study, the total cost of traffic crashes is over three times the cost of congestion – $299.5 billion for traffic crashes and $97.7 billion for congestion.
In every city studied, the crash costs on a per person basis exceed the congestion costs. Overall, crash costs per person is more than two and one-half times the cost of congestion. For very large urban areas, crash costs are nearly double those of congestion. In large urban areas, crash costs are over three times more than congestion; for medium areas, crash costs are over four and one-half times more than congestion; and for small urban areas, crashes are nearly six times more costly than congestion.
The cost of crashes on a per person basis decreases as the size of the metropolitan area increases. An inverse relationship occurs with the cost of congestion, which increases bases on the size of the metropolitan area.
Report Recommendations
While progress has been made to change the culture of traffic safety in the United States, continued improvement is possible and imperative. Such progress will continue to take all the “tools” in the traffic safety toolbox, plus some new thinking about approaches. Complacency regarding safety continues to be a significant challenge. No single action or strategy will bring about a cultural change. Rather, new approaches are needed to enhance public support for increased funding and to help transportation planners focus on areas with the greatest potential for improving safety.
Leadership
Make safety a national priority. Leadership and commitment are needed to make transportation safety a national priority and an integral part of transportation planning. Changing the culture of complacency as it relates to lives lost on the nation’s roads should be a guiding principle for all transportation-related discussions going forward. Focusing planning and resources on safety improvements will not only save lives and prevent injuries, but can also reduce congestion.
Crashes vs. Congestion: What’s the Cost to Society?
ES-4 Cambridge Systematics, Inc.
Increase investment in proven safety countermeasures. By focusing investment on proven countermeasures, we can demonstrate measurable results and show a meaningful return on these investments.
Pass good laws and enforce them. Greater political will is needed to pass legislation and enforce laws having a positive impact on safety, such as primary safety belt requirements, impaired driving countermeasures, and full implementation of graduated driver licensing systems.
Ensure implementation and evaluation of state highway safety plans. Congress and the U.S. Department of Transportation should ensure states follow through on implementation of their strategic highway safety plans and evaluate the results to determine effectiveness. Greater accountability is needed to ensure that states are meeting the goals of their highway safety improvement plans and implementing those strategies that have greatest opportunity for saving lives.
Make zero fatalities a national goal. Achieving zero fatalities should be the national safety goal. AAA recommends convening a White House Conference of Traffic Safety to develop a national strategic plan to put the nation on a course to reach this goal.
Communication and Collaboration
Break down silos. Increased communication and support between federal agencies responsible for transportation safety related issues is critical. Governmental agencies should leverage resources and foster collaboration in order to eliminate duplication and help identify and promote public health programmatic and policy interventions shown to prevent injury and save lives.
Communicate the consequences more effectively. The transportation safety community needs to develop more effective ways of getting the public to understand the impact of traffic crashes, the need for effective countermeasures, and the role their own behavior plays in safety.
Increase collaboration between disciplines. Increased collaboration among traffic safety professionals, public health specialists, and health communications experts is needed to incorporate the best available science on behavior modification.
Research and Evaluation
Increase funding for testing and evaluation of safety interventions. Programs should be based on sound scientific principles rather than “conventional wisdom,” populist fervor, or political expediency. Systematic evaluation allows identification and expansion of successful programs and interventions so limited resources can be applied more effectively.
Emphasize performance-based planning. Further testing and implementation of road risk assessment tools (e.g., U.S. Road Assessment Program (usRAP), FHWA’s

Crashes vs. Congestion: What’s the Cost to Society?
Cambridge Systematics, Inc. ES-5
Systemic Safety Project Selection Tool, SafetyAnalyst, and Vision Zero Suite) should be encouraged to ensure dollars are spent on roads and bridges with the greatest safety problems. Understanding road safety risks will help state DOTs focus on solutions with the greatest safety benefits and should result in broader public support for needed improvements.
Increase funding for data collection systems. Data should meet model minimum uniform standards and should be provided by each state. National data are needed on serious injuries sustained in traffic crashes in order to improve traffic safety research and to foster evidence based decision-making. To achieve this goal states need funding to link crash, emergency department, and trauma registry databases.

Crashes vs. Congestion: What’s the Cost to Society?
Cambridge Systematics, Inc. 1
Introduction
The American public and elected officials increasingly are concerned about the costs and consequences of congestion. However, each year, over 5.5 million police reported motor vehicle crashes result in more than 30,000 fatalities and two million injuries in the United States alone. These figures have been on the decline, in part, due to legislative changes (e.g., state highway safety improvement programs) and advances in the science of safety (e.g., vehicle crash avoidance systems) that have ushered in new approaches for states, regions, and localities to address safety issues and challenges. This study commissioned by AAA suggests the costs and consequences of these fatalities and injuries greatly exceed the costs of congestion.
The 2008 Crashes vs. Congestion study examined the relationship between congestion and crashes to determine the relative economic impact. The study, along with recommendations for improvement, was designed to provide elected officials, federal, state, and local agencies with road safety responsibilities, and the public with information on the comparative magnitude and possible interactive effects of the safety and congestion.
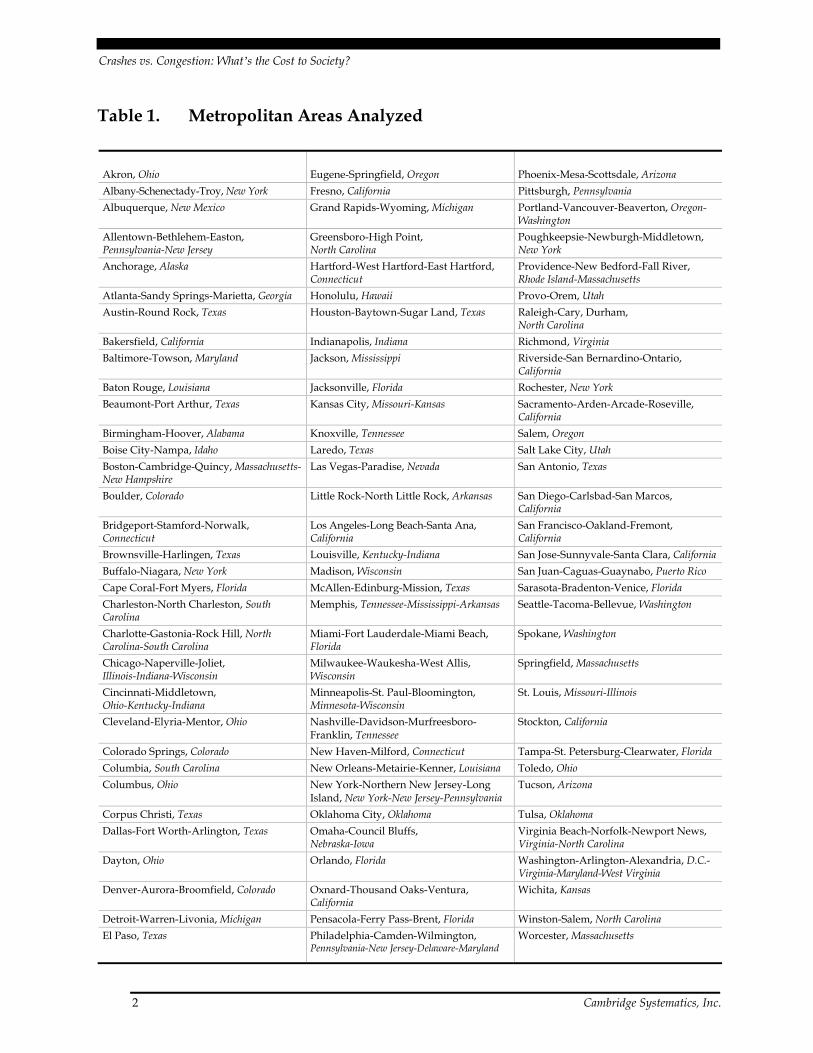
This 2011 update to the study, similar to the original report, compares the costs of crashes with the costs of congestion on a per person level in the same 99 urban areas used by the Texas Transportation Institute (TTI) in its annual Urban Mobility Report 2010 as shown in Table 1.1 The costs of crashes are based on the Federal Highway Administration’s (FHWA) comprehensive costs for traffic fatalities and injuries that assigns a dollar value to 11 components, including property damage; lost earnings; lost household production (non-market activities occurring in the home); medical costs; emergency services; travel delay; vocational rehabilitation; workplace costs; administrative costs; legal costs; and pain and lost quality of life. Based on FHWA estimates, in 2009 dollars, the average cost of a fatality is $6,000,000 and the average cost of an injury is $126,000.
1 The TTI report lists 101 urbanized areas. In this study, the costs of congestion for Lancaster-
Palmdale, California and Indio-Cathedral City-Palm Springs, California have been added to the Los Angeles-Long Beach-Santa Ana, California and Riverside-San Bernardino, California Metropolitan Statistical Areas (MSA) respectively. The crash statistics for Los Angeles-Long Beach-Santa Ana, California and Riverside-San Bernardino, California MSAs already include the data for Lancaster-Palmdale, California and Indio-Cathedral City-Palm Springs, California. Hence, no double counting is included.
Crashes vs. Congestion: What’s the Cost to Society?
2 Cambridge Systematics, Inc.
Table 1. Metropolitan Areas Analyzed
Akron, Ohio Eugene-Springfield, Oregon Phoenix-Mesa-Scottsdale, Arizona
Albany-Schenectady-Troy, New York Fresno, California Pittsburgh, Pennsylvania
Albuquerque, New Mexico Grand Rapids-Wyoming, Michigan Portland-Vancouver-Beaverton, Oregon-Washington
Allentown-Bethlehem-Easton, Pennsylvania-New Jersey
Greensboro-High Point, North Carolina
Poughkeepsie-Newburgh-Middletown, New York
Anchorage, Alaska Hartford-West Hartford-East Hartford, Connecticut
Providence-New Bedford-Fall River, Rhode Island-Massachusetts
Atlanta-Sandy Springs-Marietta, Georgia Honolulu, Hawaii Provo-Orem, Utah
Austin-Round Rock, Texas Houston-Baytown-Sugar Land, Texas Raleigh-Cary, Durham, North Carolina
Bakersfield, California Indianapolis, Indiana Richmond, Virginia
Baltimore-Towson, Maryland Jackson, Mississippi Riverside-San Bernardino-Ontario, California
Baton Rouge, Louisiana Jacksonville, Florida Rochester, New York
Beaumont-Port Arthur, Texas Kansas City, Missouri-Kansas Sacramento-Arden-Arcade-Roseville, California
Birmingham-Hoover, Alabama Knoxville, Tennessee Salem, Oregon
Boise City-Nampa, Idaho Laredo, Texas Salt Lake City, Utah
Boston-Cambridge-Quincy, Massachusetts-New Hampshire
Las Vegas-Paradise, Nevada San Antonio, Texas
Boulder, Colorado Little Rock-North Little Rock, Arkansas San Diego-Carlsbad-San Marcos, California
Bridgeport-Stamford-Norwalk, Connecticut
Los Angeles-Long Beach-Santa Ana, California
San Francisco-Oakland-Fremont, California
Brownsville-Harlingen, Texas Louisville, Kentucky-Indiana San Jose-Sunnyvale-Santa Clara, California
Buffalo-Niagara, New York Madison, Wisconsin San Juan-Caguas-Guaynabo, Puerto Rico
Cape Coral-Fort Myers, Florida McAllen-Edinburg-Mission, Texas Sarasota-Bradenton-Venice, Florida
Charleston-North Charleston, South Carolina
Memphis, Tennessee-Mississippi-Arkansas Seattle-Tacoma-Bellevue, Washington
Charlotte-Gastonia-Rock Hill, North Carolina-South Carolina
Miami-Fort Lauderdale-Miami Beach, Florida
Spokane, Washington
Chicago-Naperville-Joliet, Illinois-Indiana-Wisconsin
Milwaukee-Waukesha-West Allis, Wisconsin
Springfield, Massachusetts
Cincinnati-Middletown, Ohio-Kentucky-Indiana
Minneapolis-St. Paul-Bloomington, Minnesota-Wisconsin
St. Louis, Missouri-Illinois
Cleveland-Elyria-Mentor, Ohio Nashville-Davidson-Murfreesboro-Franklin, Tennessee
Stockton, California
Colorado Springs, Colorado New Haven-Milford, Connecticut Tampa-St. Petersburg-Clearwater, Florida
Columbia, South Carolina New Orleans-Metairie-Kenner, Louisiana Toledo, Ohio
Columbus, Ohio New York-Northern New Jersey-Long Island, New York-New Jersey-Pennsylvania
Tucson, Arizona
Corpus Christi, Texas Oklahoma City, Oklahoma Tulsa, Oklahoma
Dallas-Fort Worth-Arlington, Texas Omaha-Council Bluffs, Nebraska-Iowa
Virginia Beach-Norfolk-Newport News, Virginia-North Carolina
Dayton, Ohio Orlando, Florida Washington-Arlington-Alexandria, D.C.-Virginia-Maryland-West Virginia
Denver-Aurora-Broomfield, Colorado Oxnard-Thousand Oaks-Ventura, California
Wichita, Kansas
Detroit-Warren-Livonia, Michigan Pensacola-Ferry Pass-Brent, Florida Winston-Salem, North Carolina
El Paso, Texas Philadelphia-Camden-Wilmington, Pennsylvania-New Jersey-Delaware-Maryland
Worcester, Massachusetts
Crashes vs. Congestion: What’s the Cost to Society?
Cambridge Systematics, Inc. 3
To ensure the accuracy of the study, results were not provided for Boston-Cambridge-Quincy, Massachusetts-New Hampshire urbanized area due to insufficient crash data.
The cost of crashes exceeds the cost of congestion in each of the TTI urban areas compared. Results from the study show large cities incur the largest total crash costs because the number of fatalities and injuries is larger than in smaller cities. However, if the total cost of crashes is calculated on a per person basis (necessary for a comparison with the costs of congestion), smaller cities have greater per person costs.
As with the total cost of crashes, the total cost of congestion increases as city size increases. However, on a per person basis, an inverse relationship occurs: while crash costs per person increase according to the declining size of the city, the cost of congestion per person declines along with declining city size. This indicates the relative cost of crashes is greater than the cost of congestion in smaller cities.
A complex relationship exists between congestion and crashes. Although the evidence is mixed, less congested roadways appear to lead to fewer, but more severe, crashes. This relationship is especially strong in the case of crash severity; that is, more severe crashes occur on less congested roadways due in large part to faster speeds. On more congested roadways, the number of crashes may increase, but they may be primarily minor crashes reflecting the increased weaving and access/egress movements often occurring on congested road segments. Crashes may also lead to severe, unexpected congestion in an otherwise congestion-free roadway, reducing the level of service.
This report includes sections discussing: the methodology for data collection and the technical approach used to determine crash costs; final tabulated crash costs as compared to congestion costs; key findings; and recommendations. Appendix A provides detailed results on crash and congestion costs by urbanized area included in this study. Appendix B provides a review of the conventional wisdom on the relationship between crashes and congestion.
Crashes vs. Congestion: What’s the Cost to Society?
4 Cambridge Systematics, Inc.
Methodology
The 2011 update to the Crashes vs. Congestion study uses a data analysis methodology similar to that used in the original report. The process involved four key steps:
Collecting fatality and injury data;
Assembling data with respect to metropolitan area boundaries;
Monetizing fatalities and injuries to determine total costs; and
Comparing crash costs to congestion costs.
The key components in determining estimates for crash costs for this study were the numbers of fatalities and injuries. Fatality and injury statistics are primarily summarized at the county level; therefore, it was determined analyses would be conducted at the metropolitan statistical area (MSA) level as MSAs are defined based on county boundaries. As a result, it was necessary to assemble crash data for all constituent counties in an MSA. Steps were taken to contact all appropriate state agencies to obtain fatality and injury data. The inclusion of Property Damage Only (PDO) crashes was considered; however, data for such crashes is inconsistent. PDO crashes are reported only if they meet a certain damage threshold level, which differs from state to state. Because of the thresholds, about half of all PDO crashes are unreported. Thus, PDO crashes were excluded from this study.
The definition of an MSA differs from the definition of an urbanized area used in the Urban Mobility Report (UMR). The UMR provides information on congestion based on data collected from the Highway Performance Monitoring System (HPMS). Since the UMR is focused on roadways within urban areas, a filter is used to isolate specific roadways in the HPMS database for the analysis. Filtering uses the urban or nonurban variable coded for each roadway in the HPMS dataset. The classification of urban or non-urban is based on “urbanized area” definitions provided by the Bureau of the Census. Such definitions are provided for hundreds of urban agglomerations across the country, many more than those covered in the UMR. Urbanized areas are density-based, and include census blocks in the urban core with a population density exceeding 1,000 persons per square mile, and census blocks in the surrounding areas with a population density exceeding 500 persons per square mile.
Crash data is coded with sufficient location information to identify the urban or rural location of the crash; however, to obtain and process database information from all the states and to juxtapose this information with urbanized area definitions would have been extremely costly and difficult to process. As a result, the study used the MSA definitions provided by the Bureau of the Census as an appropriate method of determining the size of a metropolitan area. Unlike the urbanized area definitions, which are based on density,
Crashes vs. Congestion: What’s the Cost to Society?
Cambridge Systematics, Inc. 5
MSAs are based on county boundaries. A county is grouped with an MSA if it has a high degree of social and economic integration with the urban core of the MSA.
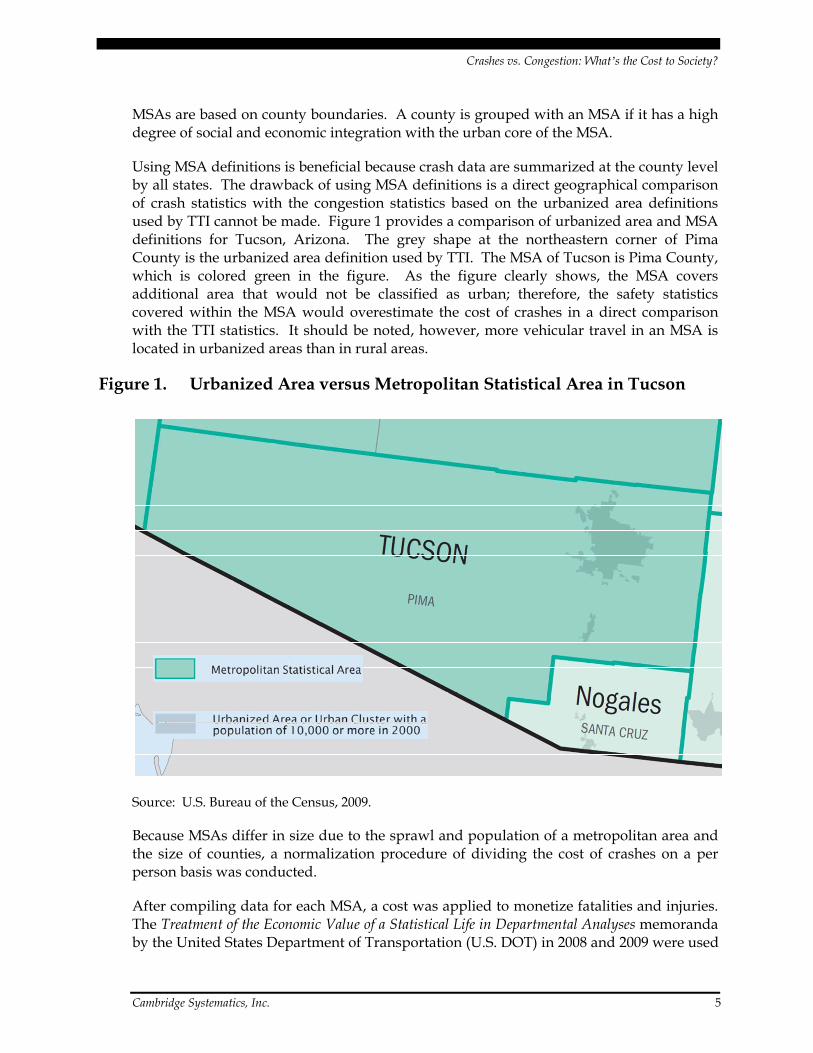
Using MSA definitions is beneficial because crash data are summarized at the county level by all states. The drawback of using MSA definitions is a direct geographical comparison of crash statistics with the congestion statistics based on the urbanized area definitions used by TTI cannot be made. Figure 1 provides a comparison of urbanized area and MSA definitions for Tucson, Arizona. The grey shape at the northeastern corner of Pima County is the urbanized area definition used by TTI. The MSA of Tucson is Pima County, which is colored green in the figure. As the figure clearly shows, the MSA covers additional area that would not be classified as urban; therefore, the safety statistics covered within the MSA would overestimate the cost of crashes in a direct comparison with the TTI statistics. It should be noted, however, more vehicular travel in an MSA is located in urbanized areas than in rural areas.
Figure 1. Urbanized Area versus Metropolitan Statistical Area in Tucson
Source: U.S. Bureau of the Census, 2009.
Because MSAs differ in size due to the sprawl and population of a metropolitan area and the size of counties, a normalization procedure of dividing the cost of crashes on a per person basis was conducted.
After compiling data for each MSA, a cost was applied to monetize fatalities and injuries. The Treatment of the Economic Value of a Statistical Life in Departmental Analyses memoranda by the United States Department of Transportation (U.S. DOT) in 2008 and 2009 were used
Crashes vs. Congestion: What’s the Cost to Society?
6 Cambridge Systematics, Inc.
as a basis to determine the Value of Statistical Life (VSL) from motor vehicle traffic crashes. The memoranda indicate:
“… potential damage associated with accidents includes both the personal disutility of death or injury and a variety of purely economic losses (to both the victims and others), including property damage, traffic delay, lost productivity, and the costs of police, investigation, medical, legal, and insurance services. In general, the benefit of preventing economic losses to society, apart from victims and their families, should also be accounted for in analyses.”
By definition, the VSL is the estimated monetary benefit of a reduction by one in the expected number of fatalities. The estimated values have changed over time with statistical techniques, model specifications, and sources of data continuing to evolve. The U.S. DOT’s 2009 memoranda estimated $6 million for the average cost of a fatality, however, the economic value for statistical injury is still under review at the time of this study. Therefore, this 2011 Crashes versus Congestion update estimates $126,000 for the average cost of an injury in 2009, which reflects the same fatality to injury cost ratio from the last time FHWA provided estimates of both in the same year ($3 million and $63,000, respectively, in 2002).
The number of fatalities and injuries in 2009 for each MSA was then multiplied by these 2009 VSL and injury costs to determine the total cost of crashes. The cost of crashes was tabulated for all cities and compared with congestion costs reported in the UMR. As with the UMR, data also were summarized according to metropolitan area population size: very large metropolitan areas (population over three million); large urban areas (population of one million but less than three million); medium areas (over 500,000 and less than one million); and small areas (less than 500,000).
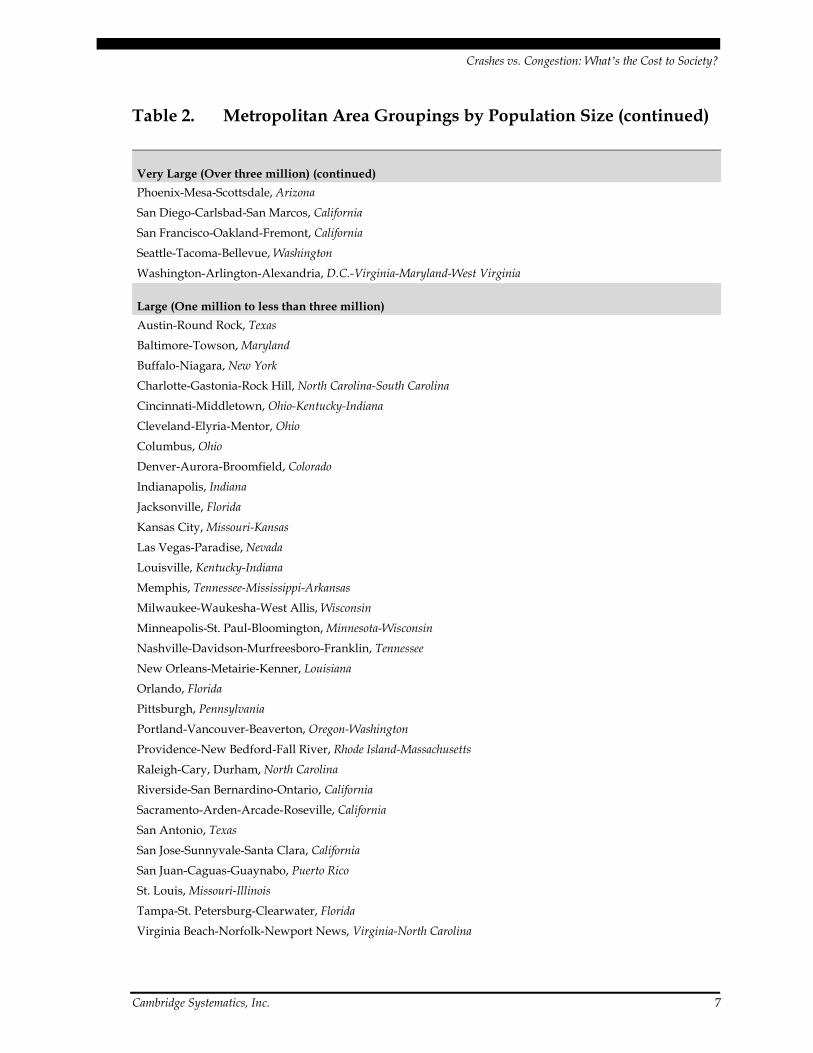
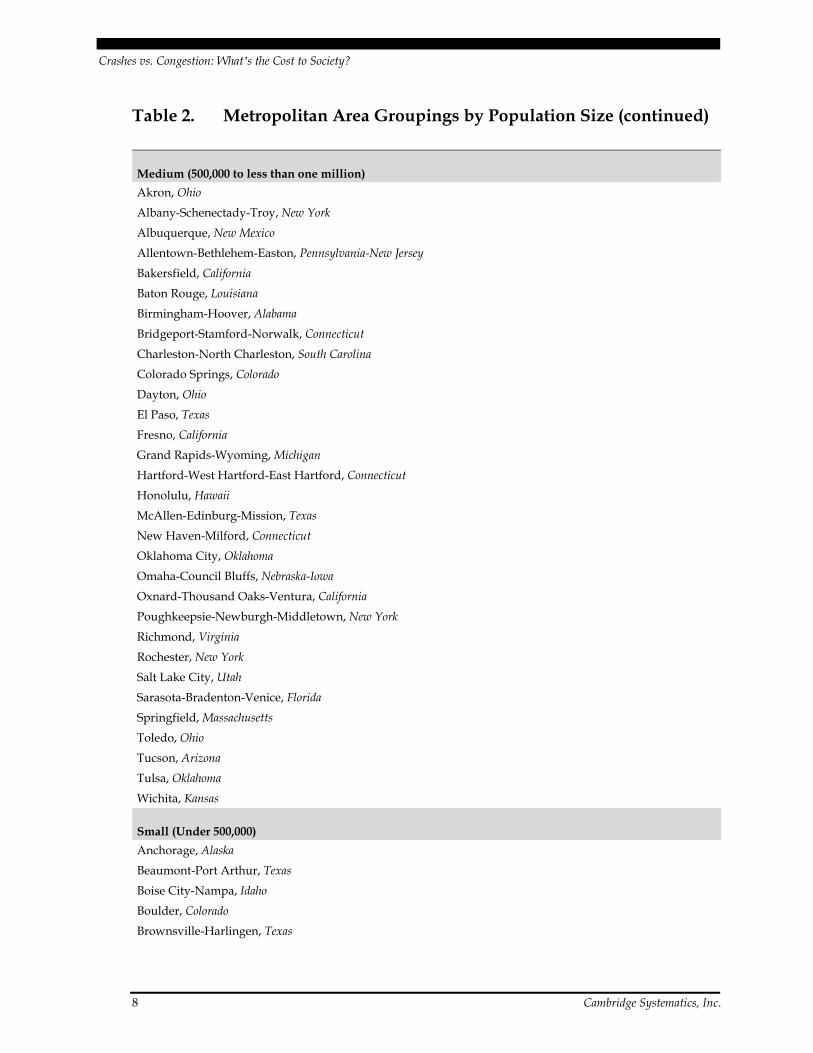
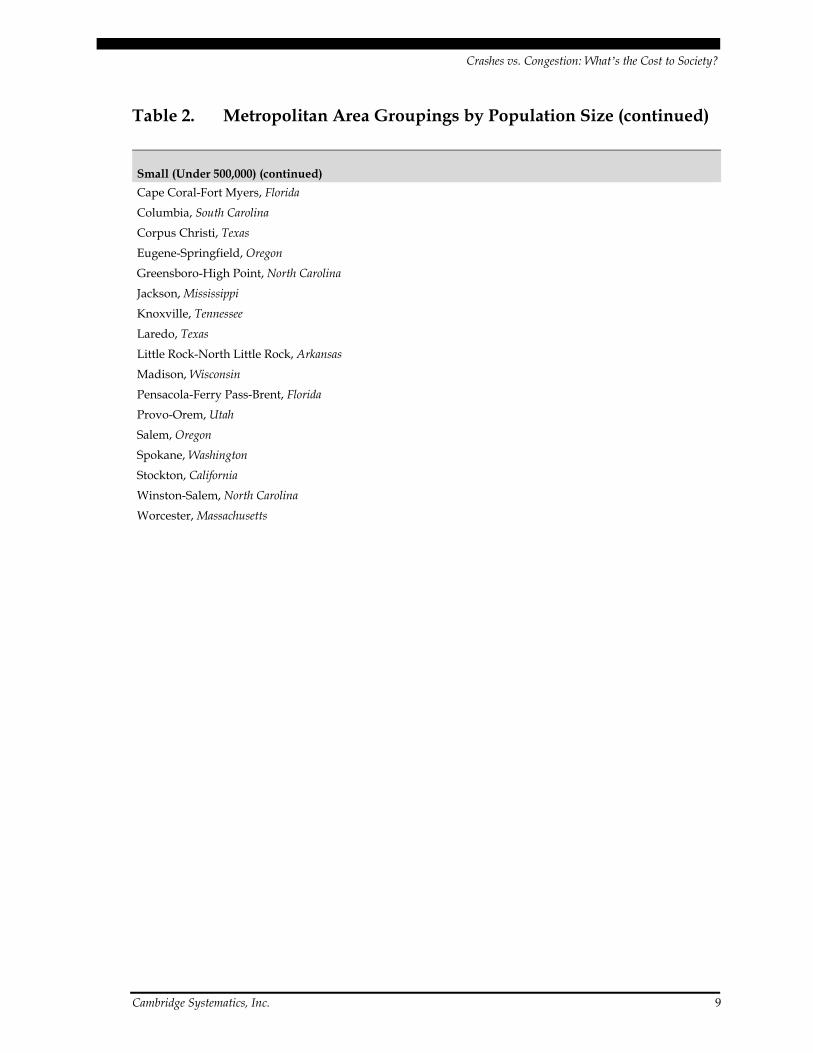
Table 2 shows the metropolitan area groupings by population size.
Table 2. Metropolitan Area Groupings by Population Size
Very Large (Over three million)
Atlanta-Sandy Springs-Marietta, Georgia
Boston-Cambridge-Quincy, Massachusetts-New Hampshire
Chicago-Naperville-Joliet, Illinois-Indiana-Wisconsin
Dallas-Fort Worth-Arlington, Texas
Detroit-Warren-Livonia, Michigan
Houston-Baytown-Sugar Land, Texas
Los Angeles-Long Beach-Santa Ana, California
Miami-Fort Lauderdale-Miami Beach, Florida
New York-Northern New Jersey-Long Island, New York-New Jersey-Pennsylvania
Philadelphia-Camden-Wilmington, Pennsylvania-New Jersey-Delaware-Maryland
Crashes vs. Congestion: What’s the Cost to Society?
Cambridge Systematics, Inc. 7
Table 2. Metropolitan Area Groupings by Population Size (continued)
Very Large (Over three million) (continued)
Phoenix-Mesa-Scottsdale, Arizona
San Diego-Carlsbad-San Marcos, California
San Francisco-Oakland-Fremont, California
Seattle-Tacoma-Bellevue, Washington
Washington-Arlington-Alexandria, D.C.-Virginia-Maryland-West Virginia
Large (One million to less than three million)
Austin-Round Rock, Texas
Baltimore-Towson, Maryland
Buffalo-Niagara, New York
Charlotte-Gastonia-Rock Hill, North Carolina-South Carolina
Cincinnati-Middletown, Ohio-Kentucky-Indiana
Cleveland-Elyria-Mentor, Ohio
Columbus, Ohio
Denver-Aurora-Broomfield, Colorado
Indianapolis, Indiana
Jacksonville, Florida
Kansas City, Missouri-Kansas
Las Vegas-Paradise, Nevada
Louisville, Kentucky-Indiana
Memphis, Tennessee-Mississippi-Arkansas
Milwaukee-Waukesha-West Allis, Wisconsin
Minneapolis-St. Paul-Bloomington, Minnesota-Wisconsin
Nashville-Davidson-Murfreesboro-Franklin, Tennessee
New Orleans-Metairie-Kenner, Louisiana
Orlando, Florida
Pittsburgh, Pennsylvania
Portland-Vancouver-Beaverton, Oregon-Washington
Providence-New Bedford-Fall River, Rhode Island-Massachusetts
Raleigh-Cary, Durham, North Carolina
Riverside-San Bernardino-Ontario, California
Sacramento-Arden-Arcade-Roseville, California
San Antonio, Texas
San Jose-Sunnyvale-Santa Clara, California
San Juan-Caguas-Guaynabo, Puerto Rico
St. Louis, Missouri-Illinois
Tampa-St. Petersburg-Clearwater, Florida
Virginia Beach-Norfolk-Newport News, Virginia-North Carolina
Crashes vs. Congestion: What’s the Cost to Society?
8 Cambridge Systematics, Inc.
Table 2. Metropolitan Area Groupings by Population Size (continued)
Medium (500,000 to less than one million)
Akron, Ohio
Albany-Schenectady-Troy, New York
Albuquerque, New Mexico
Allentown-Bethlehem-Easton, Pennsylvania-New Jersey
Bakersfield, California
Baton Rouge, Louisiana
Birmingham-Hoover, Alabama
Bridgeport-Stamford-Norwalk, Connecticut
Charleston-North Charleston, South Carolina
Colorado Springs, Colorado
Dayton, Ohio
El Paso, Texas
Fresno, California
Grand Rapids-Wyoming, Michigan
Hartford-West Hartford-East Hartford, Connecticut
Honolulu, Hawaii
McAllen-Edinburg-Mission, Texas
New Haven-Milford, Connecticut
Oklahoma City, Oklahoma
Omaha-Council Bluffs, Nebraska-Iowa
Oxnard-Thousand Oaks-Ventura, California
Poughkeepsie-Newburgh-Middletown, New York
Richmond, Virginia
Rochester, New York
Salt Lake City, Utah
Sarasota-Bradenton-Venice, Florida
Springfield, Massachusetts
Toledo, Ohio
Tucson, Arizona
Tulsa, Oklahoma
Wichita, Kansas
Small (Under 500,000)
Anchorage, Alaska
Beaumont-Port Arthur, Texas
Boise City-Nampa, Idaho
Boulder, Colorado
Brownsville-Harlingen, Texas
Crashes vs. Congestion: What’s the Cost to Society?
Cambridge Systematics, Inc. 9
Table 2. Metropolitan Area Groupings by Population Size (continued)
Small (Under 500,000) (continued)
Cape Coral-Fort Myers, Florida
Columbia, South Carolina
Corpus Christi, Texas
Eugene-Springfield, Oregon
Greensboro-High Point, North Carolina
Jackson, Mississippi
Knoxville, Tennessee
Laredo, Texas
Little Rock-North Little Rock, Arkansas
Madison, Wisconsin
Pensacola-Ferry Pass-Brent, Florida
Provo-Orem, Utah
Salem, Oregon
Spokane, Washington
Stockton, California
Winston-Salem, North Carolina
Worcester, Massachusetts
Crashes vs. Congestion: What’s the Cost to Society?
10 Cambridge Systematics, Inc.
Costs of Crashes and Congestion
Note: Complete results can be found in Appendix A.
Total Cost of Crashes
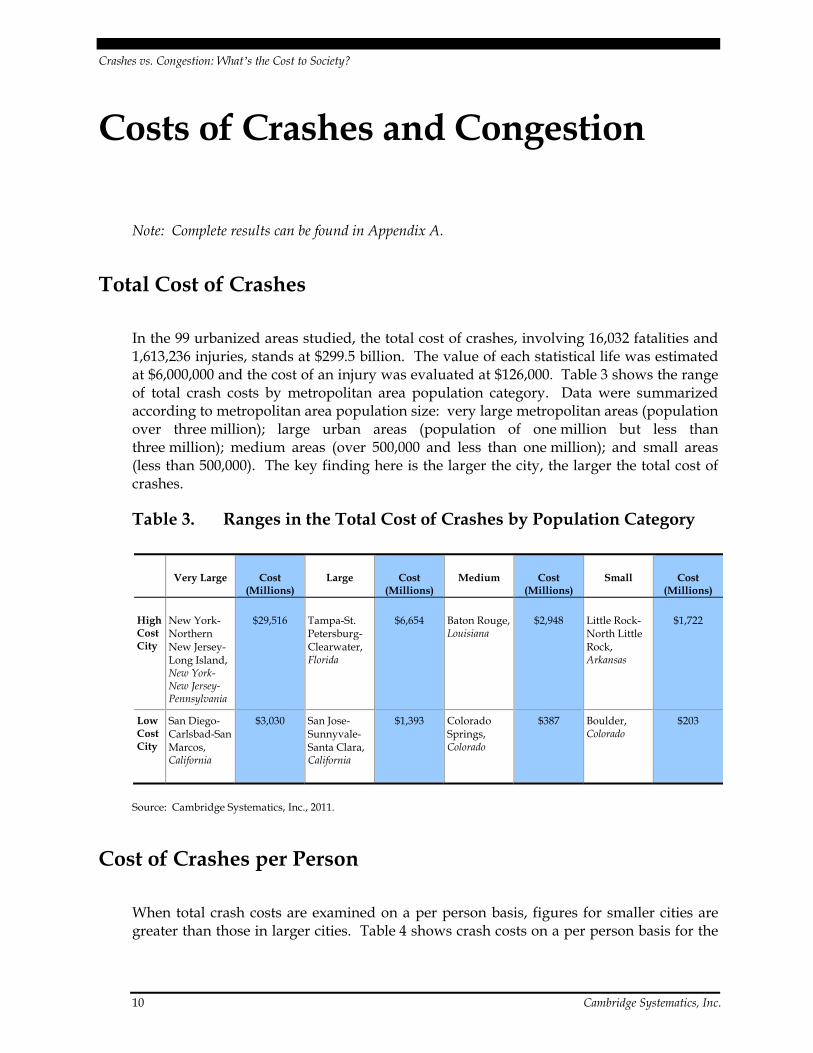
In the 99 urbanized areas studied, the total cost of crashes, involving 16,032 fatalities and 1,613,236 injuries, stands at $299.5 billion. The value of each statistical life was estimated at $6,000,000 and the cost of an injury was evaluated at $126,000. Table 3 shows the range of total crash costs by metropolitan area population category. Data were summarized according to metropolitan area population size: very large metropolitan areas (population over three million); large urban areas (population of one million but less than three million); medium areas (over 500,000 and less than one million); and small areas (less than 500,000). The key finding here is the larger the city, the larger the total cost of crashes.
Table 3. Ranges in the Total Cost of Crashes by Population Category
Very Large Cost (Millions)
Large Cost (Millions)
Medium Cost (Millions)
Small Cost (Millions)
High Cost City
New York-Northern New Jersey-Long Island, New York-New Jersey-Pennsylvania
$29,516 Tampa-St. Petersburg-Clearwater, Florida
$6,654 Baton Rouge, Louisiana
$2,948 Little Rock-North Little Rock, Arkansas
$1,722
Low Cost City
San Diego-Carlsbad-San Marcos, California
$3,030 San Jose-Sunnyvale-Santa Clara, California
$1,393 Colorado Springs, Colorado
$387 Boulder, Colorado
$203
Source: Cambridge Systematics, Inc., 2011.
Cost of Crashes per Person
When total crash costs are examined on a per person basis, figures for smaller cities are greater than those in larger cities. Table 4 shows crash costs on a per person basis for the
Crashes vs. Congestion: What’s the Cost to Society?
Cambridge Systematics, Inc. 11
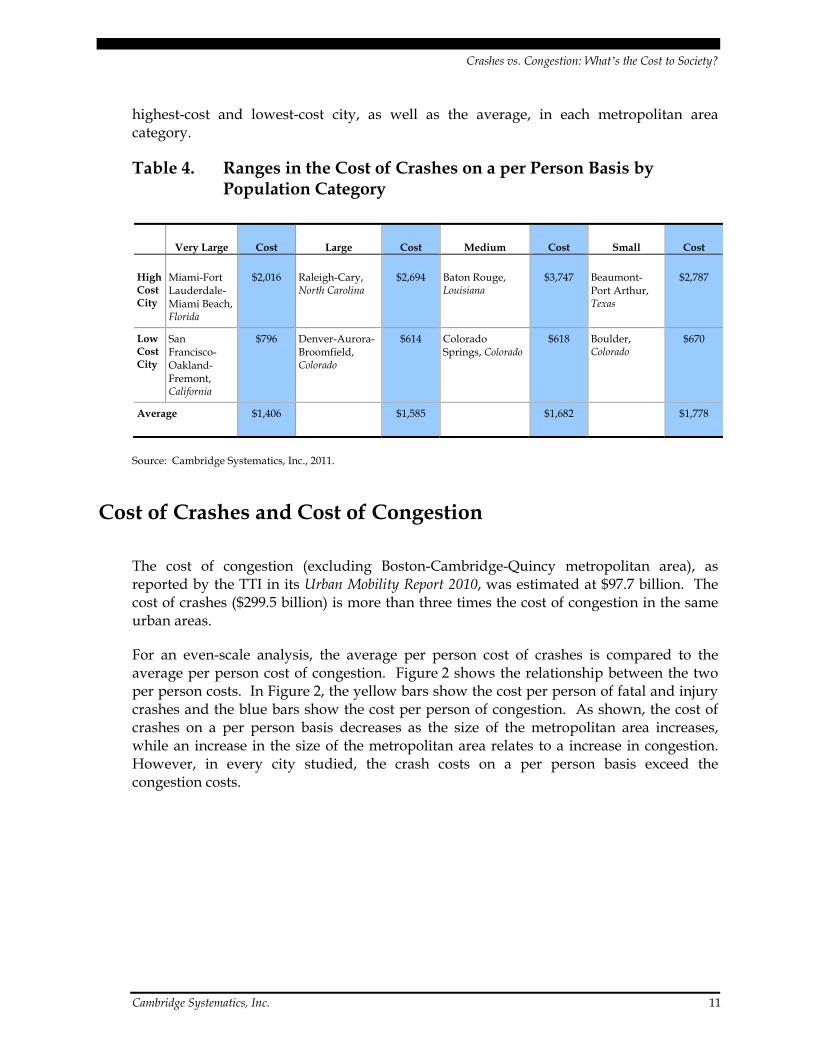
highest-cost and lowest-cost city, as well as the average, in each metropolitan area category.
Table 4. Ranges in the Cost of Crashes on a per Person Basis by Population Category
Very Large Cost Large Cost Medium Cost Small Cost
High Cost City
Miami-Fort Lauderdale-Miami Beach, Florida
$2,016 Raleigh-Cary, North Carolina
$2,694 Baton Rouge, Louisiana
$3,747 Beaumont-Port Arthur, Texas
$2,787
Low Cost City
San Francisco-Oakland-Fremont, California
$796 Denver-Aurora-Broomfield, Colorado
$614 Colorado Springs, Colorado
$618 Boulder, Colorado
$670
Average $1,406 $1,585 $1,682 $1,778
Source: Cambridge Systematics, Inc., 2011.
Cost of Crashes and Cost of Congestion
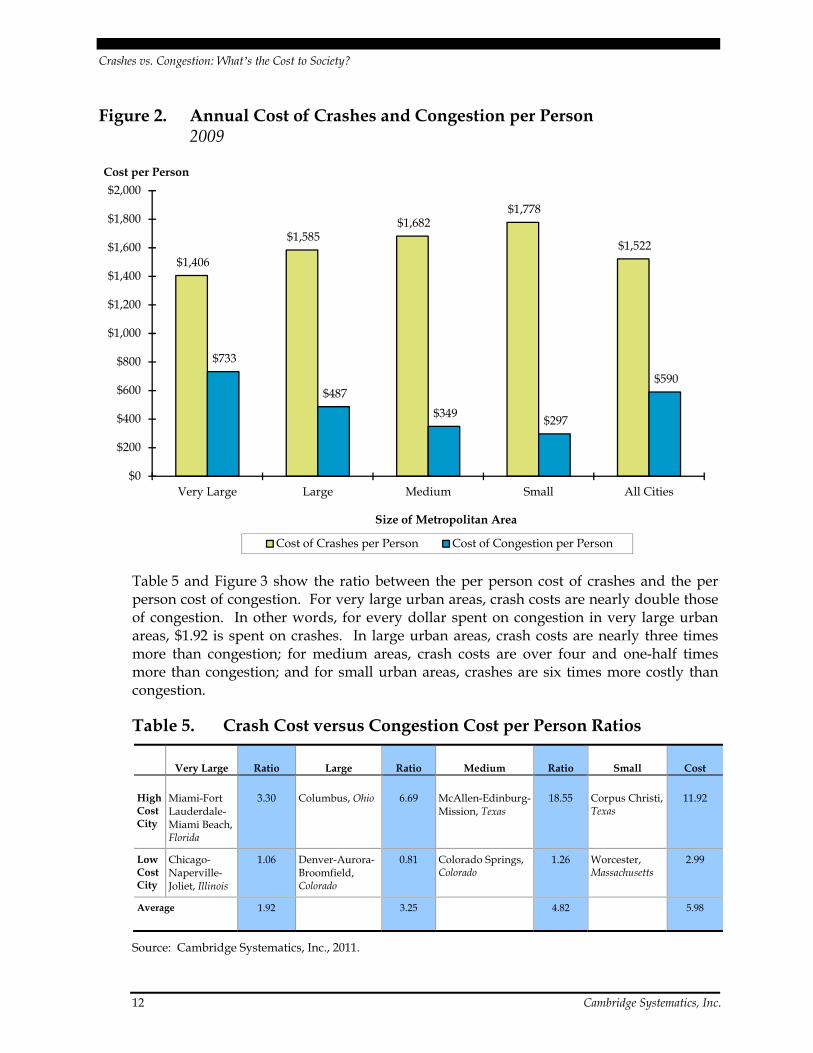
The cost of congestion (excluding Boston-Cambridge-Quincy metropolitan area), as reported by the TTI in its Urban Mobility Report 2010, was estimated at $97.7 billion. The cost of crashes ($299.5 billion) is more than three times the cost of congestion in the same urban areas.
For an even-scale analysis, the average per person cost of crashes is compared to the average per person cost of congestion. Figure 2 shows the relationship between the two per person costs. In Figure 2, the yellow bars show the cost per person of fatal and injury crashes and the blue bars show the cost per person of congestion. As shown, the cost of crashes on a per person basis decreases as the size of the metropolitan area increases, while an increase in the size of the metropolitan area relates to a increase in congestion. However, in every city studied, the crash costs on a per person basis exceed the congestion costs.
Crashes vs. Congestion: What’s the Cost to Society?
12 Cambridge Systematics, Inc.
Figure 2. Annual Cost of Crashes and Congestion per Person 2009
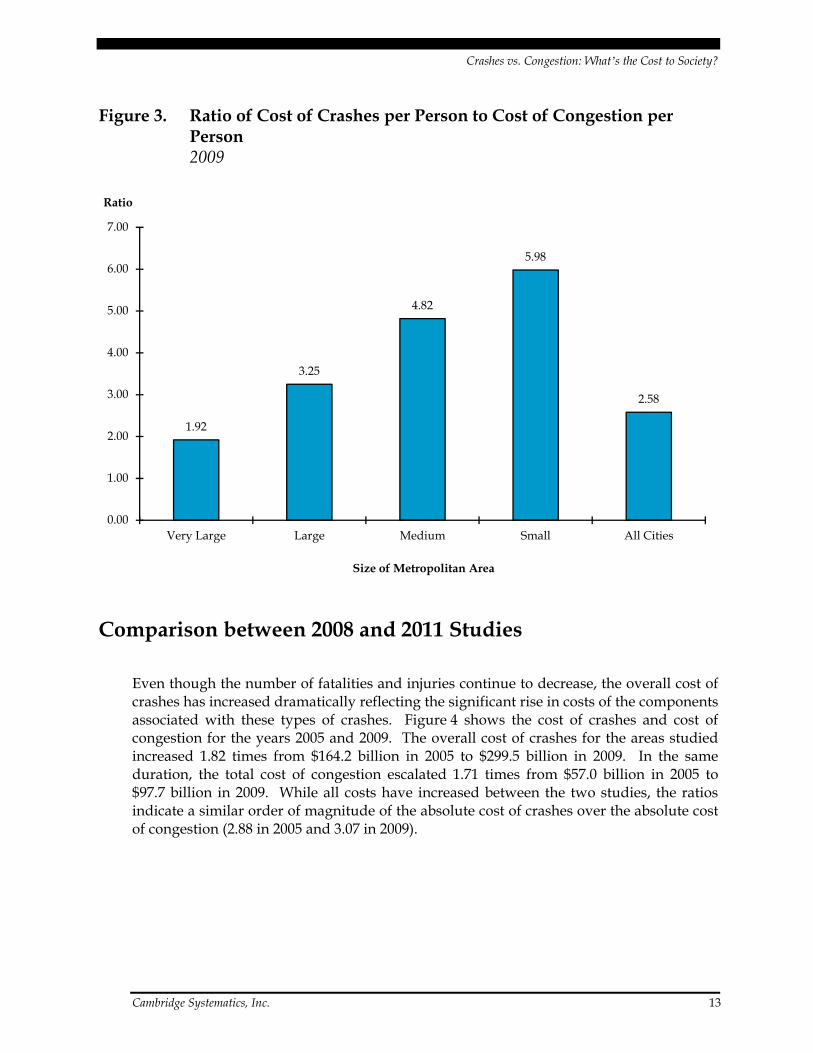
Table 5 and Figure 3 show the ratio between the per person cost of crashes and the per person cost of congestion. For very large urban areas, crash costs are nearly double those of congestion. In other words, for every dollar spent on congestion in very large urban areas, $1.92 is spent on crashes. In large urban areas, crash costs are nearly three times more than congestion; for medium areas, crash costs are over four and one-half times more than congestion; and for small urban areas, crashes are six times more costly than congestion.
Table 5. Crash Cost versus Congestion Cost per Person Ratios
Very Large Ratio Large Ratio Medium Ratio Small Cost
High Cost City
Miami-Fort Lauderdale-Miami Beach, Florida
3.30 Columbus, Ohio 6.69 McAllen-Edinburg-Mission, Texas
18.55 Corpus Christi, Texas
11.92
Low Cost City
Chicago-Naperville-Joliet, Illinois
1.06 Denver-Aurora-Broomfield, Colorado
0.81 Colorado Springs, Colorado
1.26 Worcester, Massachusetts
2.99
Average 1.92 3.25 4.82 5.98
Source: Cambridge Systematics, Inc., 2011.
$1,406
$1,585 $1,682
$1,778
$1,522
$733
$487
$349 $297
$590
$0
$200
$400
$600
$800
$1,000
$1,200
$1,400
$1,600
$1,800
$2,000
Very Large Large Medium Small All Cities
Cost per Person
Size of Metropolitan Area
Cost of Crashes per Person Cost of Congestion per Person
Crashes vs. Congestion: What’s the Cost to Society?
Cambridge Systematics, Inc. 13
Figure 3. Ratio of Cost of Crashes per Person to Cost of Congestion per Person 2009
Comparison between 2008 and 2011 Studies
Even though the number of fatalities and injuries continue to decrease, the overall cost of crashes has increased dramatically reflecting the significant rise in costs of the components associated with these types of crashes. Figure 4 shows the cost of crashes and cost of congestion for the years 2005 and 2009. The overall cost of crashes for the areas studied increased 1.82 times from $164.2 billion in 2005 to $299.5 billion in 2009. In the same duration, the total cost of congestion escalated 1.71 times from $57.0 billion in 2005 to $97.7 billion in 2009. While all costs have increased between the two studies, the ratios indicate a similar order of magnitude of the absolute cost of crashes over the absolute cost of congestion (2.88 in 2005 and 3.07 in 2009).
1.92
3.25
4.82
5.98
2.58
0.00
1.00
2.00
3.00
4.00
5.00
6.00
7.00
Very Large Large Medium Small All Cities
Ratio
Size of Metropolitan Area

Crashes vs. Congestion: What’s the Cost to Society?
14 Cambridge Systematics, Inc.
Figure 4. Cost of Crashes and Cost of Congestion (in Billions) 2005 versus 2009
Figure 5 compares the cost of crashes (per person) to cost of congestion (per person) for 2005 and 2009. The per person ratio of crashes to congestion increased from 2.44 in 2005 to 2.58 in 2009.
Figure 5. Cost of Crashes per Person and Cost of Congestion per Person 2005 versus 2009
$164.2
$299.5
$57.0
$97.7
$0
$50
$100
$150
$200
$250
$300
$350
2005 2009
Cost of Crashes Cost of Congestion
Total Cost (in Billions)
$1,051
$1,522
$430
$590
$-
$200
$400
$600
$800
$1,000
$1,200
$1,400
$1,600
2005 2009
Cost of Crashes Cost of Congestion
Cost per Person

Crashes vs. Congestion: What’s the Cost to Society?
Cambridge Systematics, Inc. 15
Key Findings
Several results from this study offer significant insight regarding the cost of crashes versus the cost of congestion:
In the urbanized areas in this study, the total cost of traffic crashes is over three times the cost of congestion – $299.5 billion for traffic crashes and $97.7 billion for congestion.
In every city studied, the crash costs on a per person basis exceed the congestion costs. Overall, crash costs per person is more than two and one-half times the cost of congestion. For very large urban areas, crash costs are nearly double those of congestion. In large urban areas, crash costs are over three times more than congestion; for medium areas, crash costs are over four and one-half times more than congestion; and for small urban areas, crashes are nearly six times more costly than congestion.
The cost of crashes on a per person basis decreases as the size of the metropolitan area increases. An inverse relationship occurs with the cost of congestion, which increases based on the size of the metropolitan area.
Crashes vs. Congestion: What’s the Cost to Society?
16 Cambridge Systematics, Inc.
Report Recommendations
While progress has been made to change the culture of traffic safety in the United States, continued improvement is possible and imperative. Such progress will continue to take all the “tools” in the traffic safety toolbox, plus some new thinking about approaches. Complacency regarding safety continues to be a significant challenge. No single action or strategy will bring about a cultural change. Rather, new approaches are needed to enhance public support for increased funding and to help transportation planners focus on areas with the greatest potential for improving safety.
Leadership
Make safety a national priority. Leadership and commitment are needed to make transportation safety a national priority and an integral part of transportation planning. Changing the culture of complacency as it relates to lives lost on the nation’s roads should be a guiding principle for all transportation-related discussions going forward. Focusing planning and resources on safety improvements will not only save lives and prevent injuries, but can also reduce congestion.
Increase investment in proven safety countermeasures. By focusing investment on proven countermeasures, we can demonstrate measurable results and show a meaningful return on these investments.
Pass good laws and enforce them. Greater political will is needed to pass legislation and enforce laws having a positive impact on safety, such as primary safety belt requirements, impaired driving countermeasures, and full implementation of graduated driver licensing systems.
Ensure implementation and evaluation of state highway safety plans. Congress and the U.S. Department of Transportation should ensure states follow through on implementation of their strategic highway safety plans and evaluate the results to determine effectiveness. Greater accountability is needed to ensure that states are meeting the goals of their highway safety improvement plans and implementing those strategies that have greatest opportunity for saving lives.
Make zero fatalities a national goal. Achieving zero fatalities should be the national safety goal. AAA recommends convening a White House Conference of Traffic Safety to develop a national strategic plan to put the nation on a course to reach this goal.
Crashes vs. Congestion: What’s the Cost to Society?
Cambridge Systematics, Inc. 17
Communication and Collaboration
Break down silos. Increased communication and support between federal agencies responsible for transportation safety related issues is critical. Governmental agencies should leverage resources and foster collaboration in order to eliminate duplication and help identify and promote public health programmatic and policy interventions shown to prevent injuries and save lives.
Communicate the consequences more effectively. The transportation safety community needs to develop more effective ways of getting the public to understand the impact of traffic crashes, the need for effective countermeasures, and the role their own behavior plays in safety.
Increase collaboration between disciplines. Increased collaboration among traffic safety professionals, public health specialists, and health communications experts is needed to incorporate the best available science on behavior modification.
Research and Evaluation
Increase funding for testing and evaluation of safety interventions. Programs should be based on sound scientific principles rather than “conventional wisdom,” populist fervor, or political expediency. Systematic evaluation allows identification and expansion of successful programs and interventions so limited resources can be applied more effectively.
Emphasize performance-based planning. Further testing and implementation of road risk assessment tools (e.g., U.S. Road Assessment Program (usRAP), FHWA’s Systemic Safety Project Selection Tool, SafetyAnalyst, and Vision Zero Suite) should be encouraged to ensure dollars are spent on roads and bridges with the greatest safety problems. Understanding road safety risks will help state DOTs focus on solutions with the greatest safety benefits and should result in broader public support for needed improvements.
Increase funding for data collection systems. Data should meet model minimum uniform standards and should be provided by each state. National data are needed on serious injuries sustained in traffic crashes in order to improve traffic safety research and to foster evidence based decision-making. To achieve this goal states need funding to link crash, emergency department, and trauma registry databases.

Crashes vs. Congestion: What’s the Cost to Society?
Cambridge Systematics, Inc. A-1
Appendix A – Complete Statistics
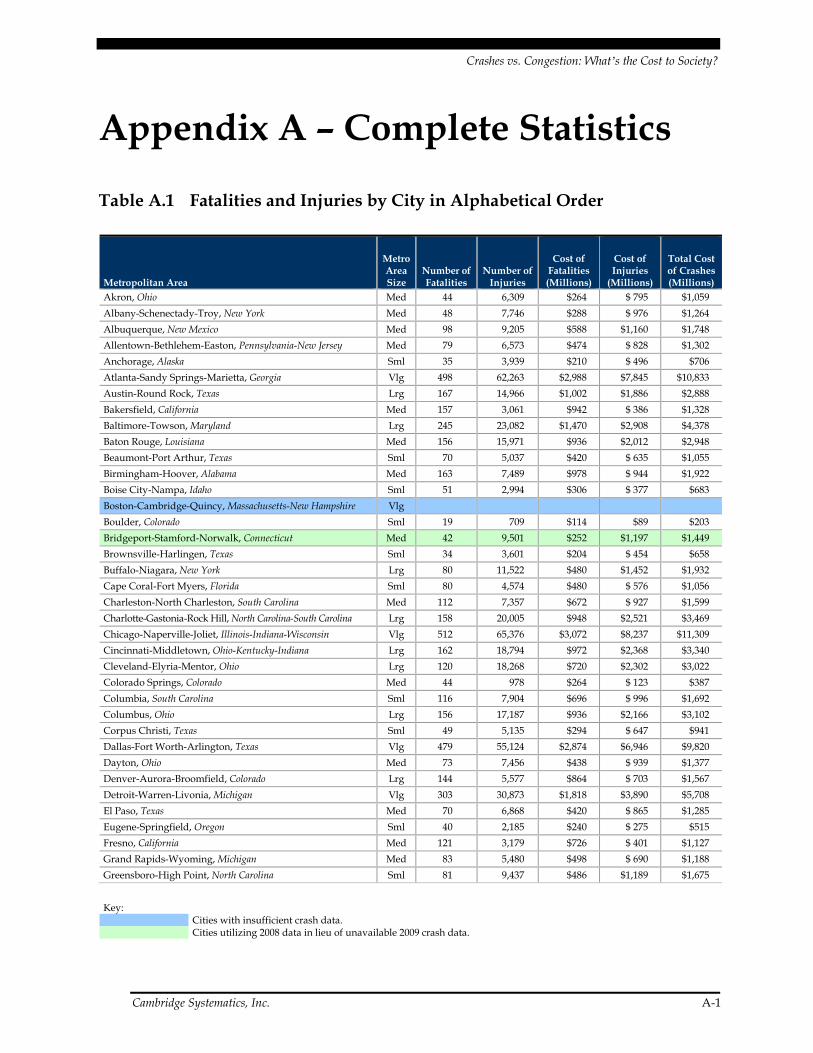
Table A.1 Fatalities and Injuries by City in Alphabetical Order
Metropolitan Area
Metro Area Size
Number of Fatalities
Number of Injuries
Cost of Fatalities (Millions)
Cost of Injuries
(Millions)
Total Cost of Crashes (Millions)
Akron, Ohio Med 44 6,309 $264 $ 795 $1,059
Albany-Schenectady-Troy, New York Med 48 7,746 $288 $ 976 $1,264
Albuquerque, New Mexico Med 98 9,205 $588 $1,160 $1,748
Allentown-Bethlehem-Easton, Pennsylvania-New Jersey Med 79 6,573 $474 $ 828 $1,302
Anchorage, Alaska Sml 35 3,939 $210 $ 496 $706
Atlanta-Sandy Springs-Marietta, Georgia Vlg 498 62,263 $2,988 $7,845 $10,833
Austin-Round Rock, Texas Lrg 167 14,966 $1,002 $1,886 $2,888
Bakersfield, California Med 157 3,061 $942 $ 386 $1,328
Baltimore-Towson, Maryland Lrg 245 23,082 $1,470 $2,908 $4,378
Baton Rouge, Louisiana Med 156 15,971 $936 $2,012 $2,948
Beaumont-Port Arthur, Texas Sml 70 5,037 $420 $ 635 $1,055
Birmingham-Hoover, Alabama Med 163 7,489 $978 $ 944 $1,922
Boise City-Nampa, Idaho Sml 51 2,994 $306 $ 377 $683
Boston-Cambridge-Quincy, Massachusetts-New Hampshire Vlg
Boulder, Colorado Sml 19 709 $114 $89 $203
Bridgeport-Stamford-Norwalk, Connecticut Med 42 9,501 $252 $1,197 $1,449
Brownsville-Harlingen, Texas Sml 34 3,601 $204 $ 454 $658
Buffalo-Niagara, New York Lrg 80 11,522 $480 $1,452 $1,932
Cape Coral-Fort Myers, Florida Sml 80 4,574 $480 $ 576 $1,056
Charleston-North Charleston, South Carolina Med 112 7,357 $672 $ 927 $1,599
Charlotte-Gastonia-Rock Hill, North Carolina-South Carolina Lrg 158 20,005 $948 $2,521 $3,469
Chicago-Naperville-Joliet, Illinois-Indiana-Wisconsin Vlg 512 65,376 $3,072 $8,237 $11,309
Cincinnati-Middletown, Ohio-Kentucky-Indiana Lrg 162 18,794 $972 $2,368 $3,340
Cleveland-Elyria-Mentor, Ohio Lrg 120 18,268 $720 $2,302 $3,022
Colorado Springs, Colorado Med 44 978 $264 $ 123 $387
Columbia, South Carolina Sml 116 7,904 $696 $ 996 $1,692
Columbus, Ohio Lrg 156 17,187 $936 $2,166 $3,102
Corpus Christi, Texas Sml 49 5,135 $294 $ 647 $941
Dallas-Fort Worth-Arlington, Texas Vlg 479 55,124 $2,874 $6,946 $9,820
Dayton, Ohio Med 73 7,456 $438 $ 939 $1,377
Denver-Aurora-Broomfield, Colorado Lrg 144 5,577 $864 $ 703 $1,567
Detroit-Warren-Livonia, Michigan Vlg 303 30,873 $1,818 $3,890 $5,708
El Paso, Texas Med 70 6,868 $420 $ 865 $1,285
Eugene-Springfield, Oregon Sml 40 2,185 $240 $ 275 $515
Fresno, California Med 121 3,179 $726 $ 401 $1,127
Grand Rapids-Wyoming, Michigan Med 83 5,480 $498 $ 690 $1,188
Greensboro-High Point, North Carolina Sml 81 9,437 $486 $1,189 $1,675
Key: Cities with insufficient crash data. Cities utilizing 2008 data in lieu of unavailable 2009 crash data.
Crashes vs. Congestion: What’s the Cost to Society?
A-2 Cambridge Systematics, Inc.
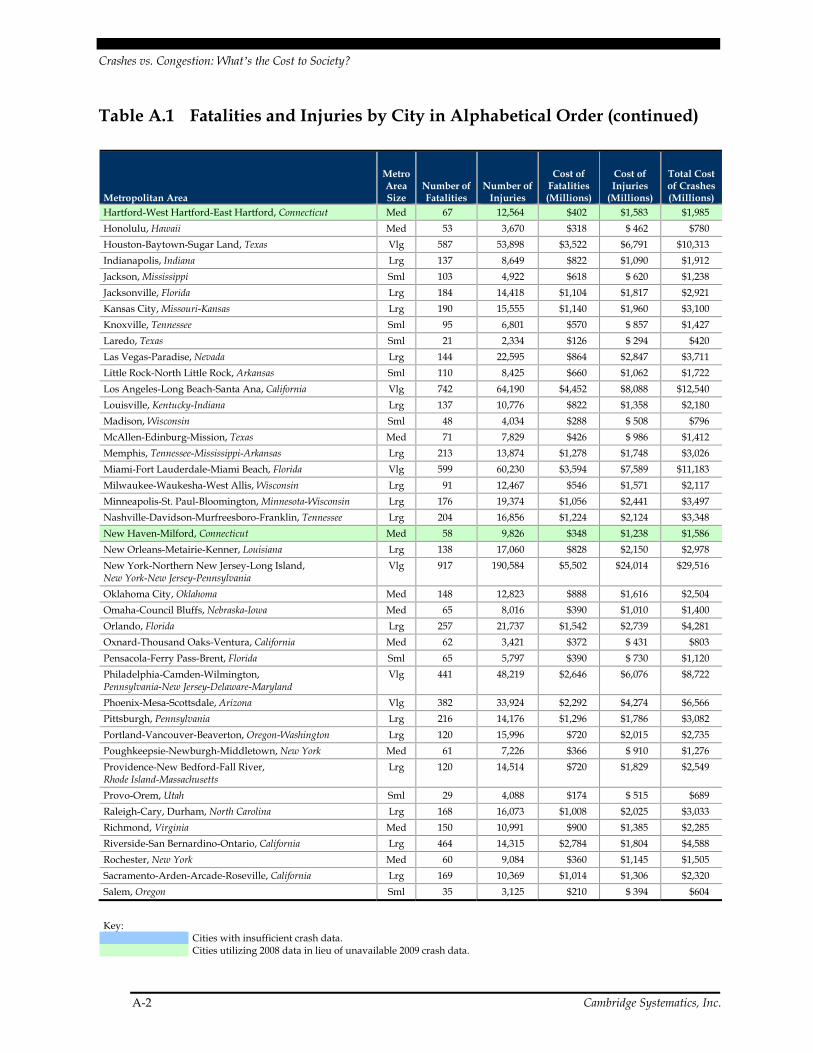
Table A.1 Fatalities and Injuries by City in Alphabetical Order (continued)
Metropolitan Area
Metro Area Size
Number of Fatalities
Number of Injuries
Cost of Fatalities (Millions)
Cost of Injuries
(Millions)
Total Cost of Crashes (Millions)
Hartford-West Hartford-East Hartford, Connecticut Med 67 12,564 $402 $1,583 $1,985
Honolulu, Hawaii Med 53 3,670 $318 $ 462 $780
Houston-Baytown-Sugar Land, Texas Vlg 587 53,898 $3,522 $6,791 $10,313
Indianapolis, Indiana Lrg 137 8,649 $822 $1,090 $1,912
Jackson, Mississippi Sml 103 4,922 $618 $ 620 $1,238
Jacksonville, Florida Lrg 184 14,418 $1,104 $1,817 $2,921
Kansas City, Missouri-Kansas Lrg 190 15,555 $1,140 $1,960 $3,100
Knoxville, Tennessee Sml 95 6,801 $570 $ 857 $1,427
Laredo, Texas Sml 21 2,334 $126 $ 294 $420
Las Vegas-Paradise, Nevada Lrg 144 22,595 $864 $2,847 $3,711
Little Rock-North Little Rock, Arkansas Sml 110 8,425 $660 $1,062 $1,722
Los Angeles-Long Beach-Santa Ana, California Vlg 742 64,190 $4,452 $8,088 $12,540
Louisville, Kentucky-Indiana Lrg 137 10,776 $822 $1,358 $2,180
Madison, Wisconsin Sml 48 4,034 $288 $ 508 $796
McAllen-Edinburg-Mission, Texas Med 71 7,829 $426 $ 986 $1,412
Memphis, Tennessee-Mississippi-Arkansas Lrg 213 13,874 $1,278 $1,748 $3,026
Miami-Fort Lauderdale-Miami Beach, Florida Vlg 599 60,230 $3,594 $7,589 $11,183
Milwaukee-Waukesha-West Allis, Wisconsin Lrg 91 12,467 $546 $1,571 $2,117
Minneapolis-St. Paul-Bloomington, Minnesota-Wisconsin Lrg 176 19,374 $1,056 $2,441 $3,497
Nashville-Davidson-Murfreesboro-Franklin, Tennessee Lrg 204 16,856 $1,224 $2,124 $3,348
New Haven-Milford, Connecticut Med 58 9,826 $348 $1,238 $1,586
New Orleans-Metairie-Kenner, Louisiana Lrg 138 17,060 $828 $2,150 $2,978
New York-Northern New Jersey-Long Island, New York-New Jersey-Pennsylvania
Vlg 917 190,584 $5,502 $24,014 $29,516
Oklahoma City, Oklahoma Med 148 12,823 $888 $1,616 $2,504
Omaha-Council Bluffs, Nebraska-Iowa Med 65 8,016 $390 $1,010 $1,400
Orlando, Florida Lrg 257 21,737 $1,542 $2,739 $4,281
Oxnard-Thousand Oaks-Ventura, California Med 62 3,421 $372 $ 431 $803
Pensacola-Ferry Pass-Brent, Florida Sml 65 5,797 $390 $ 730 $1,120
Philadelphia-Camden-Wilmington, Pennsylvania-New Jersey-Delaware-Maryland
Vlg 441 48,219 $2,646 $6,076 $8,722
Phoenix-Mesa-Scottsdale, Arizona Vlg 382 33,924 $2,292 $4,274 $6,566
Pittsburgh, Pennsylvania Lrg 216 14,176 $1,296 $1,786 $3,082
Portland-Vancouver-Beaverton, Oregon-Washington Lrg 120 15,996 $720 $2,015 $2,735
Poughkeepsie-Newburgh-Middletown, New York Med 61 7,226 $366 $ 910 $1,276
Providence-New Bedford-Fall River, Rhode Island-Massachusetts
Lrg 120 14,514 $720 $1,829 $2,549
Provo-Orem, Utah Sml 29 4,088 $174 $ 515 $689
Raleigh-Cary, Durham, North Carolina Lrg 168 16,073 $1,008 $2,025 $3,033
Richmond, Virginia Med 150 10,991 $900 $1,385 $2,285
Riverside-San Bernardino-Ontario, California Lrg 464 14,315 $2,784 $1,804 $4,588
Rochester, New York Med 60 9,084 $360 $1,145 $1,505
Sacramento-Arden-Arcade-Roseville, California Lrg 169 10,369 $1,014 $1,306 $2,320
Salem, Oregon Sml 35 3,125 $210 $ 394 $604
Key: Cities with insufficient crash data. Cities utilizing 2008 data in lieu of unavailable 2009 crash data.

Crashes vs. Congestion: What’s the Cost to Society?
Cambridge Systematics, Inc. A-3
Table A.1 Fatalities and Injuries by City in Alphabetical Order (continued)
Metropolitan Area
Metro Area Size
Number of Fatalities
Number of Injuries
Cost of Fatalities (Millions)
Cost of Injuries
(Millions)
Total Cost of Crashes (Millions)
Salt Lake City, Utah Med 67 10,082 $402 $1,270 $1,672
San Antonio, Texas Lrg 233 23,318 $1,398 $2,938 $4,336
San Diego-Carlsbad-San Marcos, California Vlg 232 12,998 $1,392 $1,638 $3,030
San Francisco-Oakland-Fremont, California Vlg 224 16,625 $1,344 $2,095 $3,439
San Jose-Sunnyvale-Santa Clara, California Lrg 92 6,675 $552 $ 841 $1,393
San Juan-Caguas-Guaynabo, Puerto Rico Lrg 229 24,315 $1,374 $3,064 $4,438
Sarasota-Bradenton-Venice, Florida Med 77 6,119 $462 $ 771 $1,233
Seattle-Tacoma-Bellevue, Washington Vlg 169 26,379 $1,014 $3,324 $4,338
Spokane, Washington Sml 44 3,429 $264 $ 432 $696
Springfield, Massachusetts Med 41 2,930 $246 $ 369 $615
St. Louis, Missouri-Illinois Lrg 278 24,432 $1,668 $3,078 $4,746
Stockton, California Sml 63 3,333 $378 $ 420 $798
Tampa-St. Petersburg-Clearwater, Florida Lrg 353 36,000 $2,118 $4,536 $6,654
Toledo, Ohio Med 59 7,211 $354 $ 909 $1,263
Tucson, Arizona Med 92 7,926 $552 $ 999 $1,551
Tulsa, Oklahoma Med 163 9,989 $978 $1,259 $2,237
Virginia Beach-Norfolk-Newport News, Virginia-North Carolina
Lrg 124 14,095 $744 $1,776 $2,520
Washington-Arlington-Alexandria, D.C.-Virginia-Maryland-West Virginia
Vlg 350 42,566 $2,100 $5,363 $7,463
Wichita, Kansas Med 67 5,313 $402 $ 669 $1,071
Winston-Salem, North Carolina Sml 47 5,122 $282 $ 645 $927
Worcester, Massachusetts Sml 42 3,829 $252 $ 482 $734
Source: Cambridge Systematics, Inc., 2011.
Key: Cities with insufficient crash data. Cities utilizing 2008 data in lieu of unavailable 2009 crash data.
Crashes vs. Congestion: What’s the Cost to Society?
A-4 Cambridge Systematics, Inc.
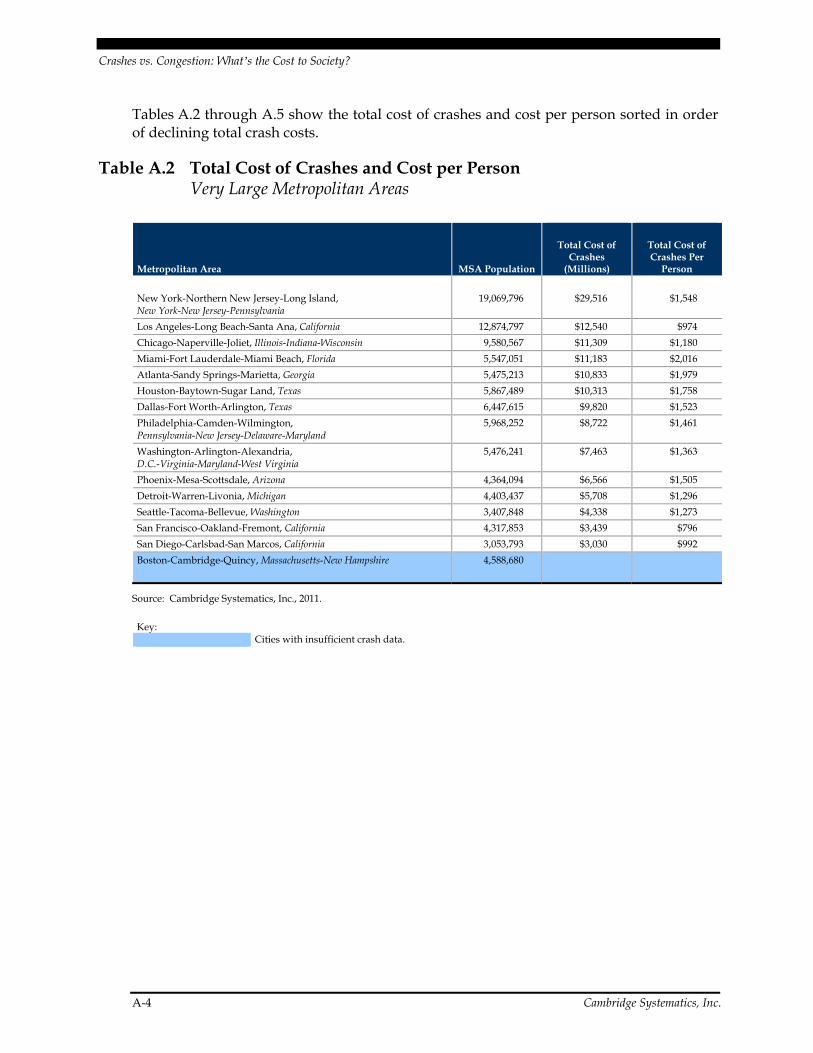
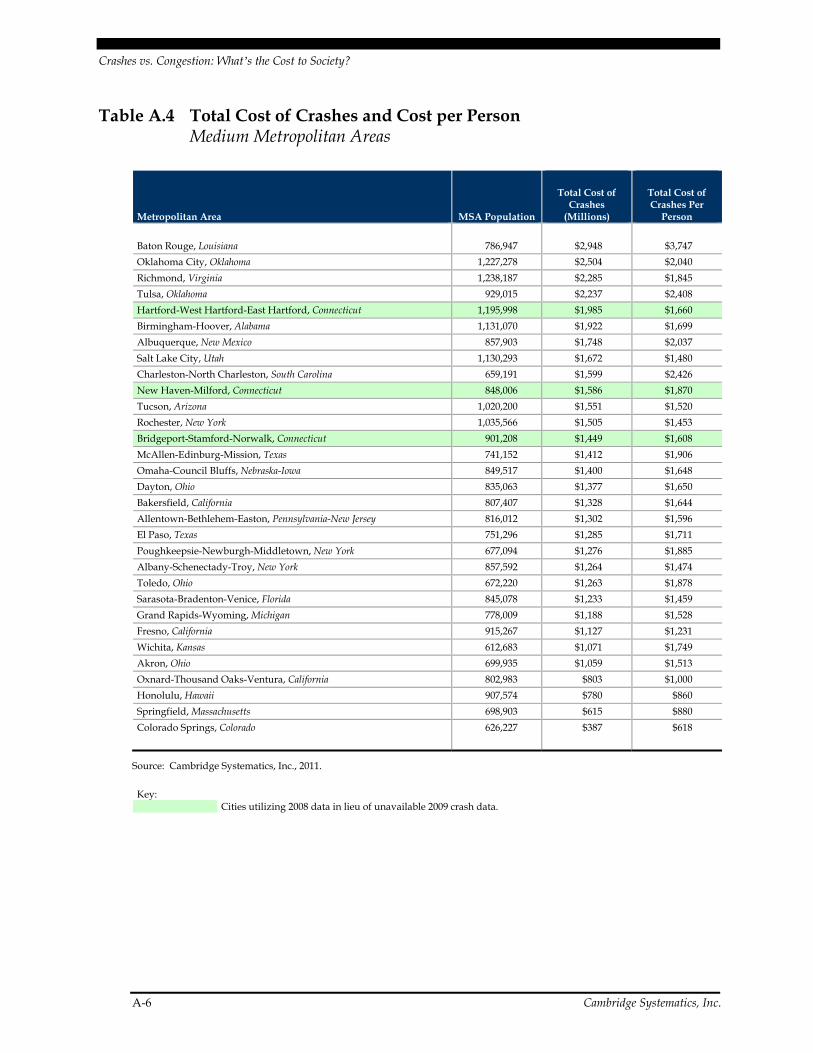
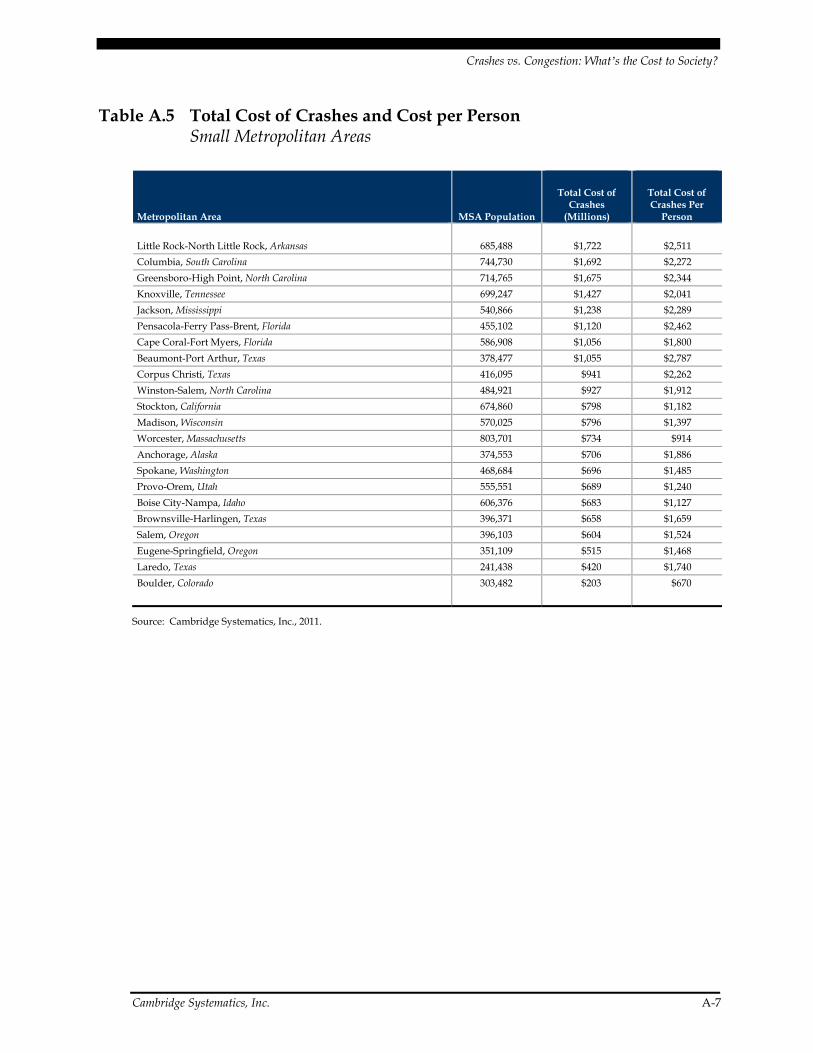
Tables A.2 through A.5 show the total cost of crashes and cost per person sorted in order of declining total crash costs.
Table A.2 Total Cost of Crashes and Cost per Person Very Large Metropolitan Areas
Metropolitan Area MSA Population
Total Cost of Crashes
(Millions)
Total Cost of Crashes Per
Person
New York-Northern New Jersey-Long Island, New York-New Jersey-Pennsylvania
19,069,796 $29,516 $1,548
Los Angeles-Long Beach-Santa Ana, California 12,874,797 $12,540 $974
Chicago-Naperville-Joliet, Illinois-Indiana-Wisconsin 9,580,567 $11,309 $1,180
Miami-Fort Lauderdale-Miami Beach, Florida 5,547,051 $11,183 $2,016
Atlanta-Sandy Springs-Marietta, Georgia 5,475,213 $10,833 $1,979
Houston-Baytown-Sugar Land, Texas 5,867,489 $10,313 $1,758
Dallas-Fort Worth-Arlington, Texas 6,447,615 $9,820 $1,523
Philadelphia-Camden-Wilmington, Pennsylvania-New Jersey-Delaware-Maryland
5,968,252 $8,722 $1,461
Washington-Arlington-Alexandria, D.C.-Virginia-Maryland-West Virginia
5,476,241 $7,463 $1,363
Phoenix-Mesa-Scottsdale, Arizona 4,364,094 $6,566 $1,505
Detroit-Warren-Livonia, Michigan 4,403,437 $5,708 $1,296
Seattle-Tacoma-Bellevue, Washington 3,407,848 $4,338 $1,273
San Francisco-Oakland-Fremont, California 4,317,853 $3,439 $796
San Diego-Carlsbad-San Marcos, California 3,053,793 $3,030 $992
Boston-Cambridge-Quincy, Massachusetts-New Hampshire 4,588,680
Source: Cambridge Systematics, Inc., 2011.
Key: Cities with insufficient crash data.

Crashes vs. Congestion: What’s the Cost to Society?
Cambridge Systematics, Inc. A-5
Table A.3 Total Cost of Crashes and Cost per Person Large Metropolitan Areas
Metropolitan Area MSA Population
Total Cost of Crashes
(Millions)
Total Cost of Crashes Per
Person
Tampa-St. Petersburg-Clearwater, Florida 2,747,272 $6,654 $2,422
St. Louis, Missouri-Illinois 2,828,990 $4,746 $1,678
Riverside-San Bernardino-Ontario, California 4,143,113 $4,588 $1,107
San Juan-Caguas-Guaynabo, Puerto Rico 2,617,089 $4,438 $1,696
Baltimore-Towson, Maryland 2,690,886 $4,378 $1,627
San Antonio, Texas 2,072,128 $4,336 $2,093
Orlando, Florida 2,082,421 $4,281 $2,056
Las Vegas-Paradise, Nevada 1,902,834 $3,711 $1,950
Minneapolis-St. Paul-Bloomington, Minnesota-Wisconsin 3,269,814 $3,497 $1,070
Charlotte-Gastonia-Rock Hill, North Carolina-South Carolina 1,745,524 $3,469 $1,987
Nashville-Davidson-Murfreesboro-Franklin, Tennessee 1,582,264 $3,348 $2,116
Cincinnati-Middletown, Ohio-Kentucky-Indiana 2,171,896 $3,340 $1,538
Columbus, Ohio 1,801,848 $3,102 $1,721
Kansas City, Missouri-Kansas 2,067,585 $3,100 $1,499
Pittsburgh, Pennsylvania 2,354,957 $3,082 $1,309
Raleigh-Cary, Durham, North Carolina 1,125,827 $3,033 $2,694
Memphis, Tennessee-Mississippi-Arkansas 1,304,926 $3,026 $2,319
Cleveland-Elyria-Mentor, Ohio 2,091,286 $3,022 $1,445
New Orleans-Metairie-Kenner, Louisiana 1,189,981 $2,978 $2,502
Jacksonville, Florida 1,328,144 $2,921 $2,199
Austin-Round Rock, Texas 1,705,075 $2,888 $1,694
Portland-Vancouver-Beaverton, Oregon-Washington 2,241,841 $2,735 $1,220
Providence-New Bedford-Fall River, Rhode Island-Massachusetts
1,600,642 $2,549 $1,592
Virginia Beach-Norfolk-Newport News, Virginia-North Carolina
1,674,498 $2,520 $1,505
Sacramento-Arden-Arcade-Roseville, California 2,127,355 $2,320 $1,091
Louisville, Kentucky-Indiana 1,258,577 $2,180 $1,732
Milwaukee-Waukesha-West Allis, Wisconsin 1,559,667 $2,117 $1,357
Buffalo-Niagara, New York 1,123,804 $1,932 $1,719
Indianapolis, Indiana 1,743,658 $1,912 $1,096
Denver-Aurora-Broomfield, Colorado 2,552,195 $1,567 $614
San Jose-Sunnyvale-Santa Clara, California 1,839,700 $1,393 $757
Source: Cambridge Systematics, Inc., 2011.
Crashes vs. Congestion: What’s the Cost to Society?
A-6 Cambridge Systematics, Inc.
Table A.4 Total Cost of Crashes and Cost per Person Medium Metropolitan Areas
Metropolitan Area MSA Population
Total Cost of Crashes
(Millions)
Total Cost of Crashes Per
Person
Baton Rouge, Louisiana 786,947 $2,948 $3,747
Oklahoma City, Oklahoma 1,227,278 $2,504 $2,040
Richmond, Virginia 1,238,187 $2,285 $1,845
Tulsa, Oklahoma 929,015 $2,237 $2,408
Hartford-West Hartford-East Hartford, Connecticut 1,195,998 $1,985 $1,660
Birmingham-Hoover, Alabama 1,131,070 $1,922 $1,699
Albuquerque, New Mexico 857,903 $1,748 $2,037
Salt Lake City, Utah 1,130,293 $1,672 $1,480
Charleston-North Charleston, South Carolina 659,191 $1,599 $2,426
New Haven-Milford, Connecticut 848,006 $1,586 $1,870
Tucson, Arizona 1,020,200 $1,551 $1,520
Rochester, New York 1,035,566 $1,505 $1,453
Bridgeport-Stamford-Norwalk, Connecticut 901,208 $1,449 $1,608
McAllen-Edinburg-Mission, Texas 741,152 $1,412 $1,906
Omaha-Council Bluffs, Nebraska-Iowa 849,517 $1,400 $1,648
Dayton, Ohio 835,063 $1,377 $1,650
Bakersfield, California 807,407 $1,328 $1,644
Allentown-Bethlehem-Easton, Pennsylvania-New Jersey 816,012 $1,302 $1,596
El Paso, Texas 751,296 $1,285 $1,711
Poughkeepsie-Newburgh-Middletown, New York 677,094 $1,276 $1,885
Albany-Schenectady-Troy, New York 857,592 $1,264 $1,474
Toledo, Ohio 672,220 $1,263 $1,878
Sarasota-Bradenton-Venice, Florida 845,078 $1,233 $1,459
Grand Rapids-Wyoming, Michigan 778,009 $1,188 $1,528
Fresno, California 915,267 $1,127 $1,231
Wichita, Kansas 612,683 $1,071 $1,749
Akron, Ohio 699,935 $1,059 $1,513
Oxnard-Thousand Oaks-Ventura, California 802,983 $803 $1,000
Honolulu, Hawaii 907,574 $780 $860
Springfield, Massachusetts 698,903 $615 $880
Colorado Springs, Colorado 626,227 $387 $618
Source: Cambridge Systematics, Inc., 2011.
Key: Cities utilizing 2008 data in lieu of unavailable 2009 crash data.
Crashes vs. Congestion: What’s the Cost to Society?
Cambridge Systematics, Inc. A-7
Table A.5 Total Cost of Crashes and Cost per Person Small Metropolitan Areas
Metropolitan Area MSA Population
Total Cost of Crashes
(Millions)
Total Cost of Crashes Per
Person
Little Rock-North Little Rock, Arkansas 685,488 $1,722 $2,511
Columbia, South Carolina 744,730 $1,692 $2,272
Greensboro-High Point, North Carolina 714,765 $1,675 $2,344
Knoxville, Tennessee 699,247 $1,427 $2,041
Jackson, Mississippi 540,866 $1,238 $2,289
Pensacola-Ferry Pass-Brent, Florida 455,102 $1,120 $2,462
Cape Coral-Fort Myers, Florida 586,908 $1,056 $1,800
Beaumont-Port Arthur, Texas 378,477 $1,055 $2,787
Corpus Christi, Texas 416,095 $941 $2,262
Winston-Salem, North Carolina 484,921 $927 $1,912
Stockton, California 674,860 $798 $1,182
Madison, Wisconsin 570,025 $796 $1,397
Worcester, Massachusetts 803,701 $734 $914
Anchorage, Alaska 374,553 $706 $1,886
Spokane, Washington 468,684 $696 $1,485
Provo-Orem, Utah 555,551 $689 $1,240
Boise City-Nampa, Idaho 606,376 $683 $1,127
Brownsville-Harlingen, Texas 396,371 $658 $1,659
Salem, Oregon 396,103 $604 $1,524
Eugene-Springfield, Oregon 351,109 $515 $1,468
Laredo, Texas 241,438 $420 $1,740
Boulder, Colorado 303,482 $203 $670
Source: Cambridge Systematics, Inc., 2011.
Crashes vs. Congestion: What’s the Cost to Society?
A-8 Cambridge Systematics, Inc.
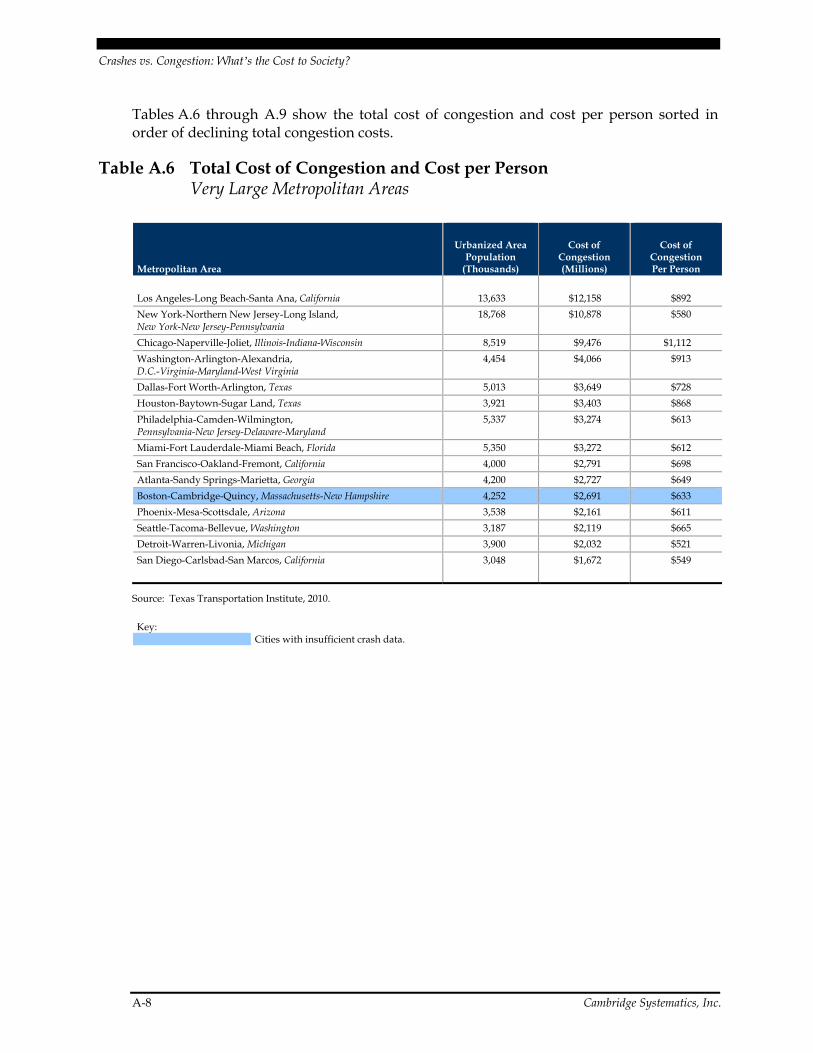
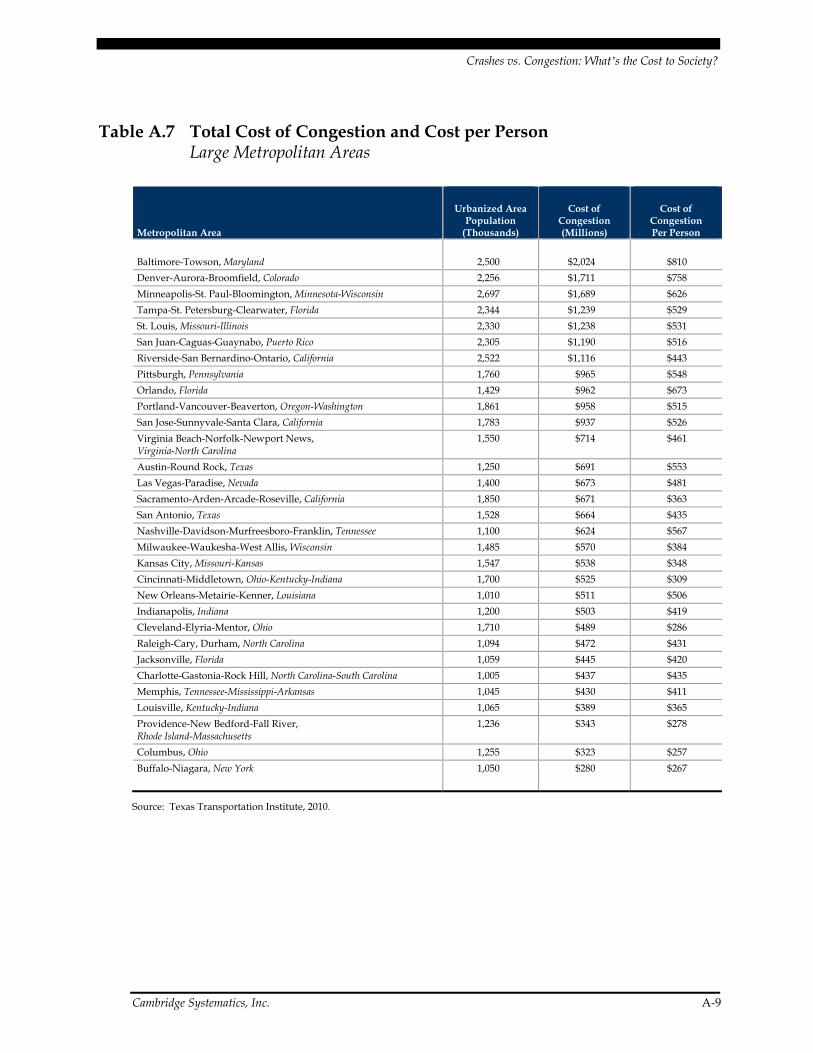
Tables A.6 through A.9 show the total cost of congestion and cost per person sorted in order of declining total congestion costs.
Table A.6 Total Cost of Congestion and Cost per Person Very Large Metropolitan Areas
Metropolitan Area
Urbanized Area Population
(Thousands)
Cost of Congestion (Millions)
Cost of Congestion Per Person
Los Angeles-Long Beach-Santa Ana, California 13,633 $12,158 $892
New York-Northern New Jersey-Long Island, New York-New Jersey-Pennsylvania
18,768 $10,878 $580
Chicago-Naperville-Joliet, Illinois-Indiana-Wisconsin 8,519 $9,476 $1,112
Washington-Arlington-Alexandria, D.C.-Virginia-Maryland-West Virginia
4,454 $4,066 $913
Dallas-Fort Worth-Arlington, Texas 5,013 $3,649 $728
Houston-Baytown-Sugar Land, Texas 3,921 $3,403 $868
Philadelphia-Camden-Wilmington, Pennsylvania-New Jersey-Delaware-Maryland
5,337 $3,274 $613
Miami-Fort Lauderdale-Miami Beach, Florida 5,350 $3,272 $612
San Francisco-Oakland-Fremont, California 4,000 $2,791 $698
Atlanta-Sandy Springs-Marietta, Georgia 4,200 $2,727 $649
Boston-Cambridge-Quincy, Massachusetts-New Hampshire 4,252 $2,691 $633
Phoenix-Mesa-Scottsdale, Arizona 3,538 $2,161 $611
Seattle-Tacoma-Bellevue, Washington 3,187 $2,119 $665
Detroit-Warren-Livonia, Michigan 3,900 $2,032 $521
San Diego-Carlsbad-San Marcos, California 3,048 $1,672 $549
Source: Texas Transportation Institute, 2010.
Key: Cities with insufficient crash data.
Crashes vs. Congestion: What’s the Cost to Society?
Cambridge Systematics, Inc. A-9
Table A.7 Total Cost of Congestion and Cost per Person Large Metropolitan Areas
Metropolitan Area
Urbanized Area Population
(Thousands)
Cost of Congestion (Millions)
Cost of Congestion Per Person
Baltimore-Towson, Maryland 2,500 $2,024 $810
Denver-Aurora-Broomfield, Colorado 2,256 $1,711 $758
Minneapolis-St. Paul-Bloomington, Minnesota-Wisconsin 2,697 $1,689 $626
Tampa-St. Petersburg-Clearwater, Florida 2,344 $1,239 $529
St. Louis, Missouri-Illinois 2,330 $1,238 $531
San Juan-Caguas-Guaynabo, Puerto Rico 2,305 $1,190 $516
Riverside-San Bernardino-Ontario, California 2,522 $1,116 $443
Pittsburgh, Pennsylvania 1,760 $965 $548
Orlando, Florida 1,429 $962 $673
Portland-Vancouver-Beaverton, Oregon-Washington 1,861 $958 $515
San Jose-Sunnyvale-Santa Clara, California 1,783 $937 $526
Virginia Beach-Norfolk-Newport News, Virginia-North Carolina
1,550 $714 $461
Austin-Round Rock, Texas 1,250 $691 $553
Las Vegas-Paradise, Nevada 1,400 $673 $481
Sacramento-Arden-Arcade-Roseville, California 1,850 $671 $363
San Antonio, Texas 1,528 $664 $435
Nashville-Davidson-Murfreesboro-Franklin, Tennessee 1,100 $624 $567
Milwaukee-Waukesha-West Allis, Wisconsin 1,485 $570 $384
Kansas City, Missouri-Kansas 1,547 $538 $348
Cincinnati-Middletown, Ohio-Kentucky-Indiana 1,700 $525 $309
New Orleans-Metairie-Kenner, Louisiana 1,010 $511 $506
Indianapolis, Indiana 1,200 $503 $419
Cleveland-Elyria-Mentor, Ohio 1,710 $489 $286
Raleigh-Cary, Durham, North Carolina 1,094 $472 $431
Jacksonville, Florida 1,059 $445 $420
Charlotte-Gastonia-Rock Hill, North Carolina-South Carolina 1,005 $437 $435
Memphis, Tennessee-Mississippi-Arkansas 1,045 $430 $411
Louisville, Kentucky-Indiana 1,065 $389 $365
Providence-New Bedford-Fall River, Rhode Island-Massachusetts
1,236 $343 $278
Columbus, Ohio 1,255 $323 $257
Buffalo-Niagara, New York 1,050 $280 $267
Source: Texas Transportation Institute, 2010.
Crashes vs. Congestion: What’s the Cost to Society?
A-10 Cambridge Systematics, Inc.
Table A.8 Total Cost of Congestion and Cost per Person Medium Metropolitan Areas
Metropolitan Area
TTI Population
Group
Urbanized Area
Population (Thousands)
Cost of Congestion (Millions)
Cost of Congestion Per
Person
Bridgeport-Stamford-Norwalk, Connecticut Med 925 $507 $548
Salt Lake City, Utah Med 992 $415 $418
Baton Rouge, Louisiana Med 600 $387 $645
Birmingham-Hoover, Alabama Med 850 $380 $447
Oklahoma City, Oklahoma Med 950 $376 $396
Honolulu, Hawaii Med 709 $326 $460
Hartford-West Hartford-East Hartford, Connecticut Med 899 $321 $357
Tucson, Arizona Med 700 $317 $453
Albuquerque, New Mexico Med 613 $286 $467
New Haven-Milford, Connecticut Med 615 $285 $463
Richmond, Virginia Med 954 $279 $292
Colorado Springs, Colorado Med 540 $266 $493
El Paso, Texas Med 712 $242 $340
Allentown-Bethlehem-Easton, Pennsylvania-New Jersey
Med 628 $237 $377
Charleston-North Charleston, South Carolina Med 510 $227 $445
Oxnard-Thousand Oaks-Ventura, California Med 697 $216 $310
Tulsa, Oklahoma Med 700 $202 $289
Sarasota-Bradenton-Venice, Florida Med 678 $198 $292
Grand Rapids-Wyoming, Michigan Med 606 $193 $318
Albany-Schenectady-Troy, New York Med 612 $190 $310
Omaha-Council Bluffs, Nebraska-Iowa Med 630 $184 $292
Springfield, Massachusetts Med 625 $183 $293
Dayton, Ohio Med 744 $170 $228
Fresno, California Med 669 $165 $247
Wichita, Kansas Med 500 $160 $320
Akron, Ohio Med 620 $148 $239
Rochester, New York Med 746 $140 $188
Bakersfield, California Med 527 $119 $226
Poughkeepsie-Newburgh-Middletown, New York Med 544 $107 $197
Toledo, Ohio Med 519 $102 $197
McAllen-Edinburg-Mission, Texas Med 545 $ 56 $103
Source: Texas Transportation Institute, 2010.
Key: Cities utilizing 2008 data in lieu of unavailable 2009 crash data.
Crashes vs. Congestion: What’s the Cost to Society?
Cambridge Systematics, Inc. A-11
Table A.9 Total Cost of Congestion and Cost per Person Small Metropolitan Areas
Metropolitan Area
Urbanized Area Population
(Thousands) Cost of Congestion
(Millions) Cost of Congestion
Per Person
Columbia, South Carolina 473 $202 $427
Cape Coral-Fort Myers, Florida 464 $183 $394
Little Rock-North Little Rock, Arkansas 450 $179 $398
Knoxville, Tennessee 495 $170 $343
Jackson, Mississippi 418 $161 $385
Worcester, Massachusetts 442 $135 $305
Pensacola-Ferry Pass-Brent, Florida 356 $108 $303
Spokane, Washington 375 $106 $283
Provo-Orem, Utah 453 $102 $225
Winston-Salem, North Carolina 379 $102 $269
Salem, Oregon 238 $100 $420
Greensboro-High Point, North Carolina 339 $ 93 $274
Boise City-Nampa, Idaho 304 $ 91 $299
Beaumont-Port Arthur, Texas 241 $ 86 $357
Madison, Wisconsin 390 $ 79 $203
Stockton, California 399 $ 73 $183
Anchorage, Alaska 297 $ 72 $242
Corpus Christi, Texas 332 $ 63 $190
Laredo, Texas 225 $ 54 $240
Brownsville-Harlingen, Texas 204 $ 52 $255
Eugene-Springfield, Oregon 252 $ 39 $155
Boulder, Colorado 146 $ 32 $219
Source: Texas Transportation Institute, 2010.
Crashes vs. Congestion: What’s the Cost to Society?
A-12 Cambridge Systematics, Inc.
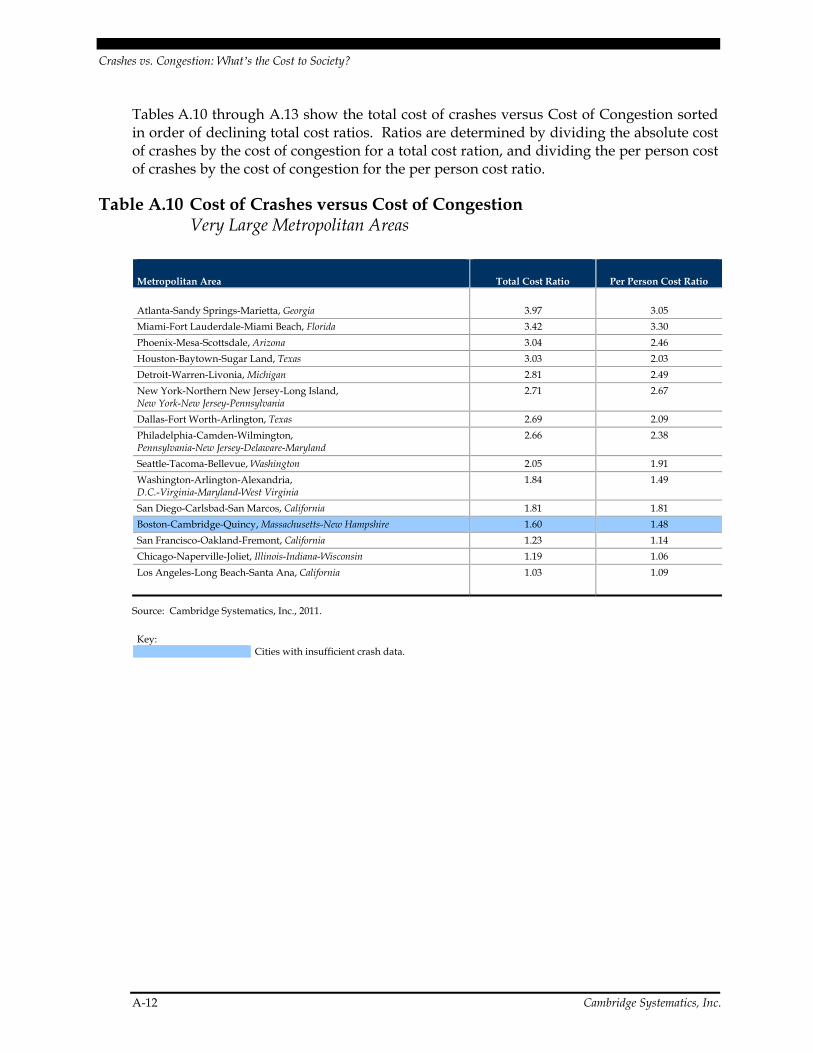
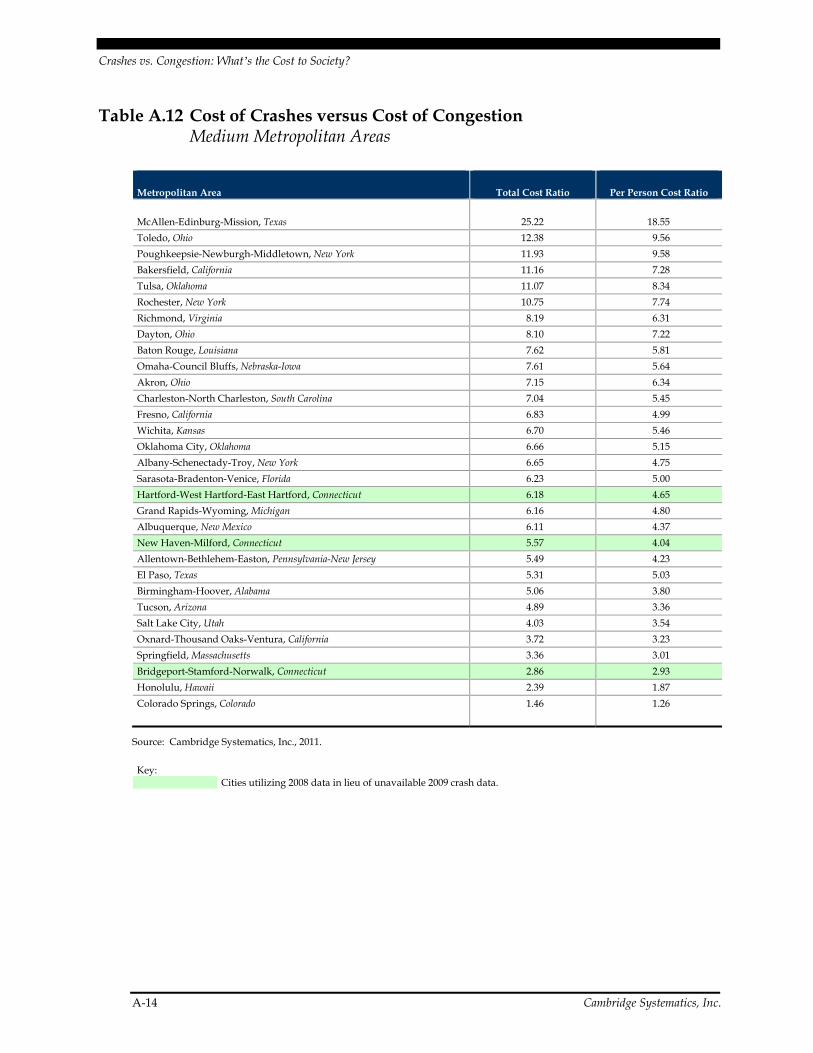
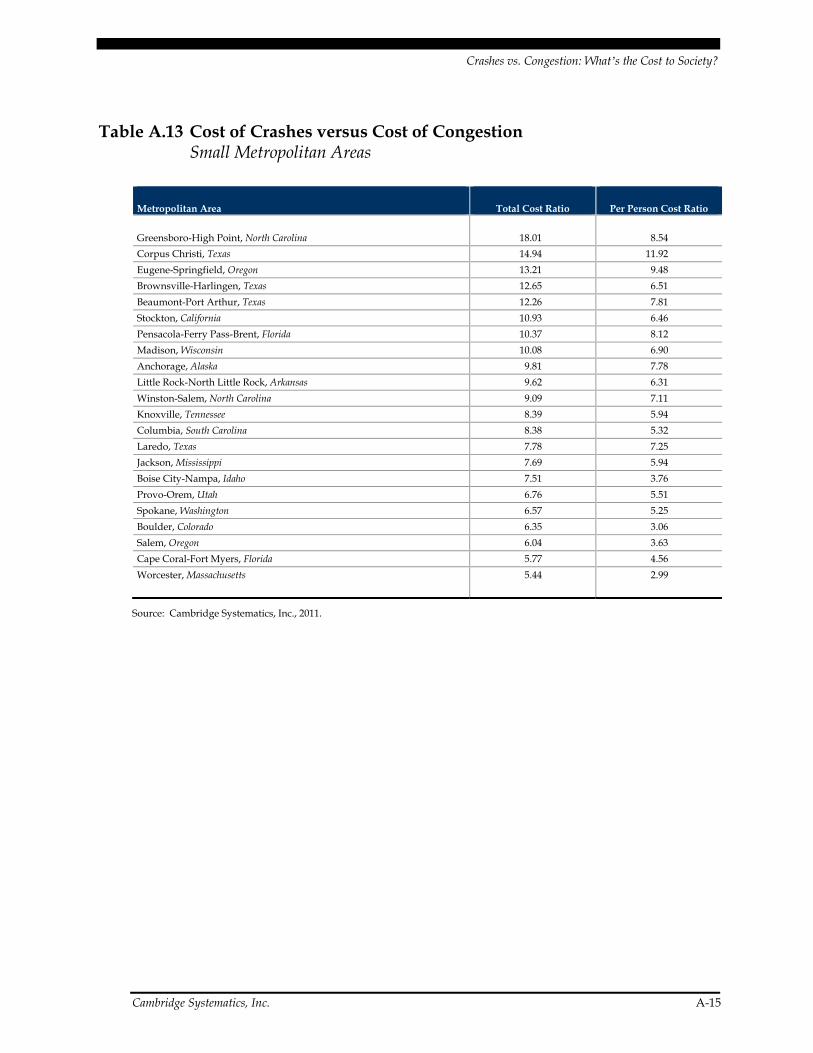
Tables A.10 through A.13 show the total cost of crashes versus Cost of Congestion sorted in order of declining total cost ratios. Ratios are determined by dividing the absolute cost of crashes by the cost of congestion for a total cost ration, and dividing the per person cost of crashes by the cost of congestion for the per person cost ratio.
Table A.10 Cost of Crashes versus Cost of Congestion Very Large Metropolitan Areas
Metropolitan Area Total Cost Ratio Per Person Cost Ratio
Atlanta-Sandy Springs-Marietta, Georgia 3.97 3.05
Miami-Fort Lauderdale-Miami Beach, Florida 3.42 3.30
Phoenix-Mesa-Scottsdale, Arizona 3.04 2.46
Houston-Baytown-Sugar Land, Texas 3.03 2.03
Detroit-Warren-Livonia, Michigan 2.81 2.49
New York-Northern New Jersey-Long Island, New York-New Jersey-Pennsylvania
2.71 2.67
Dallas-Fort Worth-Arlington, Texas 2.69 2.09
Philadelphia-Camden-Wilmington, Pennsylvania-New Jersey-Delaware-Maryland
2.66 2.38
Seattle-Tacoma-Bellevue, Washington 2.05 1.91
Washington-Arlington-Alexandria, D.C.-Virginia-Maryland-West Virginia
1.84 1.49
San Diego-Carlsbad-San Marcos, California 1.81 1.81
Boston-Cambridge-Quincy, Massachusetts-New Hampshire 1.60 1.48
San Francisco-Oakland-Fremont, California 1.23 1.14
Chicago-Naperville-Joliet, Illinois-Indiana-Wisconsin 1.19 1.06
Los Angeles-Long Beach-Santa Ana, California 1.03 1.09
Source: Cambridge Systematics, Inc., 2011.
Key: Cities with insufficient crash data.
Crashes vs. Congestion: What’s the Cost to Society?
Cambridge Systematics, Inc. A-13
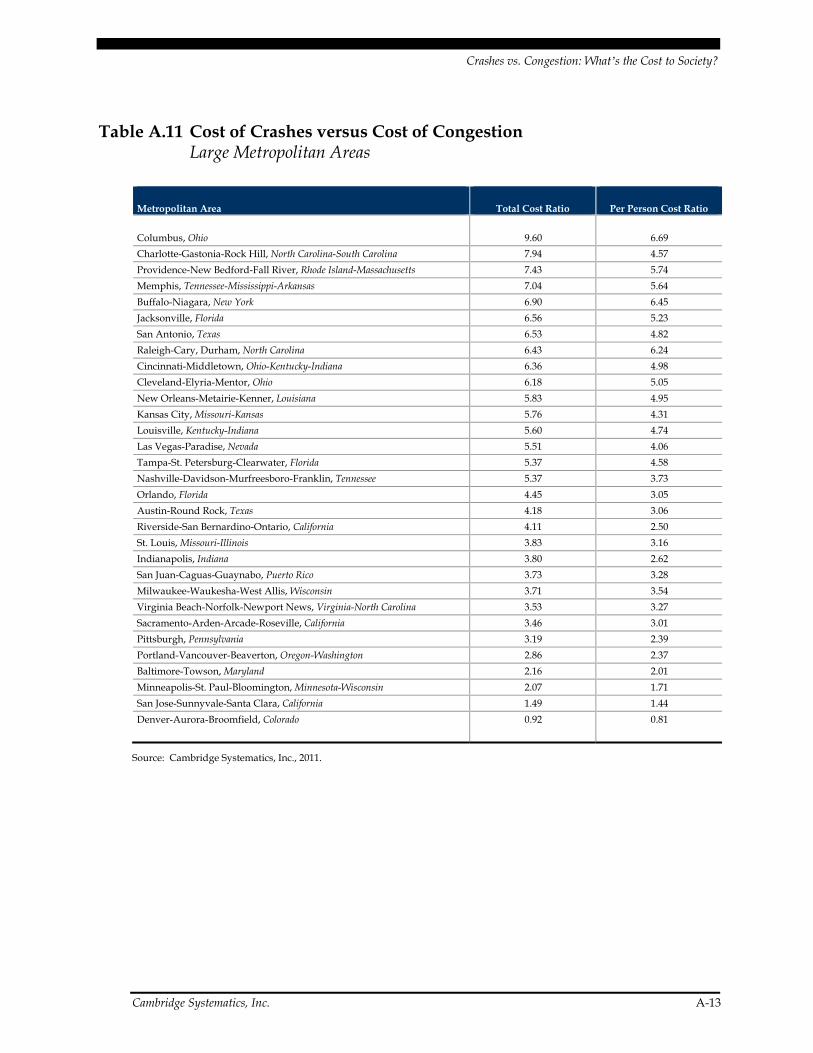
Table A.11 Cost of Crashes versus Cost of Congestion Large Metropolitan Areas
Metropolitan Area Total Cost Ratio Per Person Cost Ratio
Columbus, Ohio 9.60 6.69
Charlotte-Gastonia-Rock Hill, North Carolina-South Carolina 7.94 4.57
Providence-New Bedford-Fall River, Rhode Island-Massachusetts 7.43 5.74
Memphis, Tennessee-Mississippi-Arkansas 7.04 5.64
Buffalo-Niagara, New York 6.90 6.45
Jacksonville, Florida 6.56 5.23
San Antonio, Texas 6.53 4.82
Raleigh-Cary, Durham, North Carolina 6.43 6.24
Cincinnati-Middletown, Ohio-Kentucky-Indiana 6.36 4.98
Cleveland-Elyria-Mentor, Ohio 6.18 5.05
New Orleans-Metairie-Kenner, Louisiana 5.83 4.95
Kansas City, Missouri-Kansas 5.76 4.31
Louisville, Kentucky-Indiana 5.60 4.74
Las Vegas-Paradise, Nevada 5.51 4.06
Tampa-St. Petersburg-Clearwater, Florida 5.37 4.58
Nashville-Davidson-Murfreesboro-Franklin, Tennessee 5.37 3.73
Orlando, Florida 4.45 3.05
Austin-Round Rock, Texas 4.18 3.06
Riverside-San Bernardino-Ontario, California 4.11 2.50
St. Louis, Missouri-Illinois 3.83 3.16
Indianapolis, Indiana 3.80 2.62
San Juan-Caguas-Guaynabo, Puerto Rico 3.73 3.28
Milwaukee-Waukesha-West Allis, Wisconsin 3.71 3.54
Virginia Beach-Norfolk-Newport News, Virginia-North Carolina 3.53 3.27
Sacramento-Arden-Arcade-Roseville, California 3.46 3.01
Pittsburgh, Pennsylvania 3.19 2.39
Portland-Vancouver-Beaverton, Oregon-Washington 2.86 2.37
Baltimore-Towson, Maryland 2.16 2.01
Minneapolis-St. Paul-Bloomington, Minnesota-Wisconsin 2.07 1.71
San Jose-Sunnyvale-Santa Clara, California 1.49 1.44
Denver-Aurora-Broomfield, Colorado 0.92 0.81
Source: Cambridge Systematics, Inc., 2011.
Crashes vs. Congestion: What’s the Cost to Society?
A-14 Cambridge Systematics, Inc.
Table A.12 Cost of Crashes versus Cost of Congestion Medium Metropolitan Areas
Metropolitan Area Total Cost Ratio Per Person Cost Ratio
McAllen-Edinburg-Mission, Texas 25.22 18.55
Toledo, Ohio 12.38 9.56
Poughkeepsie-Newburgh-Middletown, New York 11.93 9.58
Bakersfield, California 11.16 7.28
Tulsa, Oklahoma 11.07 8.34
Rochester, New York 10.75 7.74
Richmond, Virginia 8.19 6.31
Dayton, Ohio 8.10 7.22
Baton Rouge, Louisiana 7.62 5.81
Omaha-Council Bluffs, Nebraska-Iowa 7.61 5.64
Akron, Ohio 7.15 6.34
Charleston-North Charleston, South Carolina 7.04 5.45
Fresno, California 6.83 4.99
Wichita, Kansas 6.70 5.46
Oklahoma City, Oklahoma 6.66 5.15
Albany-Schenectady-Troy, New York 6.65 4.75
Sarasota-Bradenton-Venice, Florida 6.23 5.00
Hartford-West Hartford-East Hartford, Connecticut 6.18 4.65
Grand Rapids-Wyoming, Michigan 6.16 4.80
Albuquerque, New Mexico 6.11 4.37
New Haven-Milford, Connecticut 5.57 4.04
Allentown-Bethlehem-Easton, Pennsylvania-New Jersey 5.49 4.23
El Paso, Texas 5.31 5.03
Birmingham-Hoover, Alabama 5.06 3.80
Tucson, Arizona 4.89 3.36
Salt Lake City, Utah 4.03 3.54
Oxnard-Thousand Oaks-Ventura, California 3.72 3.23
Springfield, Massachusetts 3.36 3.01
Bridgeport-Stamford-Norwalk, Connecticut 2.86 2.93
Honolulu, Hawaii 2.39 1.87
Colorado Springs, Colorado 1.46 1.26
Source: Cambridge Systematics, Inc., 2011.
Key: Cities utilizing 2008 data in lieu of unavailable 2009 crash data.
Crashes vs. Congestion: What’s the Cost to Society?
Cambridge Systematics, Inc. A-15
Table A.13 Cost of Crashes versus Cost of Congestion Small Metropolitan Areas
Metropolitan Area Total Cost Ratio Per Person Cost Ratio
Greensboro-High Point, North Carolina 18.01 8.54
Corpus Christi, Texas 14.94 11.92
Eugene-Springfield, Oregon 13.21 9.48
Brownsville-Harlingen, Texas 12.65 6.51
Beaumont-Port Arthur, Texas 12.26 7.81
Stockton, California 10.93 6.46
Pensacola-Ferry Pass-Brent, Florida 10.37 8.12
Madison, Wisconsin 10.08 6.90
Anchorage, Alaska 9.81 7.78
Little Rock-North Little Rock, Arkansas 9.62 6.31
Winston-Salem, North Carolina 9.09 7.11
Knoxville, Tennessee 8.39 5.94
Columbia, South Carolina 8.38 5.32
Laredo, Texas 7.78 7.25
Jackson, Mississippi 7.69 5.94
Boise City-Nampa, Idaho 7.51 3.76
Provo-Orem, Utah 6.76 5.51
Spokane, Washington 6.57 5.25
Boulder, Colorado 6.35 3.06
Salem, Oregon 6.04 3.63
Cape Coral-Fort Myers, Florida 5.77 4.56
Worcester, Massachusetts 5.44 2.99
Source: Cambridge Systematics, Inc., 2011.

Crashes vs. Congestion: What’s the Cost to Society?
Cambridge Systematics, Inc. B-1
Appendix B – Crashes and Congestion – The Conventional Wisdom
Traffic congestion is not only exasperating, it is costly. According to the Texas Transportation Institute’s Urban Mobility Report, which examines the costs of congestion in America’s 101 largest urban areas, an astronomical 4.8 billion hours of people’s time and 3.9 billion gallons of fuel were wasted in 2009 because of congestion. The cost of these squandered resources is a staggering $97.7 billion, the report noted. In the American Association of State Highway Transportation Officials (AASHTO) report Optimizing the System, the question of safety is brought to the attention of the reader: “But as bad as (congestion) is, there’s an immeasurably more costly and tragic measure of the system’s performance: the human toll” (1). In 2009, more than 33,000 people were killed and over two million were injured in crashes on roads and highways in the United States.
Federal and state departments of transportation (DOT) publicly refer to congestion management and road safety as their stated goals, as do metropolitan planning organizations (MPO), and other local transportation agencies. Safety is nearly always a goal in transportation planning at any level, particularly because of the federal transportation bills TEA-21, and SAFETEA-LU, which establish safety as a priority transportation planning factor. Given the unacceptable number of deaths and injuries, safety is increasingly stated as “the most important goal.” On the other hand, congestion receives very high levels of attention in the national media, as well as in government circles, as one of the most critical challenges facing urban America.
After the goal statements in transportation plans, safety is likely to receive less attention than congestion except for temporary interest following highly publicized crashes or when high-visibility enforcement campaigns are launched, e.g., Click It or Ticket, the national safety belt campaign, etc. Except for these events, safety generally does not receive the same level of public or political attention and concern as does the annual release of a congestion index in the Texas Transportation Institute’s (TTI) Urban Mobility Report. This is not surprising when considering the increase in new highway capacity has not kept up with the growth in travel. According to FHWA, between 1980 and 1999, route-miles of highways increased 1.5 percent while vehicle-miles of travel increased 76 percent. While congestion is often associated with large cities, delays have become common in smaller cities and in some rural communities (2).
The obvious reason is elected and appointed officials frequently hear concerns expressed by their constituents and the media about congestion. Safety, on the other hand, receives far less attention despite the fact that millions of crashes occur each year. Crashes occur randomly and usually affect only a few people each time they do occur. Studies show the vast majority of Americans think they are good drivers; hence, they do not believe they
Crashes vs. Congestion: What’s the Cost to Society?
B-2 Cambridge Systematics, Inc.
will cause a crash. A recent survey indicated nearly two-thirds (64 percent) of American drivers rate themselves as “excellent” or “very good” drivers (3).
The purpose of this section is to provide a brief overview of the conventional wisdom regarding the relationship between safety and congestion. Literature examining the congestion-safety relationship remains sparse. A search of the Transportation Research International Documentation (TRID) on the keywords “safety congestion management system” produces nearly 1,600 references. Generally, research examines the impact of incident management on safety and not the direct interaction effect of crashes and congestion. Overall, the research is almost always about something other than an examination of the statistical relationship between crashes and congestion. Furthermore, the statements below reflect a lack of consensus on the most frequently suggested hypotheses:
Congested roadways lead to a decrease in crashes;
Congested roadways lead to an increase in crashes; and
Congested roadways lead to an increase in crashes but severity is reduced.
B.1 Crashes, Congestion, and System Performance
Little research is available on the relationship between crashes and congestion as it relates to the performance of the transportation system. The existing research can be organized into four categories: congestion-related crashes, nonrecurring congestion crashes, secondary crashes, and volume-related crashes.
Congestion-Related Crashes
The evidence is mixed on the degree to which congestion reduces the number of crashes occurring on congested road segments. In some cases, crash statistics show the number of crashes is reduced when the road is less congested. A study by the Victoria Transport Policy Institute examined the relationships among safety, congestion, and system performance by focusing on mode shift as a method for reducing congestion. The study found:
Safety impacts depend on types of travel changes that occur. Reductions in total vehicle mileage are likely to cause proportionate or greater reductions in crashes. The safety impact of mode shifting depends on the relative risks of each mode. Shifting vehicle travel from congested roads to less congested conditions tends to reduce crashes but increases crash severity. Strategies that reduce trip distance and traffic speed can provide significant safety benefits (4).
The conventional wisdom seems to be increasing mobility, e.g., adding lane-miles, results in safety improvement. The argument frequently is made to stimulate more interest and funding to support capacity increases. Research on Nevada’s future mobility needs

Crashes vs. Congestion: What’s the Cost to Society?
Cambridge Systematics, Inc. B-3
concluded at least $2 billion in additional funding is needed for highway projects due to the tremendous growth in population and vehicle-miles of travel in that state. According to The Road Information Program and the Nevada Highway Users Alliance, “These projects would help relieve traffic congestion, improve traffic safety, and improve pavement quality statewide” (5). There is little doubt congestion and pavement quality would be improved. However, the scientific literature supporting such a statement is not as clear. Recent research has attempted to provide an insight into what happens when lanes are added on freeways. The additional lanes briefly alleviate the safety problem as extra capacity lowers the density of vehicles on the facility. However, as the congestion, or vehicle density, increases, the total as well as the injury and fatal crash rates escalate (6). When vehicle density reaches a certain level, research suggests safety deteriorates and offsets any gains which may be achieved by building the additional lanes. The conflict opportunities increase with additional lanes and more lanes tend to increase the average speed and the speed differential, two major contributing factors for crash occurrence. In simple terms, we cannot build our way out of congestion without compromising safety on the roadways.
In summary, although the evidence is mixed, less congested roadways appear to lead to fewer, but more severe, crashes. On more congested roadways, the number of crashes may increase, but they may be primarily minor crashes reflecting the increased weaving and access/egress movements often occurring on congested road segments.
Nonrecurring Congestion Crashes
Urban road congestion is caused by two phenomena:
Recurring congestion reflecting the normal, day-to-day delays caused by bottlenecks and large volumes; and
Nonrecurring congestion caused when something unexpected happens. According to FHWA:
… Nonrecurring congestion includes the development and deployment of strategies designed to mitigate traffic congestion due to nonrecurring causes, such as crashes, disabled vehicles, work zones, adverse weather events, and planned special events. About half of congestion is caused by temporary disruptions that take away part of the roadway from use – or “nonrecurring” congestion. The three main causes of nonrecurring congestion are: incidents ranging from a flat tire to an overturned hazardous material truck (25 percent of congestion), work zones (10 percent of congestion), and weather (15 percent of congestion). Nonrecurring events dramatically reduce the available capacity and reliability of the entire transportation system. This is the type of congestion that surprises us. We plan for a trip of 20 minutes and we experience a trip of 40 minutes. Travelers and shippers are especially sensitive to the unanticipated disruptions to tightly scheduled personal activities and manufacturing distribution procedures (7).
Although national data suggest approximately 25 percent of nonrecurring congestion is due to crashes, it may be underreported.
Crashes vs. Congestion: What’s the Cost to Society?
B-4 Cambridge Systematics, Inc.
Secondary Crashes
Strong evidence exists indicating the number of upstream crashes increases when congestion occurs downstream. This is not surprising especially on high-speed roads. Suddenly approaching stopped traffic can lead to rear-end collisions. According to FHWA’s Freeway Management and Operations Handbook:
Although the problems most often associated with traffic incidents are congestion and associated traveler delay, increased fuel consumption, and reduced air quality, the most serious problem is the occurrence of secondary crashes. Another related issue is the danger posed by traffic incidents to the response personnel serving the public at the scene (8).
In severe crash-induced congestion, this phenomenon can result in more than one additional secondary crash. For example, in a study of freeway secondary crashes conducted by the Eno Foundation for Transportation, 60 percent occurred within 600 feet of the original crash (9). For this reason, many DOTs have instituted incident management programs and freeway service patrols. These programs are designed to notify drivers as quickly as possible of crash-related congestion ahead and to manage the incident using methods that restore normal traffic conditions as quickly as possible. The phenomenon of secondary crashes also is one that is important for urban arterial roads (10). Several journal articles make the case improved incident management leads to safety improvements due to reductions in secondary crashes and lessening of harm to incident management personnel (11 to 19).
Volume-Related Crashes
At intersections in particular, volume of traffic (especially turning traffic) has a significant relationship to the number of crashes. Higher volumes usually correspond with a larger number of crashes simply because the probability of a crash occurring is greater when more vehicles are present. However, higher volumes do not necessarily equate to increased congestion, and little research is available on the relationship between congested intersection conditions and crash incidents.
Summary
The conventional wisdom related to the operational relationship between congestion and safety indicates the relationship depends on the geometric design of the road, the types of vehicle operations occurring on the road, and the volume of traffic. It is fair to conclude congestion is related to safety, but it is often understated and misunderstood.

Crashes vs. Congestion: What’s the Cost to Society?
Cambridge Systematics, Inc. B-5
B.2 Crashes, Congestion, and Institutional Capacity
The manner in which states organize their transportation programs is often an indication of the underlying assumptions upon which the program is structured. In some cases, for example, state transportation safety programs are closely tied to the state DOT traffic operations unit, which is the group primarily responsible for managing congestion through road management and operations. For many state transportation agencies, it was assumed following the standards established by the AASHTO Policy on Geometric Design of Highways and Streets (Green Book) and the Manual on Uniform Traffic Control Devices (MUTCD) automatically resulted in safety improvements. However, only in recent years have engineers, researchers, statisticians, and others realized a comprehensive safety program includes more than just engineering solutions. The real problem is limited funding available to rebuild roads many of which existed before any reasonable design standards existed and many of the local roads never had a design standard applied but were built to provide access to property. The FHWA and AASHTO, through multi-year/multi-million dollar research efforts, will soon be publishing a highway safety manual which will allow designers to more definitively predict the safety outcomes from design modifications.
To what extent do DOT and MPO transportation planners address safety in the traditional planning process and documents? The findings in several studies that addressed this question have suggested this has occurred in only a limited way. Safety was often noted in the vision and perhaps in a goals statement, but the subject was rarely addressed beyond that point in the plan development process. This is primarily because the transportation planning process traditionally dealt with only large scale capital projects such as additional lanes or new access controlled facilities, which are inherently safer than the facilities the traffic used before. Only in recent times has the planning process addressed smaller scale improvements and operational type actions.
An interesting institutional relationship, however, between congestion and safety could be developed. Every metropolitan area with a population over 200,000 (referred to as a “transportation management area”) must have a congestion management process identifying the most congested roads in the region. This road network is then part of the prioritization process for investment decision-making. In many cases, the defined network for the congestion management process also includes those roads with the largest number of crashes. A substantial percentage (40-50 percent) of non-recurring congestion is caused by one-time incidents, including traffic crashes. Thus, a potential database in many metropolitan areas could be tapped showing the congested roads and corresponding crash statistics.
Also, as mandated by the federal transportation bill, SAFETEA-LU, State DOTs are required to identify the most hazardous locations based on a data review of crashes, fatalities, and injuries as part of their Highway Safety Improvement Program (HSIP). States must submit an annual report to the federal government describing not less than five percent of these locations exhibiting the most severe safety needs to raise public awareness of the highway safety needs and challenges in the states. Unfortunately, most
Crashes vs. Congestion: What’s the Cost to Society?
B-6 Cambridge Systematics, Inc.
of the state reports are limited to state road systems since crash data on other public roads is often unavailable or unreliable. Provisions in SAFETEA-LU require the hazardous location designation apply to “all public roads” (state and local) to ensure resources are targeted at the state’s most serious transportation safety problems regardless of where they occur.
Several additional federal, state, and local agencies other than DOTs or MPOs, have specific responsibilities for safety including, the police agencies, the motor vehicle agencies, the court systems, and the state highway safety offices managed by the governors’ highway safety representatives. In some cases, these offices are located in the DOT, but they may be independent or part of other agencies such as Departments of Public Safety, Motor Vehicles, or the State Police. These offices focus mainly on behavioral safety and seek to reduce traffic-related crashes, fatalities, and injuries through law enforcement, education, and prevention initiatives.
To that end, the federal mandate for states to develop Strategic Highway Safety Plans (SHSP) as part of their Highway Safety Improvement Program (HSIP) was, to a large extent, designed to get the various elements of the state highway transportation agencies and departments to collaborate by jointly developing common goals and objectives from a broader “4E” perspective, i.e., engineering, education, enforcement, and emergency response. AASHTO began this more collaborative approach in 1997 with approval of a strategic plan recommending action in 22 emphasis areas to reduce fatalities, and in 2007 AASHTO adopted an aggressive national goal of halving fatalities over the next two decades.
Research by Hendren and Niemeier shows the relationship between safety and congestion is complex, and missing variables from congestion and safety models provide an incomplete picture. In their study, which attempted to link performance measures to resource allocation, the authors concluded transportation system performance is clearly influenced by factors besides government expenditure categories. For example, between 1985 and 2000, safety belt use increased, saving approximately 133,549 lives (23). Increasing safety belt use may not reduce crashes, but it effectively reduces severity. A study of the relationship between safety and congestion over time would have to take this phenomenon and others into account.
Congestion, like safety, is a public issue and is repeatedly ranked as number one or two in urban polls. The public expects the DOTs to address the issue and judges their effectiveness on its ability to alleviate congestion; therefore, substantial funding is aimed at strategies to reduce congestion. The results of this study suggest the public needs to understand better the societal costs associated with crashes and to demand safety become as important a policy issue.
Crashes vs. Congestion: What’s the Cost to Society?
Cambridge Systematics, Inc. B-7
B.3 References
1. AASHTO, (2004). Optimizing the System. American Association of State Highway and Transportation Officials, Washington, D.C., Publication No.: OTS-1.
2. FHWA. http://www.fhwa.dot.gov/congestion/index.htm. (Viewed April 2007).
3. All State (2011). New Allstate Survey Shows Americans Think They Are Great Drivers – Habits Tell a Different Story. http://www.allstatenewsroom.com/channels/News-Releases/releases/new-allstate-survey-shows-americans-think-they-are-great-drivers-habits-tell-a-different-story – Accessed September 2011.
4. Litman, T. (2004). Safe Travels: Evaluating Mobility Management Traffic Safety Impacts, TRB, TRIS On-Line, Washington, D.C.
5. The Road Information Program and Nevada Highway Users Alliance. (2002). Meeting Nevada’s Future Mobility Needs: A Report card about the Condition, Use and Safety of Nevada’s System of Roads and Bridges, TRB, TRIS On-Line, Washington, D.C.
6. Kononov, J., Bailey, B., and Allery, B.K. (2008). Relationships between Safety and Both Congestion and Number of Lanes on Urban Freeways. Transportation Research Record: Journal of the Transportation Research Board, No. 2083, Washington, D.C.
7. FHWA. http://ops.fhwa.dot.gov/program_areas/reduce-non-cong.htm. (Viewed April 2007).
8. FHWA. http://ops.fhwa.dot.gov/freewaymgmt/publications/frwy_mgmt handbook/chapter10. (Viewed April 2007).
9. Raub, R.A. (1997). Secondary Crashes: An Important Component of Roadway Incident Management, Eno Foundation for Transportation, Inc., Washington, D.C.
10. Raub, R.A. (1997). Occurrence of Secondary Crashes on Urban Arterial Roadways, Transportation Research Record 1581, Transportation Research Board, Washington, D.C.
11. FHWA and FTA. (1999). Houston Transtar: Maximizing Safety and Mobility for the Public. A Case Study, TRB, TRIS On-Line, Washington, D.C.
12. Karlaftis, M.G., Latoski, S., Richards, N., and Sinha, K. (1999). ITS Impacts on Safety and Traffic Management: An Investigation of Secondary Crash Causes, Purdue University, West Lafayette, Indiana.
13. Moore, J.E. and Guiliano, G., and S. Cho S., (2004). Secondary Accident Rates on Los Angeles Freeways, American Society of Civil Engineers, New York.
Crashes vs. Congestion: What’s the Cost to Society?
B-8 Cambridge Systematics, Inc.
14. Paesani, G., Glassman, K., and Lee, S.G. (2004). The Use of IPASS to Improve Mobility and Safety through Traveler Information, TRB, TRIS On-Line, Washington, D.C.
15. DeVries, H. (2004). Integration of Public Safety and Transportation for Coordinated Incident Management: National Strategies and Regional Programs, TRB, TRIS On-Line, Washington, D.C.
16. Sun, C. and Chilukuri, V. (2005). Secondary Accident Data Fusion for Assessing Long-Term Performance of Transportation Systems. Iowa State University, Ames, Iowa.
17. Zhou, H., Hagen, L., Singh, H., and Clark, P. (2006). Benefit and Cost Analysis of the Road Ranger Program in Florida, TRB, TRIS On-Line, Washington, D.C.
18. Hirunyanitiwattana, W. and S. Mattingly. (2006). Identifying Secondary Crash Characteristics for California Highway System. Transportation Research Board, Washington, D.C.
19. Vilnius Gediminas Technical University. (2006). Smooth Traffic Flow as One of the Most Important Factors for Safety Increase in Road Transport, TRB, TRIS On-Line, Washington, D.C.
20. Chatterjee, A., Wegmann, F., Fortey, N., and Everett, J. (2000). Incorporating Safety and Security Issues in Urban Planning. Center for Transportation Research, The University of Tennessee.
21. Roden, D., Binder, J., and Nwankwo, A. (2003). Incorporating Safety into the Transportation Planning Process: Bests Practices in Data Investments and Coordination Efforts, NCHRP 8-36. Task 18 Prepared for AASHTO Standing Committee on Planning, Washington, D.C.
22. Depue, L. (2003). Safety Management Systems: A Synthesis of Highway Practice. NCHRP Synthesis 322, Transportation Research Board of the National Academies, Washington, D.C., www.trb.org/trb/onlinepubs.nsf.
23. Hendren, P., and Niemeier, D. (2006). Evaluating the Effectiveness of State Department of Transportation Investment Decisions: Linking Performance Measures to Resource Allocation. Journal of Infrastructure Systems, ASCE: 12:4, pages 216-229.