what's new in spss statistics 25 · what's new in spss statistics 25 analytics plays a...
TRANSCRIPT
What's Newin SPSS Statistics 25
Analytics plays a vital role in helping your organization achieve its objectives. The SPSS Statistics family delivers the core capabilities needed for end-to-end analytics. To ensure that themost advanced techniques are available to a broader group of analysts, researchers and business users, enhancements have been made to the features and capabilities of the IBM SPSS Statistics portfolio and its many specialized modules.
IBM SPSS Statistics 25 continues to increase accessibility to advanced analytics through improved tools, integration, output and ease-of-use features. This release focuses on increasing the analytic capabilities of the software through:
New and advanced statistics Stronger integration with third-party applications Enhanced productivity
Add probabilities to your analysis with Bayesian statistis
SPSS Statistics 25 now offers the capability to use Bayesian statistics, with both new syntax and GUI elements that are as easy to run as traditional p-value statistics.
Execute new Bayesian statistics functions including regression,
ANOVA, and t-tests.
Bayesian statistics is becoming very popular, because it circumvents a lot of the misunderstandings brought by standard statistics. Instead of using a p-value to reject or fail to reject a null hypothesis, Bayesian places an uncertainty on parameters and captures all relevant information from observed data. Our approach to Bayesian statistics is unique because our Bayesian procedures are as easy to run as our standard statistical tests. In just a few clicks you can run Linear Regression, ANOVA, One-Sample, Pair-Sample, Independent-Sample T-tests, Binomial Proportion Inference, Poisson Distribution Analysis, Pairwise Pearson Correlation, and Loglinear models to test the independence of two categorical variables.
Uncover hidden causal relationships among a large number of
time series using temporal causal modeling (TCM)
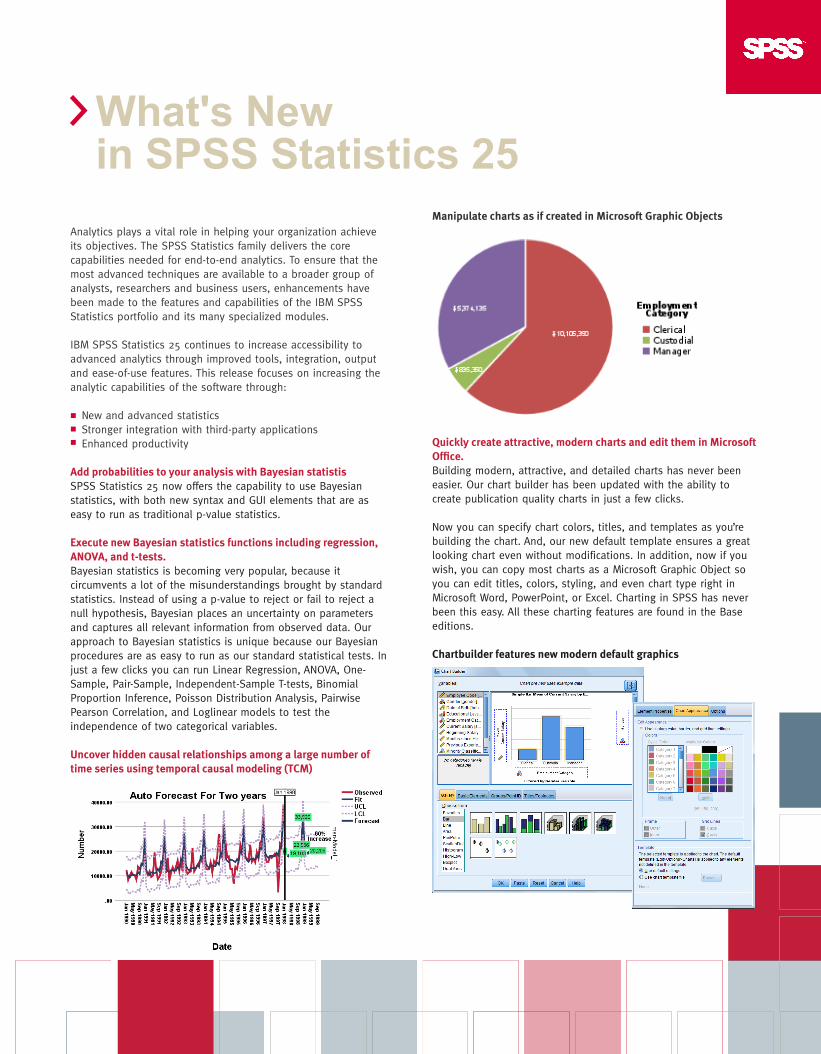
Manipulate charts as if created in Microsoft Graphic Objects
Quickly create attractive, modern charts and edit them in Microsoft
Office.
Building modern, attractive, and detailed charts has never been easier. Our chart builder has been updated with the ability to create publication quality charts in just a few clicks.
Now you can specify chart colors, titles, and templates as you’re building the chart. And, our new default template ensures a great looking chart even without modifications. In addition, now if you wish, you can copy most charts as a Microsoft Graphic Object so you can edit titles, colors, styling, and even chart type right in Microsoft Word, PowerPoint, or Excel. Charting in SPSS has never been this easy. All these charting features are found in the Base editions.
Chartbuilder features new modern default graphics
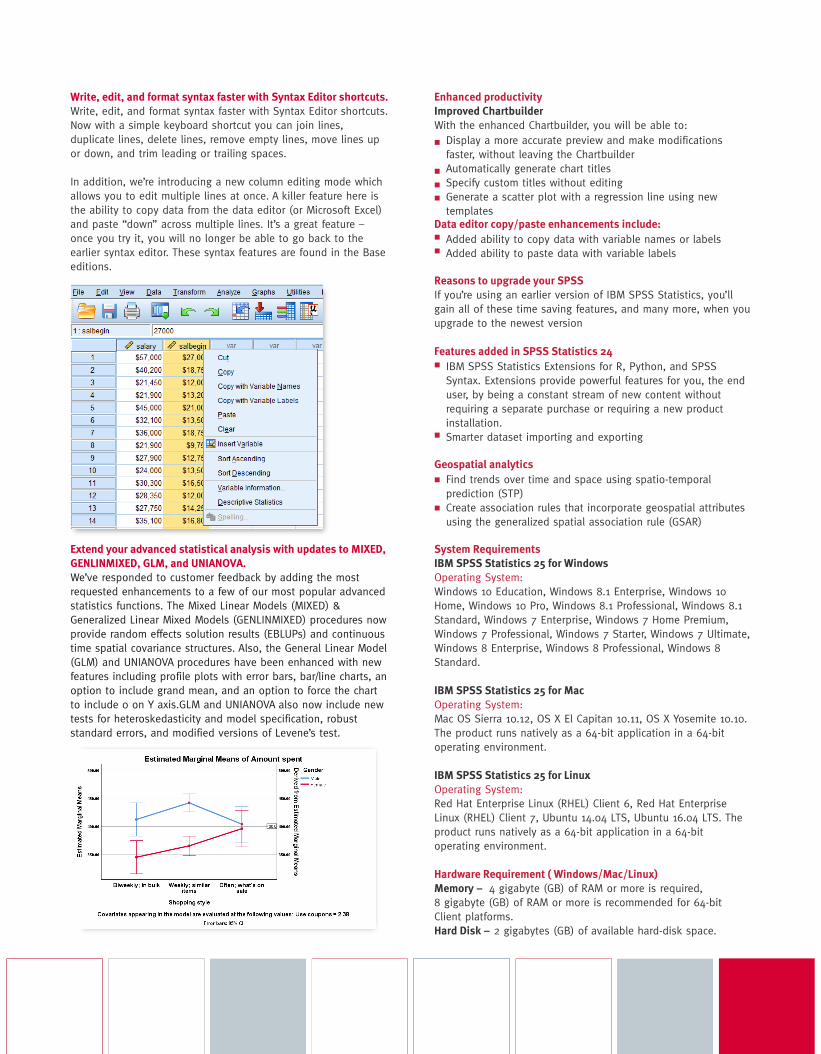
Write, edit, and format syntax faster with Syntax Editor shortcuts.
Write, edit, and format syntax faster with Syntax Editor shortcuts.Now with a simple keyboard shortcut you can join lines, duplicate lines, delete lines, remove empty lines, move lines up or down, and trim leading or trailing spaces.
In addition, we’re introducing a new column editing mode which allows you to edit multiple lines at once. A killer feature here is the ability to copy data from the data editor (or Microsoft Excel) and paste “down” across multiple lines. It’s a great feature – once you try it, you will no longer be able to go back to the earlier syntax editor. These syntax features are found in the Base editions.
Extend your advanced statistical analysis with updates to MIXED,
GENLINMIXED, GLM, and UNIANOVA.
We’ve responded to customer feedback by adding the most requested enhancements to a few of our most popular advanced statistics functions. The Mixed Linear Models (MIXED) & Generalized Linear Mixed Models (GENLINMIXED) procedures now provide random effects solution results (EBLUPs) and continuous time spatial covariance structures. Also, the General Linear Model (GLM) and UNIANOVA procedures have been enhanced with new features including profile plots with error bars, bar/line charts, an option to include grand mean, and an option to force the chart to include 0 on Y axis.GLM and UNIANOVA also now include new tests for heteroskedasticity and model specification, robust standard errors, and modified versions of Levene’s test.
Enhanced productivity
Improved Chartbuilder
With the enhanced Chartbuilder, you will be able to:
Data editor copy/paste enhancements include:
Reasons to upgrade your SPSS
If you’re using an earlier version of IBM SPSS Statistics, you’ll gain all of these time saving features, and many more, when you upgrade to the newest version
Features added in SPSS Statistics 24
Geospatial analytics
System Requirements
IBM SPSS Statistics 25 for Windows
Operating System:Windows 10 Education, Windows 8.1 Enterprise, Windows 10 Home, Windows 10 Pro, Windows 8.1 Professional, Windows 8.1 Standard, Windows 7 Enterprise, Windows 7 Home Premium, Windows 7 Professional, Windows 7 Starter, Windows 7 Ultimate, Windows 8 Enterprise, Windows 8 Professional, Windows 8 Standard.
IBM SPSS Statistics 25 for Mac
Operating System:Mac OS Sierra 10.12, OS X El Capitan 10.11, OS X Yosemite 10.10. The product runs natively as a 64-bit application in a 64-bit operating environment.
IBM SPSS Statistics 25 for Linux
Operating System:Red Hat Enterprise Linux (RHEL) Client 6, Red Hat Enterprise Linux (RHEL) Client 7, Ubuntu 14.04 LTS, Ubuntu 16.04 LTS. The product runs natively as a 64-bit application in a 64-bit operating environment.
Hardware Requirement ( Windows/Mac/Linux)
Memory – 4 gigabyte (GB) of RAM or more is required,8 gigabyte (GB) of RAM or more is recommended for 64-bit Client platforms.Hard Disk – 2 gigabytes (GB) of available hard-disk space.
Display a more accurate preview and make modifications faster, without leaving the Chartbuilder Automatically generate chart titles Specify custom titles without editingGenerate a scatter plot with a regression line using new templates
Added ability to copy data with variable names or labels Added ability to paste data with variable labels
IBM SPSS Statistics Extensions for R, Python, and SPSS Syntax. Extensions provide powerful features for you, the end user, by being a constant stream of new content without requiring a separate purchase or requiring a new product installation.Smarter dataset importing and exporting
Find trends over time and space using spatio-temporal prediction (STP) Create association rules that incorporate geospatial attributes using the generalized spatial association rule (GSAR)
IBM SPSS MODELER
What is MODELER?
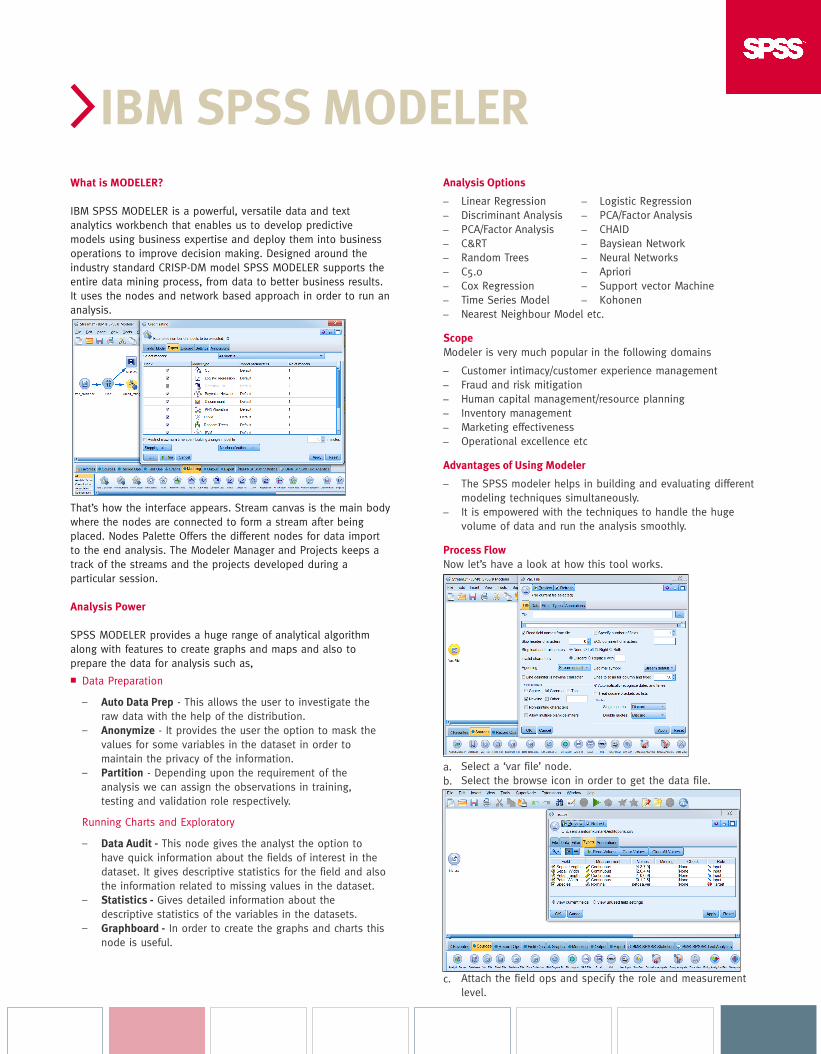
IBM SPSS MODELER is a powerful, versatile data and text analytics workbench that enables us to develop predictive models using business expertise and deploy them into business operations to improve decision making. Designed around the industry standard CRISP-DM model SPSS MODELER supports the entire data mining process, from data to better business results. It uses the nodes and network based approach in order to run an analysis.
That’s how the interface appears. Stream canvas is the main body where the nodes are connected to form a stream after being placed. Nodes Palette Offers the different nodes for data import to the end analysis. The Modeler Manager and Projects keeps a track of the streams and the projects developed during a particular session.
Analysis Power
SPSS MODELER provides a huge range of analytical algorithm along with features to create graphs and maps and also to prepare the data for analysis such as,
Data Preparation
Running Charts and Exploratory
–
–
–
–
–
–
Auto Data Prep - This allows the user to investigate the raw data with the help of the distribution.Anonymize - It provides the user the option to mask the values for some variables in the dataset in order to maintain the privacy of the information.Partition - Depending upon the requirement of the analysis we can assign the observations in training, testing and validation role respectively.
Data Audit - This node gives the analyst the option to have quick information about the fields of interest in the dataset. It gives descriptive statistics for the field and also the information related to missing values in the dataset.Statistics - Gives detailed information about the descriptive statistics of the variables in the datasets.Graphboard - In order to create the graphs and charts this node is useful.
Analysis Options
Scope
Modeler is very much popular in the following domains
Advantages of Using Modeler
Process Flow
Now let’s have a look at how this tool works.
–––––––––
––––––
–
–
a.b.
c.
Linear RegressionDiscriminant AnalysisPCA/Factor AnalysisC&RTRandom TreesC5.0Cox RegressionTime Series ModelNearest Neighbour Model etc.
Customer intimacy/customer experience managementFraud and risk mitigationHuman capital management/resource planningInventory managementMarketing effectivenessOperational excellence etc
The SPSS modeler helps in building and evaluating different modeling techniques simultaneously.It is empowered with the techniques to handle the huge volume of data and run the analysis smoothly.
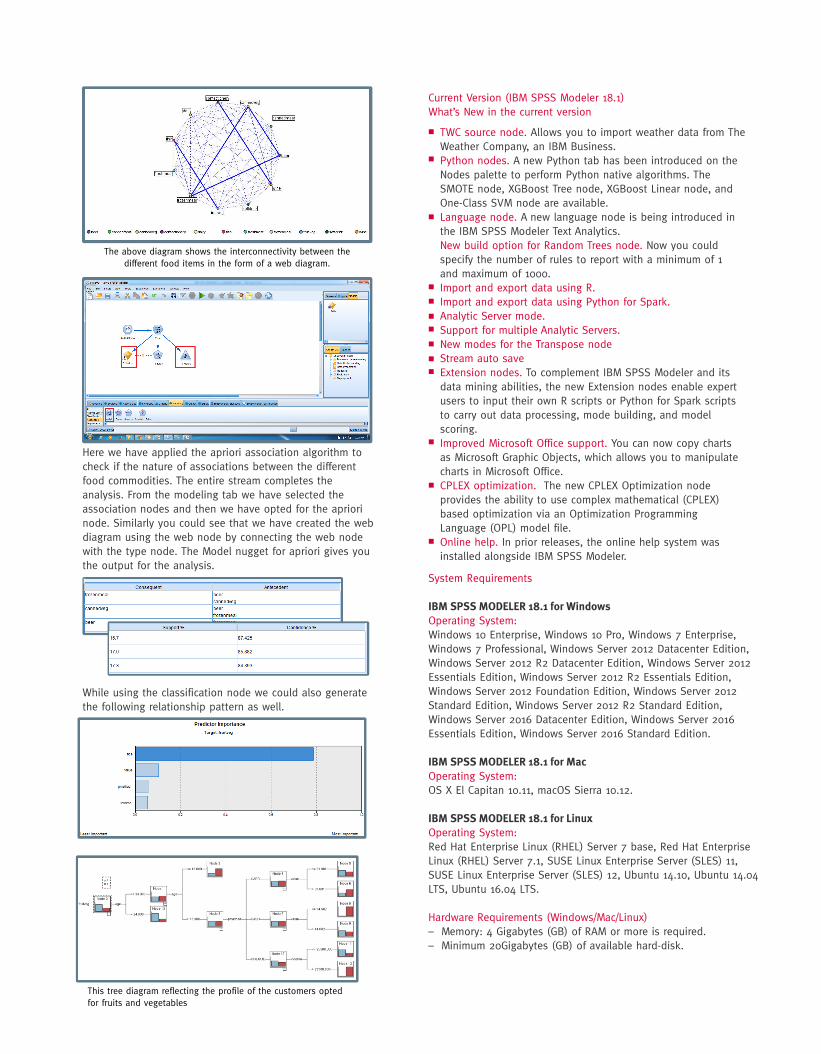
Select a ‘var file’ node.Select the browse icon in order to get the data file.
Attach the field ops and specify the role and measurement level.
––––––––
Logistic RegressionPCA/Factor AnalysisCHAIDBaysiean NetworkNeural NetworksAprioriSupport vector MachineKohonen
Current Version (IBM SPSS Modeler 18.1) What’s New in the current version
System Requirements
IBM SPSS MODELER 18.1 for Windows
Operating System: Windows 10 Enterprise, Windows 10 Pro, Windows 7 Enterprise, Windows 7 Professional, Windows Server 2012 Datacenter Edition, Windows Server 2012 R2 Datacenter Edition, Windows Server 2012 Essentials Edition, Windows Server 2012 R2 Essentials Edition, Windows Server 2012 Foundation Edition, Windows Server 2012 Standard Edition, Windows Server 2012 R2 Standard Edition, Windows Server 2016 Datacenter Edition, Windows Server 2016 Essentials Edition, Windows Server 2016 Standard Edition.
IBM SPSS MODELER 18.1 for Mac
Operating System:OS X El Capitan 10.11, macOS Sierra 10.12.
IBM SPSS MODELER 18.1 for Linux
Operating System:Red Hat Enterprise Linux (RHEL) Server 7 base, Red Hat Enterprise Linux (RHEL) Server 7.1, SUSE Linux Enterprise Server (SLES) 11, SUSE Linux Enterprise Server (SLES) 12, Ubuntu 14.10, Ubuntu 14.04 LTS, Ubuntu 16.04 LTS.
Hardware Requirements (Windows/Mac/Linux)– Memory: 4 Gigabytes (GB) of RAM or more is required.– Minimum 20Gigabytes (GB) of available hard-disk.
TWC source node. Allows you to import weather data from The Weather Company, an IBM Business.Python nodes. A new Python tab has been introduced on the Nodes palette to perform Python native algorithms. The SMOTE node, XGBoost Tree node, XGBoost Linear node, and One-Class SVM node are available.Language node. A new language node is being introduced in the IBM SPSS Modeler Text Analytics.New build option for Random Trees node. Now you could specify the number of rules to report with a minimum of 1 and maximum of 1000.Import and export data using R. Import and export data using Python for Spark.Analytic Server mode.Support for multiple Analytic Servers.New modes for the Transpose nodeStream auto saveExtension nodes. To complement IBM SPSS Modeler and its data mining abilities, the new Extension nodes enable expert users to input their own R scripts or Python for Spark scripts to carry out data processing, mode building, and model scoring.Improved Microsoft Office support. You can now copy charts as Microsoft Graphic Objects, which allows you to manipulate charts in Microsoft Office. CPLEX optimization. The new CPLEX Optimization node provides the ability to use complex mathematical (CPLEX) based optimization via an Optimization Programming Language (OPL) model file.Online help. In prior releases, the online help system wasinstalled alongside IBM SPSS Modeler.
Here we have applied the apriori association algorithm to check if the nature of associations between the different food commodities. The entire stream completes the analysis. From the modeling tab we have selected the association nodes and then we have opted for the apriori node. Similarly you could see that we have created the web diagram using the web node by connecting the web node with the type node. The Model nugget for apriori gives you the output for the analysis.
While using the classification node we could also generate the following relationship pattern as well.
The above diagram shows the interconnectivity between the different food items in the form of a web diagram.
This tree diagram reflecting the profile of the customers opted for fruits and vegetables
IBM SPSS Text Analyticsfor Surveys 4.0.1
How IBM SPSS Text Analytics for Surveys works
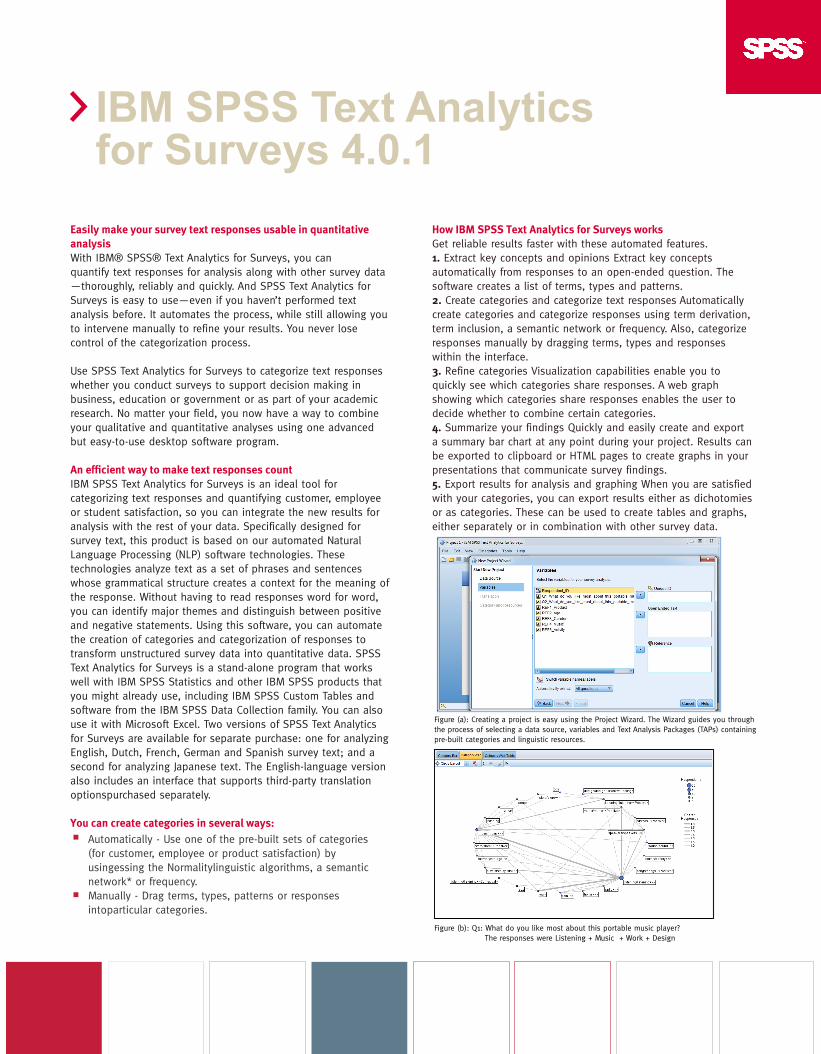
Get reliable results faster with these automated features.1. Extract key concepts and opinions Extract key conceptsautomatically from responses to an open-ended question. Thesoftware creates a list of terms, types and patterns.2. Create categories and categorize text responses Automaticallycreate categories and categorize responses using term derivation,term inclusion, a semantic network or frequency. Also, categorizeresponses manually by dragging terms, types and responses within the interface.3. Refine categories Visualization capabilities enable you to quickly see which categories share responses. A web graph showing which categories share responses enables the user to decide whether to combine certain categories.4. Summarize your findings Quickly and easily create and export a summary bar chart at any point during your project. Results can be exported to clipboard or HTML pages to create graphs in your presentations that communicate survey findings.5. Export results for analysis and graphing When you are satisfiedwith your categories, you can export results either as dichotomies or as categories. These can be used to create tables and graphs, either separately or in combination with other survey data.
Figure (a): Creating a project is easy using the Project Wizard. The Wizard guides you throughthe process of selecting a data source, variables and Text Analysis Packages (TAPs) containingpre-built categories and linguistic resources.
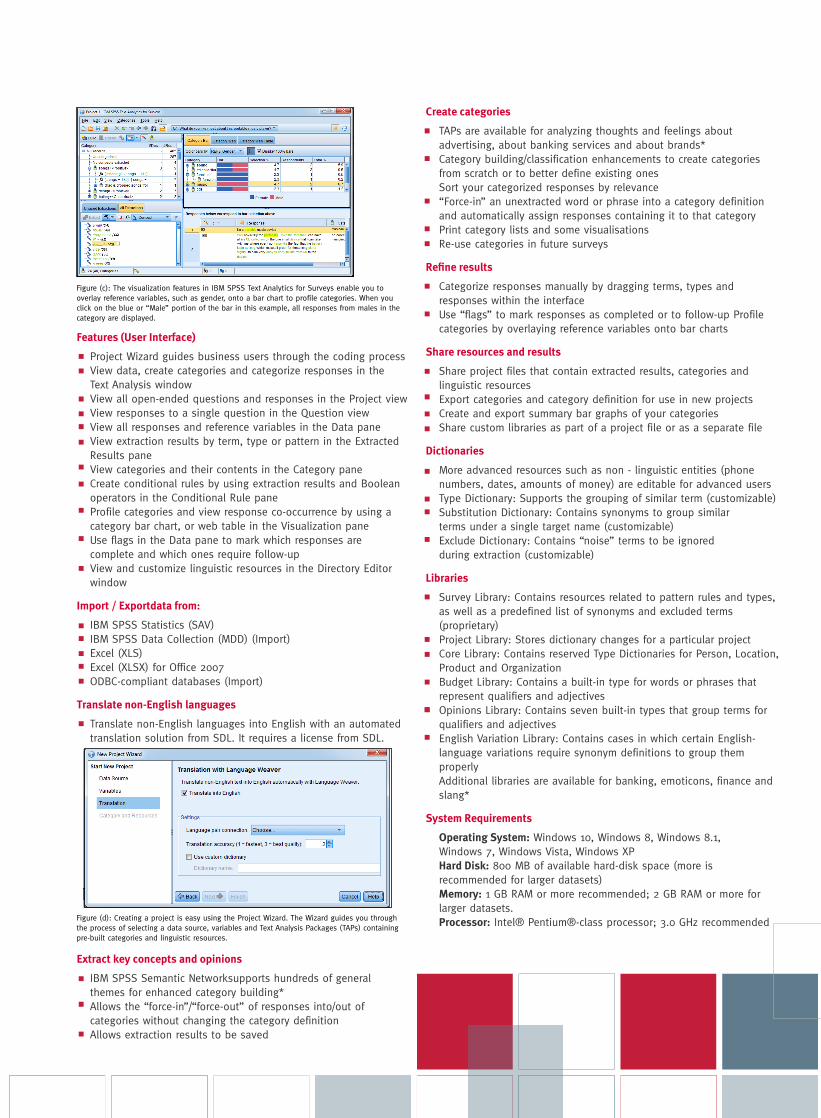
Figure (b): Q1: What do you like most about this portable music player? The responses were Listening + Music + Work + Design
Easily make your survey text responses usable in quantitative
analysis
With IBM® SPSS® Text Analytics for Surveys, you canquantify text responses for analysis along with other survey data—thoroughly, reliably and quickly. And SPSS Text Analytics for Surveys is easy to use—even if you haven’t performed text analysis before. It automates the process, while still allowing you to intervene manually to refine your results. You never lose control of the categorization process.
Use SPSS Text Analytics for Surveys to categorize text responseswhether you conduct surveys to support decision making in business, education or government or as part of your academic research. No matter your field, you now have a way to combine your qualitative and quantitative analyses using one advanced but easy-to-use desktop software program.
An efficient way to make text responses count
IBM SPSS Text Analytics for Surveys is an ideal tool for categorizing text responses and quantifying customer, employee or student satisfaction, so you can integrate the new results for analysis with the rest of your data. Specifically designed for survey text, this product is based on our automated Natural Language Processing (NLP) software technologies. These technologies analyze text as a set of phrases and sentences whose grammatical structure creates a context for the meaning of the response. Without having to read responses word for word, you can identify major themes and distinguish between positive and negative statements. Using this software, you can automate the creation of categories and categorization of responses to transform unstructured survey data into quantitative data. SPSS Text Analytics for Surveys is a stand-alone program that works well with IBM SPSS Statistics and other IBM SPSS products that you might already use, including IBM SPSS Custom Tables and software from the IBM SPSS Data Collection family. You can also use it with Microsoft Excel. Two versions of SPSS Text Analytics for Surveys are available for separate purchase: one for analyzing English, Dutch, French, German and Spanish survey text; and a second for analyzing Japanese text. The English-language version also includes an interface that supports third-party translation optionspurchased separately.
You can create categories in several ways:
Automatically - Use one of the pre-built sets of categories(for customer, employee or product satisfaction) by usingessing the Normalitylinguistic algorithms, a semantic network* or frequency.Manually - Drag terms, types, patterns or responses intoparticular categories.
Features (User Interface)
Import / Exportdata from:
Translate non-English languages
Extract key concepts and opinions
Project Wizard guides business users through the coding processView data, create categories and categorize responses in theText Analysis windowView all open-ended questions and responses in the Project viewView responses to a single question in the Question viewView all responses and reference variables in the Data paneView extraction results by term, type or pattern in the ExtractedResults paneView categories and their contents in the Category paneCreate conditional rules by using extraction results and Booleanoperators in the Conditional Rule paneProfile categories and view response co-occurrence by using acategory bar chart, or web table in the Visualization paneUse flags in the Data pane to mark which responses arecomplete and which ones require follow-upView and customize linguistic resources in the Directory Editorwindow
IBM SPSS Statistics (SAV)IBM SPSS Data Collection (MDD) (Import)Excel (XLS)Excel (XLSX) for Office 2007ODBC-compliant databases (Import)
Translate non-English languages into English with an automatedtranslation solution from SDL. It requires a license from SDL.
IBM SPSS Semantic Networksupports hundreds of generalthemes for enhanced category building*Allows the “force-in”/“force-out” of responses into/out ofcategories without changing the category definitionAllows extraction results to be saved
Figure (c): The visualization features in IBM SPSS Text Analytics for Surveys enable you tooverlay reference variables, such as gender, onto a bar chart to profile categories. When youclick on the blue or “Male” portion of the bar in this example, all responses from males in thecategory are displayed.
Figure (d): Creating a project is easy using the Project Wizard. The Wizard guides you throughthe process of selecting a data source, variables and Text Analysis Packages (TAPs) containingpre-built categories and linguistic resources.
Create categories
Refine results
Share resources and results
Dictionaries
Libraries
System Requirements
TAPs are available for analyzing thoughts and feelings about advertising, about banking services and about brands*Category building/classification enhancements to create categories from scratch or to better define existing onesSort your categorized responses by relevance“Force-in” an unextracted word or phrase into a category definition and automatically assign responses containing it to that categoryPrint category lists and some visualisationsRe-use categories in future surveys
Categorize responses manually by dragging terms, types and responses within the interfaceUse “flags” to mark responses as completed or to follow-up Profile categories by overlaying reference variables onto bar charts
Share project files that contain extracted results, categories andlinguistic resourcesExport categories and category definition for use in new projectsCreate and export summary bar graphs of your categoriesShare custom libraries as part of a project file or as a separate file
More advanced resources such as non - linguistic entities (phonenumbers, dates, amounts of money) are editable for advanced usersType Dictionary: Supports the grouping of similar term (customizable)Substitution Dictionary: Contains synonyms to group similarterms under a single target name (customizable)Exclude Dictionary: Contains “noise” terms to be ignoredduring extraction (customizable)
Survey Library: Contains resources related to pattern rules and types, as well as a predefined list of synonyms and excluded terms (proprietary)Project Library: Stores dictionary changes for a particular projectCore Library: Contains reserved Type Dictionaries for Person, Location, Product and OrganizationBudget Library: Contains a built-in type for words or phrases that represent qualifiers and adjectivesOpinions Library: Contains seven built-in types that group terms for qualifiers and adjectivesEnglish Variation Library: Contains cases in which certain English-language variations require synonym definitions to group them properlyAdditional libraries are available for banking, emoticons, finance and slang*
Operating System: Windows 10, Windows 8, Windows 8.1,Windows 7, Windows Vista, Windows XPHard Disk: 800 MB of available hard-disk space (more is recommended for larger datasets)Memory: 1 GB RAM or more recommended; 2 GB RAM or more for larger datasets.Processor: Intel® Pentium®-class processor; 3.0 GHz recommended
What's Newin SPSS AMOS 25
What is IBM SPSS AMOS 25?
Structural equation modeling’s approach to multivariate analysis encompasses and extends standard methods—including regression, factor analysis, correlation and analysis of variance. IBM SPSS Amos software makes SEM easy. It’s an ideal modeling tool for a variety of purposes, including marketplace research, business planning and academic program evaluation.
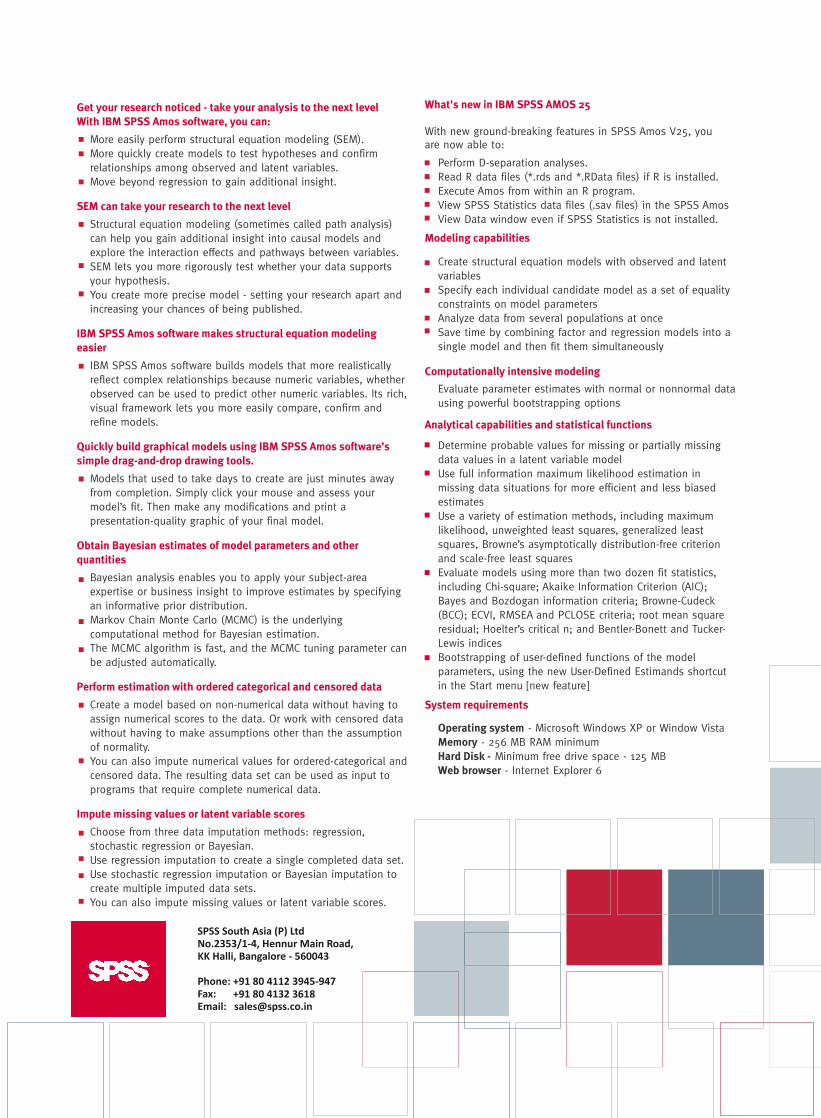
4. View output
Hot links in the help system link to explanations of the analysis in plain English.
5. Assess your model’s fit
Make modifications to your model and print publication-quality output.
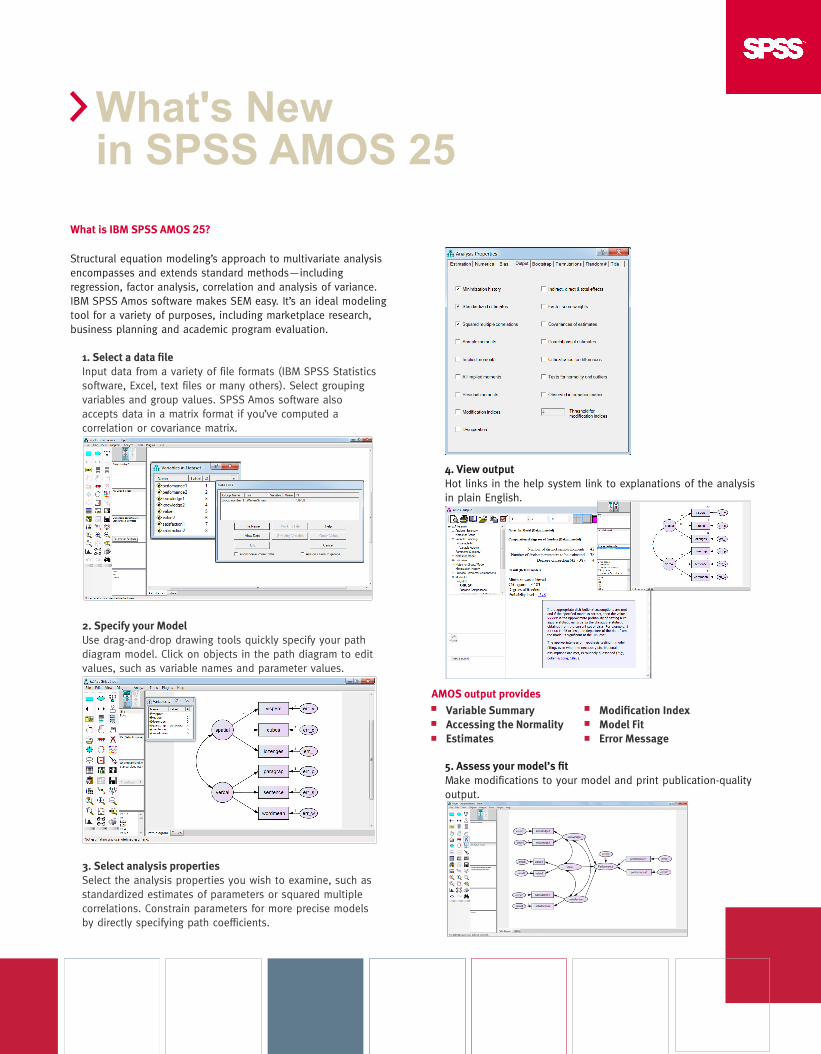
1. Select a data file
Input data from a variety of file formats (IBM SPSS Statistics software, Excel, text files or many others). Select grouping variables and group values. SPSS Amos software also accepts data in a matrix format if you’ve computed a correlation or covariance matrix.
2. Specify your Model
Use drag-and-drop drawing tools quickly specify your path diagram model. Click on objects in the path diagram to edit values, such as variable names and parameter values.
3. Select analysis properties
Select the analysis properties you wish to examine, such as standardized estimates of parameters or squared multiple correlations. Constrain parameters for more precise models by directly specifying path coefficients.
AMOS output provides
Variable Summary
Accessing the Normality
Estimates
Modification Index
Model Fit
Error Message
Get your research noticed - take your analysis to the next level
With IBM SPSS Amos software, you can:
SEM can take your research to the next level
IBM SPSS Amos software makes structural equation modeling
easier
Quickly build graphical models using IBM SPSS Amos software’s
simple drag-and-drop drawing tools.
Obtain Bayesian estimates of model parameters and other
quantities
Perform estimation with ordered categorical and censored data
Impute missing values or latent variable scores
More easily perform structural equation modeling (SEM). More quickly create models to test hypotheses and confirm relationships among observed and latent variables.Move beyond regression to gain additional insight.
Structural equation modeling (sometimes called path analysis)can help you gain additional insight into causal models and explore the interaction effects and pathways between variables.SEM lets you more rigorously test whether your data supports your hypothesis. You create more precise model - setting your research apart and increasing your chances of being published.
IBM SPSS Amos software builds models that more realistically reflect complex relationships because numeric variables, whether observed can be used to predict other numeric variables. Its rich, visual framework lets you more easily compare, confirm and refine models.
Models that used to take days to create are just minutes away from completion. Simply click your mouse and assess your model’s fit. Then make any modifications and print a presentation-quality graphic of your final model.
Bayesian analysis enables you to apply your subject-area expertise or business insight to improve estimates by specifying an informative prior distribution.Markov Chain Monte Carlo (MCMC) is the underlying computational method for Bayesian estimation.The MCMC algorithm is fast, and the MCMC tuning parameter can be adjusted automatically.
Create a model based on non-numerical data without having to assign numerical scores to the data. Or work with censored data without having to make assumptions other than the assumption of normality.You can also impute numerical values for ordered-categorical and censored data. The resulting data set can be used as input to programs that require complete numerical data.
Choose from three data imputation methods: regression, stochastic regression or Bayesian.Use regression imputation to create a single completed data set. Use stochastic regression imputation or Bayesian imputation to create multiple imputed data sets.You can also impute missing values or latent variable scores.
What's new in IBM SPSS AMOS 25
With new ground-breaking features in SPSS Amos V25, you are now able to:
Modeling capabilities
Computationally intensive modeling
Analytical capabilities and statistical functions
System requirements
Perform D-separation analyses.Read R data files (*.rds and *.RData files) if R is installed.Execute Amos from within an R program.View SPSS Statistics data files (.sav files) in the SPSS Amos View Data window even if SPSS Statistics is not installed.
Create structural equation models with observed and latent variables Specify each individual candidate model as a set of equality constraints on model parameters Analyze data from several populations at once Save time by combining factor and regression models into a single model and then fit them simultaneously
Evaluate parameter estimates with normal or nonnormal data using powerful bootstrapping options
Determine probable values for missing or partially missing data values in a latent variable model Use full information maximum likelihood estimation in missing data situations for more efficient and less biased estimates Use a variety of estimation methods, including maximum likelihood, unweighted least squares, generalized least squares, Browne’s asymptotically distribution-free criterion and scale-free least squaresEvaluate models using more than two dozen fit statistics, including Chi-square; Akaike Information Criterion (AIC); Bayes and Bozdogan information criteria; Browne-Cudeck (BCC); ECVI, RMSEA and PCLOSE criteria; root mean square residual; Hoelter’s critical n; and Bentler-Bonett and Tucker-Lewis indices Bootstrapping of user-defined functions of the model parameters, using the new User-Defined Estimands shortcut in the Start menu [new feature]
Operating system - Microsoft Windows XP or Window Vista Memory - 256 MB RAM minimum Hard Disk - Minimum free drive space - 125 MBWeb browser - Internet Explorer 6
SPSS South Asia (P) LtdNo.2353/1-4, Hennur Main Road, KK Halli, Bangalore - 560043
Phone: +91 80 4112 3945-947Fax: Email: [email protected]
+91 80 4132 3618