what's new in elasticsearch v5
TRANSCRIPT

What’s New in v5
1
2
2010 2012 2013 2014 2015 2016
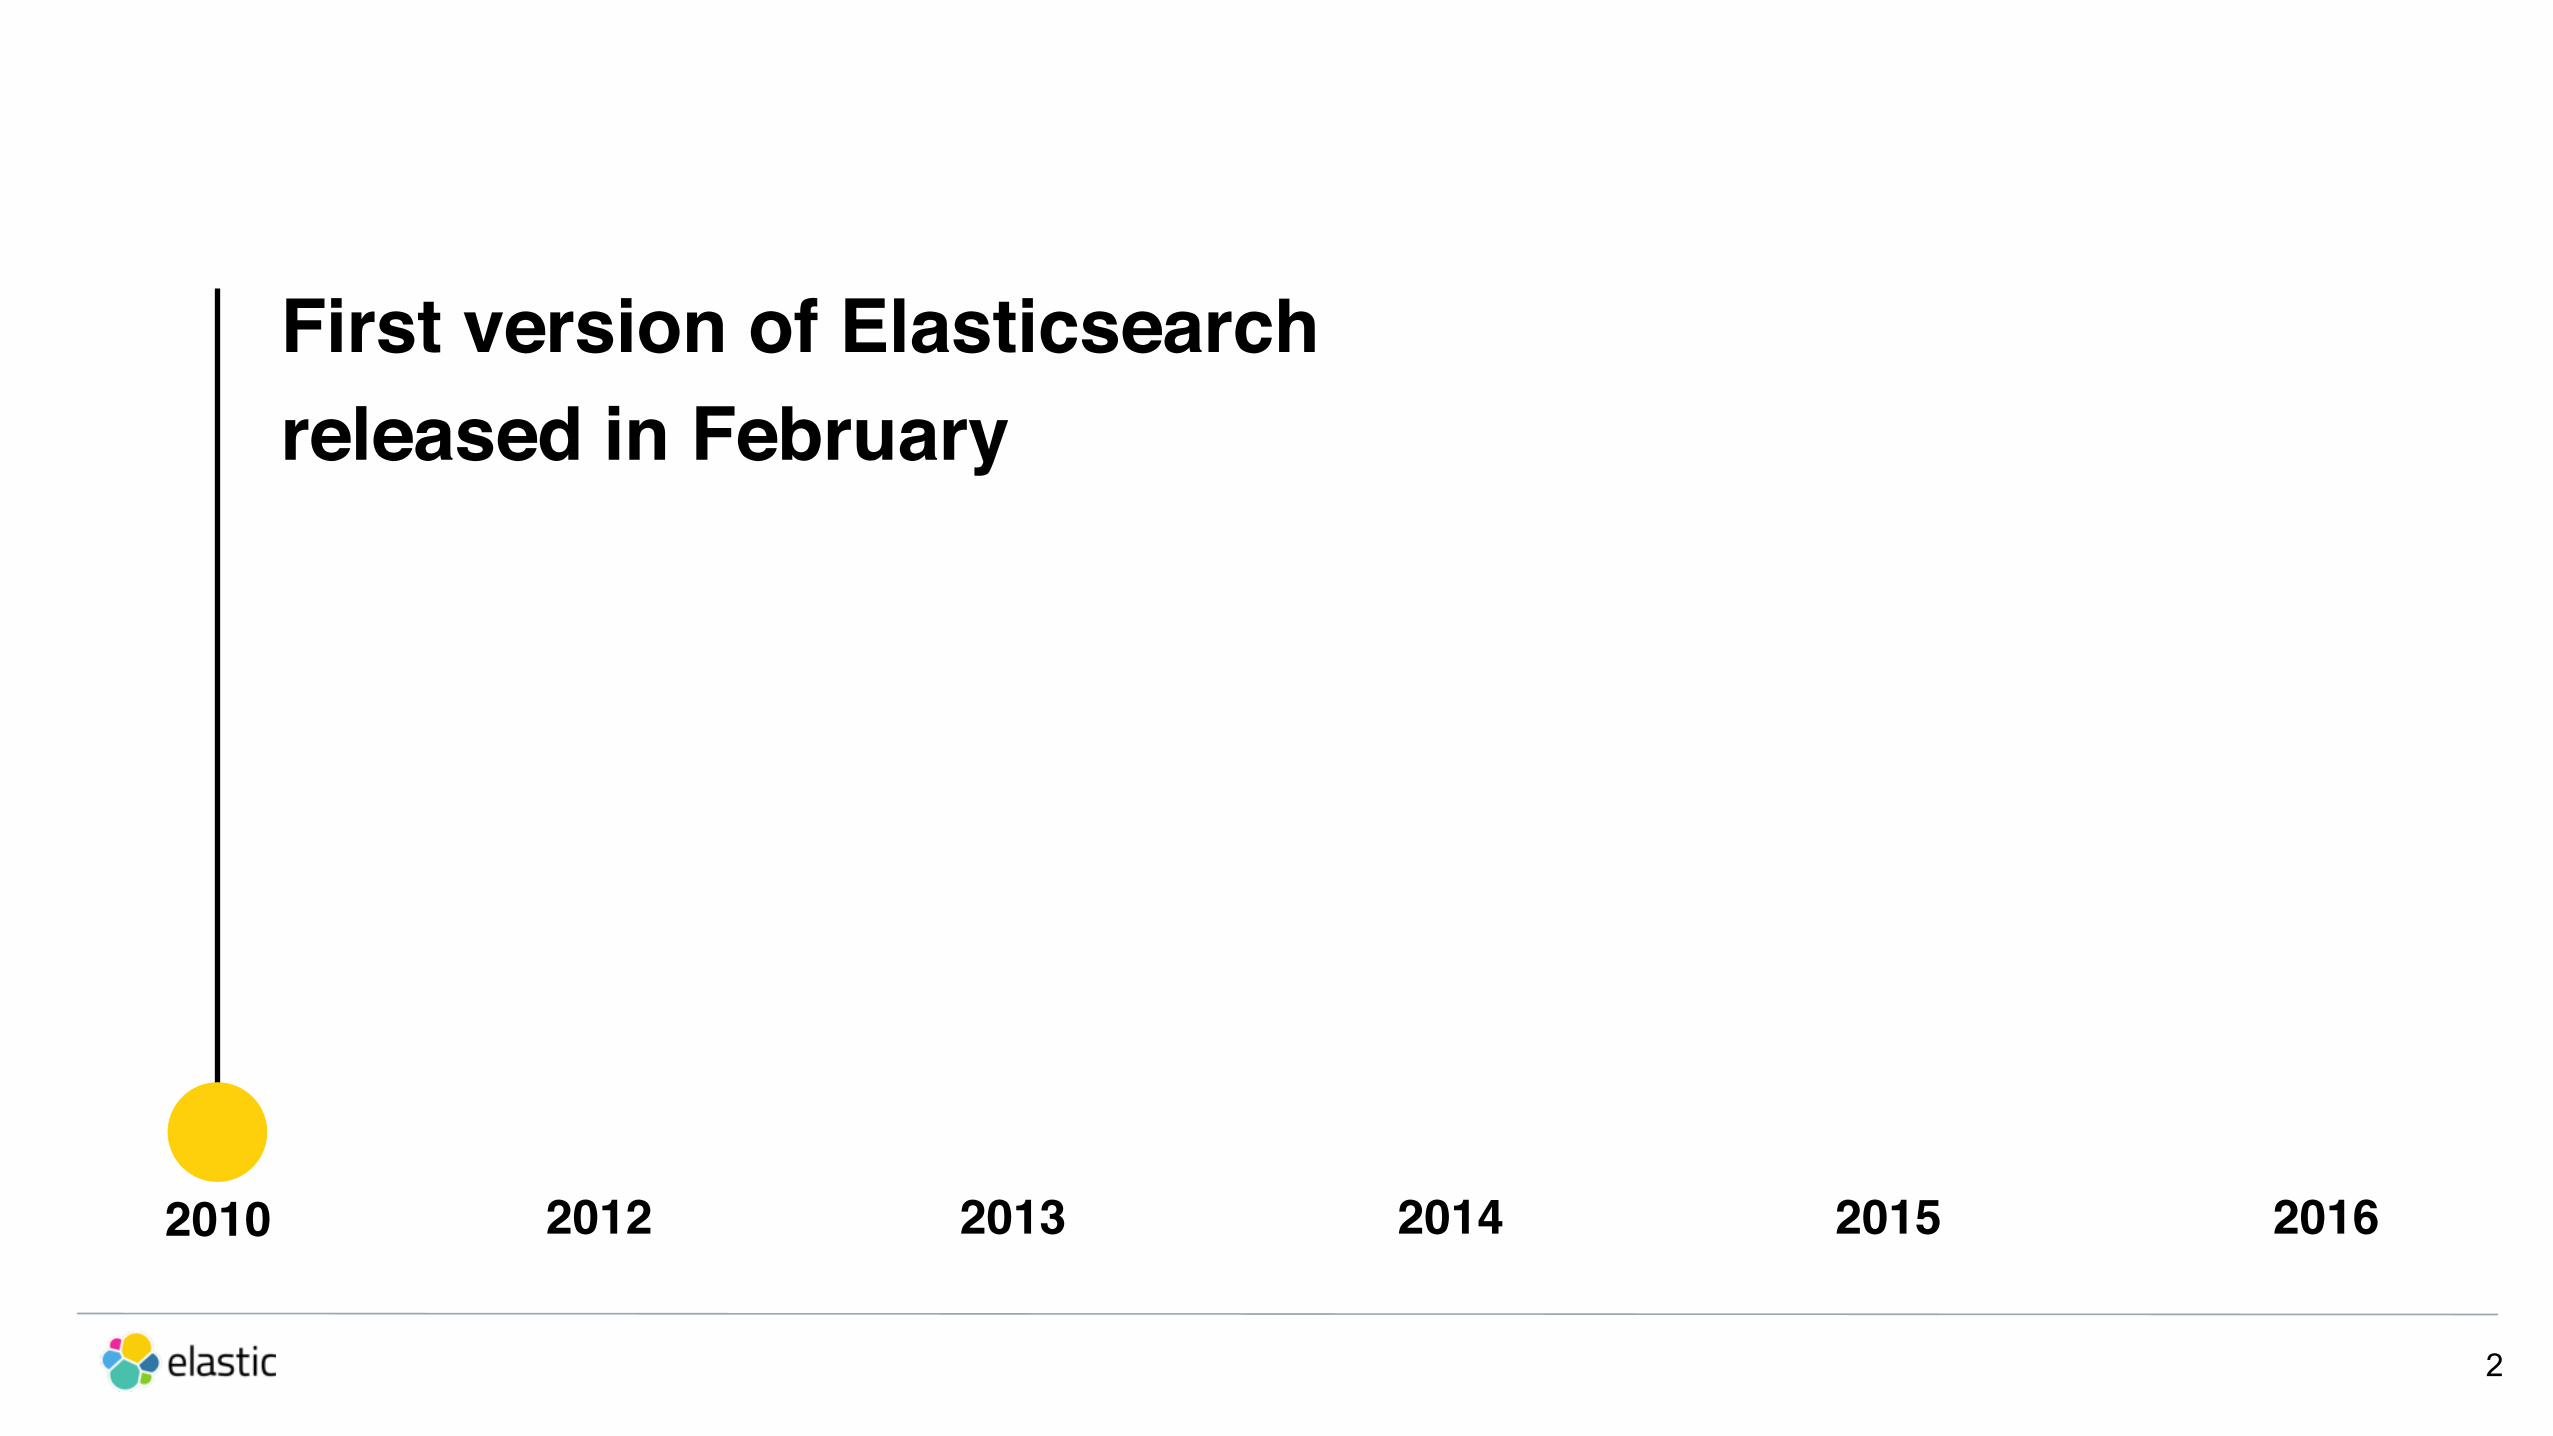
First version of Elasticsearchreleased in February

3
2010 2012 2013 2014 2015 2016
Elasticsearch founded as a companyTotal cumulative downloads 2M

2010
Kibana and Logstash open source projects join Elasticsearch Total cumulative downloads 5M
2012 2013 2014 2015 2016
4

2010
1.0 GA Elasticsearch Release of Marvel (monitoring) Total cumulative downloads 18M
2012 2013 2014 2015 2016
5
2010
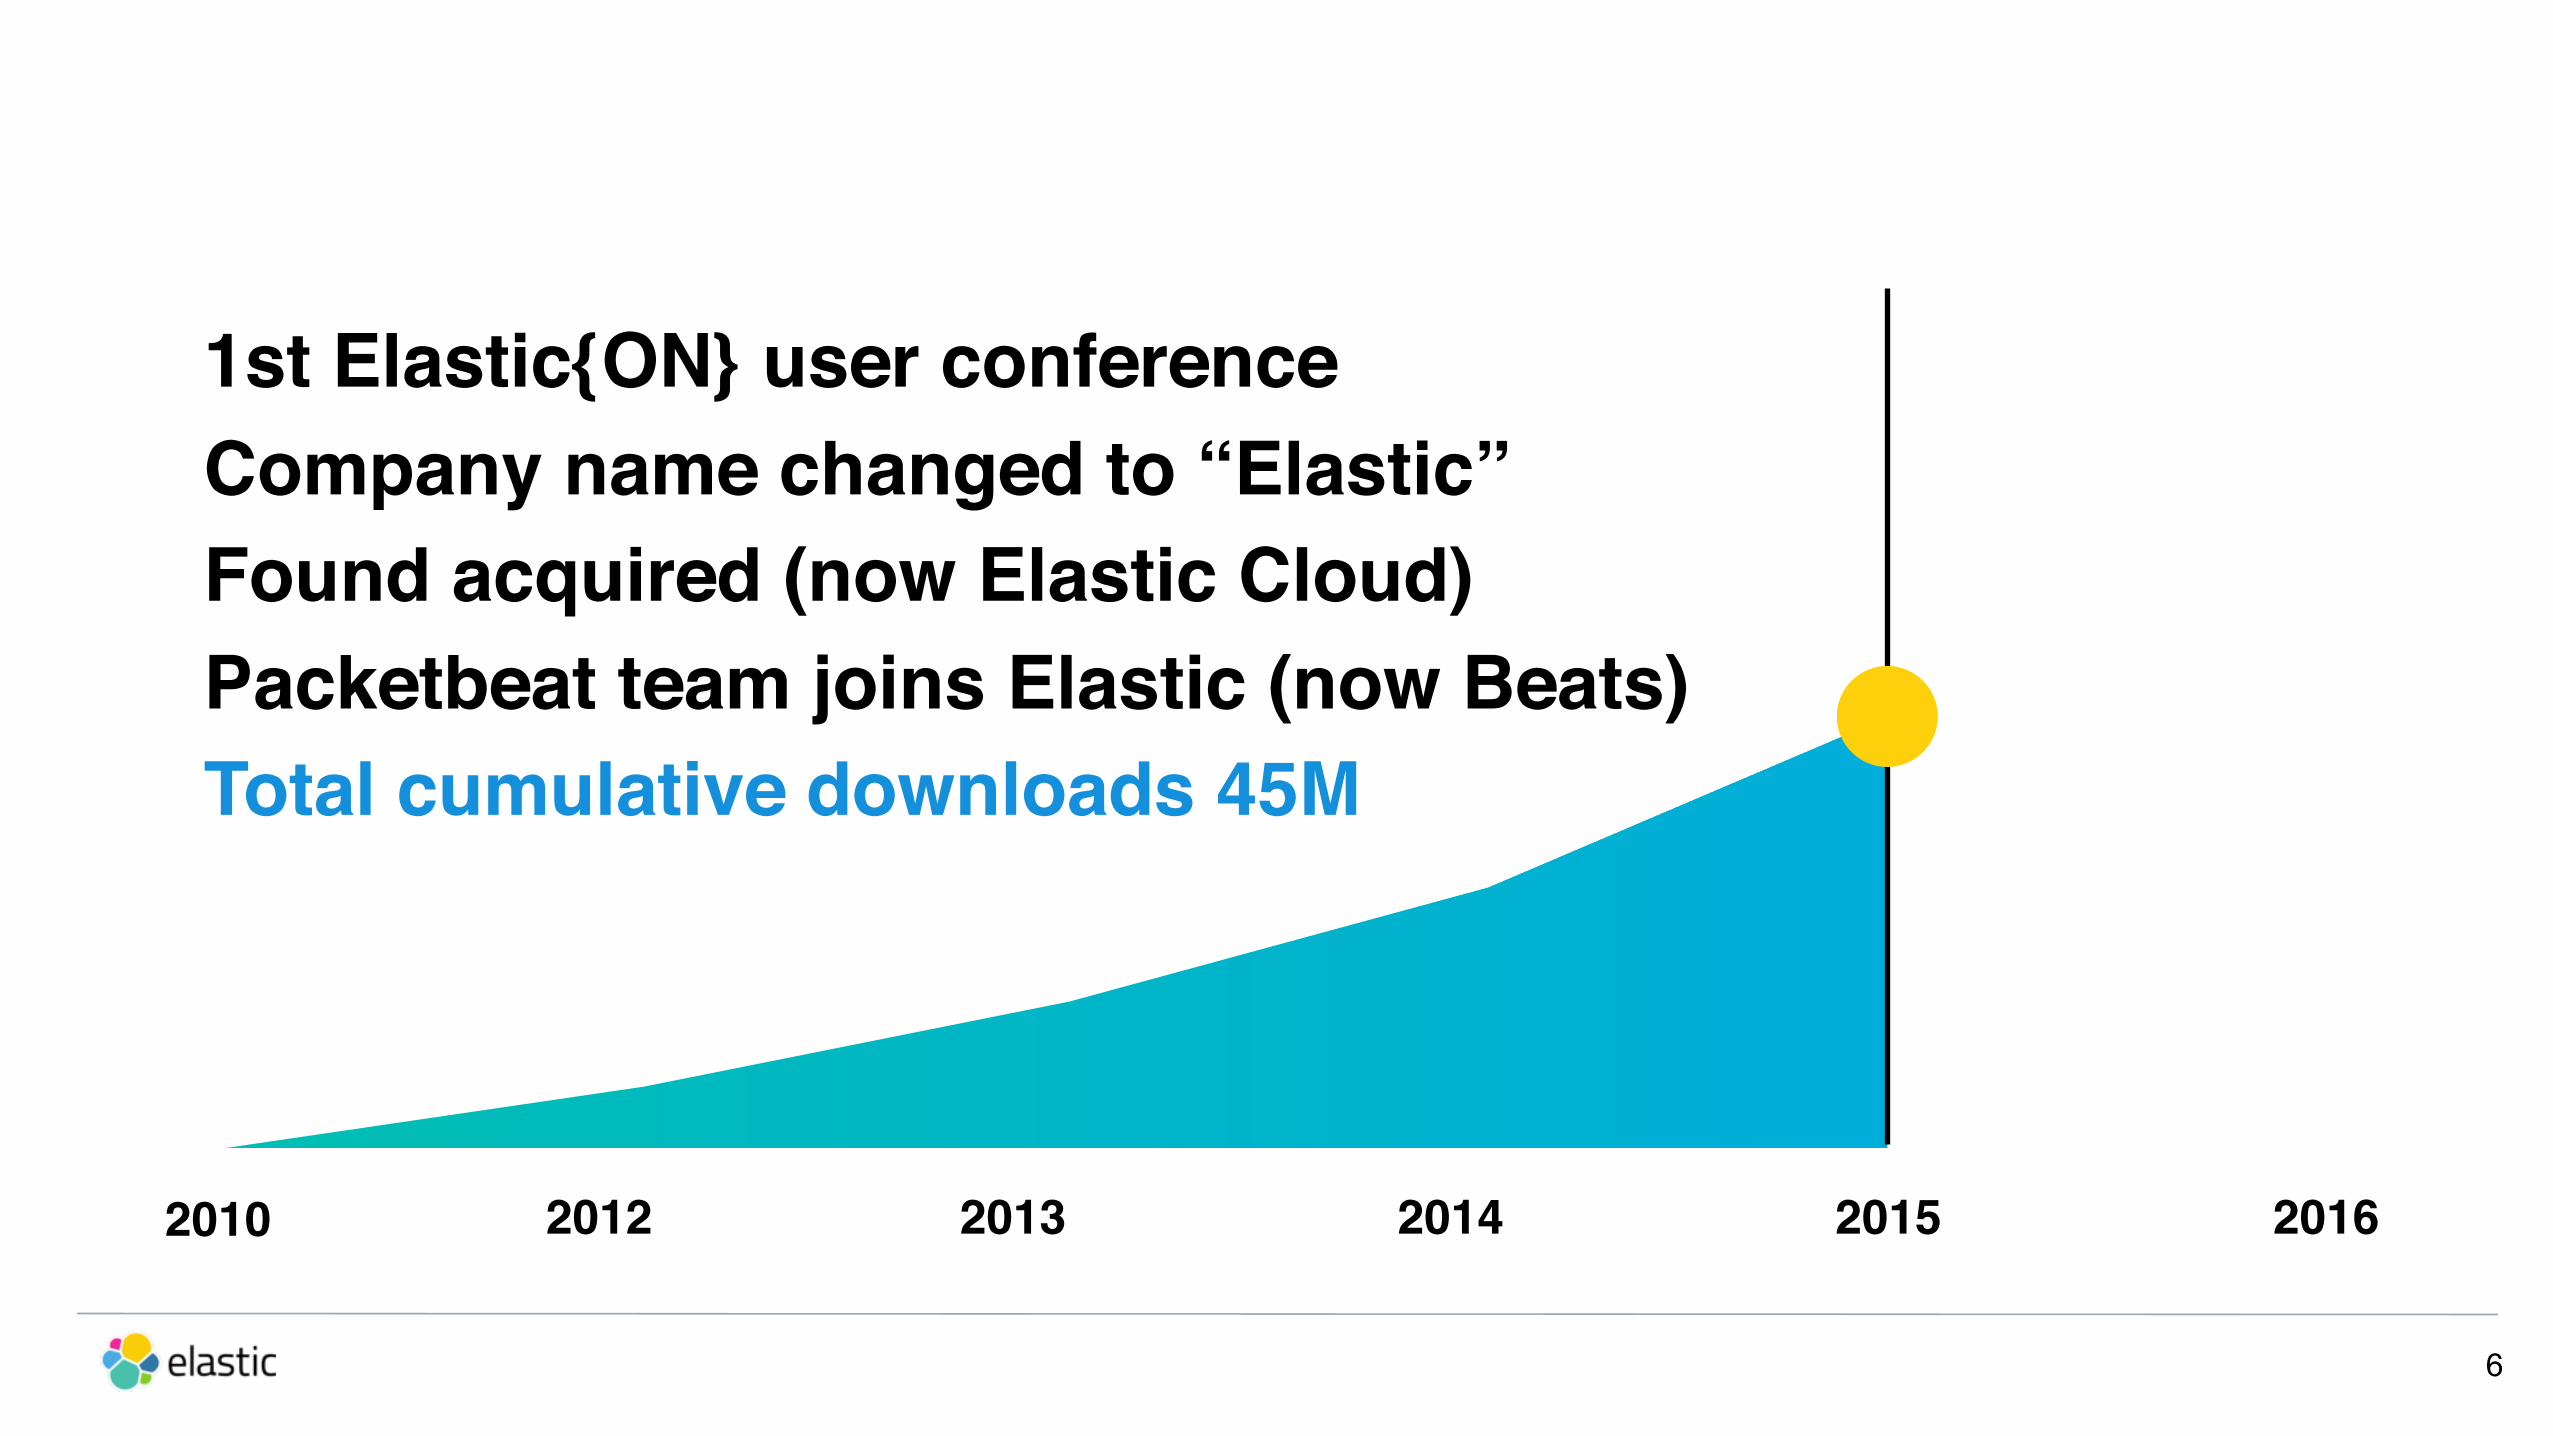
1st Elastic{ON} user conference Company name changed to “Elastic” Found acquired (now Elastic Cloud)Packetbeat team joins Elastic (now Beats) Total cumulative downloads 45M
2012 2013 2014 2015 2016
6

2010
2nd Elastic{ON} user conferenceELK “Elastic Stack” Prelert acquisition Total cumulative downloads …
2012 2013 2014 2015 2016
7
75,000,000DOWNLOADS

APIs Plugins Visualization
ELK Stack

Along Came Beats
ELKB

11
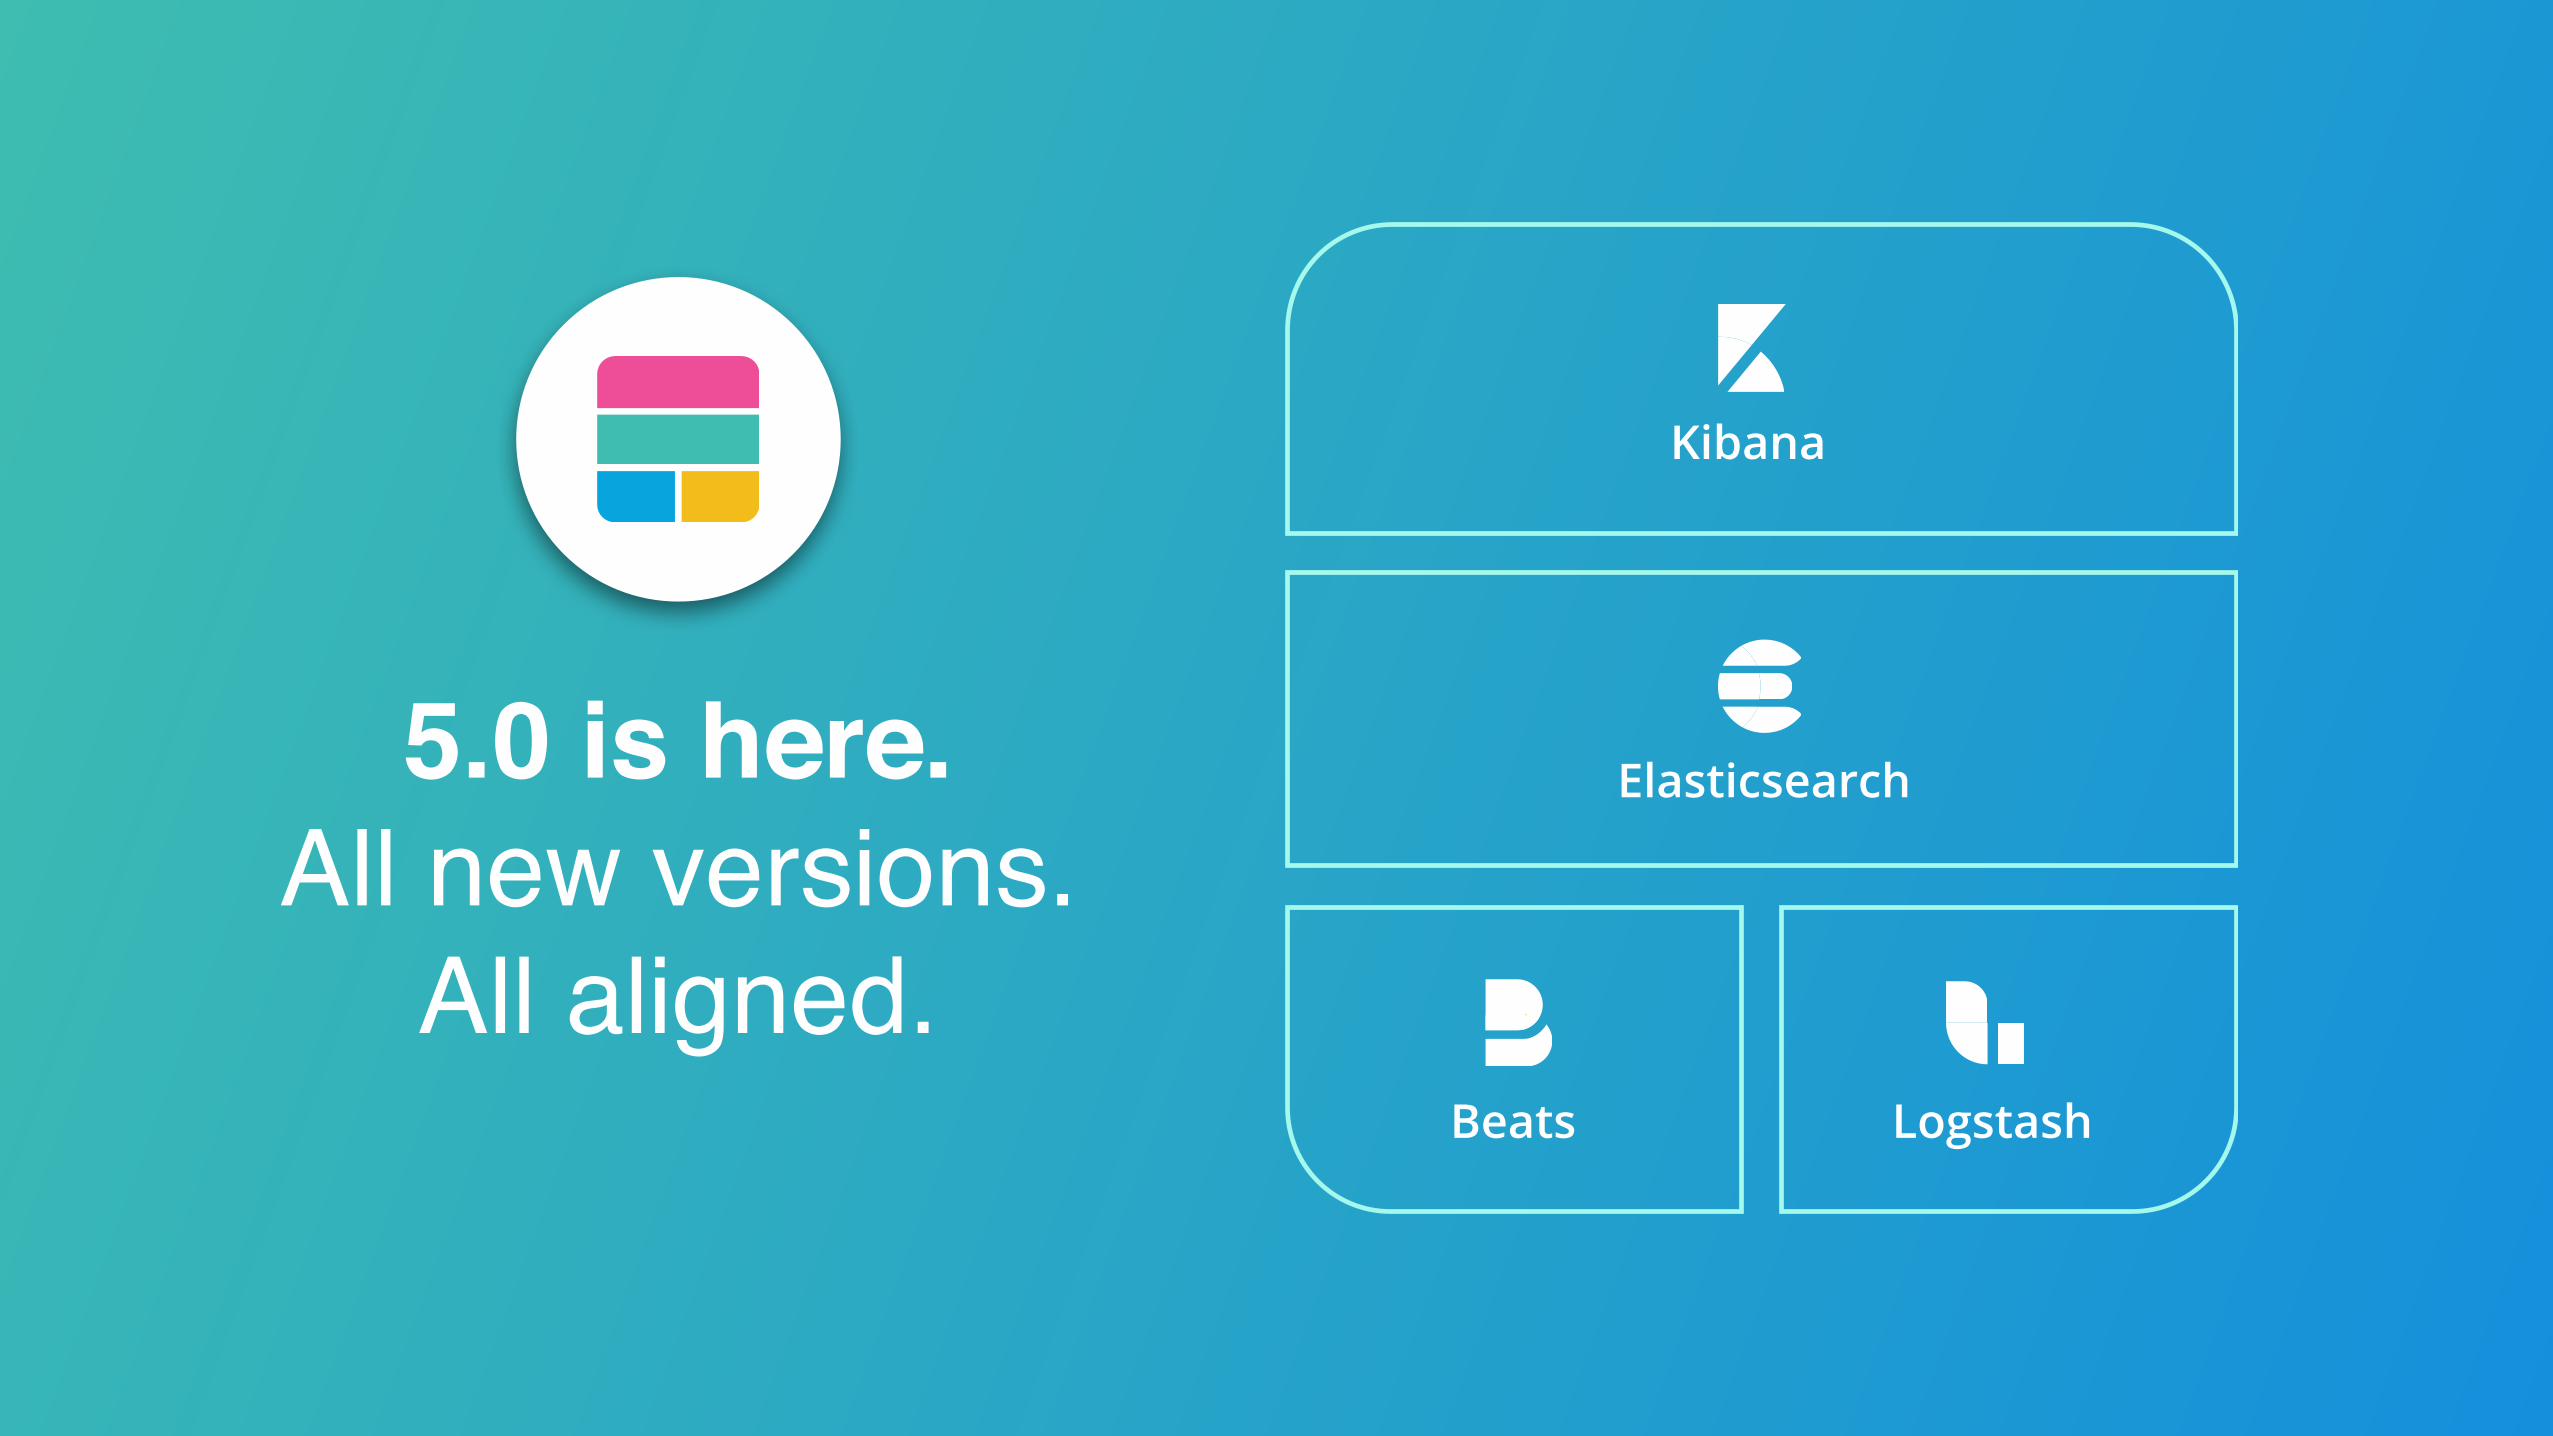
Elastic Stack
Kibana
Elasticsearch
Beats Logstash

12
Kibana
Elasticsearch
Beats Logstash
Security
Alerting
Monitoring
Reporting
X-Pack
Graph

13
Kibana
Elasticsearch
Beats Logstash
X-Pack Elastic Cloud
Security
Alerting
Monitoring
Reporting
Graph

14
Jun 9, 2015
1.6Jul 16, 2015
1.7
Feb 19, 2015
4.0Jun 10, 2015
4.1
May 14th, 2015
1.5
May 27th, 2015
1.0 Beta 1July 13th, 2015
1.0 Beta 2Sept 4 th, 2015
1.0 Beta 3
May 23, 2015
1.5Nov 5, 2014
1.4
It’s complicated
es
kibana
ls
beats
Elasticsearch
Beats Logstash
Kibana
5.0 is here.All new versions.
All aligned.

16
Working beautifully together
es
kibana
ls
beats
6.0 7.0
x-pack
5.0
5.0
5.0
5.0
5.0

Search and analytics, it all started here
More than 60% of our customers have a search or analytics use case

18

19

Logs Logs Logs, many devices, many systems
More than 40% of ourcustomers use our productsfor operational log analysis

We collect more than
1.2 TB logs every day from our infrastructure, web servers, and applications.
21

We analyze more than 400 Million events a day to maximize our manufacturing processes and increase efficiency across our teams.
22

Sniff sniff sniff,find the bad actors in your data
200% YoY growth in security use cases with our products
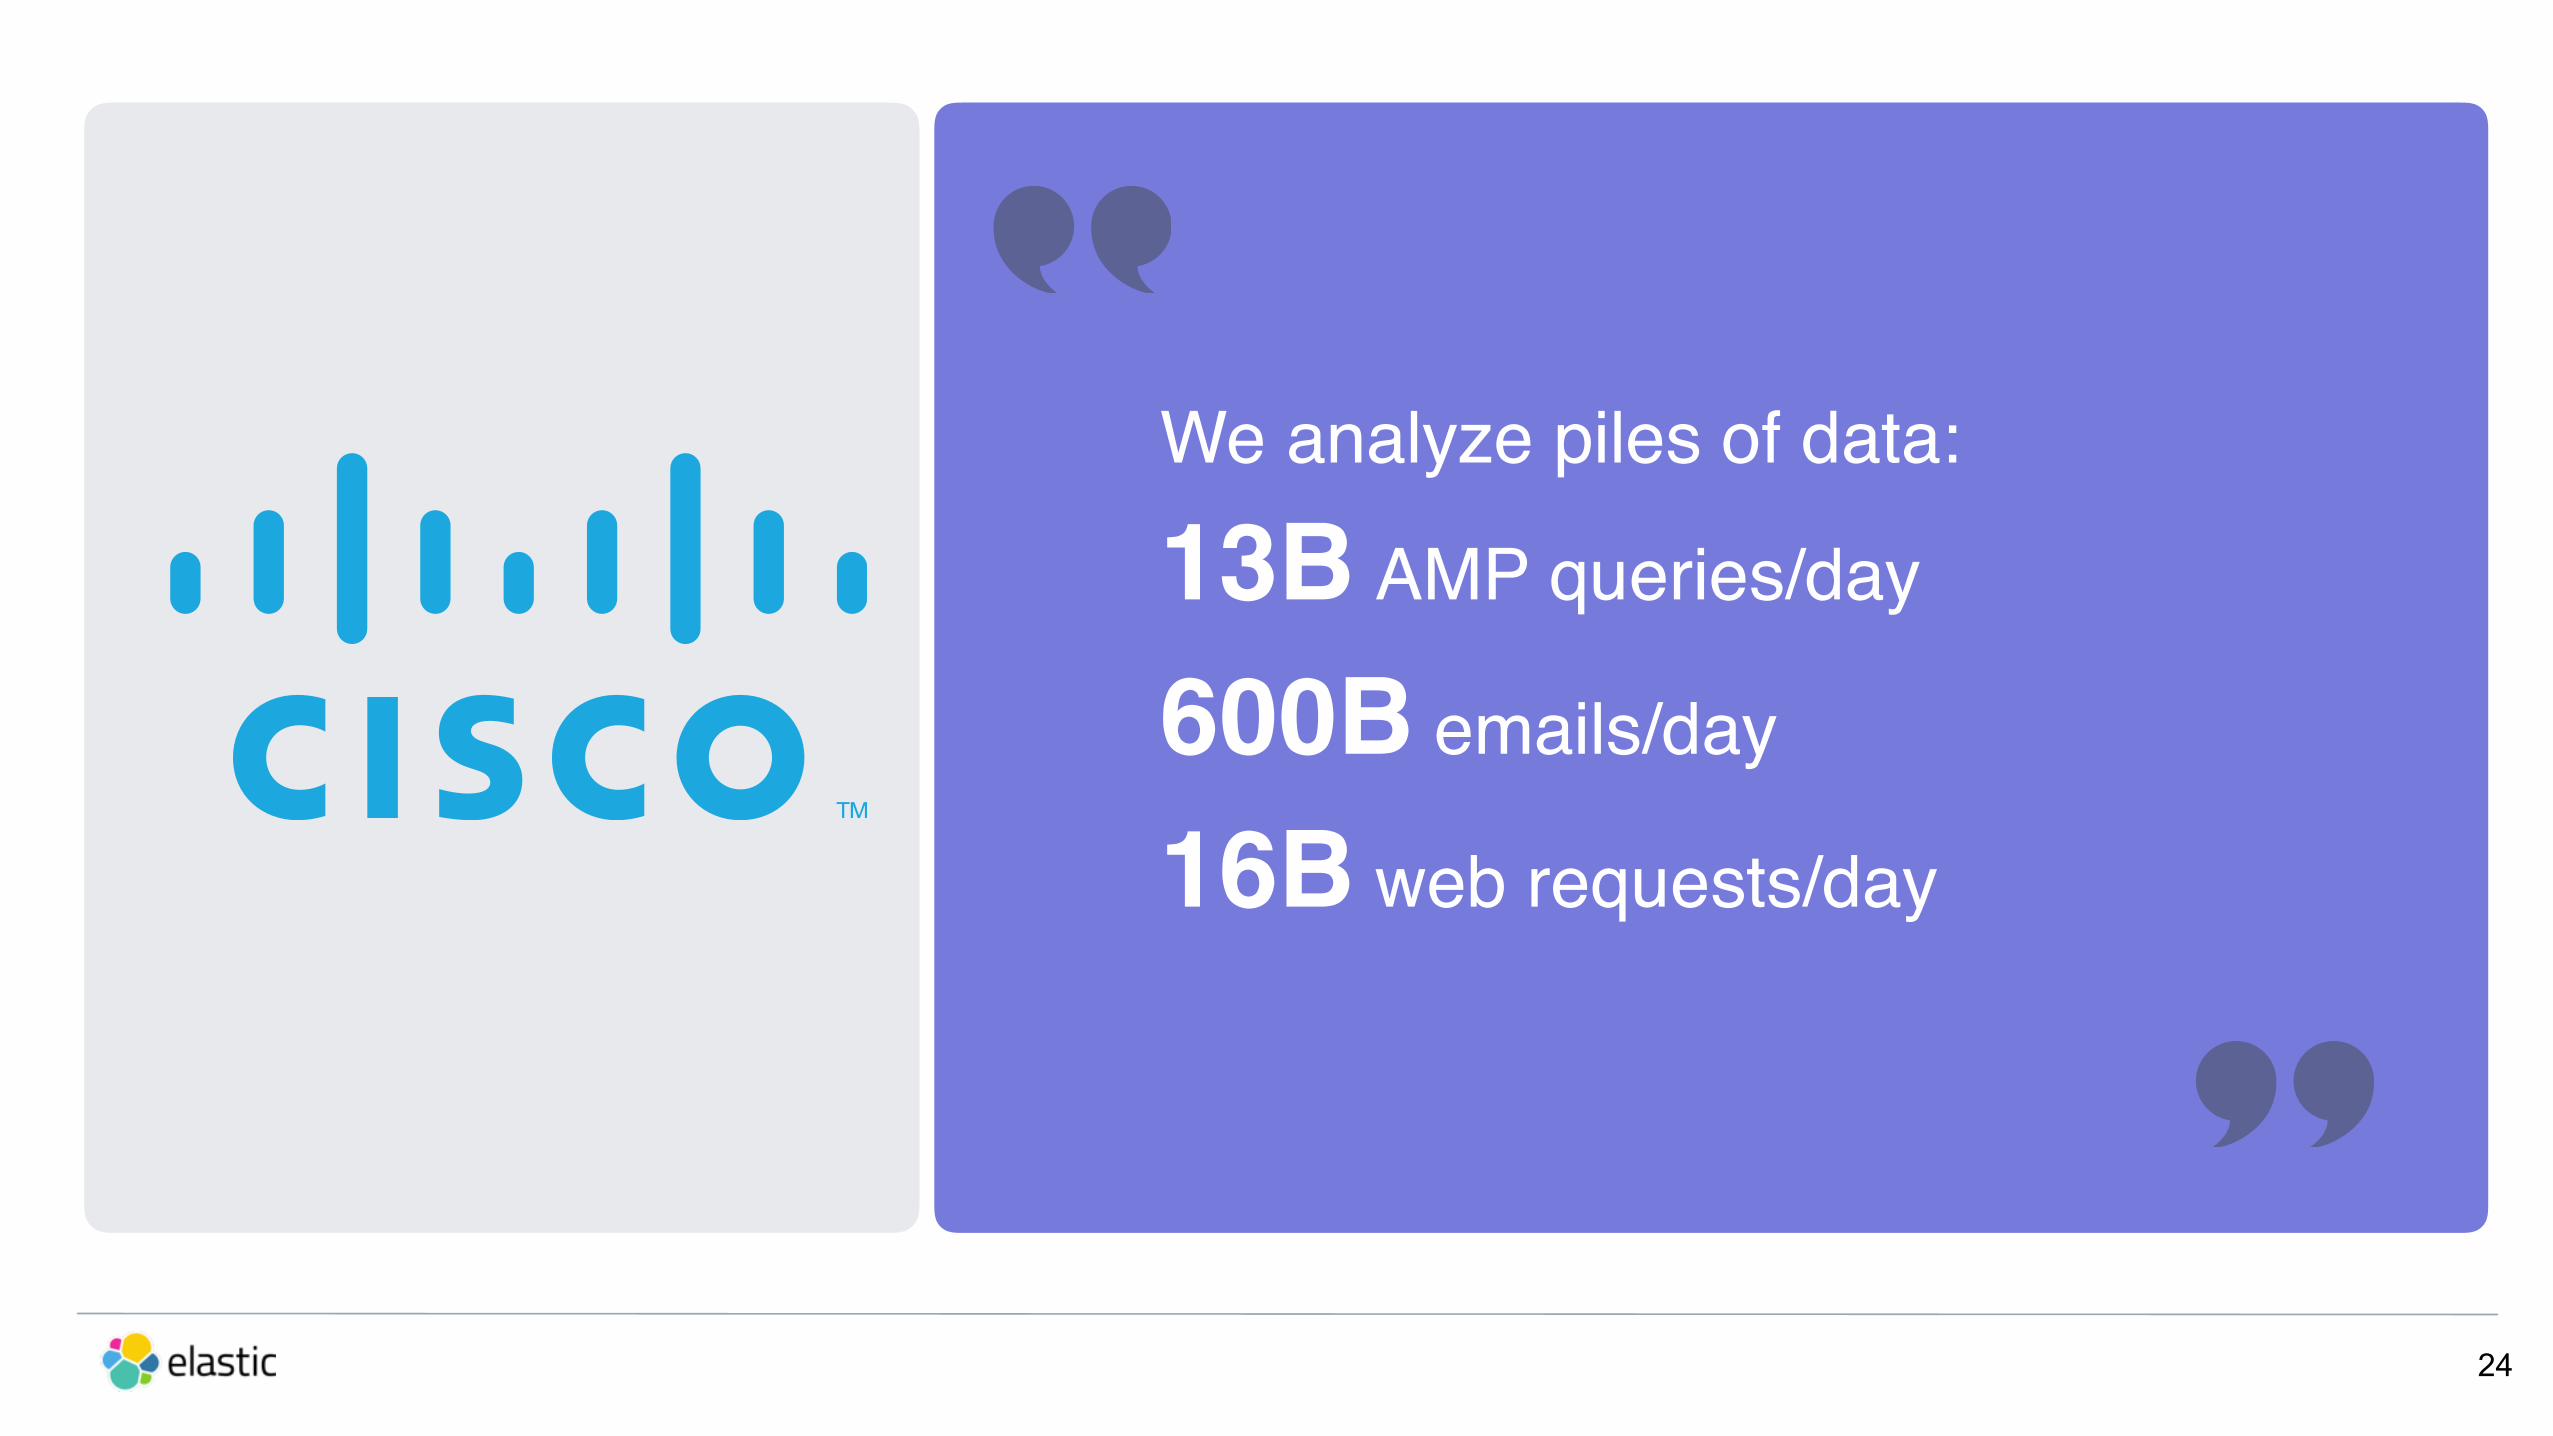
We analyze piles of data:
13B AMP queries/day
600B emails/day
16B web requests/day
24

We are on track to achieve our goal to handle more than 20 PB of data to serve over 100 technical and business teams at scale across the globe.
25

The Elastic Stack: A foundation to solve many use cases
75% of our customers use our products for more than one use case
SEARCH
SECURIT
CUSTOM APPS
METRICS
OPERATIONAL ANALYTICS
LOG ANALYSIS

Operational analytics
Flight telemetry analysis
Anomaly resolution
Internal search engine
27

28
Enterprise search
Intranet search
Real-time log analytics
Legal contract repository
Trade tracking application
HR recruiting application

Cloud is 4real,let us host andmanage the stack
250% growth in our cloud business since March 2015

30
elastic cloudHosted Elasticsearch & Kibana From the Source
Log into Elastic Cloud
Login
Password
Forgot your password? We’ll help.Don't have an account? Sign up.
by

Elastic Cloud
31
5.0.1 already available
(released yesterday)1:24 memory-to-
disk ratio
Always the newest release
More usable for large datasets

32
Elastic Cloud as a Product
In ANY cloud … In YOUR cloud …
Many clusters / use casesSingle use case, as a serviceAvailable in AWS today

33
Provisioning, orchestration, and management of multiple Elastic Stacks
Expected GA Q1 2017
Same technical foundation as the Elastic Cloud service

34
Behavioral analytics and unsupervised machine learning
34
Welcome Prelert

35
March 7-9, 2017Pier 48 San Francisco, CA2,500 attendees
3rd Annual Elastic User Conference
REGISTER TO ATTEND:
https://www.elastic.co/elasticon/conf/2017/sf/registration

Elasticsearch 5.0

The Heart of the Elastic Stack
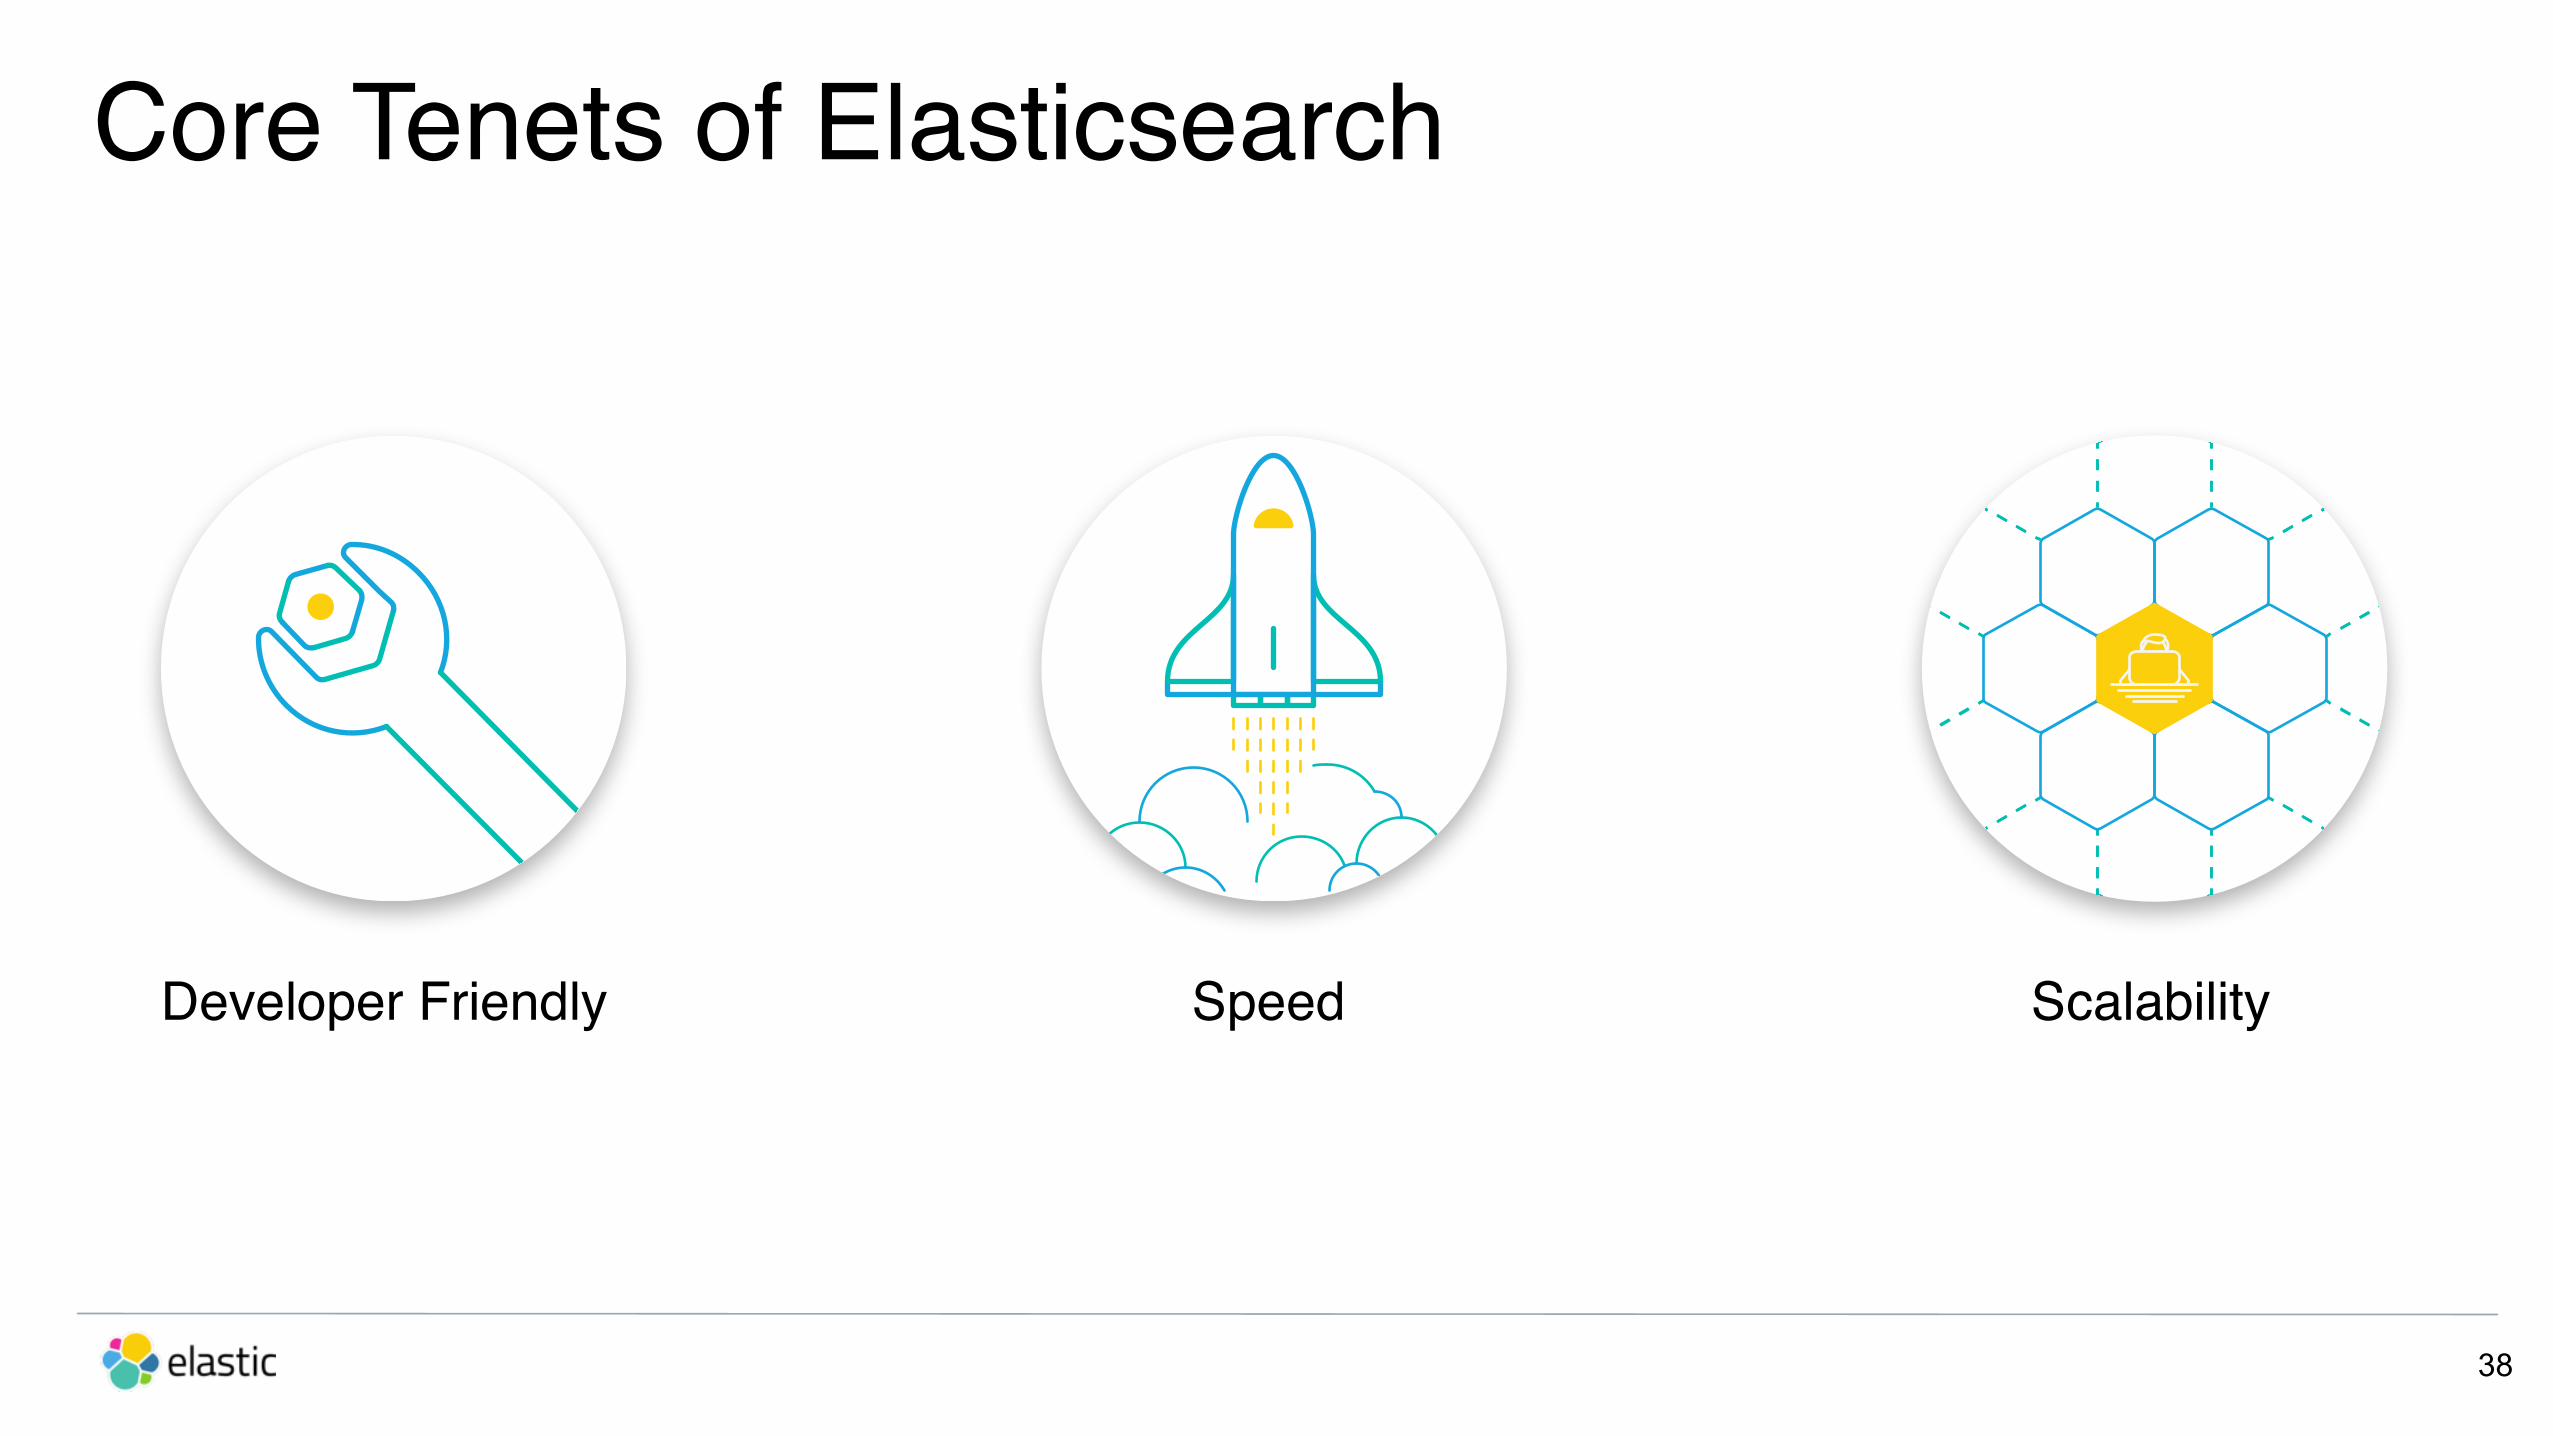
Core Tenets of Elasticsearch
38
Developer Friendly Speed Scalability

5.0What You Need to Know
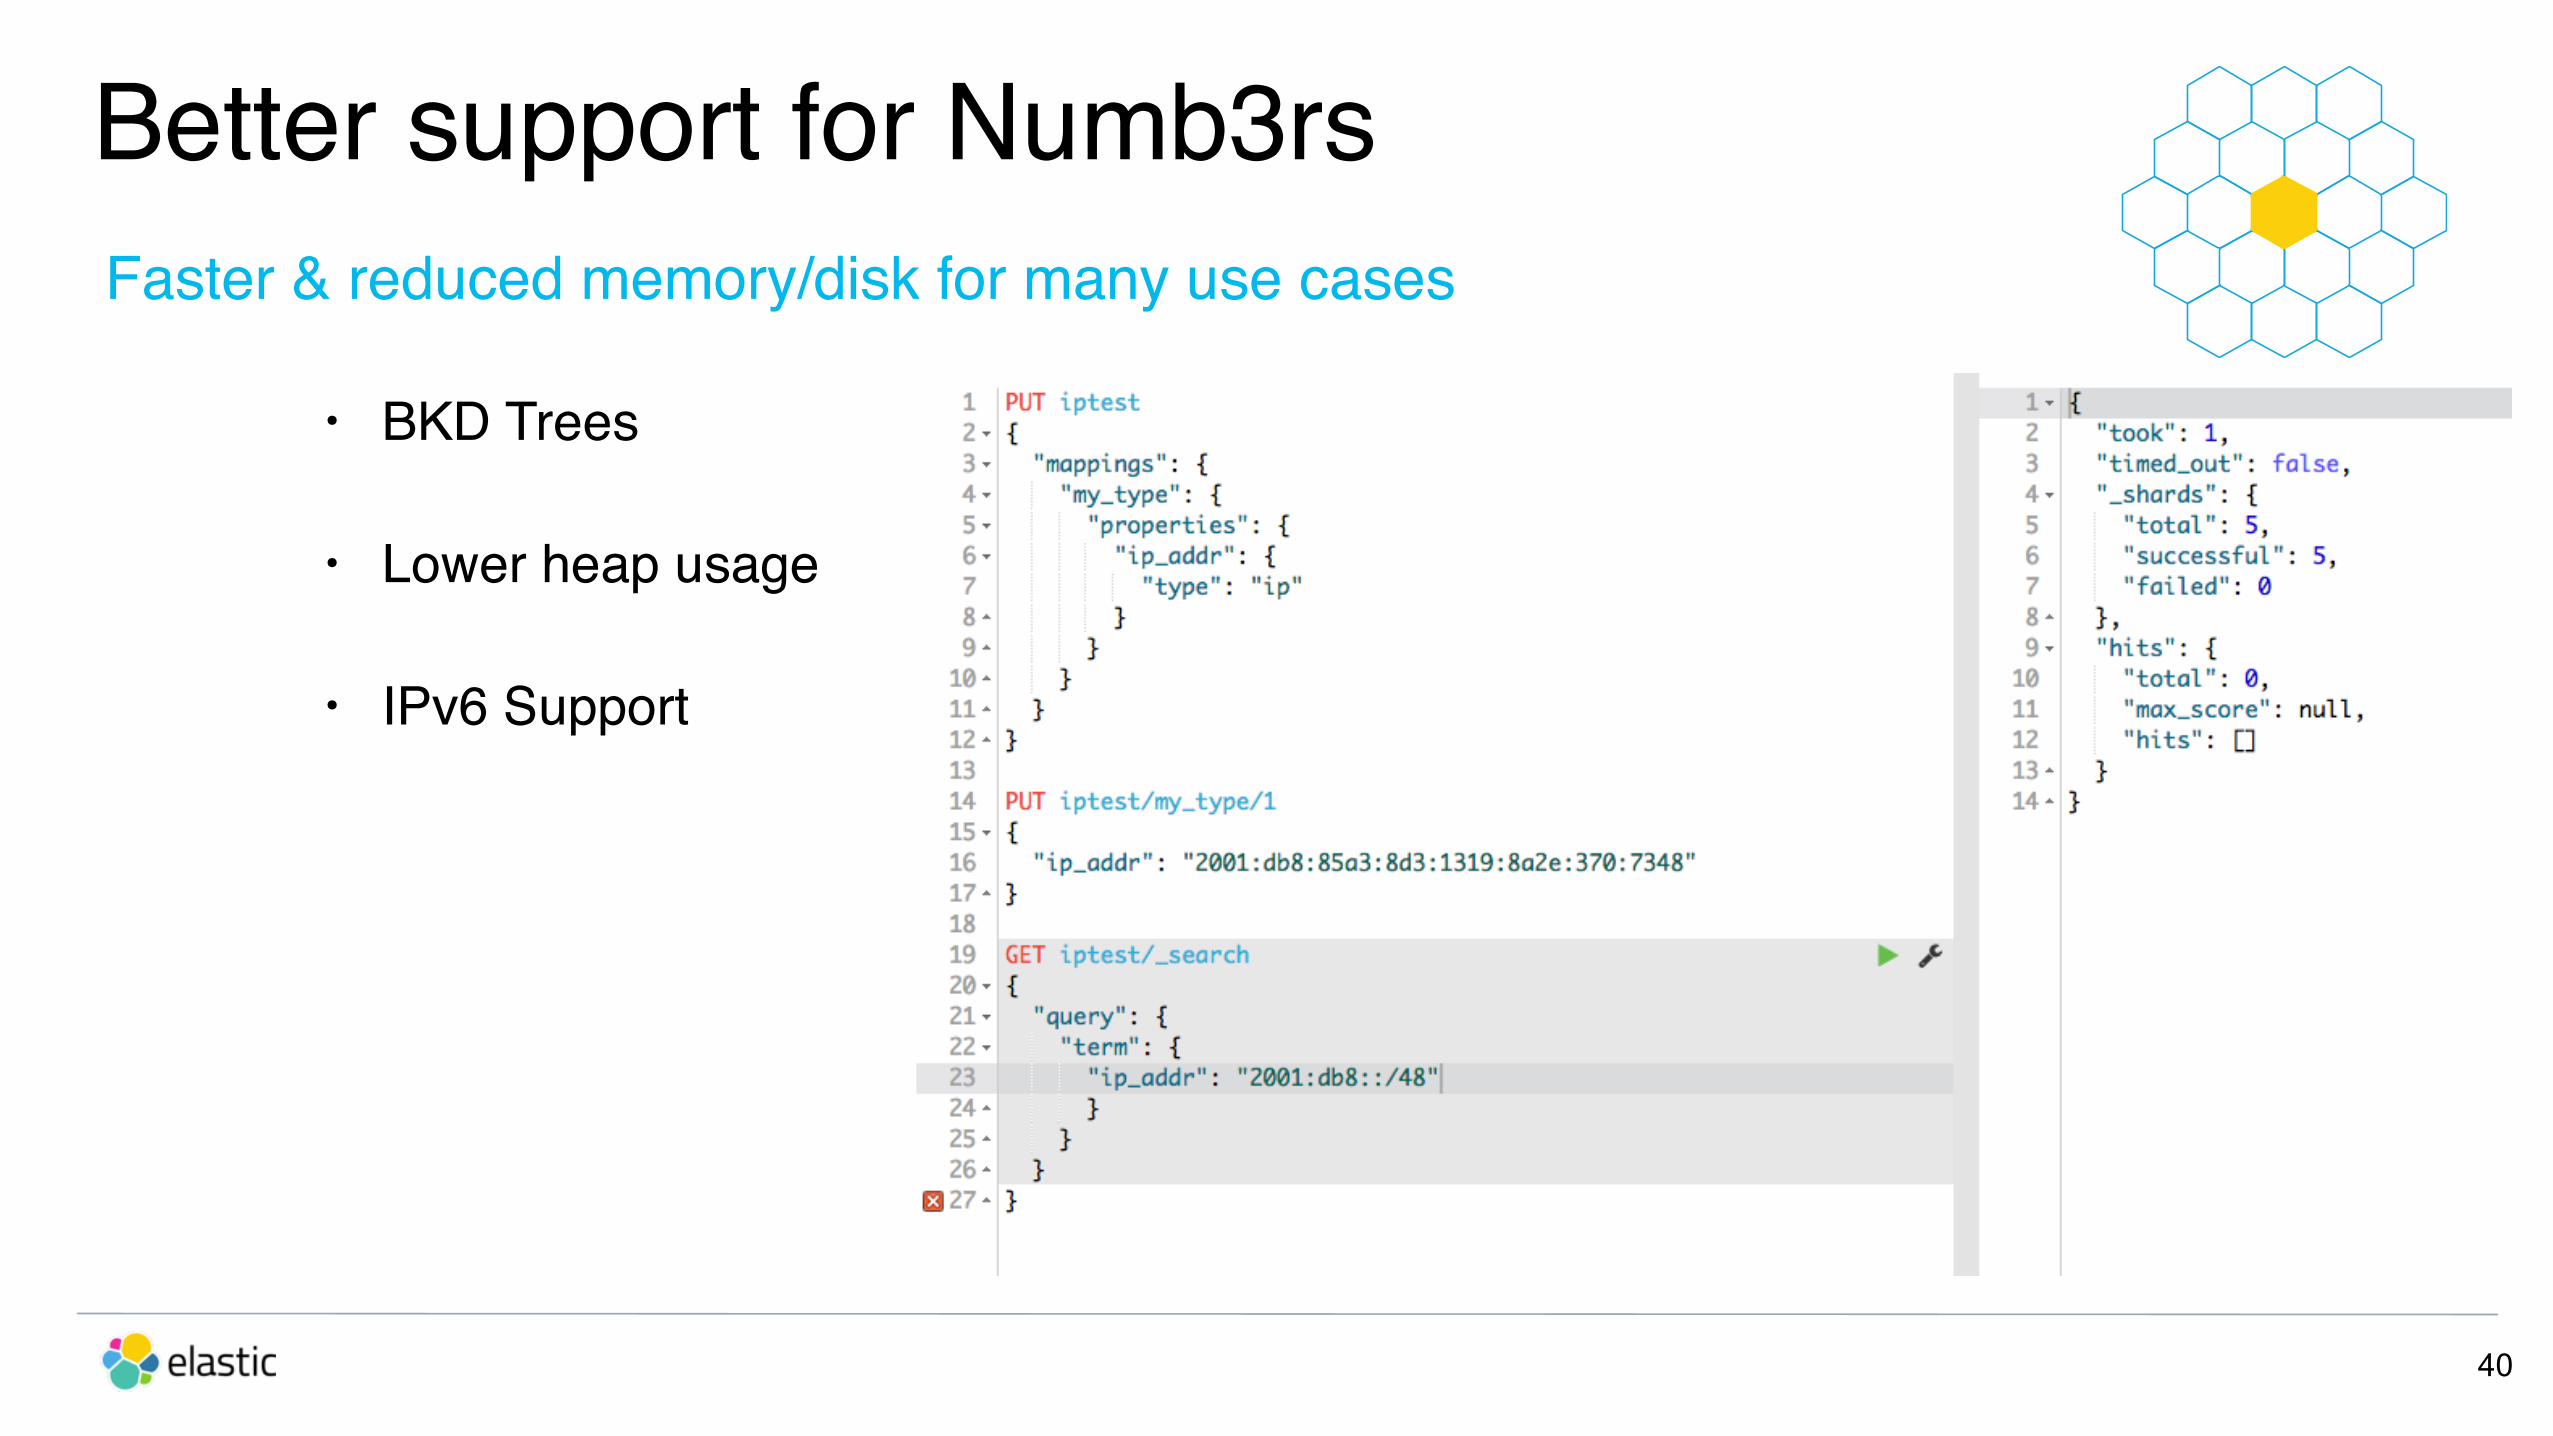
Better support for Numb3rs
• BKD Trees
• Lower heap usage
• IPv6 Support
40
Faster & reduced memory/disk for many use cases

0
10000
20000
30000
40000
50000
60000
70000
80000
float halffloat scaledfloat(factor=4000)
scaledfloat(factor=100)
OnDiskUsageinkb
Pointsdisk usage(kb) docs_values disk usage(kb)
Better support for Numb3rs
Scaled / Half float
41
Faster & reduced memory/disk for many use cases

42
Improved Indexing Time Performance

Fast, Safe Scripting Language
43
• Secure and production-safe
• Significantly faster than Groovy
• Familiar syntax
• Can be used in various places:
• Ingest node pipeline, function scoring,scripted result filtering, watch conditions,and more
Say “Heya” to Painless

44
• Automatic time-series index management
• Rollover APIs
Logs-0001
Logs-0002
Logs-0003
1000 docs
800 docs
0 docs
Logs(alias)
Simplified Architecture

Simplified Architecture
45
• Automatic time-series index management
• Shrink APIs
Shard 1 Compressed Shard 2/_shrink API
High-volume Writes
Hot nodes Lower-resource warm nodes
Compressed Shard 1Shard 2 Shard 3 Shard 4

Resiliency and Safety Improvements
46
• We saw some common problems when getting started or new users on a multi-tenant environment
• Bootstrap checks
• Circuit breakers
• Safeguards
Faster, more normalized DSL
47
• Completion Suggester v2
• Percolation is now a normal query
• Profile API expansion to include aggregations and not just queries

Beyond 5.0
48
• Higher timestamp resolution (great for logging use cases)
• More improvements on resiliency
• Build on BKD: range fields, geo
• Increased performance for append-only time series use cases
• Native RESTful Java client

Kibana 5.0: The Window into the Elastic Stack
Data VisualizationManagement
Kibana Evolution

Discover
Visualize
Dashboard
Data VisualizationManagement
Kibana Evolution: 4.x

Discover
Dashboard
Monitoring
Data VisualizationManagement
Kibana Evolution: 4.x
Visualize

Discover
Dashboard
Graph
Data VisualizationManagement
Monitoring
Kibana Evolution: 4.x
Visualize

Kibana Evolution: 4.xDiscover
Dashboard
Graph
TimelionSense
Data VisualizationManagement
Monitoring
Visualize

Kibana Evolution: 5.0Discover
Dashboard
GraphDevTools
Data VisualizationManagement
TimelionConsole
Monitoring
Visualize
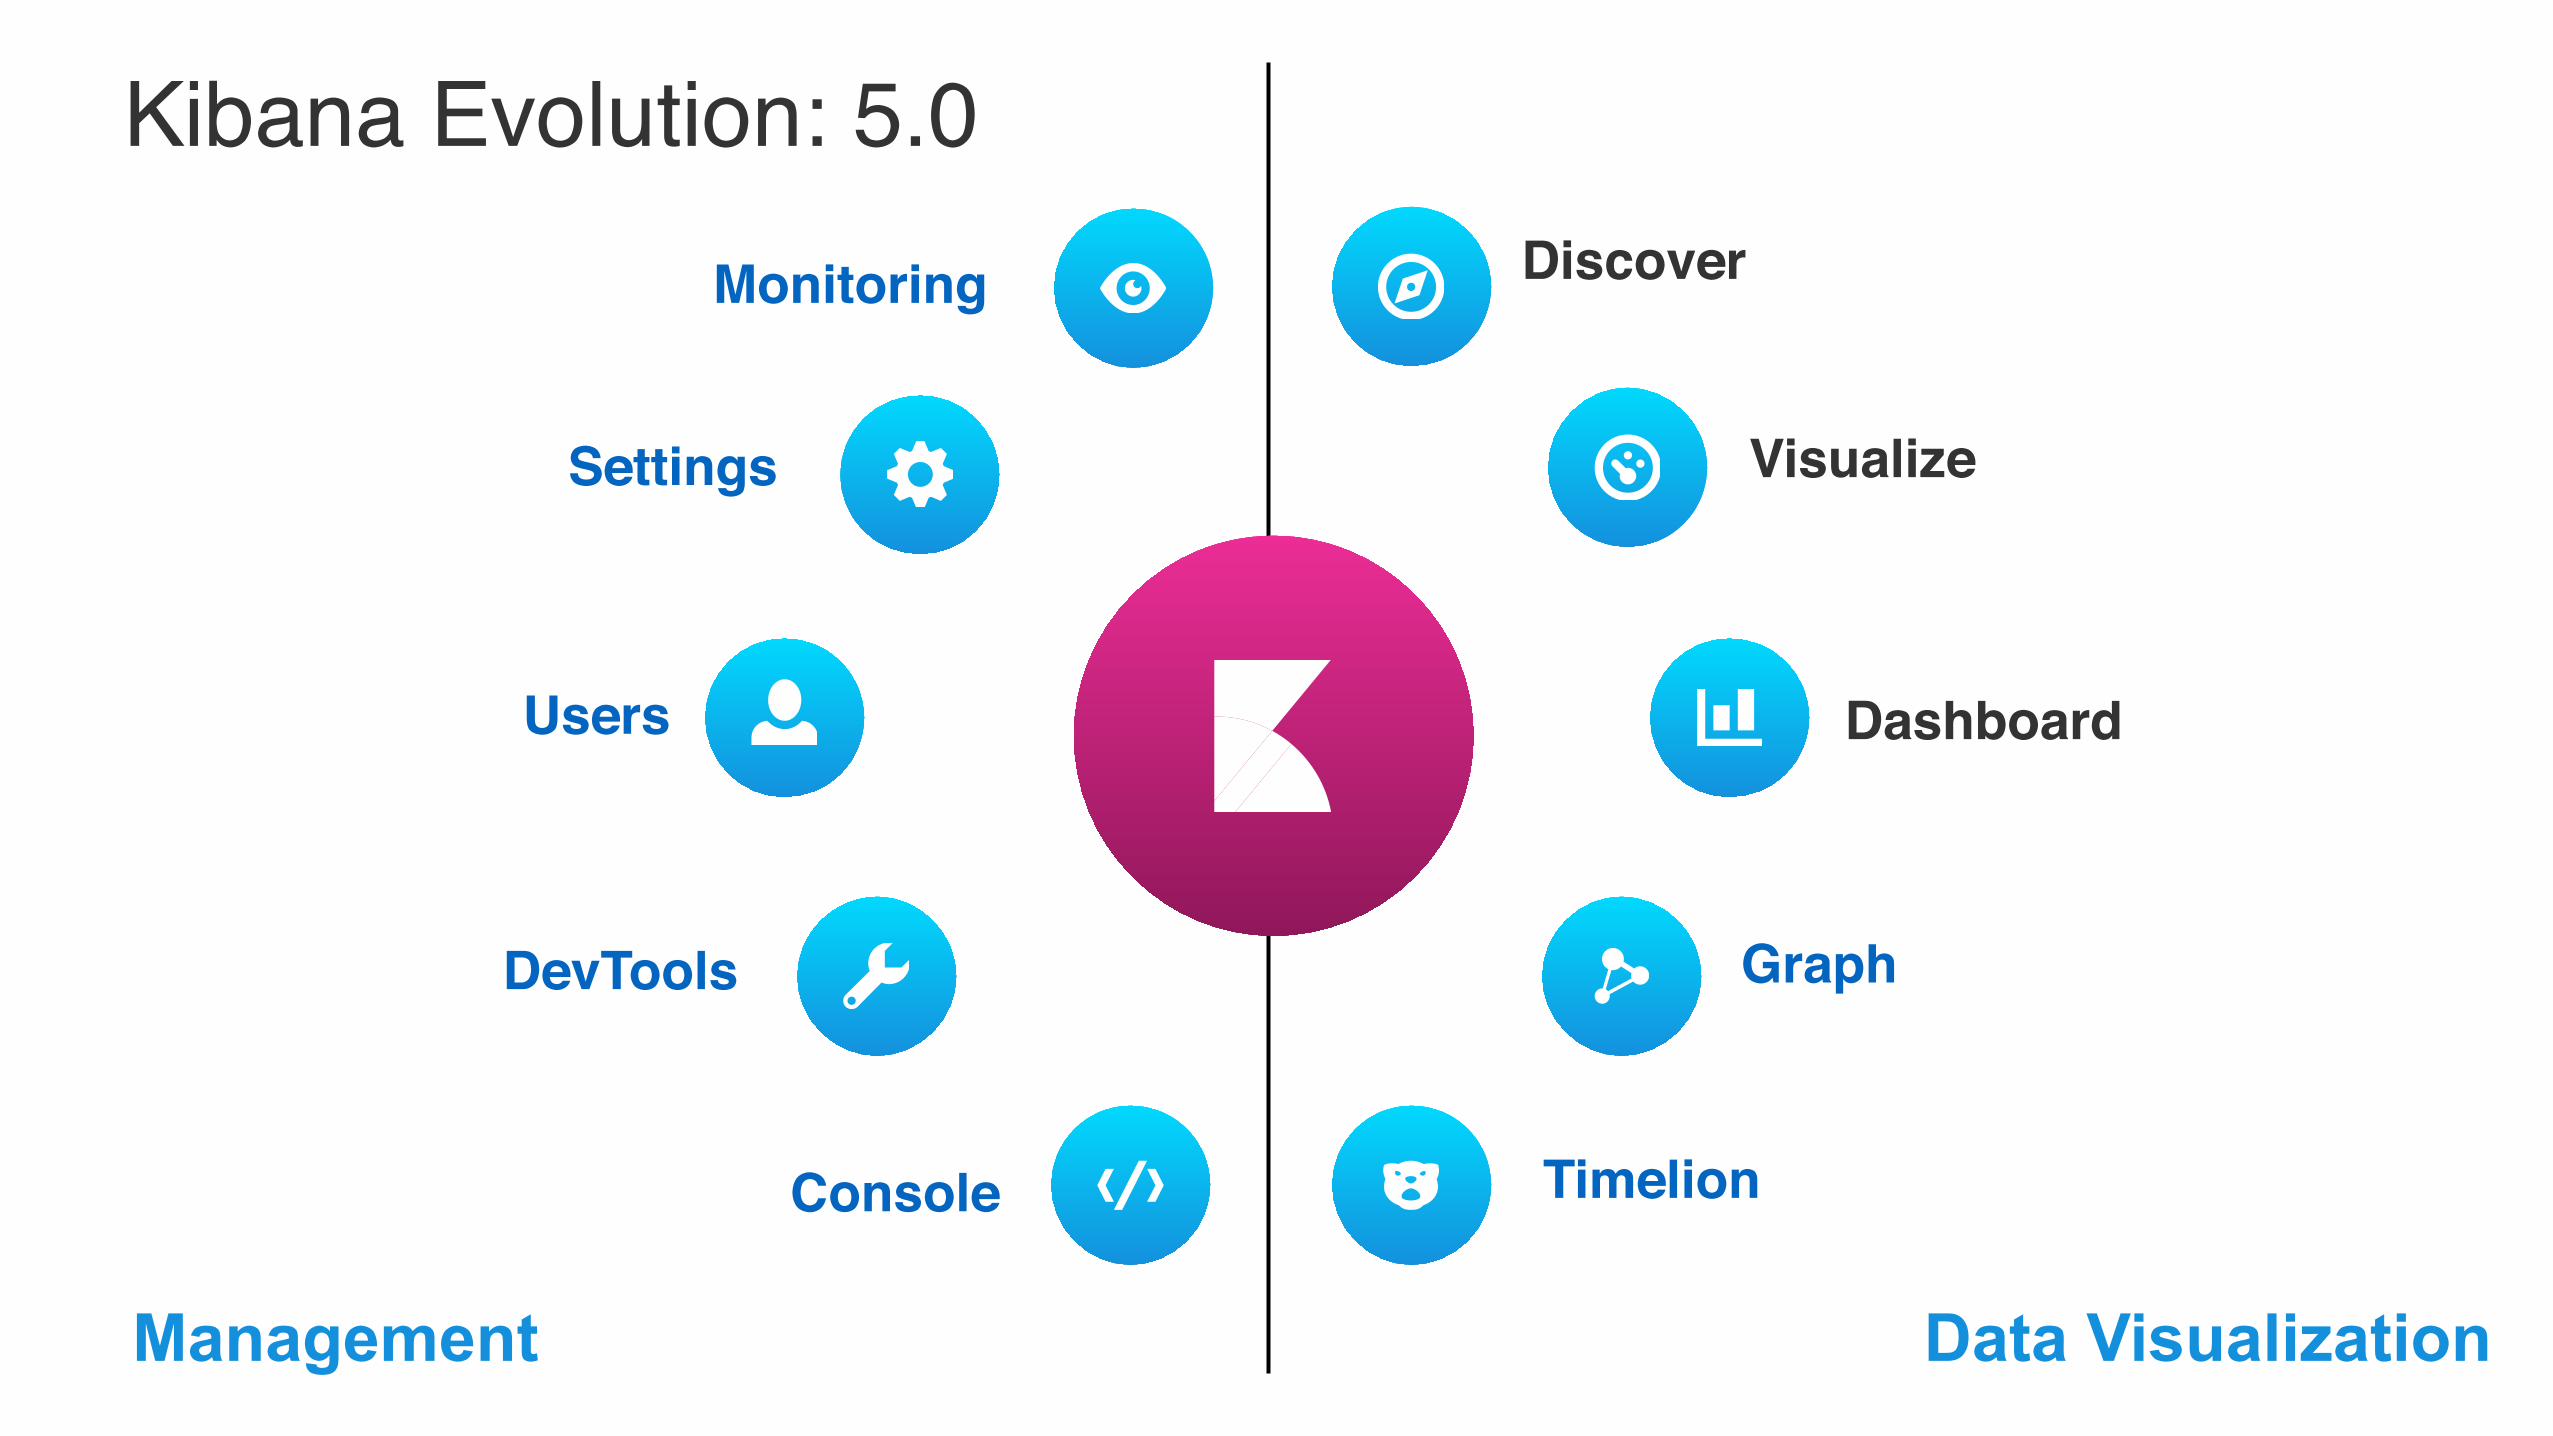
Kibana Evolution: 5.0Discover
Dashboard
Graph
Settings
Users
DevTools
Data VisualizationManagement
Timelion
Monitoring
Visualize
Console

More Visually Stunning
57
New look and feel. More space-efficient dashboards

Improved time-series analytics
58
Timelion is now a default Kibana app
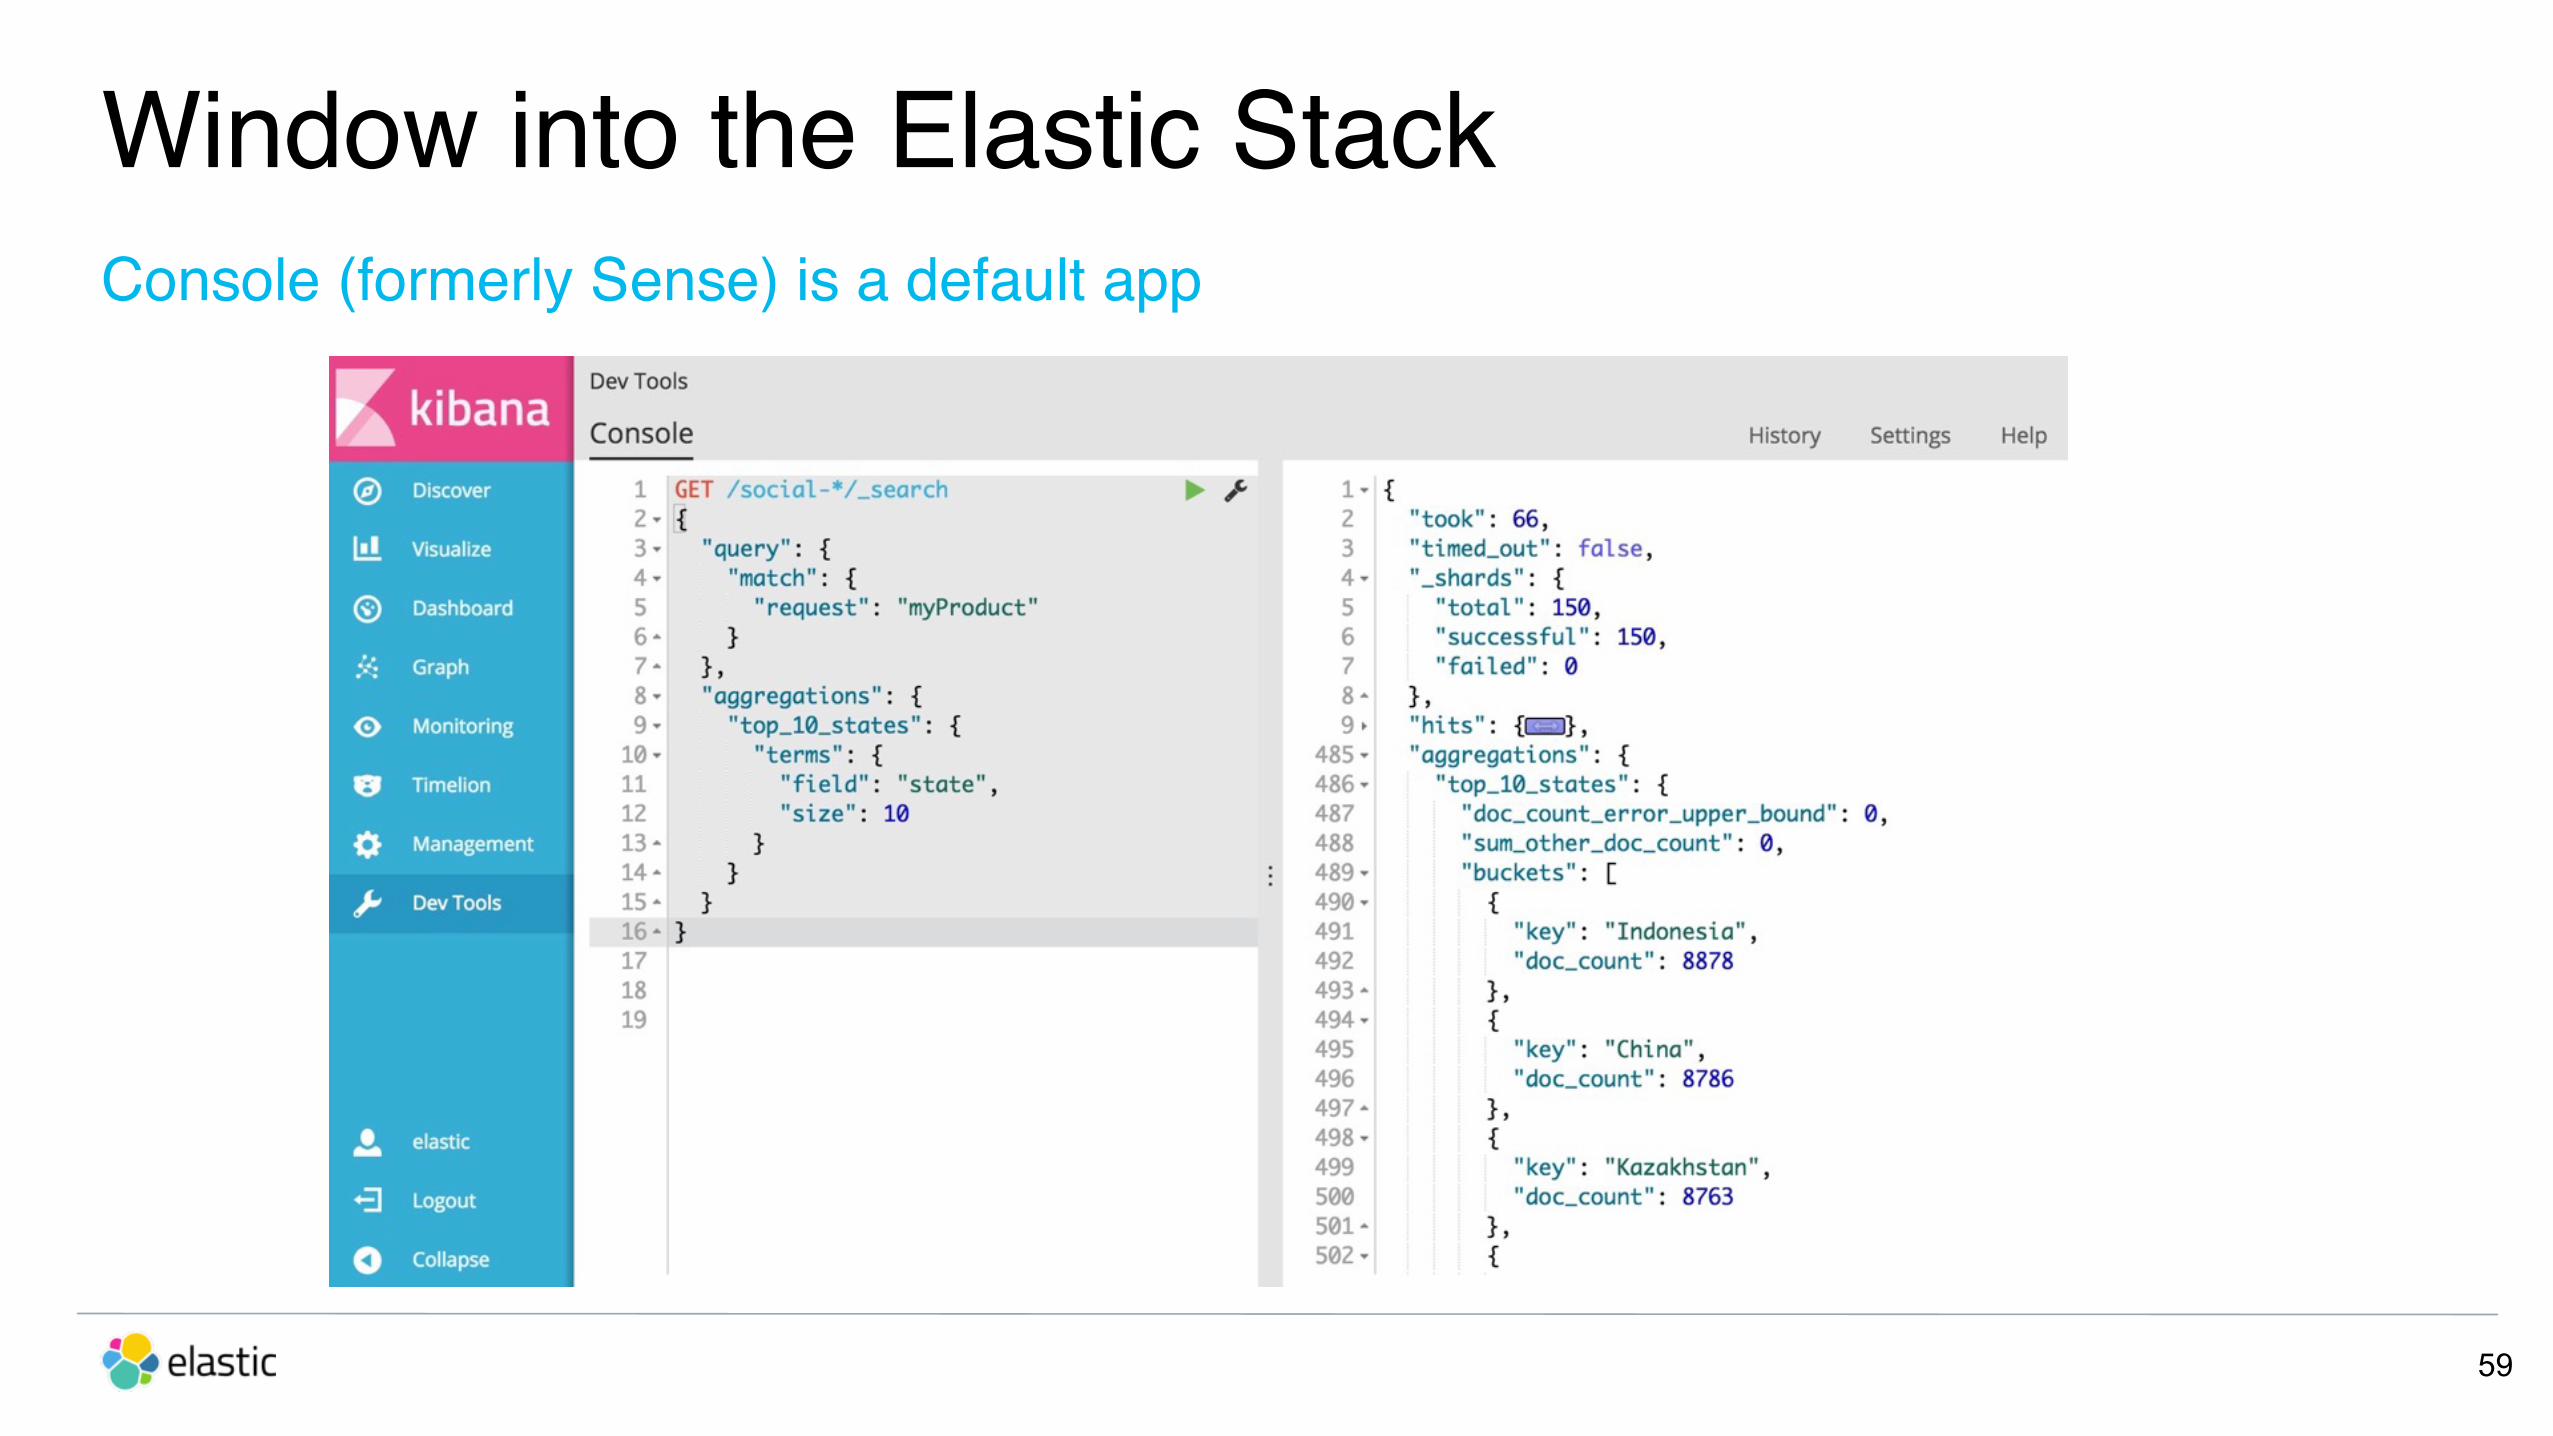
Window into the Elastic Stack
59
Console (formerly Sense) is a default app

Window into the Elastic Stack
60
Monitoring app now includes Kibana monitoring
* requires X-Pack

Window into the Elastic Stack
61
New UI to manage users and roles
* requires X-Pack

Share the Kibana <3
62
Create reports of your visualizations and dashboards
* requires X-Pack

Beyond 5.0
63
• Kibana is the Window into the Elastic Stack — management and visualization
• Embrace more diversity: New user interfaces, visualizations, and dev management tools
• Kibana for everyone — developers, technical, non-technical business users
• “Unexpected apps”
Ingest: Beats & Logstash 5.0

Ingest data from any source, in any format
65
Beats Logstash

X-pack X-pack
Nodes (X)
Logstash
Messaging
Queue
Kafka
Redis
Elasticsearch
Master Nodes (3)
Data Nodes - Warm (X)
Instances (X)
Kibana
Custom UI
Datastore Web APIs
Social Sensors
Log Files
Beats
Metrics
Wire Data your{beat}
Hadoop Ecosystem
ES-Hadoop
Ingest Nodes (X)
Data Nodes - Hot (X)
Authentication Notification
LDAP AD SSO
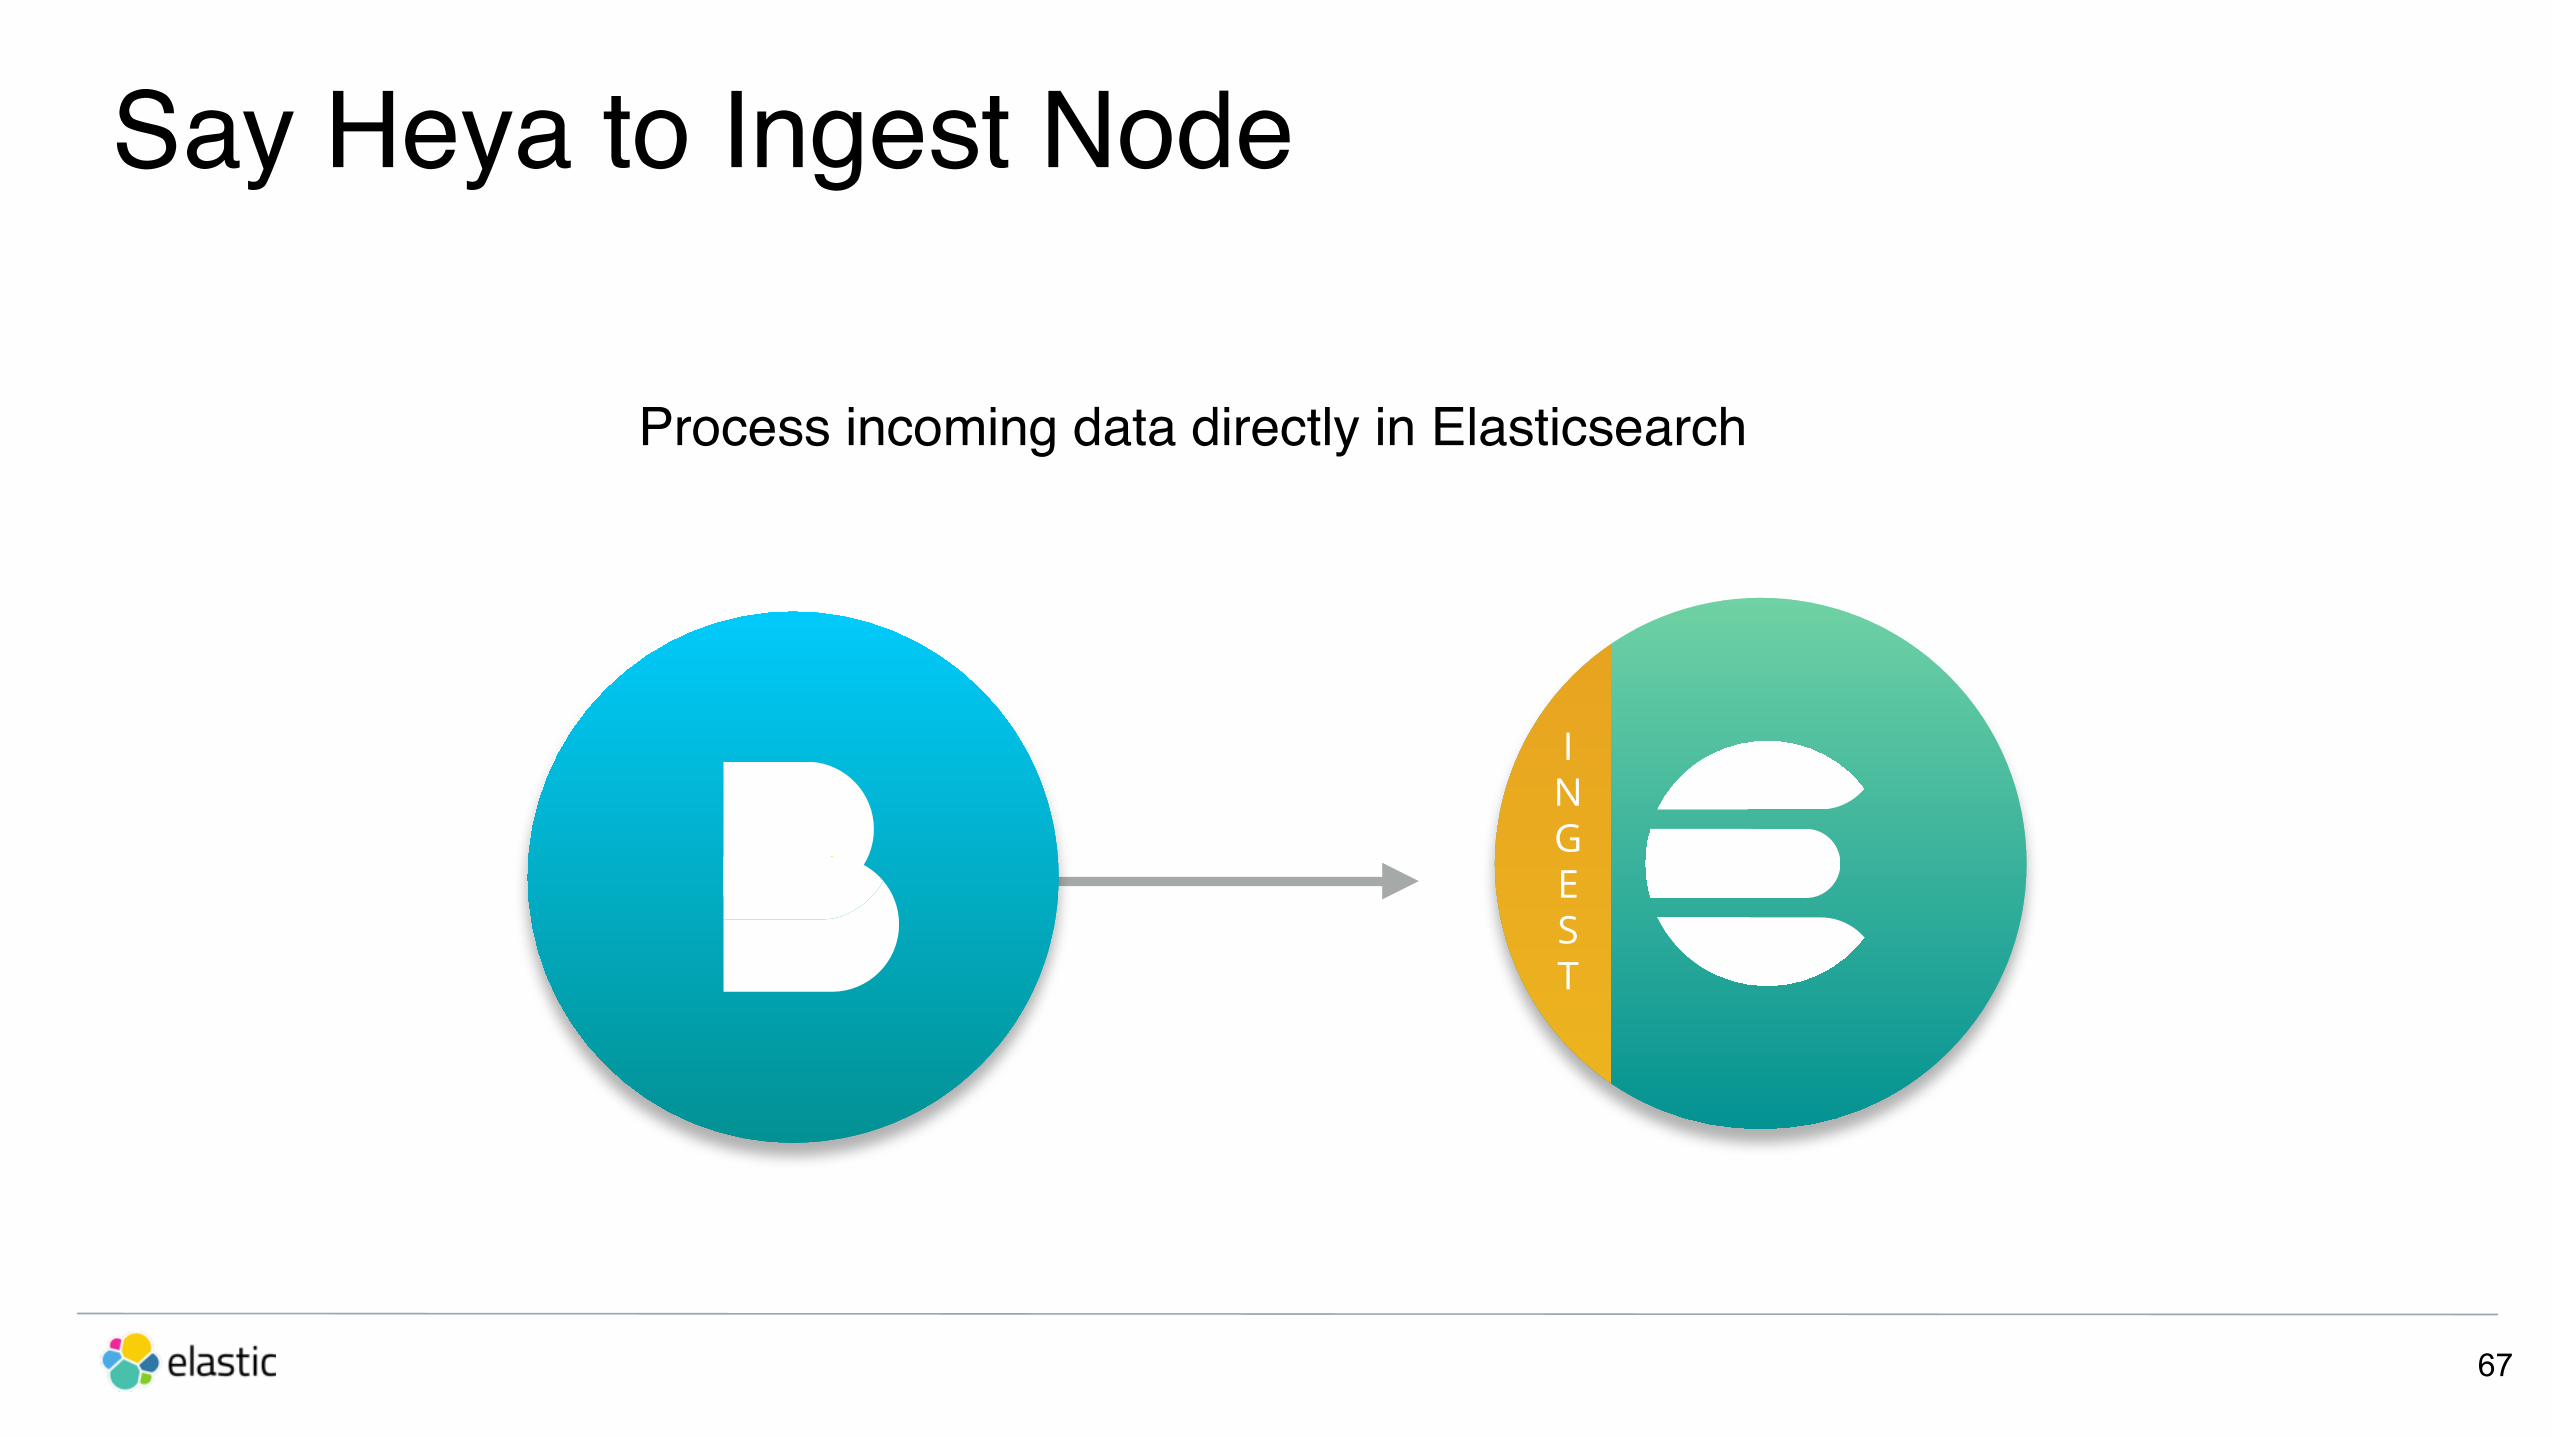
Say Heya to Ingest Node
67
Process incoming data directly in Elasticsearch
INGEST

Logstash: Goodbye Black Box!
68
logstash:9600/_node
Node Info Node Stats
PluginsHot Threads
Monitoring API
Debug active pipelines with new logging API
Component level logging granularity
Log4j2 Internal Logging
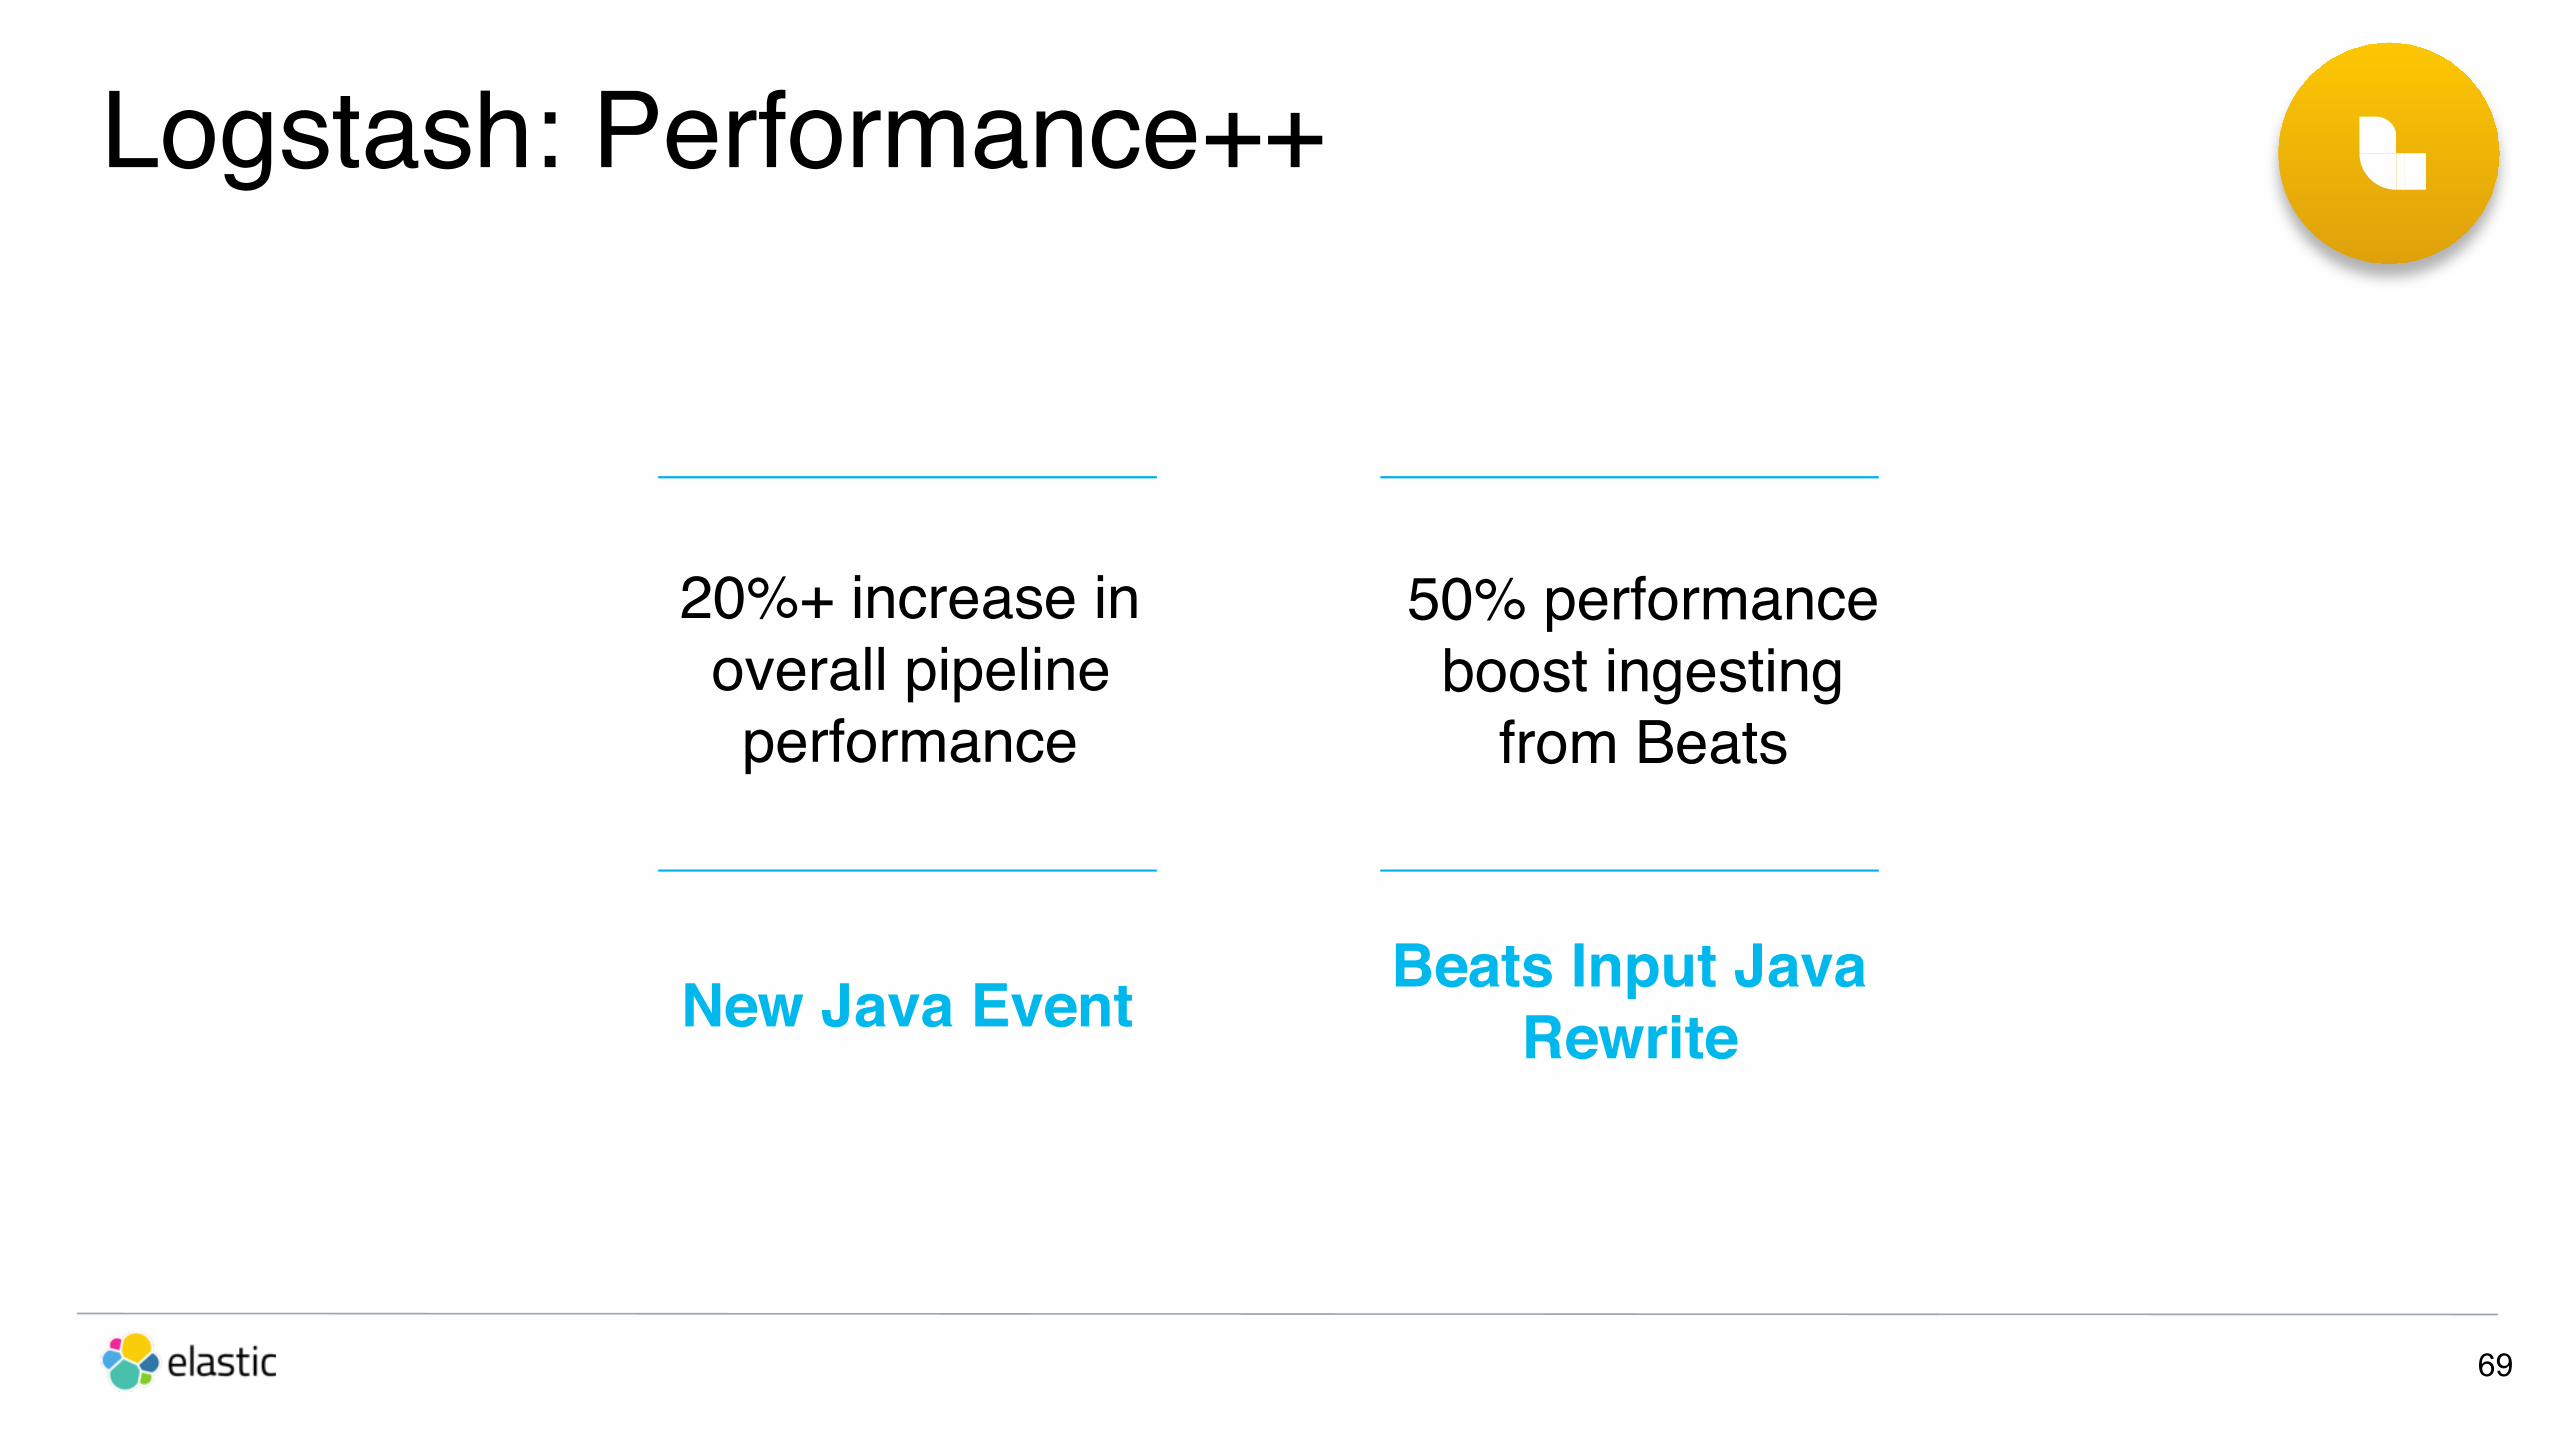
Logstash: Performance++
69
20%+ increase in overall pipeline performance
50% performance boost ingesting
from Beats
New Java Event Beats Input Java Rewrite
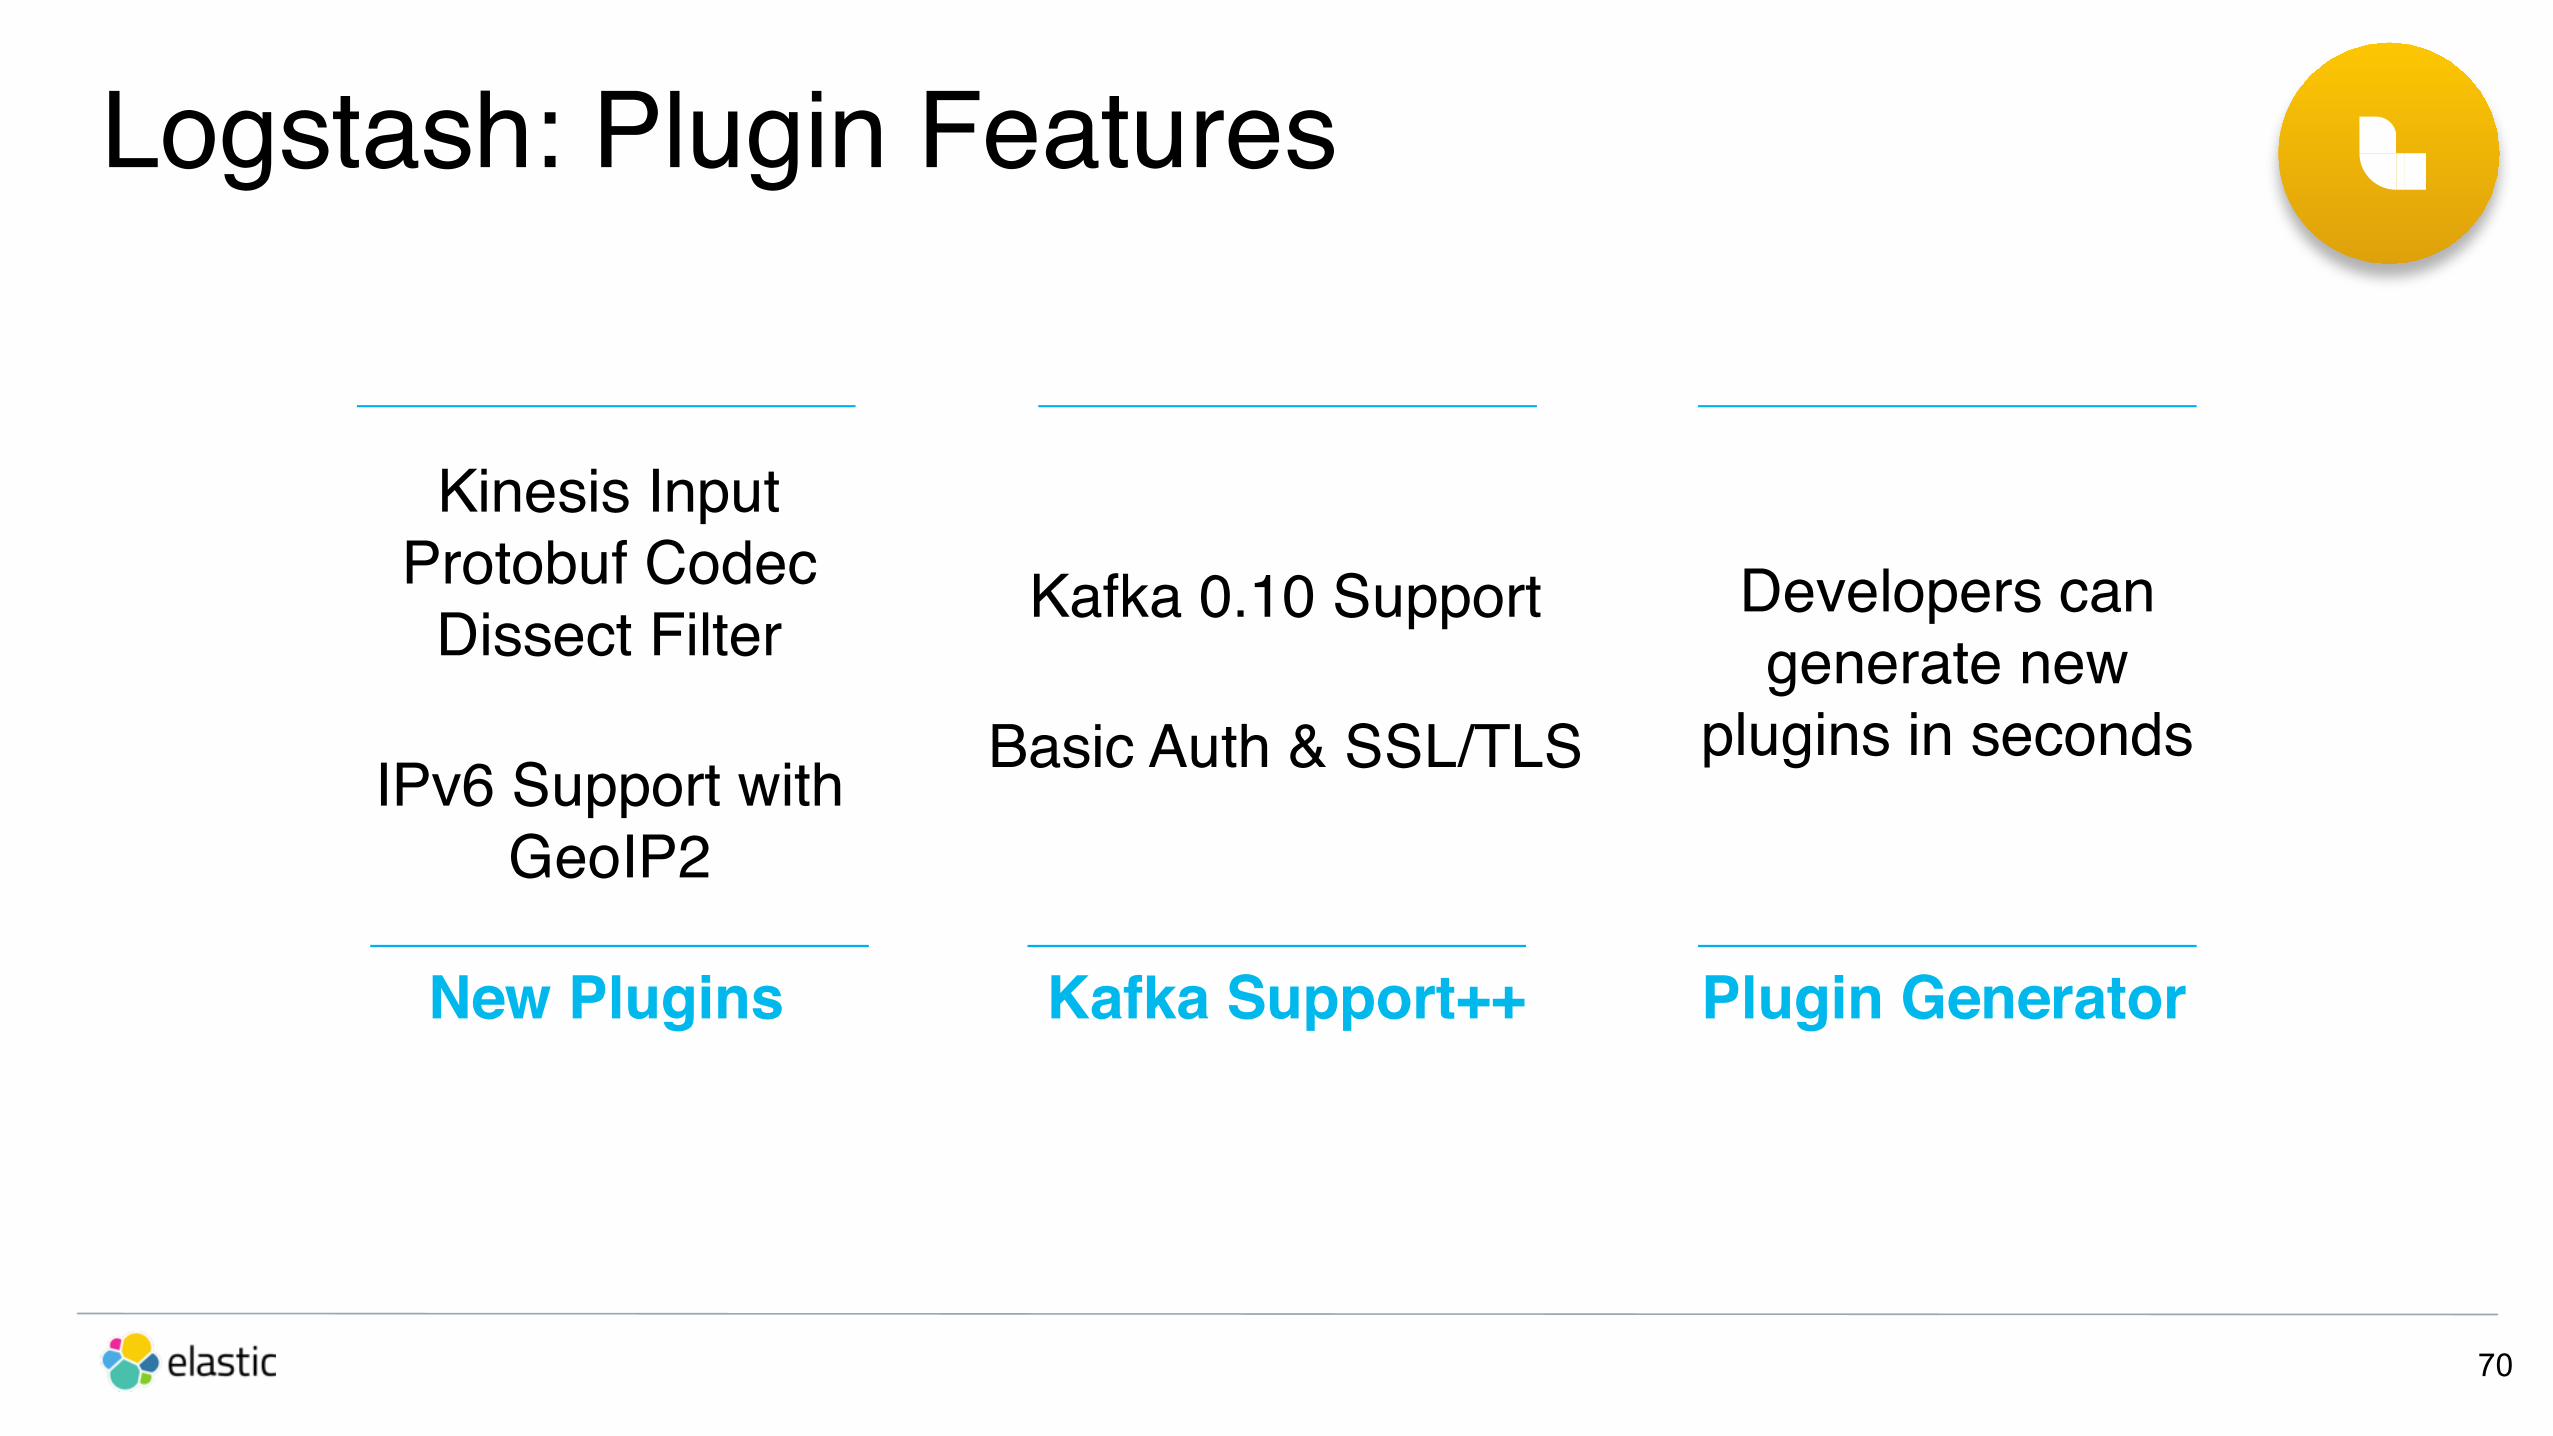
Logstash: Plugin Features
70
Developers can generate new
plugins in seconds
Kafka 0.10 Support
Basic Auth & SSL/TLS
Plugin GeneratorKafka Support++
Kinesis InputProtobuf Codec
Dissect Filter
IPv6 Support with GeoIP2
New Plugins

71
Elasticsearch Kibana
ES-Hadoop
Backup Elasticsearch with HDFS
Efficiently move data between Elasticsearch & Hadoop
Elasticsearch-Hadoop 5.0
Spark 2.0 & Better Streaming Support
Ingest Node Pipeline Integration
Elasticsearch 5.0 Parallel Reader
Beyond 5.0 (Beats)
72
• Moar modules in Metricbeat
• Moar Beats
• Even easier getting started experience
• Centralized configuration & monitoring

Beyond 5.0 (Logstash)
73
• Logstash persistence (disk-based queuing)
• Monitoring UI & centralized configuration
• Multiple pipelines, one JVM
• Error event routing
Elastic CloudThe Only Official Elasticsearch-as-a-Service

www.elastic.co