what works where for which farm household: estimated effects of different interventions on food...
TRANSCRIPT

International Conference on Integrated Systems –
Systems Research for Sustainable Intensification in Smallholder Agriculture
IITA Headquarters in Ibadan, Nigeria, 3-6 March 2015
What works where for which farm household: Estimated effects of different interventions on food availability
across household distributions in East and West Africa
Randall Ritzema, Romain Frelat, Sabine Douxchamps, Silvia Silvestri, Mariana Rufino, Mario Herrero, Ken Giller, Santiago Lopez-Ridaura, Mark van Wijk
• Humidtropics has quantified targets in its Intermediate Development Outcomes
• Assessments of sustainable intensification options benefit from quantitative analysis
Background Ideasfrom Humidtropics IDO’s
Quantitative methods (modeling) can play a key role in research targeting and evaluation.

• Humidtropics has quantified targets in its Intermediate Development Outcomes
• Assessments of sustainable intensification options benefit from quantitative analysis
Background Ideasfrom Humidtropics IDO’s
Quantitative methods (modeling) can play a key role in research targeting and evaluation.
Household-level perspective is central for analysis, planning, and eventual impact.
• People-focused IDO’s are household-based

HH Analysis Framework
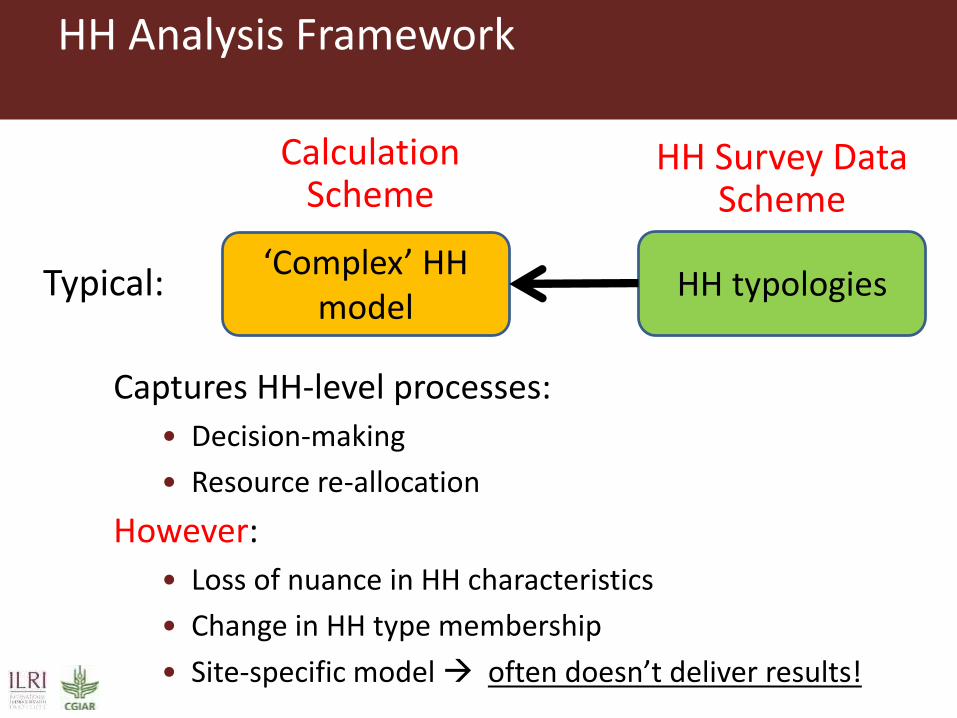
Calculation Scheme
HH Survey DataScheme

HH Analysis Framework
‘Complex’ HH model
HH typologies
Calculation Scheme
HH Survey DataScheme
Typical:
HH Analysis Framework
‘Complex’ HH model
HH typologies
Calculation Scheme
HH Survey DataScheme
Captures HH-level processes:
• Decision-making
• Resource re-allocation
However:
• Loss of nuance in HH characteristics
• Change in HH type membership
• Site-specific model often doesn’t deliver results!
Typical:

HH Analysis Framework
‘Complex’ HH model
HH typologies
Calculation Scheme
HH Survey DataScheme
Typical:

HH Analysis Framework
‘Complex’ HH model
HH typologiesTypical:
Calculation Scheme
HH Survey DataScheme
SIMPLE calculations
Full set of surveyed HH’s
This ‘inverted’ research:
HH Analysis Framework…
• Some loss of precision, but gives an INITIAL and RELATIVE INDICATION of which farm HH’s will be affected and by how much
• Results generate rich HH distributions of livelihood characteristics, poverty levels, etc.
• Simple calculation scheme has 2 further advantages:
• Rapid deployment of analyses
• Can be applied across data sets, regions, systems- useful for large-scale analysis and trend identification

Example: Simple Method…
Food Availability Ratio (FAR)
Amount of food energy available to HH
Food energy requirements of HH=

Example: Simple Method…
Data set:
ImpactLite survey implemented on 9 CCAFS research sites (200 HH’s each)

Example: … Applied Across Households
Lushoto, Tanzania
Foo
d A
vaila
bili
ty R
atio
FAR = 1 suggests available food meeting HH needs
• 57% of HHs have FAR < 1

Example: … Applied Across Households
Lushoto, Tanzania
Foo
d A
vaila
bili
ty R
atio
• 57% of HHs have FAR < 1
• Distributions retain detail on HH livelihoods Livelihood
strategies shift across HH distribution

Example: … Applied Across Households
Lushoto, Tanzania
Foo
d A
vaila
bili
ty R
atio
• 57% of HHs have FAR < 1
• Distributions retain detail on HH livelihoods
• Thresholds accompany shifts in livelihood strategies
Apparent thresholds

Example: … Applied Across Households
Livelihood strategies differ significantly across sites and the FAR gradient.

Intervention Analysis
• 3 scenarios (broadly defined)• ‘Crop Boost’: a 50% increase in staple crop yield
• ‘Livestock Boost’: a 50% increase in all livestock products
• ‘Job Market Boost’: a 200 USD increase in off-farm income

Intervention AnalysisK
affr
ine
, Se
ne
gal
Lush
oto
, Ta
nza
nia
Job Market BoostCrop Boost Livestock Boost
FAR categories FAR categories FAR categories
Ch
ange
in F
AR
Ch
ange
in F
AR
Some Findings (regarding the Results)
• Crop / livestock intensification options, while primarily benefitting the most well-off farm HHs and perhaps supporting a transition to a market orientation for marginal HHs, have little effect on the poorest farm HHs.
• Wage/labor options need to be explored to reach the poorest HHs.
• Results from 9 research sites both (1) identify these big-picture trends, but (2) also show that variability in responses are evident across sites and between HHs.
• Results sharpen the questions regarding targeting: Whom along the FAR (or poverty, or food security) gradient should be the focus of interventions?
Some Findings (regarding the Approach)
• Represents a ‘bottom-up’ perspective that informs large-scale intervention strategy.
• Gives an initial indication of who (farm HHs) might benefit from interventions, where that benefit might be realized (site context), and to what extent.
• Though representing some loss in ‘precision’, the approach enables rapid deployment of analysis across disparate datasets, regions, and projects.
• The approach can be adapted to other research questions easily, e.g. nutrition, gender, etc.
• It aligns with, and therefore can support, the need for large-scale quantitative analysis at the household level, as expressed in the Humidtropics IDOs.

Directions for Further Research
• Broadening the analysis• Incorporating more African datasets
• Expansion into Southeast Asia in 2015
• Inclusion of Humidtropics ImpactLite datasets as available
• Deepening the analysis
• Development of a simple optimization-based calculation scheme
• To incorporate some level of decision-making and resource allocation
• Still to be implemented on individual HHs
• Does the question of “Who benefits?” matter?

The presentation has a Creative Commons licence. You are free to re-use or distribute this work, provided credit is given to ILRI.
better lives through livestock
ilri.org
Thank you!