what works crime reduction systematic review...
TRANSCRIPT
1
WHAT WORKS CRIME REDUCTION SYSTEMATIC REVIEW SERIES
A SYSTEMATIC REVIEW OF TAGGING AS A METHOD TO REDUCE THEFT IN
RETAIL ENVIRONMENTS
Aiden Sidebottom, Amy Thornton, Lisa Tompson, Jyoti Belur, Nick Tilley and
Kate Bowers
UCL Department of Security and Crime Science
Corresponding author:
Aiden Sidebottom
UCL Department of Security and Crime Science
35 Tavistock Square
London
WC1H 9EZ
March 2017

2
COPYRIGHT
This is an open-access article distributed under the terms of the Creative Commons
Attribution 4.0 International License, which permits unrestricted use, distribution and
reproduction in any medium, provided the original author(s) and source are credited. In
addition there should be an indication if any changes were made to the original text and there
should be no suggestion that the authors or any of their collaborators endorses you or your
use.

3
CONTENTS
ACKNOWLEDGEMENTS .................................................................................................................... 5
BACKGROUND .................................................................................................................................... 7
EMMIE AND OUR APPROACH TO SYSTEMATIC REVIEW ......................................................... 9
METHODS ........................................................................................................................................... 10
Criteria for considering studies for this review ................................................................................ 10
Identifying studies: databases and information sources ................................................................... 12
RESULTS ............................................................................................................................................. 14
Search results and screening ............................................................................................................. 14
EFFECT ............................................................................................................................................ 16
MECHANISMS ................................................................................................................................ 23
MODERATORS ............................................................................................................................... 27
IMPLEMENTATION ....................................................................................................................... 33
ECONOMICS ................................................................................................................................... 35
DISCUSSION ....................................................................................................................................... 37
REFERENCES ..................................................................................................................................... 44
APPENDICES ...................................................................................................................................... 49
Appendix 1. Keyword search terms for electronic databases ........................................................... 49
Appendix 2: Electronic and grey literature databases searched in this review ................................. 49
Appendix 3: Retail journals searched in this review ......................................................................... 49
Appendix 4: Keyword search terms for ‘other sources’ searched in this review .............................. 50
Appendix 5: Other sources searched in this review .......................................................................... 50
Appendix 6: Experts consulted in this review .................................................................................. 51
Appendix 7: Copy of e-letter sent to retailers by the Metropolitan Police Service Business Crime
Hub .................................................................................................................................................... 51
Appendix 8: Information extracted from included studies ............................................................... 52
Appendix 9: Studies included in this review .................................................................................... 53
Appendix 10: Narrative review of the seven studies included in Effect section ............................... 55
Appendix 11: Summary of information relevant to Mechanisms, Moderators, Implementation and
Economics reported in eligible studies ............................................................................................. 60

4
LIST OF TABLES
Table 1: Characteristics of studies with quantitative outcome measures included in Effect
section
Table 2: Risk of bias assessment for studies included in Effect section
LIST OF FIGURES
Figure 1: Flowchart of study selection
Figure 2: Illustrative logic model of how EAS tags might produce their effects

5
ACKNOWLEDGEMENTS
We thank Nick Allen, Chet Beresford, Sue Fish, Phyllis Schultz, Richard Stone, Anas Wihaib
and participating retailers for their input and assistance in producing this report. We also
thank Adrian Beck and Read Hayes for commenting on a previous draft. The opinions stated
in this report are solely those of the named authors and not academics or organizations (such
as the College of Policing) involved in the What Works Centre for Crime Reduction. The
research was co-funded by the College of Policing and the Economic and Social Research
Council (ESRC); Grant title: 'University Consortium for Evidence-Based Crime Reduction'.
Grant Ref: ES/L007223/1.

6
A SYSTEMATIC REVIEW OF TAGGING AS A METHOD TO REDUCE THEFT IN
RETAIL ENVIRONMENTS
ABSTRACT
Retailers routinely use security tags as a form of situational measure to reduce theft. Guided
by the acronym EMMIE, this paper set out to 1) examine the evidence that tags are Effective
at reducing theft, 2) identify the Mechanisms through which tags are expected to reduce theft
and the conditions that Moderate tag effectiveness, and 3) summarise information relevant to
the Implementation and Economic costs of tagging. Following a systematic search of the
published and unpublished literature, and through consultation with four retailers, we
identified fifty studies that met our inclusion criteria. Eight studies reporting quantitative data
were assessed in relation to the effectiveness of tags, but heterogeneity in the type of tag and
the reported outcome measures precluded a meta-analysis. Based on the available evidence it
is difficult to determine the effectiveness of tags as a theft reduction measure, albeit there is
suggestive evidence that more visible tags outperform less visible tags. The three identified
mechanisms through which tags might plausibly reduce theft – increase the risks, reduce the
rewards, increase the effort – were found to vary by tag type, and their activation dependent
on five broad categories of moderator: retail store and staff, customers (including shoplifters),
tag type, product type, and the involvement of the police and wider criminal justice system.
Implementation challenges related to staffing issues and tagging strategy. Finally, although
estimates are available on the costs of product tagging, our literature searches identified no
high-quality published economic evaluations of tagging. The implications of our findings and
suggestions for future research are discussed.
Keywords: EMMIE, loss prevention, retail, shrinkage, situational crime prevention, tags,
theft

7
BACKGROUND
Shoplifting is a persistent problem for many retailers. It is a major source of ‘shrinkage’, the
umbrella term used to denote losses attributed to theft, fraud, error, damage or wastage.
According to estimates from the Global Retail Theft Barometer (2015), the cost of retail
crime globally exceeded $214 billion in 2014-15i. Beyond obvious financial losses to retailers,
the effects of retail crime can be far reaching. In extreme cases, chronic crime levels can
force businesses to close thereby limiting employment opportunities and the availability of
goods and services (Hopkins and Gill, 2017). Moreover, high crime levels ultimately fall on
the consumer through elevated prices, comprising what Bamfield and Hollinger (1996) call a
‘crime tax’.
Loss prevention is thus a key concern for many retailers (Hayes, 1997). It is also big
business: global expenditure on security and loss prevention is estimated to be around 0.65%
of total sales (Global Retail Theft Barometer, 2015). Diverse measures are implemented to
reduce theft in retail environments. These include “store detectives and guards, active
customer service initiatives, secure product handling procedures, locked or otherwise
specialized display fixtures, reinforced packaging, staff screening and training, in-store
signage …. periodic audit/cycle counts, cabling, sales floor design, civil and criminal
sanctions, display alarms, and CCTV video domes” (Hayes and Blackwood, 2006, p. 263).
Despite the preponderance of security measures used by retailers, evaluations of their
effectiveness remain scarce (Hopkins and Gill, 2017). Those evaluations that are available
have also been criticised for, amongst other things, insufficient time periods over which to
assess the impact of interventions and failure to identify the causal mechanism(s) through
which security devices produce their effects (Hopkins and Gill, 2017).
This review is concerned with the effectiveness of security tags in retail environments. Tags
are widely used in retail settings (DiLonardo, 2015; Hayes, 2007; Beck and Palmer, 2010;
Global Retail Theft Barometer survey, 2015). They are often favoured over other loss
prevention methods because tagged products remain on display and are accessible to staff and
prospective buyers. Despite the popularity of tagging, to date there has been no attempt to
systematically review the evidence on whether they are effective at reducing theft.
8
Informed by EMMIE – an acronym denoting five categories of evidence considered relevant
to crime prevention decisions makers (see Johnson, Tilley and Bowers, 2015) – in this review
we summarise the available evidence to: 1) determine whether tags are Effective at reducing
theft; 2) articulate the Mechanisms through which tags are expected to reduce theft and the
conditions that Moderate tag effectiveness; and 3) identify the Implementation considerations
and Economic costs of tagging.
The remainder of this review is organised as follows. First, we briefly chart the history and
development of tagging in retail environments, and describe the main types of tags available.
Next, we outline the acronym EMMIE and how it informed this review. Third, we report our
methods and search strategy. The results then follow, organised according to EMMIE. We
finish by discussing our findings and their implications.
ON THE DESIGN AND DEVELOPMENT OF ANTI-THEFT TAGS
Tagging is a form of situational crime prevention (Clarke, 1997; Clarke and Bowers, 2017)
intended to reduce opportunities for theft. ‘Tags’ is a convenient umbrella term for a diverse
range of security products including bottle caps, spider wraps and anti-tamper seals (see
Beck, 2016b). This review focusses on two specific categories of tag:
Ink tags – these refer to reusable ‘hard tags’ that contain glass phials of indelible ink
or dye that is expelled when the tag is tampered with, thereby rendering the product
damaged and less desirable (DiLonardo and Clarke, 1996). Ink tags are non-
electronic. They are typically used by apparel manufacturers and tend to be removed
by cashiers at point of sale.
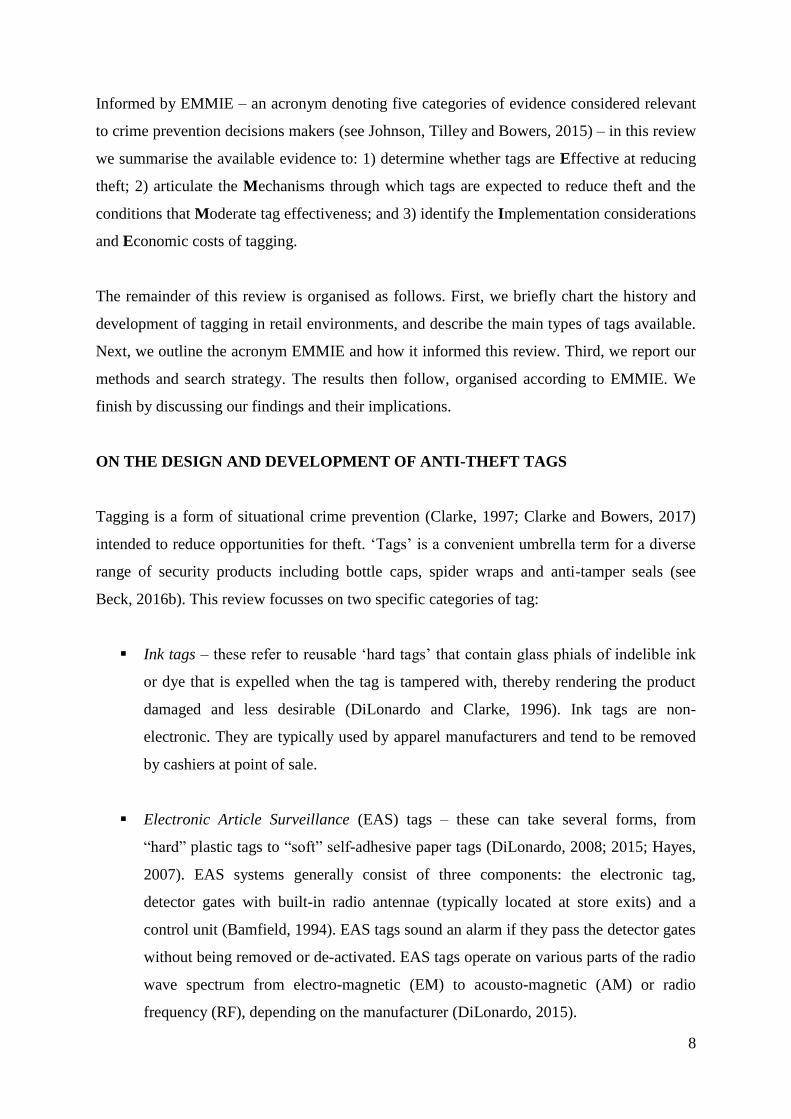
Electronic Article Surveillance (EAS) tags – these can take several forms, from
“hard” plastic tags to “soft” self-adhesive paper tags (DiLonardo, 2008; 2015; Hayes,
2007). EAS systems generally consist of three components: the electronic tag,
detector gates with built-in radio antennae (typically located at store exits) and a
control unit (Bamfield, 1994). EAS tags sound an alarm if they pass the detector gates
without being removed or de-activated. EAS tags operate on various parts of the radio
wave spectrum from electro-magnetic (EM) to acousto-magnetic (AM) or radio
frequency (RF), depending on the manufacturer (DiLonardo, 2015).

9
Ink tags originated in Sweden in the 1980s. Usage was initially patchy: tags were often large
and bulky and application and removal was challenging (DiLonardo, 2008). Progressive
refinements to the design of ink tags resulted in a greater penetration rate, particularly in the
USA. Recent generations of ink tags are more sophisticated still, often including an electronic
component and associated alarm system (see http://www.concepttag.com/).
EAS tags have likewise undergone considerable technological innovation over the past 50
years since their inception. Whilst EAS tags were originally designed for apparel retailers, in
response to widespread thefts they have since been applied to a much wider range of goods,
including groceries and music products. The first commercial tags deployed in the 1960s
were hard, round and plastic, affixable by pins, using RF, EM and microwave technologies
(DiLonardo, 2015). The 1980s saw the advent of smaller magnetic “soft” EAS tags which
were disposable, attached with adhesive backs, and could be deactivated at point of sale. The
1990s produced tags which could be sewn into or heat-sealed onto clothing at the point of
manufacture (DiLonardo, 2015). This process of source tagging has become increasingly
popular over the past decade, particularly among retailers since it ensures better consistency
in tag application and it removes the requirement of retailers to train and resource staff to tag
items in store (Beck and Palmer, 2010). More recently, retailers have experimented with the
use of RFID EAS tags albeit primarily as a way of monitoring stock levels as opposed to
controlling theft (see Jones et al. 2005). EAS tags are arguably the most commonly used
contemporary article surveillance measure, boosted by ever-cheaper RF technology. Seventy-
three per cent of respondents to the Global Retail Theft Barometer survey (2015) reported
using EAS tagsii.
EMMIE AND OUR APPROACH TO SYSTEMATIC REVIEW
The goal of this review is to equip retailers and crime prevention professionals with
information to help make evidence-informed decisions concerning the appropriateness of
tagging as a theft prevention measure, for different products, in varying retail settings and
under a range of circumstances. To this aim, we selected EMMIE as a guiding framework for
our review (Johnson et al. 2015; Tilley, 2016; Bowers and Johnson, 2017). EMMIE does not
mandate a preferred method of undertaking a systematic review. Johnson et al. (2015) do,
however, suggest that evidence that reliably speaks to the five dimensions of EMMIE might
best be captured through a mixed methods design. This can be seen in the EMMIE-informed

10
review of alley gating by Sidebottom and colleagues (2017). In their review, questions
concerning the effectiveness of alley gating – what works? – were examined using meta-
analytic methods, whereby quantitative data from primary evaluation studies were pooled to
produce on overall effect size. By contrast, questions on how alley gates are expected to
reduce crime (mechanisms) and under what conditions (moderators) were examined using a
qualitative approach inspired by realist review methods (see Pawson, 2006). This involved a
wider range of primary studies, including but not limited to those evaluative studies that were
eligible for meta-analyses, being read, coded and discussed with the aim of formulating
working theories on the causal processes through and conditions under which alley gates may
produce their observed effects. In this review, consistent with Johnson et al. (2015) and
Sidebottom et al. (2017), we adopt a mixed-methods approach.
METHODS
Criteria for considering studies for this review
We used the following criteria in selecting studies for this review:
a) The study must report an explicit goal of reducing the theft, shrinkage or loss of items
through the use of security tags. Theft could refer to offences committed by customers
or employees, although in many cases we expect the offender will be unknown. ‘Tag’
can refer to any type of article surveillance measure including ink tags, electronic tags
or more recent hybrid tags. Studies were included irrespective of who funded or
implemented the tags (such as tag vendors, police, retailers), or whether they were
implemented in isolation or as part of a wider package of loss prevention measures.
b) The study must relate specifically to retail environments, defined here as physical
spaces open to the public where merchandise is sold. This is distinguished from tags
implemented in non-retail environments (such as the workplace or prisons) or the
retail supply chain, both of which were excluded from this review. Studies in which
items were tagged at source (by the manufacturer) or in-store (by the retailer) were
included.

11
As mentioned previously, consistent with other reviews that have drawn on the EMMIE
framework (see Sidebottom et al. 2017), we used a mixed-methods approach when
synthesising evidence according to the five categories of EMMIE. To determine the
effectiveness of tags as a theft reduction measure – the Effect section of EMMIE – we
selected studies that satisfied points a) and b) above and met the following two criteria:
c) The study must report at least one quantitative theft, shrinkage and/or loss outcome
measure. It is widely recognised that retailers differ in how they measure loss or
shrinkage (see Beck, 2006; 2016a). For this reason, we accepted a range of outcome
measures that relate to the effectiveness of tags including but not limited to police
recorded crime data or store product inventories.
d) The study must report original research findings. Quantitative findings for any study
were incorporated only once, even if reported in multiple publications. Where this
might be the case, the study reporting the most detailed information was included or,
where necessary, any dependency in the data dealt with appropriately.
Based on an initial scan of the literature, we anticipated a small number of impact evaluations.
Consequently, in this review we considered various research designs (including simple before
and after designs). However, as will become clear, in the event all but one of the identified
evaluations of tagging in retail environments used some form of comparison group.
Items c) and d) were not part of the inclusion criteria for selecting studies that may provide
evidence concerning the Mechanisms, Moderators, Implementation or Economics of tags.
For these elements of EMMIE, we undertook a realist-review approach and therefore
considered a broader range of research studies. To be included in this branch of our review,
studies had to satisfy points a) and b) above - report an explicit goal of reducing theft,
shrinkage or loss in retail environments through the use of tags - and report substantive
information relating to at least one of the items below:
e) Theft-related causal mechanisms activated by tags in retail environments;
f) The conditions judged to influence the activation of theft-related causal mechanisms
in retail environments;
g) The implementation of tags in retail environments; or

12
h) The costs of tags in retail environments.
Realist reviews are increasingly practiced in the health sciences to better understand ‘what
works for whom, how and in what circumstances’ (see, for example, Berwick 2008; Davidoff
2009; Meads et al. 2015; Best et al. 2012; Kastner et al. 2015). Examples in criminology are
rare, but those which are available converge on the finding that few primary studies report
data concerning how an intervention is assumed to work (mechanism) and under what
conditions (moderators) (van der Knaap et al. 2008; Sidebottom et al. 2017). Consequently,
for this branch of our review we used a generous inclusion criteria and considered studies to
be eligible if they “reported” information relevant to Mechanisms, Moderators,
Implementation and Economics; eligibility was not contingent on studies providing empirical
evidence pertaining to these elements. Insisting on this more stringent threshold was felt to be
too restrictive and would likely result in the exclusion of potentially informative studies.
Identifying studies: databases and information sources
Eligible studies were sought using five methods: 1) A keyword search of electronic databases
including retail journals, grey literature and dissertation databases (see Appendices 1, 2 and
3)iii
; 2) a hand search of relevant journals that are not included in the databases we
examinediv
; 3) a keyword search of publications by relevant government, research and
professional agencies (see Appendices 4 and 5); 4) forward and backward citation searches of
evaluation studies included in the Effect sectionv ; and 5) consultation with retailers and loss
prevention managers (see Consulting Retailers below). We considered the latter search tactic
to be important for this review because we expected a substantial grey literature on the
effectiveness of tags produced for specific businesses but treated as commercially sensitive at
the time of production.
No date restrictions were applied to our searches. Studies did, however, have to be available
in English. Our list of candidate studies was checked by recognised experts on retail crime
(see Appendix 6).

13
Consulting retailers
Retailers were approached in two ways. Firstly, via the UK Metropolitan Police Service
(MPS) Business Crime Hub, which coordinates and provides crime prevention advice to
many large retailers in London. Twenty-three retailers were sent an e-letter (see Appendix 7)
by the MPS outlining the purpose of our review and requesting that they participate in the
study, specifically through the sharing of information gleaned from any trials of the
effectiveness of tagging which they had been involved in. A copy of the review protocol was
also attached to the email. Secondly, meetings were held with senior police officers who at
the time of writing held the positions of national and deputy lead for retail crime in England
and Wales. Both were told of this review and asked to circulate a copy of the aforementioned
email to relevant retailers requesting their participation.
Data extraction and management
For those studies eligible for inclusion, two researchers independently extracted relevant
information (AS and AT). This information related both to the characteristics of the study
(author, date, setting) as well as the different elements of EMMIE (see Appendix 8). Any
disagreements were resolved through discussion with the research team.
Assessment of bias in eligible studies included in our Effect section
In an attempt to quantify methodological probity, all studies that made causal claims about
the effectiveness of tags (i.e. those included in the Effect section) underwent evidence
appraisal, conducted independently by two authors (AS and LT). Four potential sources of
bias were assessed: 1) Selection bias (whether action and control groups were comparable at
baseline, where appropriate), 2) measurement bias (the extent to which the data analysed
were a reliable measure of theft, as opposed to loss, shrinkage and so on), 3) regression to the
mean (whether the installation of tags followed a sudden increase (or decrease) in theft,
shrinkage and/or loss) and 4) contamination effects (the extent to which study authors
identified and/or discounted factors that might plausibly explain the outcomes observed).
Each domain was scored as low risk, medium risk or high risk. High risk of bias is taken here
to mean no mention of relevant issues and/or how they might affect the reliability of the
findings. Medium risk denotes mention of relevant issues but no attempt to discount them.

14
Low risk of bias denotes mention of relevant issues and statistical efforts to discount them.
Any disagreements were resolved through discussion with the research team. We recognise
that our assessment of any bias that may be present may relate more to the descriptive
validity of studies (what is reported) rather than their internal validity (Farrington, 2003).
Realist review
As part of our realist review, four researchers (AS, JB, AT and NT) read and independently
coded those articles judged relevant to tagging. A code set was created to extract information
on Mechanisms, Moderators, Implementation and Economics (MMIE), and was used to
develop working theories as to how tags operate as a theft reduction method. These theories
were then scrutinised and refined through regular group discussions. Consultation with
retailers and loss prevention managers provided supplementary information and provided a
means of receiving feedback on the emerging theories.
RESULTS
Search results and screening
Our search strategy returned over 1,000 potentially eligible records (once duplicates were
removed). The title and abstract of identified studies were screened by three review authors
(LT, JB and AT) to determine eligibility based on our inclusion criteria. Tests of inter-rater
reliability were carried out to ensure the accuracy of this process with 92% agreement on
inclusion and exclusion. Our approach at this stage erred on the side of inclusivity, with
studies being retained if the title and abstract made any reference to tagging in retail
environments. The full text of 152 studies was then examined by the same three review
authors using our inclusion criteria. Disagreements were resolved by discussion and, where
necessary, through the involvement of additional authors.
The number of, and reasons for, exclusions at each stage of the sifting process are shown in
Figure 1. In sum, fifty studies were judged relevant to tagging, all of which were analysed as
part of our realist synthesis (see Appendix 9 for a list of these studies). Of these fifty studies,
eight made claims about the effectiveness of tags and were therefore deemed eligible for
quantitative synthesis (the Effect section).

15
It is noteworthy that our consultation with retailers produced four reports on tagging trials
carried out by two retailers. In Figure 1 these reports are included in ‘other sources’.
Moreover, four retailers agreed to participate in semi-structured interviews on the use of tags
and one retailer agreed to show members of the review team around a central London store to
demonstrate how tags are applied in practice. All participating retailers asked that their
identities remain anonymous and that the aforementioned industry reports not be shared.
Figure 1 Flowchart of study selection

16
EFFECT
We identified eight studies that made causal inferences about the effectiveness of tags in
retail environments. Characteristics of these studies are summarised in Table 1 and a
narrative review is provided in Appendix 10. As shown in Table 1, five studies appeared in
the scientific literature (journals or book chapters) and three studies were industry reports,
two of which were conducted by a single retailer. Study dates ranged from 1993 to 2016.
Seven studies examined the effectiveness of EAS tags and DiLonardo and Clarke (1996) was
the only evaluation of the impact of ink tags. We identified no impact evaluation studies for
other types of tag. All studies took place in either the U.S. (n = 4) or U.K. (n = 4), in
supermarkets (n = 2), large retail stores (n = 3), predominately clothing stockists (n =2) and a
large electronics store (n = 1).
Seven of the eight studies used some form of comparison group. This ranged from making
comparisons between 1) similar but untagged products in the same store (Retailer B, 2015),
2) different stores in which the specific tags under evaluation were not installed (Farrington et
al. 1993; Bamfield, 1994; Hayes and Blackwood, 2006; Beck and Palmer, 2010; Downs,
Hayes and Tallman, 2011), and 3) the store chain average more generally (DiLonardo and
Clarke, 1997). The trial reported in Retailer A (2015) did use a comparison group but only in
relation to changes in sales and availability. The impact of tags on shrinkage was assessed
using a before and after design. As shown in Table 1, there was considerable variation in the
number of sites included in each study. For example, Farrington et al. (1993) reported on the
effectiveness of EAS tags that were implemented in two stores compared to one store that
was redesigned with security in mind, one store which received security guards and a ‘control’
store that received no additional security measures. Likewise, Bamfield (1994) examined a
comparatively small sample of four action sites against one control site. The largest study
was by Beck and Palmer (2010) which used data from a multibillion dollar US clothing
retailer to examine the effects of switching from hard tags to source-tagged soft tags. Retailer
B (2015) adopted a different approach to the other studies whereby shrinkage levels for select
lines of tagged meat products were compared to that of similar non-tagged items in the same
store.
Although these eight studies all made causal inferences about the effectiveness of tags, on
closer inspection we observed considerable heterogeneity across studies, particularly in terms

17
of study outcome measures (discussed below). This was compounded by the different types
of tags being evaluated (hard vs. soft EAS tags, visible vs. concealed tags) which, as we shall
see, might plausibly give rise to different preventive mechanisms. We felt that these studies
were too dissimilar to warrant a meaningful meta-analysis (see Petticrew and Roberts, 2006,
chapter 6). The sections that follow discuss the heterogeneity across these studies, looking
first at study outcome measures and then at the findings of our risk of bias assessment. The
third section draws some tentative conclusions about the effectiveness of tags from reviewing
these studies.
Heterogeneity in outcome measures
Table 1 shows that shrinkage/shortage was the most common outcome measure across the
eight studies (n = 6). Commentators have long-observed variation in how shrinkage is
conceived and measured by retailers (see Beck, 2006; 2016a). Our findings support that
conclusion. Bamfield (1994, p. 162) measured shrinkage as “the difference between actual
sales + net stock compared with the previous period, and the book level of sales + stock”.
Downs et al. (2011) likewise measured shrinkage as “actual in-stock – expected in-
stock/expected in-stock). DiLonardo and Clarke (1996) and Beck and Palmer (2010) both
used store inventory statistics. Finally, Retailer A (2015) and Retailer B (2015) did not
provide a clear definition of how shrinkage was measured, possibly for reasons of
commercial sensitivity. It should be clear that although each of these studies used some form
of shrinkage, it is difficult to determine the comparability of these shrinkage estimates.
Our interviews with retailers revealed that the accuracy of the inventory counting processes
that generate shrinkage estimates may vary both by business and product: fledgling
businesses with less sophisticated delivery and tracking procedures may suffer a higher
proportion of non-theft losses than more mature businesses with highly stringent, well-
established systems in place; the delivery and tracking processes for high value items also
tend to be more sophisticated than low value items. Moreover, from the perspective of theft
reduction, an additional limitation is the inability to isolate the degree to which theft is a
source of shrinkage, as opposed to error, wastage and so on. It is also likely to be unclear
who perpetrated the theft – customers or employees (for a related discussion see Beck,
2016a). It is worth mentioning that in some cases it appeared that the researchers had little
influence over the data that were available to them. For example, Beck and Palmer (2010, p.

18
Table 1: Characteristics of studies with quantitative outcome measures studies included in Effect section
Study Publication
type
Location Store type Tag type Item(s)
tagged
Action
group
Control group Outcome
measure(s)
Results
Farrington et
al 1993
Book chapter UK
(country-wide)
Electrical
goods stores
EAS tags Electrical
goods
2 stores
with tags
1 store control, 1
store redesigned
and 1 store with
security guards
% of items stolen Significant long term
decrease in number of items
stolen in stores where tags
were installed
Bamfield 1994 Book chapter UK (North and
Midlands)
Variety chain
retailer
EAS hard tags All except
those which
cost <£5
4 stores 1 store Shrinkage 28.3% reduction in
shrinkage post intervention
DiLonardo
and Clarke
1996
Journal USA (country-
wide)
Women’s
clothing stores
Ink tags Clothing 14 stores None Shortage 42% reduction in shrinkage
where ink tags were installed
Hayes and
Blackwood
2006
Journal USA (several
states)
Mass merchant
retail chain
EAS tags
(concealed and
not)
Personal
grooming
products
13 stores 8 stores Item loss levels,
product
availability, sales
No significant difference in
loss levels, product
availability or sales figures
Beck and
Palmer 2010
Journal USA
(country-wide)
Apparel retailer
(clothing,
fragrances)
EAS hard tags
vs EAS soft
tags
Clothing 355
stores
540 stores Shrinkage 250% increase in shrinkage
following installation of soft
tags
Downs, Hayes
and Tallman,
2011
Industry report USA (location
unspecified)
Department
store
A3 EAS tag (in
red and beige)
vs EAS tags
Jeans 3 stores 3 stores Shrinkage and
sales
Overall A3Tags produced a
49% increase in shrinkage
and 5% increase in sales; red
A3Tags saw a 42%
reduction in shrinkage and
18% increase in sales
Retailer A
2015
Industry report UK
(country-wide)
Supermarket EAS soft tags
vs hard cases
CDs 20 stores 60 stores Shrinkage and
sales
134% increase in shrinkage
following installation of soft
tags; 16.6% increase in sales
of tagged items
Retailer B
2015
Industry report UK
(country-wide)
Supermarket EAS soft tags Meat
products
Number
of stores
not
stated
Similar items in
same store
Shrinkage 52.6% reduction in
shrinkage following
installation of EAS
19
116) explicitly reported having “no control over the collection of the raw shrinkage
data”. Similarly Downs et al. (2011, p. 14) add that they “had no control over the
accuracy of the data provided by the participating retailer”.
It is noteworthy that we identified only two studies that included a theft outcome
measure. In both cases collecting such data required considerable effort and resources
on the part of the research team. Farrington et al. (1993) systematically counted the
number of specified items on display each day. Shoplifting was inferred if the absence
of a particular item could not be attributed to the item being sold, used, damaged,
relocated or given away. It is important to add that this type of theft-specific
information could not be gleaned retrospectively using inventory counting systems
common to most retailers. Farrington et al. (1993) report that the research team was
involved from the outset of the project and worked closely with the participating
stores to provide training in and a rationale for this additional data collection
procedure.
The second study reporting a theft outcome measure is Hayes and Blackwood (2006),
who made use of various data including inventory counts and site observations. A
novel feature of their study was the use of CCTV footage from selected stores to
determine whether losses could be attributable to customer or employee theft.
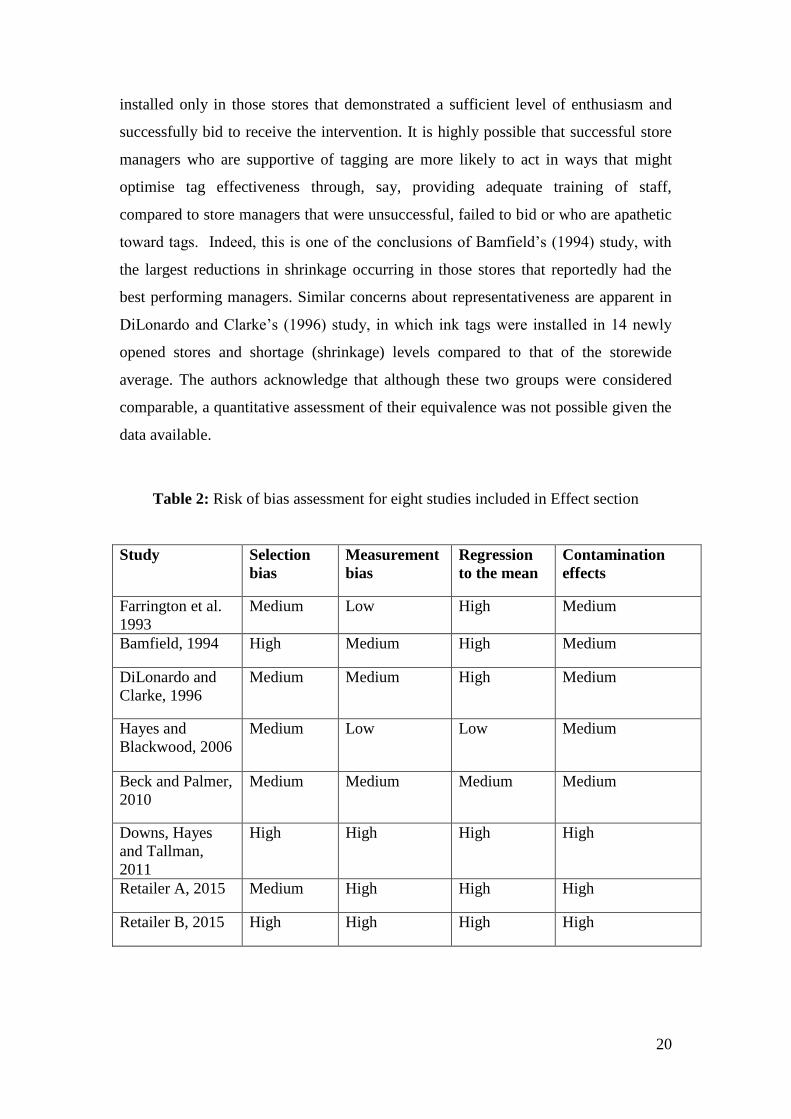
Risk of bias assessment
The risk of bias ratings for all eight studies are displayed in Table 2. Selection bias
was found to be a key methodological concern in all eight studies. No studies reported
the use of inferential statistical tests to ensure equivalence of action and control
groups before the installation of tags. Matching was typically based on similar store
characteristics (such as size, layout, product range etc) as opposed to outcome
measures. Beck and Palmer (2010) display, but do not quantitatively assess, the
volume and trajectory of shrinkage in action and control sites before the installation of
tags.
How retail stores were selected to receive tags in some studies also raised concerns
about their representativeness. In Bamfield’s (1994) study, for example, tags were
20
installed only in those stores that demonstrated a sufficient level of enthusiasm and
successfully bid to receive the intervention. It is highly possible that successful store
managers who are supportive of tagging are more likely to act in ways that might
optimise tag effectiveness through, say, providing adequate training of staff,
compared to store managers that were unsuccessful, failed to bid or who are apathetic
toward tags. Indeed, this is one of the conclusions of Bamfield’s (1994) study, with
the largest reductions in shrinkage occurring in those stores that reportedly had the
best performing managers. Similar concerns about representativeness are apparent in
DiLonardo and Clarke’s (1996) study, in which ink tags were installed in 14 newly
opened stores and shortage (shrinkage) levels compared to that of the storewide
average. The authors acknowledge that although these two groups were considered
comparable, a quantitative assessment of their equivalence was not possible given the
data available.
Table 2: Risk of bias assessment for eight studies included in Effect section
Study Selection
bias
Measurement
bias
Regression
to the mean
Contamination
effects
Farrington et al.
1993
Medium Low High Medium
Bamfield, 1994 High Medium High Medium
DiLonardo and
Clarke, 1996
Medium Medium High Medium
Hayes and
Blackwood, 2006
Medium Low Low Medium
Beck and Palmer,
2010
Medium Medium Medium Medium
Downs, Hayes
and Tallman,
2011
High High High High
Retailer A, 2015 Medium High High High
Retailer B, 2015 High High High High

21
Issues concerning potential measurement bias - the extent to which the data analysed
were a reliable measure of theft – have already been covered. Farrington et al. (1993)
and Hayes and Blackwood (2006) received favourable ratings because their outcome
measures spoke more directly to theft. The two retail reports were deemed to be at
high risk of bias since it was unclear how shrinkage was measured. Reasons for this
are discussed shortly below.
To protect against regression to the mean effects (and confounding variables) studies
implementing tagging in high-theft stores needed to be attentive to underlying trends
in their data. Hayes and Blackwood (2006) was the only study to attempt to do this
through triangulating data from multiple sources, and thus they received a low risk
rating. Beck and Palmer (2010) used time series data to provide an indication of
trends, but fell short of conducting a rigorous statistical test for seasonality or other
patterns in their data, and hence were considered to be at medium risk of bias. In the
remaining studies, either regression to the mean had not been taken into consideration
or there was not enough information to judge, resulting in high risk of bias. The five
studies published in the scientific literature all readily acknowledged various potential
confounds that could have affected the observed results (see Moderators and
Implementation sections below). Regrettably, and likely owing to a lack of available
data, none statistically examined the effect of these possible shortcomings, and hence
received a medium risk rating for risk of contamination.
The three industry reports (Retailer A, 2015; Retailer B, 2015; Downs, Hayes and
Tallman, 2011) warrant special mention. As seen in Table 2, based on the material
presented, each trial received several high-risk ratings. This was largely owing to the
lack of information on potential sources of bias or efforts made to discount them.
However, to some extent making comparisons between these reports and the
aforementioned scientific articles is inappropriate. The reports made available to us
were short, pithy, and contained little superfluous information beyond the key
priorities of retailers: what was done and what was found in relation to customer and
staff reactions and, ultimately, sales. They were written for an internal audience who
are likely to be familiar with how security devices are implemented and assessed in
that particular store, and were likely presented with supplementary verbal accounts.

22
They were not produced for external scrutiny on the research methods undertaken, as
has occurred here.
Overall findings of eligible studies
What, then, can be said about the effectiveness of tags as a theft reduction measure in
retail environments? Mindful of the aforementioned variability in outcome measures,
if we assume that reductions in theft, loss, shrinkage and shortage all denote positive
outcomes associated with the introduction of tags, then across these eight studies we
find mixed results. Considering all types of tags, five studies report positive results
(Farrington et al. 1993; Bamfield, 1994; DiLonardo and Clarke, 1996; Downs et al.
2011 (specifically in relation to red A3Tags); Retailer B, 2015) (see Table 1). With
the exception of Retailer B (2015), these studies all relate to the effectiveness of
visible tags. Of these studies, Farrington et al. (1993) is unusual in collecting theft-
specific data, finding that electronic tags produced significant and sustained
reductions (over at least six weeks) in shoplifting compared to those stores where tags
were not fitted. However, there are concerns over the representativeness of these
findings considering the small number of stores that received tags (n = 2) and the
limited time period over which tag effectiveness was assessed (1 week pre-
intervention and up to 6 weeks post intervention).
As shown in Table 2, the methods used by Hayes and Blackwood (2006) are arguably
the most robust of the eight evaluation studies we identified. Their quasi-experimental
study related specifically to source-tagged concealed EAS tags affixed to personal
grooming products. They found no significant differences in loss, product availability
or sales figures across test and control stores. By contrast, Beck and Palmer (2010)
and Retailer A (2015) report an increase in shrinkage following the installation of
tags. These apparent backfire effects warrant closer scrutiny. Beck and Palmer (2010),
for example, assessed changes in shrinkage rates following the switch from more
visible hard tags to less visible soft tags; it was not a conventional tag versus no tag
evaluation. The resultant 251% increase in shrinkage in the action stores (compared to
a 33% increase in control stores) may, therefore, be partly explained by the
effectiveness of the previous (more visible) tag regime. As the study authors report,
staff where the new tags were installed attributed the observed increase in shrinkage
23
to “the lack of a visual deterrent to would-be thieves”, and as alarm activations
increased, “staff members [became] less likely to respond [to sounding alarms] and
more likely to simply wave customers through” (Beck and Palmer, 2010, p. 119).
Moreover, staff felt that the soft tags, once noticed by offenders, were easier to
remove than hard tags, thereby bypassing the alarm system and further contributing to
the increases in shrinkage. This hypothesis was based on an apparent increase in the
number of discarded tags found in changing rooms. Also on the topic of tag visibility,
Downs et al. (2011) showed that the installation of a new type of EAS tag in red
produced reductions in shrinkage and increases in sales whereas for the beige
counterpart, the reverse was true.
The backfire effect reported by Retailer A (2015) also requires elaboration. As
indicated in Table 1, this trial examined the impact of replacing secure casings for
CDs with soft RF tags. The CD casings were considered too bulky and unattractive
and were replaced with what were judged to be less obtrusive security measures.
Shrinkage figures for tagged CDs was 134% greater over the eight-week trial period
compared to the same time period before the tags were applied. Although clearly a
negative result from the perspective of loss prevention, the authors report a
corresponding increase in the sale of tagged CDs in 20 action stores (24.7%)
compared to CDs in 60 comparison stores where tags were not fitted (which saw an
increase in sales of 6.3%), producing an overall net profit. Combined with reported
improvements in the sale process and staff time (it was considered quicker and easier
to deactivate the tags than remove the secure casings), the tag strategy was considered
a success. This apparent disconnect between theft reduction and economic profit is a
topic we return to in the Discussion.
MECHANISMS
Mechanisms are taken here to refer to the processes through which tagging in retail
environments produces the observed effects (Pawson and Tilley, 1997). Determining
the causal mechanism(s) responsible for outcome patterns is challenging, for several
reasons: 1) there is often confusion over what constitutes a mechanism (Dalkin et al.
2015), 2) the term is rarely used explicitly in primary studies and 3) how a crime

24
prevention intervention is assumed to work is rarely articulated (van der Knaap et al.
2008; Sidebottom and Tilley, 2012).
It is important to acknowledge from the outset that none of the studies we identified
contained a quantitative assessment of tag-related mechanisms nor did they report
data that would allow for a retrospective analysis. Consequently, what we describe
here are the main mechanisms evident from the sources we scrutinised. Each is
discussed here in isolation. In reality, however, it should be noted that tags might
activate multiple mechanisms, giving rise to varying outcome patterns or working in
concert to produce the same patterns jointly.
References to mechanisms in the tagging literature reviewed
We assessed the prevalence of mechanism-related information in the 50 tagging
studies we identified using a simple 3-point scale: 1) the study explicitly referred to
how tagging is expected to work, 2) the study alluded to how tagging is expected to
work and 3) the study made no reference to the mechanisms through which tagging is
expected to work. An obvious limitation with this method is that it takes no account of
variation in the extent to which studies discuss mechanism-related information.
Of the 50 studies consulted in the realist branch of our review, we judged that 27
(54%) included information regarding tag-related mechanisms (see Appendix 11). Of
those 27 studies, eighteen explicitly referred to how tagging is expected to operate.
This is a high proportion compared to other realist reviews of crime prevention
interventions (see van der Knaap et al. 2008; Sidebottom et al. 2017). To illustrate, a
study that we coded as alluding to tag-related mechanisms might refer to tags
producing a deterrent effect. Farrington et al. (1993, p. 100), by contrast, explicitly
made reference to mechanisms when they stated that ‘electronic tagging …[was]
intended to have a deterrent effect by increasing the subjective probability of
detection’.
We limit our focus here to those 27 studies that explicitly or otherwise reported
information concerning tag-related mechanisms. What follows is a description of the
three main mechanisms that emerged from these studies. As will become clear, certain

25
mechanisms are associated with particular types of tags, and are assumed to work
differently in different settings. The latter will be covered in more detail in the
Moderator section.
Increasing the risks
The dominant mechanism through which tagging is expected to work concerns
increasing the risk of an offender being detected (referred to in 25 studies (50%), see
Appendix 11). Importantly, this mechanism can operate in two ways – either by
altering the perception of risk or by influencing the probability of detection. To
elaborate, tags might reduce theft because their presence discourages thieves from
attempting to steal tagged items since their chance of detection is perceived to be
elevated. In this scenario, thieves avoid attempting to steal tagged items. By contrast,
the presence of tags may go unnoticed by offenders (particularly if the tags are
concealed) or be spotted and ignored. In this scenario the offender proceeds to try to
remove the item from the store but the tag activates an alarm, which in turn mobilises
staff and results in the offender being apprehended, thereby leading to reductions in
theft. Hence the former refers to perceived risk, whereas the latter refers to actual risk
of detection.
Both scenarios relate to increases in the risk of detection: the former serves to deter
would-be thieves and the latter boosts the probability of an offender being
apprehended. The latter is largely reserved for describing the effects of EAS tags. As
noted previously, ink tags are not electronic and therefore do not activate an alarm
system. For ink tags, any associated increases in risk could only be produced should
an offender attempt to remove the ink tag in store and either being spotted by a
member of staff or being coated in the indelible ink (Bamfield, 1992).
Reducing the rewards/benefit denial
The second most frequently mentioned mechanism, referred to in six studies (12%)
(see Appendix 11) concerns the reductions in rewards or benefits brought about
through using tags. In the studies identified, reward reductions were mainly discussed
in relation to ink tagsvi
. Simply put, attempts to remove ink tags illegally might cause

26
the tag to break, thereby releasing the ink and spoiling the sought after item. This in
turn would presumably make the item less desirable and harder to sell (Clarke, 1999).
Increasing the effort
Gill, Bilby and Turbin (1999), in their interviews with 38 shop thieves, discuss the
topic of removing tags in store. This relates to a third albeit less frequently discussed
mechanism through which tags might plausibly reduce theft: through increasing the
effort of offenders (mentioned in only two studies). This mechanism might reduce
theft in one of two ways. The first concerns the effort required to exit a store with a
tagged item without raising suspicions of staff or other onlookers who might intervene.
All things being equal, the required effort is likely to be higher for a tagged item than
a non-tagged equivalent, most obviously in efforts to circumvent associated alarm
systems (for EAS tags). A second way through which tags might increase offender
effort relates to the actual removal of the tag, be that in-store or after the event. Again,
it is plausible that thieves might be deterred from stealing products that require
extensive efforts or tools to remove the tag. Although plausible, it should be noted
that the literature we reviewed provided several examples of the methods and ease
with which shoplifters were able to remove tags (see for e.g. Bamfield, 1994;
Handford, 1994; Farrington et al. 1993; Gill, Bilby and Turbin, 1999), thereby
undermining this mechanism.
Mechanisms generating alternative outcome patterns
The three mechanisms described above all relate to theft or loss reduction. The
mechanisms activated by tagging might, however, also plausibly give rise to other
unintended positive or negative outcomes. These additional outcome measures were
identified primarily through our discussions with retailers. Wherever possible, strong
crime prevention evaluations should look to account for unexpected effects (see Eck,
2017). These additional measures are therefore discussed here as candidates for
inclusion in future tagging evaluations.
A positive effect of tagging concerns increases in sales. Reductions in loss as a
consequence of tagging could increase (or at least not reduce) the availability of

27
tagged items which in turn might boost sales. Here reductions in theft are an
intermediate outcome measure, leading to increases in sales (a non-crime final
outcome measure). A related positive effect of tagging concerns a reduction in
erroneous stock-outs. Many retailers employ automatic stock replenishment systems.
The accuracy of these systems is often compromised by high levels of theft because
stolen items do not register on stock management systems. Over time, such systems
may conclude that the sales of frequently stolen products have dwindled and that
replenishment is unnecessary, leading to reduced availability of such items on the
shelves.
Turning to negative outcomes association with tagging, some customers may interpret
widespread and overt product tagging as an indication of a high crime store (and/or
high crime area), which in turn might encourage them to shop elsewhere and/or shop
less often (see Longmore- Etheridge 1998). Moreover, inconsistent affixation of tags
coupled with poor or tricky detachment procedures might increase the time spent at
the point of sale, thereby fuelling irritation among customers and staff and decreasing
productivity levels. This could plausibly lead to several unwanted outcomes:
customers do not buy the item or go elsewhere, or staff search less diligently for tags
on products - thereby increasing the number of false alarms and associated customer
embarrassment.
MODERATORS
The terms ‘moderator’ and ‘context’ are used interchangeably in this section. They
refer to the conditions that enable tags to activate potential causal mechanisms.
Similar tags may, thus, activate different mechanisms depending on context, leading
to variations in outcomes. As will become clear in the following two sections, some
moderators are strongly influenced by the decisions and actions of those responsible
for the implementation of tags, and so some of the same themes occur when
discussing both moderators and implementation.
Twenty-eight studies (56%) contained information about moderators of tag
effectiveness (see Appendix 11). Eleven of these studies clearly stated one or more
potential moderators and the other seventeen alluded to such influences. Taken
28
together, these studies suggest that tagging and shop theft comprise a complex system,
made up of interdependent individuals and organisations that adjust and adapt to one
another. We identified five key elements that make up this system, all interacting in
the causal processes at work in the operation of tags:
1. The shop (and its staff),
2. Customers (including shoplifters),
3. The tag technology (and its providers),
4. The product (and its designers), and
5. The police and criminal justice system.
The literature we identified provides the following evidence relating to contextual
variations that shape the mechanisms activated by tags and thereby some of the
outcome patterns generated. These can be tied back into the five key elements listed
above.
1. Staff responses and shop setting
All alarm systems are prey to false alarms, and the way in which staff and customers
respond to these alarms is important (see Blackwood and Hayes, 2003). Although on
one hand, false alarms can be considered a negative consequence of EAS tagging, on
the other hand they can also be viewed as a moderator of tag effectiveness. Regarding
the latter, Beck (1996; 2002) finds that high false alarm rates (up to 93% in some
cases) can reduce staff and shoplifter confidence in the alarms. For EAS tags, this can
undermine the aforementioned risk-elevating mechanisms; both perceived risk of
detection and, through reduced responses from staff, the actual risk of detection.
Hayes and Blackwood (2006) report only an 18% response rate to 4,000 alarm
activations, and even then staff usually failed to reconcile the items found on people
with their till receipts.
False alarms have a range of sources including un-removed tags passing through the
store gates, goods bought at other stores, untagged items that nevertheless trigger the
alarm, and defects in the alarm system itself (Beck, 2002). Failure to deactivate within
store may be a function of either weaknesses in the system making deactivation

29
problematic or lack of staff vigilance or training (Handford, 1994). False alarms can
cause embarrassment or anger to legitimate customers; some expect an apology and
may be put off returning to the store in question, while others familiar with tags and
their rationale have been found to be more understanding (Dawson, 1993; Blackwood
and Hayes, 2006). False arrests resulting from false alarms have historically (and
especially in the US) resulted in prosecution and reputational costs for the stores
involved (see Bickman et al. 1980). Against the real risk of false alarms, Bamford
(nd) suggests that where false alarms are occasional they may function as reminders
to potential shoplifters that tags are being used in a store and thereby reinforce their
deterrence value (increase risk mechanism).
Busy shopping periods compromise the scope for staff to respond to alarms. There is
evidence of clear seasonal patterns to busyness, where greater busyness is associated
with higher levels of shrinkage (Global Retail Theft Barometer, 2015), although this
shrinkage cannot be conclusively attributed to shoplifting. Physically the shop layout
may facilitate or impede the operation of tagging systems. Doors without sensors
offer an attractive low risk exit route for thieves with EAS-tagged goods. Moreover
the space between gates affects the consistency of alarm activation (Huber, 2006).
The layout of the shop may offer greater or fewer opportunities for the shoplifter to
remove tags inconspicuously within store and to walk out without triggering an alarm,
and hence reduce risk of apprehension. The shop may or may not include signage that
reminds customers of tagging (and other security measures) and/or CCTV systems
that can be used in conjunction with tags to increase the perceived risk to shoplifters
by supplementing the evidence that goods have been stolen (Beck and Palmer, 2010;
Capers, 2008).
2. Type of shoplifter and customers
Two types of shoplifter are commonly referred to in the literature, with some
empirical support for the distinction: the ‘casual’, ‘amateur’, ‘novice’, ‘impulsive’, or
‘opportunist’ and the ‘professional’, ‘hard core’ or ‘expert’ (Gill et al. 1999; Carmel-
Gifilen, 2011; Hayes, 1999; Beck, 2002). Professional shoplifters tend to steal
frequently, steal large quantities of goods, plan their shoplifting, steal for resale or
refund, check out stores for opportunities and risks, test the efficacy of security

30
measures including tags, and work out ways of circumventing them. These methods
of circumvention are clearly then disseminated, sometimes widely as is evident from
readily available advice on the internet. Casual shoplifters on the other hand tend not
to plan shoplifting, steal for their own use or to give to others, steal for fun, and to
take goods where opportunities manifestly present themselves. They may learn about
opportunities to circumvent measures. They are less likely to develop them. For
casual shoplifters, conspicuous tags with high levels of publicity are deemed effective
and to deter thefts that would otherwise occur.
For professional shoplifters, deterrence is short-term and covert tags are deemed to
have an effect through their scope to lead to arrests of shoplifters who are unaware of
the risks they are taking (see Handford 1994; Capers 2008; Bickman et al. 1980;
Lottes 1992 on the different ways in which overt and covert tags work as potential
shoplifting prevention measures). As described previously, Beck and Palmer’s (2010)
observation that when hard, conspicuous tags were replaced with soft inconspicuous
ones, losses increased dramatically (by 250%), suggests that the visible deterrence
that is of greater relevance to the casual shoplifter had been more effective, which
may in turn suggest that casual shoplifters who are more easily deterred in this case
were responsible for the bulk of the losses (see also Downs et al. 2011). Likewise,
Buckle and Farrington (1984) in an observational study in a store in Peterborough
(UK), which involved tracking and observing a random selection of 503 shoppers for
an average of 6.9 minutes each found that 1.8% stole something and none was
apprehended. In a more recent study from the U.S. using similar methods, Dabney,
Hollinger and Dugan (2004) found 8.5% of shoppers were observed shoplifting.
These rates of theft suggest that many customers may be tempted occasionally to steal
items, as fairly casual shoplifters.
3. Tagging strategy and technology
As mentioned previously, tags vary in their visibility; ‘soft’ tags tend to be
inconspicuous and ‘hard’ tags conspicuous. The effect of conspicuous hard tags
depends less on staff vigilance than soft inconspicuous tags in that they convey to the
shoplifter the impression that they face increased risks of apprehension if they steal
the goods. Soft tags may not be spotted by the shoplifter until the alarm sounds as
31
they exit the shop and, if they are not stopped, then any potential crime prevention
mechanism is undermined. Indeed, the tag may thereby become discredited as a
source of increased risk in the eyes of the shoplifter (see Beck and Palmer, 2010). In
recent years several tag vendors have added symbols to soft tags in a bid to make
them more conspicuous to potential offenders (Beck, personal communication).
Tagging dosage also varies. Of the 12 US-based retailers interviewed by Blackwood
and Hayes (2003), seven were unsure of the proportion of merchandise that was
(EAS) tagged and across the remaining five retailers the average was 26% of
merchandise (ranging from 1% to 65%). In some stores there is a comprehensive
tagging strategy. One retailer we visited as part of this study hard tagged all goods
(except for shoes where only those for the right foot were on display). The tags used
had features of EAS and ink tags, combining efforts in a bid to activate mechanisms
associated with increases in perceived risk (EAS) and denying the benefits (ink tag) of
shoplifting. This retailer also used an innovative method of attaching the tags to goods,
which had (reportedly) yet to be circumvented by any shoplifters. Dramatic drops in
shrinkage had been claimed by this retailer in the commercial press. The idea was to
create stores that were comprehensively inhospitable to shoplifters.
Other tagging strategies include tagging frequently stolen goods, high value goods,
implementing different types of tag (some of which may be decoy tags) and
‘fractional tagging’ whereby only a proportion of goods is ‘protected’ by tags in the
expectation that diffusion of benefits effects (see Clarke and Wesiburd, 1994) will
also reduce the rate at which untagged goods are stolen (Bender 1997; Masuda, 1997;
Hayes and Blackwood, 2006). It is important to note that the opposite might occur
insofar that there is displacement from the theft of tagged to untagged items
(Bamfield, 1994) or from stores with tags to stores without them (Farrington, 1993).
No studies we identified revealed information on the difference these variations in
tagging strategy had on the overall rate of shrinkage (studies did, however, examine
the cost implications of fractional tagging, which we discuss in the Economics
section). We return to the topic of displacement and diffusions of benefits in the
Discussion.

32
4. Type of merchandise
The type of merchandise sold in shops clearly shapes the type of tagging that is
possible and the costs of doing so. Ink tags, for example, can quite easily be applied to
clothes (DiLonardo and Clarke, 1996) but are less relevant to other products. Meat,
which is commonly stolen in some grocery stores is not readily open to hard tags
(Retailer A, 2015). Some goods are so inexpensive that the costs of tagging would be
prohibitive. Hence the potential for tagging and the activation of specific preventive
mechanisms depends on a store’s product mix. Stores were found to consider the
effect of tags on sales as well as theft in decisions about which tag to use and whether
to use them at all. Some types of tag for some products make restocking more difficult
and time consuming than others. For example, in one trial, conspicuous bottle-top
tagging of alcoholic drinks was found to make restocking more difficult than soft tags
(Retailer C, 2016). As discussed previously, tags were applied to CDs in one store
because they made displaying and restocking more straightforward (than previous
secure casing) and hence increased sales, even at the expense of in-retailer research
that showed there were more thefts of them (Retailer B, 2015).
5. Police and criminal justice system
Depending upon whether the goal of the retailer is to deter theft or detect and
apprehend offenders, the response of criminal justice agencies (responsible for arrest,
prosecution, conviction and punishment) is important. This concerns not only the
decisions agencies take but also the speed with which they (and in particular the
police) react. This in turn feeds back into the tagging strategies adopted. One UK
retailer we interviewed remarked that it often took the police over an hour to come to
a shop if it reported that a suspected shoplifter had been detained. This created three
problems. First, detaining someone, if they are violent, creates risks for store
personnel. Second, at least two people are taken off the shop floor whilst the person is
held. Third, there could be no certainty that a person who was detained would
eventually be charged, prosecuted and convicted. For these reasons, the store elected
only to detain someone activating an alarm in extreme circumstances, that is when
they had provided a prior warning to the individual, when they had provided a visible
presence when that person was within a store (they had a high quality CCTV system),

33
and when nevertheless the person still carried goods that activated the alarm as they
left the shop. This happened infrequently.
IMPLEMENTATION
Problems of implementation are a common feature of crime prevention (Knutsson and
Clarke, 2006). In the context of this review, implementation refers to the practical task
of installing tags so as to optimise the conditions for them to work effectively. Put
differently, those actions that best ensure the context is sufficient to activate the
sought after preventive mechanisms. Of the 50 studies we identified, 36 mentioned
implementation issues and of those 29 contained detailed information on specific
aspects of implementation (see Appendix 11). In what follows this information is
organised into two main themes: staffing issues and choice of tagging strategy.
1. Staffing issues
Store staff clearly play an important role in the installation and management of tags.
Many of the aforementioned moderators of tag effectiveness relate to the decisions
and actions of staff. There were several examples of implementation failures that were
attributable to staffing problems. These included failure to correctly attach tags
(Farrington et al 1993), double tagging (Handford, 1994; Huber, 2006), or attaching
tags so that they cannot be easily removed (Bamfield, 1992; Beck, 2006; Beck and
Palmer, 2010). Moreover, studies found that tags were often not deactivated properly
(Handford, 1994; Beck, 2002) or that staff failed to react appropriately to activated
alarms (Baumer and Rosenbaum, 1984; Blackwood and Hayes, 2003). Maximising
the probability that tags are appropriately and consistently attached to items, that they
are properly removed or deactivated at point of sale, or that sounding alarms are
responded to – moderators of tag effectiveness related to implementation - was
generally considered to be influenced by the extent to which staff are adequately
trained, monitored and incentivised to participate in a tagging programme.

34
2. Tagging strategy
Decisions about the type of tag(s) to use are obviously dependent on cost (discussed
in Economics), store design and the items intended for tagging. In addition, retailers
must decide on an appropriate tagging strategy. This can take several forms:
• Source tagging vs. in-store tagging: As already mentioned, source tagging involves
a tag being incorporated into the label, fabric or packaging of a product at the point
of manufacture. Here, specialised staff or processes at point of manufacture can
ensure the proper application of tags rather than store staff, who have to be trained
and resourced to do so. Source tagging is thus often preferable to retailers since it
absolves them of tagging items in store. However, a major difficulty for source
tagging is that different manufactures (and retailers) often use different types of
tags (for e.g. AM vs. RF EAS tags), each requiring corresponding detection and
removal equipment (Beck, 2002). This is a particular problem for stores selling
products supplied by different manufacturers and potentially different tagging
systems. An alternative approach would require co-operation between producers
and retailers (who are often competitors) to incorporate the same kind of tag and
technology across all retail outlets of one store or across different stores.
Interviews with 12 retailers in the US, who collectively represented over 11,00
individual stores, suggested that the vast majority of tags are implemented in-store
as opposed to at source (Blackwood and Hayes, 2003).
• Universal tagging vs. fractional tagging: We have already seen in the Moderator
section how tag dosage is thought to affect offender perceptions. Yet how tags are
applied to products is also a practical decision. Universal tagging is time and
resource intensive and can be expensive. However, whether it is preferable to tag
fractionally or to tag selectively only some expensive or desirable products
depends on the type of merchandise being sold and on the risk of shop theft given
the shop’s location and type of clientele.
35
ECONOMICS
Thirty-two of the 50 studies (64%) contained economic information relating to
tagging. A narrative summary of relevant economic information is provided here,
both in terms of the cost and cost effectiveness of tagging. Despite the high
prevalence of economic information in these studies, regrettably, this information was
not sufficient to conduct a full economic evaluation (such as cost-benefit analysis).
We return to this point in the Discussion.
Cost of tagging
The cost of tags was found to vary widely across studies. Disposable RF EAS tags are
now available for as little as a penny each (Loebbecke and Palmer, 2006). EAS
reusable tags cost around 20-35p (Retailer D, 2015). The most expensive tags (in
terms of initial outlay) appear to be ink tags, which are designed to be reusable.
However, ink tags typically require less infrastructure and therefore have lower set-up
costs than EAS tags since they do not require electronic gates (DiLonardo and Clarke,
1996). It is noteworthy that recent developments in tagging that combine EAS and ink
capsules employ both the electronic gates of a traditional EAS system and the tag
detachers, thereby making it more expensive than an ink tag system alone. Variations
in cost were mostly attributed to the type of tag and their re-usability. As mentioned
previously, widespread adoption and technological advancements have significantly
reduced the cost of contemporary tagging (Chainlink, 2014).
Information on the costs of the wider EAS tag system (electronic gates at store
entrances and exits, de-tagging machinery, tag readers) received less coverage in the
studies we identified (n = 15). These studies all alluded to retailers having to account
for more than the costs of tags when deciding upon a system. For example, a large
retailer must implement the same system across many stores. Conversations with
retailers have suggested that £2,000 for a present-day de-tagging device would not be
uncommon, and stores will often have multiple de-tagging devices.
A further set of costs relate to employees, whether this is hiring new security guards
to monitor electronic gates, training existing staff to handle new tagging systems, or

36
the hours required to tag and de-tag products in store (if adopting this tagging
strategy). Studies from retailers suggest that these costs are keenly observed as part of
tagging trials, and form part of the consideration of the economic viability of different
tagging systems. Two trials conducted by major retailers, one of soft RF EAS tags on
CDs and another of magnetic tags on wallets, measured the amount of time in seconds
taken to apply and, in the latter case, remove the tags (Retailer A, 2015; Retailer D,
2015). These figures were then converted into an annual number of staff hours, giving
sophisticated monetary estimates which were then considered as part of the overall
performance of installed tags.
Economic returns associated with tagging
Considerations over the economic returns associated with tagging relate to the various
roles which tags are expected to play in retail environments including but not limited
to loss reduction (i.e. stock tracking and management). These wider benefits
consequent on tagging create complications when attempting to conduct a cost-benefit
analysis. There are numerous ways of calculating costs and benefits (as discussed in
more detail by Beck 2008 and Chainlink 2014), but cost-benefit analyses may be even
more important for small retailers where even low levels of shrinkage can have
significant negative effects on retailers’ profit margins (DiLonardo, 1996). Despite the
obvious importance of assessing cost-effectiveness, in their interviews with a
convenience sample of 12 US retailers, Blackwood and Hayes (2003) found only a
quarter reported carrying out routine assessments on the return on investment
following the installation of tags.
We have already mentioned the different types of tagging strategy available. The
tagging strategy employed by retailers has cost implications. One way in which
retailers may reduce their expenditure is to apply tags in their own supply chain (Beck,
personal communication). An additional approach is to work with a manufacturer
who tags items at source, rather than to apply tags in-store. However, this may lead to
the cost of tagging being forced upon manufacturers instead, many of whom may be
reluctant to absorb such costs (Chainlink, 2014). There are examples in the literature
of manufacturers being persuaded by large retailers to apply tags. Retailers use
various methods, including threats no longer to stock the product, promises of

37
increases in sales and shelf space, and offers to share the costs of tagging. Equally
important to note is that, if tags are effective, then if manufacturers agree to apply
them at source, a boost in sales should ensue, benefitting manufacturers and retailers
alike.
Tagging at source can also assist ‘fractional tagging’ and the sought-after ‘halo effect’
(or diffusion of benefits) of tagged items providing protection to non-tagged items.
The economic implications of such a ‘halo effect’ was quantified by one large retailer
who saw savings of tens of thousands of pounds in reduced shrinkage amongst similar
non-tagged items, which was included in the cost-benefit analysis of the tagging trial
(Retailer C, 2015). Another study found this effect moved to unrelated items within
the store (Masuda, 1997). This potential diffusion of benefits could be quantified by
researchers and used to rank some systems over others, by saving money and
increasing margins.
DISCUSSION
Tags are commonly used in retail environments, but their effectiveness as a theft
reduction measure has yet to be the subject of a systematic review. In this paper we
followed the EMMIE framework (Johnson, Bowers & Tilley, 2015) to review the
evidence as it relates to 1) whether tags are effective at reducing theft, 2) the causal
mechanisms through which tags are thought to work, 3) the contextual factors that
moderate tag effectiveness, 4) how tags are implemented in retail settings and 5) the
economics of tagging.
Following a systematic search of the published and unpublished literature, and
through consultation with retailers, we identified fifty studies that met our eligibility
criteria. Eight studies reported quantitative data and were assessed for information
concerning the effectiveness of tagging. On closer scrutiny, substantial variation in
the type of tag installed and how tag effectiveness was measured precluded a meta-
analysis. Concerns about selection bias were also noted since no study reported any
statistical analyses to determine the equivalence of action and control groups before
intervention. Drawing firm conclusions about the effectiveness of specific types of tag
is therefore challenging. For example, we found only one study on the effectiveness
38
of ink tags, and that dates back some twenty years (DiLonardo and Clarke, 1996).
Likewise with EAS tags, whilst several early studies converge on the finding that
tagging is effective (Farrington et al. 1993; Bamfield, 1994), evidence from a larger
and more recent study with a stronger research design found tagging to have no
noticeable impact (Hayes and Blackwood, 2006). Moreover, studies such as that by
Beck and Palmer (2010) speak more to the comparative effectiveness of different
forms of EAS tag (hard tags vs. soft tags) as opposed to the effectiveness of tagging
per se. Despite this variation, across the eight studies evidence does suggest that more
visible tags tend to be associated with greater reductions in shrinkage than less visible
tags.
The complexity of tagging was further elucidated through the realist branch of our
review, which examined a wider range of studies supplemented with interviews with
four retailers. It is clear that different types of tag are expected to produce reductions
in theft through different mechanisms, which in turn require contrasting conditions for
their activation (moderators), and which give rise to different implementation
challenges. EAS tags, for example, are widely assumed to reduce theft through
increasing the (perceived or actual) risk that offenders are apprehended. Activation of
these risk-enhancing mechanisms is in turn influenced by factors such as tag visibility
(did offenders spot the tag?), staff behaviour (did staff respond to the sounding
alarm?) and the type of shoplifter thought to operate in store (were offenders deterred
by the tagging system?). Ink tags, by contrast, are generally assumed to reduce theft
because of the inconvenience associated with removing the tag and the potential
release of indelible ink, thereby spoiling the product and making it harder to sell.
This variation in how different tags are expected to reduce theft also suggests that
pooling information across tag types (in, say, a meta-analysis) to generate an overall
conclusion is inappropriate.
It is noteworthy that we identified no high-quality published economic evaluations of
tagging (i.e. estimates on the direct and indirect economics costs and benefits of a
tagging strategy). Although economic analysis remains infrequent in the crime
prevention literature more generally (see Manning et al. 2015), its absence in the
context of this review is surprising given the high priority retailers place on cost
effectiveness. We suspect this lack of economic evaluation is a product of data

39
accessibility rather than data availability. Consultation with retailers in the UK as part
of this review indicated that economic data is available and that trials on the cost
effectiveness of tags are routinely undertaken, albeit that the results of such trials are
seldom made public for commercially sensitive reasons. However, it is difficult to
determine how representative such actions are since evidence from a convenience
sample of 12 US-based retailers suggests that robust cost-benefit analysis of tagging
remains infrequent (Blackwood and Hayes, 2003). Further research is needed to
determine the range of financial costs and outcomes associated with tagging, and how
these vary by tag type and product.
The issue of commercially sensitive data speaks to a broader methodological issue
encountered in this review, namely our decision to include information that is not
publically available. As described in our methods section, in conducting this review
we made efforts to involve retailers, some of whom agreed to take part in semi-
structured interviews and share internal (confidential) reports of tagging trials. The
information gleaned from these sources proved helpful in producing this report and
usefully provided a window on the priorities of retail decision makers, but it is
unlikely to be made publicly available. On one hand, including evidence that is
inaccessible to the research community for reasons of confidentiality goes against the
transparency and reproducibility that characterizes the systematic review process. On
the other hand, if the purpose of a systematic review is to locate and synthesise
relevant evidence so as to arrive at an informed judgment about the effectiveness and
appropriateness of, in this case, tagging, it might be considered remiss to exclude
information that speaks to that aim.
Implications for practice and research
Much has been written about the use of tags as a theft reduction measure, likely
reflecting their widespread use by retailers. We found that this literature helpfully
covers a wide range of tag-relevant topics, synthesized here according to the five
dimensions of EMMIE. There are, however, several important questions that are yet
to be adequately investigated. Addressing these knowledge gaps will most likely be
achieved through improved evaluations of tagging in retail environments, building on
the small number of evaluation studies we identified in this review.

40
One important topic that is currently understudied concerns crime displacement.
Product tagging is a form of situational crime prevention. Historically the main
criticism of situational crime prevention has been that any reductions in crime
associated with situational measures are undone by offenders shifting their activities
to different places and times that fall outside of the range of situational intervention.
Evidence to reject the hypothesis that displacement is an inexorable consequence of
situational measures is now overwhelming (Guerette and Bowers, 2009); indeed
positive diffusion of crime control benefits are repeatedly observed (Guerette and
Bowers, 2009; Clarke and Weisburd, 1994). Several studies we identified in this
review mentioned but did not empirically assess crime displacement and/or diffusion
of benefits associated with tagging (Farrington et al. 1993; Beck and Palmer, 2010).
Nor were sufficient data reported for displacement to be analysed retrospectively by
the review authors. The closest formal assessment was provided in two retailer reports
which sought to quantify the economic impact of “halo effects” on related but non-
tagged products (Retailer B, 2015; Retailer C, 2015).
In the context of tagging in retail environments, crime displacement/diffusion of
benefits could take several forms: 1) target displacement/ diffusion of benefits within
stores from tagged to non-tagged items, 2) spatial displacement/ diffusion of benefits
to nearby different stores and 3) spatial displacement/ diffusion of benefits to stores of
the same chain (where applicable) located elsewhere. This is an area where future
research might usefully be directed, not least because interviews with shoplifters
conducted by Giblin et al. (2015) revealed that a small proportion reportedly would
shoplift elsewhere when confronted by a credible tagging strategy.
Displacement usually refers to the actions of individual offenders in response to
situational measures. Adaptation refers to the longer-term process of populations of
offenders seeking to overcome situational measures (Clarke and Bowers, 2017).
When discussing offender adaptation, Ekblom (1999) famously characterises crime
prevention as an arms race. Efforts to prevent crime prompt adaptation among those
trying to commit it. The literature on retail crime alludes to several such arms races
(see, for example, Lasky, Fisher and Jacques, 2015) as offenders seek to circumvent
preventive measures. Likewise, the literature we reviewed here contained several
references to the many ways in which offenders tried to bypass or override tagging

41
systems (Handford, 1994; Farrington et al. 1993). Despite this, we identified little
evidence on the long-term effectiveness of tags. Addressing this gap is important in
light of the adaptive and innovative capacity of shop thieves in combination with the
aforementioned challenges of sustaining a tagging strategy where tags might variously
be dysfunctional, damaged or disappear. The longest study period of an evaluation
study we identified was twelve months post intervention (Beck and Palmer, 2010).
Future research might usefully investigate the sustainability of any preventive effects
associated with tagging, both to explore the scope for offender adaptation and the
practical task of maintaining an effective tag system over time.
Consistent with Sidebottom et al. (2017) in their EMMIE-informed review of alley
gating, we found scant empirical evidence relating to the mechanisms through which
an intervention (here tags) might plausibly reduce crime. Information in the primary
studies we identified was only suggestive of how tags might produce their effects.
Future evaluation studies might usefully collect data related to the expected signatures
(i.e. intermediate and ultimate outcome measures) associated with distinctive (and
rival) tag mechanisms (for a related discussion see Eck and Madensen, 2009;
Weisburd et al. 2015). Doing so would help judge which of the plausible mechanisms
are responsible for observed tag effects.
To this aim, Figure 2 presents a simple logic model denoting how EAS tags might
reduce theft, developed by the study authors based on the evidence we reviewed here.
To be clear, Figure 2 is indicative of just some of the ways in which EAS tags are
thought to work, it is not supported by empirical evidence. The key point is that logic
models such as this can usefully inform future tagging evaluations, signposting
potential opportunities for data collection on intermediate outcome measures. In this
example, a single tagging strategy is generating the same outcome – reductions in
theft – but doing so through different means, each of which produce distinctive
signatures which might be amenable to (primary) data collection. For example, if the
causal chain shown at the top of Figure 2 were in operation, then we would expect to
observe increases in alarm activations and the apprehension of thieves with tagged
goods that had not been paid for. Failure to observe these patterns would suggest that
some other mechanism is responsible for the observed effects. Take the causal chain
at the bottom of Figure 2. Here we see overall reductions in theft without any alarm

42
systems being activated. In this example, a strong evaluation would collect data on the
number of alarm activations – an intermediate outcome measure – following the
installation of EAS tags. Logic models such as that of Figure 2 can also help identify
the key moderators necessary for a mechanism to bring about the sought after
outcome. For example, returning to the causal chain at the top of Figure 2, reductions
in theft brought about through this mechanism is contingent on an operational alarm
system, a swift staff response, the capacity to apprehend and detain detected thieves,
and a police response. If these factors are not in place in a given context then it is less
likely that this particular mechanism will produce the desired outcome.
Figure 2: Illustrative logic model of how EAS tags might produce their effects
Finally, we reflect on our experience of using EMMIE as a framework for this review.
One challenge we encountered related to those topics that spanned numerous elements
of EMMIE. The type of tagging strategy is one example. The practical task of putting
tags on all or some items (universal vs. fractional) is clearly an implementation issue,
and one which is open to the familiar problems of error or mismanagement. Yet the
decision over which strategy to employ also has economic implications. Moreover,
the type of tagging strategy and the quality of its implementation can also act as
moderators that affect whether the causal mechanisms through which tags produce
their effects are or are not activated. This may be in combination with other
contextual factors such as the type of offender. Our decision to report information
according to the five elements of EMMIE has meant that information such as that
relevant to tagging strategies appears in multiple sections

43
CONCLUSION
Retailing is changing, as is the tagging technology available to try to reduce shop theft.
Examples include the following:
The switch to on-line shopping may mean fewer purchases in-store although
not necessarily fewer people going to stores.
Efforts to reduce staff costs in retailing have led to the introduction of self-
service checkouts, where the customer is responsible for scanning their own
purchases and paying for them, but the unintended consequence is also to
create new opportunities for theft.
Competition between suppliers of tags has incentivised technological
developments aiming to improve the performance of tags and persuade stores
to introduce them or switch the type of tag they use.
In these circumstances, although the specific findings of the effect sizes of old studies
in a different retailing environment using earlier forms of tagging may still have some
relevance, current retailers and their advisors need to be attentive to the specific
circumstances of the retail crime risks they are addressing. They need to work through
the specific ways in which they expect crime and sales to be affected by the tags being
contemplated and then to trial innovations in EMMIE terms systematically and
honestly, focusing on unintended as well as intended outcomes.

44
REFERENCES
Bamfield, J. (1994). Electronic article surveillance: Management learning in curbing
theft. In M. Gill (Ed.), Crime at work: Studies in security and crime prevention (pp.
155-173). Leicester, England: Perpetuity Press.
Bamfield, J. and Hollinger, R.C. (1996). Managing losses in the retail store: a
comparison of loss prevention activity in the United States and Great Britain. Security
Journal, 7:61-70.
Beck, A. (2002). Automatic product identification & shrinkage: Scoping the potential.
ECR Europe, Brussels.
Beck, A. (2006). Shrinkage and Radio Frequency Identification (RFID): Prospects,
Problems and Practicalities’, in M. Gill, (eds.) The Handbook of Security. Palgrave
MacMillan, Houndmills: Hampshire.
Beck, A. (2016a). Beyond Shrinkage: Introducing Total Retail Loss. Retail Industry
Leaders Association Report.
Beck, A. (2016b). Amplifying Risk in Retail Stores: The evidence to date on making
shop thieves think twice. ECR Community Shrinkage & On-shelf Availability Group.
Beck, A. and Palmer, W. (2010). The Importance of Visual Situational Cues and
Difficulty of Removal in Creating Deterrence: The Limitations of Electronic Article
Surveillance Source Tagging in the Retail Environment. Journal of Applied Security
Research, 6, 110–123.
Berwick, D. (2008). The science of improvement. Journal of the American Medical
Association, 299, 1182-1184.
Best, A., Greenhalgh, T., Lewis, S., Saul, J., Carroll, S. and Bitz, J. (2012) ‘Large
system transformation in health care: a realist review’. The Millbank Quarterly 90(3):
421-456.
Bickman, L., Rosenbaum, D. P., Baumer, T. L., Kudel, M. R., Christenholz, C.,
Knight, S. L., & Perkowitz, W. T. (1979). National evaluation program: Phase I.
Assessment of shoplifting and employee theft programs. Evanston, IL: Westinghouse
Evaluation Institute.
Bowers, K. and Johnson, S.D. (2017). Burglary prevention in practice. In: N. Tilley
and A. Sidebottom (ed.), Handbook of Crime Prevention and Community Safety (2nd
edition). Routledge.
Bowers, K., Tompson, L. and Johnson, S.D. (2014) Implementing information science
in policing: mapping the evidence base. Policing, Volume 8, Number 4, pp. 339–352.
Buckle, A. and Farrington, D. P. (1984). An Observational Study of Shoplifting.
British Journal of Criminology, 24:1, 63-73.

45
Capers, C. T. (2008). Effectiveness of situational crime prevention strategies to deter
organized retail theft (Doctoral dissertation, University of Phoenix).
Carmel-Gilfilen, C. (2011). Advancing Retail Security Design: Uncovering Shoplifter
Perceptions of the Physical Environment. Journal of Interior Design, 36:2, 21-38.
Clarke, R.V. (1997). Situational Crime Prevention: Successful Case Studies. (2nd ed.).
Albany, NY: Harrow and Heston.
Clarke, R.V. (1999). Hot Products: Understanding, Anticipating and Reducing
Demand for Stolen Goods. Police Research Series, Paper 112. London: Home Office.
Clarke, R. V. and Bowers, K. (2017). Seven misconceptions of situational crime
prevention. In: N. Tilley and A. Sidebottom (ed.), Handbook of Crime Prevention and
Community Safety (2nd
edition). Routledge.
Clarke, R.V. and D. Weisburd. (1994). ‘Diffusion of Crime Control Benefits:
Observations on the Reverse of Displacement’ In R.V. Clarke (ed.), Crime Prevention
Studies, Vol. 2, pp. 165-182. Monsey, N.Y.: Criminal Justice Press.
Dabney, D. A., Hollinger, R. C., & Dugan, L. (2004). Who actually steals? A study of
covertly observed shoplifters. Justice Quarterly, 21(4), 693-728.
Dalkin, S. M., Greenhalgh, J., Jones, D., Cunningham, B., & Lhussier, M. (2015).
What’s in a mechanism? Development of a key concept in realist evaluation.
Implementation Science, 10(1), 1.
Davidoff, F. (2009) ‘Heterogeneity is not always noise: lessons from improvement’,
Journal of the American Medical Association, 302(23), 2580-2586.
Dawson, S. (1993). Consumer responses to Electronic Article Surveillance Alarms.
Journal of Retailing, 69:3, 353-362.
DiLonardo, R. (1996). Defining and Measuring the Economic Benefit of Electronic
Article Surveillance. Security Journal, 7, 3-9.
DiLonardo, R. (2008). Electronic Article Surveillance, in Sennewald, C. A., &
Christman, J. H. (eds). Retail crime, security, and loss prevention: an encyclopedic
reference. Butterworth-Heinemann.
DiLonardo, R. (2015). Electronic Article Surveillance (EAS) Source Tagging: 20+
Years of Innovation. Accessed online December 9th
2015 at:
http://losspreventionmedia.com/insider/loss-prevention-technology/electronic-article-
surveillance-eas-source-tagging/
DiLonardo, R. and Clarke, R. (1996). Reducing the Rewards of Shoplifting: An
Evaluation of ink tags. Security Journal, 7, 11-14.

46
Downs, D., Hayes, R. and Tallman, C. (2011). Product Protection Research Project:
A3Tag Testing the Effectiveness of the A3Tag on Sales and Loss. Report produced by
the Loss Prevention Research Council.
Eck, J. E. (2017). Evaluation for lesson learning. In: N. Tilley and A. Sidebottom (ed.),
Handbook of Crime Prevention and Community Safety (2nd edition). Routledge
Eck, J. E. and Madensen, T. (2009) ‘Using signatures of opportunity structures to
examine mechanisms in crime prevention evaluations’, in J. Knutsson and N. Tilley
(eds.) Evaluating Crime Reduction Initiatives, Crime Prevention Studies, Vol. 24.
Monsey, NY: Criminal Justice Press.
Ekblom, P. (1999). Can we make crime prevention adaptive by learning from other
evolutionary struggles? Studies on Crime and Crime Prevention, 8, 27-51.
Farrington, D. P. (2003). Methodological quality standards for evaluation research.
The Annals of the American Academy of Political and Social Science, 587(1), 49–68.
Farrington, D. P., Bowen , S., Buckle, A., Burns-Howell, T., Burrows, J. and Speed,
M. (1993). An Experiment on the Prevention of Shoplifting, in R.V. Clarke, R.V.
(eds.) Crime Prevention Studies. Vol. 1, Monsey, NY: Willow Tree Press.
Gill, M., Bilby, C., & Turbin, V. (1999). Retail security: Understanding what deters
shop thieves. Journal of Security Administration, 22(1), 29. Global Retail Theft Barometer (2015). Global Retail Theft Barometer. Available
online at www.odesus.gr/images/nea/eidhseis/2015/3.Global-Retail-Theft-Barometer-
2015/GRTB%25202015_web.pdf+&cd=4&hl=en&ct=clnk&gl=uk&client=firefox-b
Guerette, R. T. and Bowers, K. (2009) ‘Assessing the extent of crime displacement
and diffusion of benefit: A systematic review of situational crime prevention
evaluations’, Criminology, 47(4) 1331-1368.
Handford, M. (1994). Electronic tagging in action: A case study in retailing, in M.
Gill, (eds.), Crime at work: Studies in security and crime prevention (pp. 174–184)
Leicester, England: Perpetuity Press.
Hayes, R. (1997). Shop Theft: An analysis of apprehended shoplifters. Security
Journal, 7:1, 11-14.
Hayes, R. (1999). Retail Theft Trends Report, Orlando, FL: Loss Prevention Solutions.
Hayes, R. (2007). Electronic Article Surveillance: Reviewing the Failures and
Successes of a Shoplifting Control Process. Report produced by the Loss Prevention
Research Council.
Hayes, R. and Blackwood, R. (2006). Evaluating the Effects of EAS on Product Sales
and Loss: Results of a Large-Scale Field Experiment. Security Journal, 19, 262-276.
47
Hickman, L. J., Davis, L. M., & Wells, E. (2010). Tracking Inmates and Locating
Staff with Active Radio-Frequency Identification (RFID): Early Lessons Learned in
One U.S. Correctional Facility. Santa Monica, CA: RAND Corporation.
Hopkins, M. and Gill, M. (2017). Business, crime and crime prevention: emerging
debates and future challenges. In: N. Tilley and A. Sidebottom (ed.), Handbook of
Crime Prevention and Community Safety (2nd
edition). Routledge.
Huber, N. (2006). Minimizing product shrinkage in the supply chain through the use
of radio-frequency identification: A case study on a major Australian retailer.
Johnson, S. D., Tilley, N., & Bowers, K. J. (2015). Introducing EMMIE: an evidence
rating scale to encourage mixed-method crime prevention synthesis reviews. Journal
of Experimental Criminology, 11(3), 459-473.
Jones, P., Clarke-Hill, C., Hillier, D., & Comfort, D. (2005). The benefits, challenges
and impacts of radio frequency identification technology (RFID) for retailers in the
UK. Marketing Intelligence & Planning, 23(4), 395-402.
Kastner, M., Perrier, L., Hamid, J. et al. (2015). Effectiveness of knowledge
translation tools addressing multiple high-burden chronic diseases affecting older
adults: protocol for a systematic review alongside a realist review. BMJ Open, 5.
Knutsson, J., & Clarke, R. V. (2006). Putting theory to work: Implementing
situational prevention and problem-oriented policing (Crime Prevention Studies, Vol.
20). Monsey, NY: Criminal Justice Press.
Lasky, N. V., Fisher, B.S. and Jacques, S. (2015). ‘Thinking thief’ in the crime
prevention arms race: lessons learned from shoplifters. Security Journal, advanced
access.
Lindblom, A. and Kajalo, S. (2011). The use and effectiveness of formal and informal
surveillance in reducing shoplifting: a survey in Sweden, Norway and Finland. The
International Review of Retail, Distribution and Consumer Research, 21:2, 111-128
Lottes, S. (1992). What's in Store with EAS. Security Management, pp:20A.
Manning, M., Johnson, S. D., Tilley, N., Wong, G. T., & Vorsina, M. (2015).
Economic Analysis and Efficiency in Policing, Criminal Justice and Crime Reduction:
What Works?. Palgrave Macmillan.
Meads, C., Nyssen, O.P., Wong, G. et al. (2015). Protocol for an HTA report: does
therapeutic writing help people with long-term conditions?’ Systematic review, realist
synthesis and economic modelling. BMJ Open, 4.
Mishra, D. and Mishra, A. (2010). Improving Baggage Tracking, Security and
Customer Services with RFID in the Airline Industry. Acta Polytechnica Hungarica,
139-154.
Pawson, R. (2006). Evidence-Based Policy. A Realist Perspective. London: Sage.
48
Pawson, R. and N. Tilley (1997). Realistic Evaluation. London, UK: Sage.
Petticrew, M., & Roberts, H. (2008). Systematic reviews in the social sciences: A
practical guide. John Wiley & Sons.
Sidebottom, A., Tompson, L., Thornton, A, Bullock, K., Tilley, N., Bowers, K. and
Johnson, S. D. (2017). Gating Alleys to Reduce Crime: A Meta-Analysis and Realist
Synthesis. Justice Quarterly. DOI:10.1080/07418825.2017.1293135
Tilley, N. (2016). EMMIE and engineering: What works as evidence to improve
decisions?. Evaluation, 22(3), 304-322.
van der Knaap, L. M., Leeuw, F. L., Bogaerts, S. and Nijssen, L. T. J (2008)
‘Combining Campbell standards and the Realist Evaluation Approach: The best of
two worlds?’ American Journal of Evaluation, 29(1), 48-57.
Weisburd, D., Hinkle, J. C., Braga, A. A., & Wooditch, A. (2015). Understanding the
Mechanisms Underlying Broken Windows Policing The Need for Evaluation
Evidence. Journal of Research in Crime and Delinquency, 52(4), 589-608.

49
APPENDICES
Appendix 1. Keyword search terms for electronic databases
We used the following terms when searching the electronic databases. Where
necessary, search terms were adapted to suit the requirements of particular databases:
TITLE-ABS-KEY (shoplift* OR ((shop OR store OR retail OR customer OR
employee ) W/5 ( loss* OR shrinkage OR crim* OR theft OR steal OR stolen) ) AND
( tag* OR eas OR "Electronic theft control system*" OR "Electronic article
surveillance" OR "Electronic asset surveillance" OR "Acousto-Magnetic" OR "radio
frequency") )
Searches were conducted on 23rd
September 2015.
Appendix 2: Electronic and grey literature databases searched in this review
1) ASSIA (Applied Social Sciences Index and Abstracts)
2) Criminal Justice Abstracts
3) Criminal Justice Periodicals
4) ERIC (Education Resources Information Center)
5) IBSS (International Bibliography of Social Sciences)
6) NCJRS (National Criminal Justice Reference Service)
7) ProQuest theses and dissertations
8) PsycINFO
9) PsycEXTRA
10) SCOPUS
11) Social Policy and Practice
12) Sociological Abstracts
13) Web of Science
14) CINCH (Australian Criminology Database)
Appendix 3: Retail journals searched in this review
International Journal of Retail & Distribution Management
International Review of Retail, Distribution and Consumer Research
Journal of Retail and Leisure Property
Journal of Business and Retail Management Research
European Retail Research
Journal of Applied Security Research
Security Journal
Journal of Retailing
Journal of Retailing and Consumer Services
Retail Security and Loss Prevention
Retailing in Emerging Markets: A Policy and Strategy Perspective

50
Appendix 4: Keyword search terms for ‘other sources’ searched in this review
We used the following terms when searching the ‘other sources’ listed below:
1. Anti-theft tags
2. Anti-Theft solution*
3. Source-tagging
4. EAS tags
5. Ink tags
6. Electronic Article Surveillance
7. Radio Tags
Appendix 5: Other sources searched in this review
In collaboration with an information specialist (Phyllis Schultze, Rutgers University)
we searched the publications of the following government, research and professional
agencies:
1) Center for Problem-Oriented Policing (Tilley and Goldstein Award entries)
2) Institute for Law and Justice
3) Vera Institute for Justice (crime and victimization publications)
4) Rand Corporation (public safety publications)
5) Police Foundation
6) Police Executive Research Forum
7) The Campbell Collaboration reviews and protocols
8) Urban Institute
9) European Crime Prevention Network
10) Swedish National Council for Crime Prevention
11) UK Home Office
12) UK College of Policing (Polka)
13) Australian Institute of Criminology
14) Swedish Police Service
15) Norwegian Ministry of Justice
16) Canadian Police College
17) Finnish Police (Polsi)
18) Danish National Police (Politi)
19) The Netherlands Police (Politie)
20) New Zealand Police
21) US National Institute of Justice
We also searched:
1) Google
2) Google Scholar
3) Academic Search Premier (EBSC)
4) ProQuest Sociology
5) Rutgers Criminal Justice Grey Literature Database
6) OSCE Polis Digital Library
7) WorldCat

51
Appendix 6: Experts consulted in this review
Joshua Bamfield, Adrian Beck, Robert DiLonardo, Martin Gill and Read Hayes.
Appendix 7: Copy of e-letter sent to retailers by the Metropolitan Police Service
Business Crime Hub
Dear Business colleague,
The MPS Business Crime Hub would be grateful for your assistance with a piece of
important crime reduction research on behalf of the College of Policing which is
being led by Dr Aiden Sidebottom – Department of Security and Crime Science -
University College London.
Researchers from University College London (UCL) are conducting a review on the
effectiveness of security tagging (broadly defined) as a means of preventing retail
theft. The aim is to determine what is known about how and where security tagging
can be used effectively to prevent retail theft, findings which clearly will be of
relevance to retailers and the police. This research is jointly funded by a major UK
Research Council the College of Policing supporting the What Works Centre for
Crime Reduction.
The UCL team is currently assembling the available evidence on whether tagging
items has been effective as a method of reducing theft. The more evidence they
assemble, the greater the confidence that can be placed in the overall findings. To that
aim, they are keen to hear from retailers who have undertaken trials to establish the
effectiveness of tagging items, mindful that the findings of such trails may not have
been published. The hope is that any relevant findings can be incorporated into the
overall analysis.
Please be reassured that information received from businesses will be kept in
confidence - Names of specific retailers or products will not be mentioned in any
outputs of this review and Dr Sidebottom would be happy to sign an agreement to this
effect.
The Business Crime Hub strongly supports this research. We therefore ask those who
are aware of any trials of the effectiveness of product tags or if you are willing to
assist in this research, might kindly contact Dr Aiden Sidebottom at UCL who is
leading this review.
For more information please find attached a copy of the review protocol, which sets
out in greater detail the aims and methods of the project, or feel free to contact Dr
Sidebottom directly.

52
Appendix 8: Information extracted from included studies
1. Study details (title, year, author(s), publication status, study location(s))
2. Type of tag in study (e.g. RFID, ink, magnetic, visible vs. invisible)
3. Total number of tags fitted (intensity)
4. Proportion of merchandise tagged
5. Type of merchandise tagged
6. Where the tags were implemented (at source or in-store?)
7. Type of retail environment (department store; supermarket; warehouse
retailers; speciality retailers; convenience retailers; discounter retailer)
8. Details on retail environment (size of store, products sold, location, crime
history)
9. Unit of analysis (e.g. store, chain of stores)
10. Research design (RCT, quasi-experimental)
11. Description of comparison group, place or period
12. Sample (size and any notable features)
13. Statistical test(s) used
14. Outcome measure reported and data source
15. Other interventions implemented over the study period including routine
security practices - for example the employment of private security guards.
16. Indirect effects (displacement and/or diffusion of crime control benefits)
17. Information concerning the possible mechanisms through which tags could
reduce theft
18. Information concerning the possible moderators that influence tag
effectiveness
19. Information concerning the implementation of tags
20. Financial costs and benefits of tags as a theft prevention measure
21. Conclusions of the author(s)

53
Appendix 9: Studies included in this review
Study author(s) Study title Date
Addis, K., Arbetter, L., Murphy, J. Better red than stolen 1993
Addis, K., Arbetter, L., Harowitz, S.,
Murphy, J., Wilson, C. Going to market 1993
Anonymous Small tags protect big stores 1982
Bamfield, J. EAS: management learning in curbing theft 1997
Bamfield, J. Changing Retail, Changing Loss Prevention c.2012
Bamfield, J.
Beating the Thief: A Retailer’s Guide to Electronic Article
Surveillance 1992
Barua, A., Mani, D., Whinston, A.
Assessing the Financial impacts of RFID Technologies on
the Retail and Healthcare Sectors 2008
Baumer, T. and Rosenbaum, D. Combating Retail Theft: Programs and Strategies 1984
Beck, A. and Palmer, W.
The Importance of Visual Situational Cues and Difficulty
of Removal in Creating Deterrence: The Limitations of
Electronic Article Surveillance Source Tagging in the
Retail Environment 2010
Beck, A.
Automatic Product Identification & Shrinkage: Scoping
the Potential 2002
Beck, A.
The Emperor Has No Clothes: What Future Role for
Technology in Reducing Retail Shrinkage? 2007
Beck, A.
Preventing Retail Shrinkage: Measuring the ‘Value’ of
CCTV, EAS and Data Mining Tools 2008
Beck, A.
Shrinkage and RFID: prospects, problems and
practicalities 2006
Bender, W. Playing tag is serious business. Security Management 1997
Bickman, L., Rosenbaum, D., Baumer,
T., Kudel, M., Christenholz, C.,
Knight, S., Perkowitz, W., Everett, M.,
Smith-Bickman, L.
National Evaluation Program - Phase I Assessment of
Shoplifting and Employee Theft Programs - Summary
Report 1980
Blackwood, R. and Hayes, R. EAS Retail Theft Protection Systems: An Issue Update 2003
Blackwood, R. and Hayes, R.
Shoplifting Solutions Survey
2006 RILA Loss Prevention Conference Survey 2006
Capers, C.
Effectiveness of situational crime prevention strategies to
deter organized retail theft 2008

54
Carmel-Gilfilen, C.
Bridging security and good design: Understanding
perceptions of expert and novice shoplifters 2013
ChainLink Research
The ROI for RFID in Retail: Use Cases Driving the
Current Surge in RFID Adoption 2014
Conrad, A. 'Smart' apparel 1996
Dawson, S.
Consumer responses to electronic article surveillance
alarms 1993
Dilonardo, R.
Defining and measuring the economic benefit of electronic
article assessment 1996
Dilonardo, R. and Clarke, R.
Reducing the rewards of shoplifting: an evaluation of ink
tags 1996
DiLonardo, R. Electronic article surveillance 2008
Downs, D., Hayes, R. and Tallman, C.
Product Protection Research Project: A3Tag – Testing the
Effectivenss of the A3Tag on Sales and Loss 2011
Farrington, D., Bowen, S., Buckle, A.,
Burns-Howell, T., Burrows, J., Speed,
M. An Experiment on the Prevention of Shoplifting 1993
Giblin, M.B., Grottini, K. and Hayes,
R. Discount Apparel Mix Tag Offender Interview Report 2015
Gill, M., Bilby, C., Turbin, V. Retail Security: Understanding What Deters Shop Thieves. 1999
Gohil, M. and Trikha, M.
RFID Used for Anti-Theft in Shopping Malls: A Research
Survey 2013
Gorshe, M., Rollman, M., Beverly, R. Item-level RFID: A Competitive Differentiator 2012
Handford, M. Electronic tagging in action: a case study in retailing 1994
Hayes, R. and Blackwood, R.
Evaluating the Effects of EAS on Product Sales and Loss:
Results of a Large-Scale Field Experiment 2006
Hayes, R. Tailoring Security to Fit the Criminal 1999
Hayes, R. Retail Crime Control: An Operational Strategy Unknown
Hayes, R. and Cordone, C. Shoptheft 2006
Huber, N.
Minimizing product shrinkage in the supply chain through
the use of radio-frequency identification: A case study on
a major Australian retailer 2006
Jones, P., Clarke-Hill, C., Hillier, D.,
Comfort, D.
The benefits, challenges and impacts of radio frequency
identification technology (RFID) for retailers in the UK 2005
Klein, F. The World's Largest Cookie Jar 1982

55
Lindblom, A., Kajalo, S.
The use and effectiveness of formal and informal
surveillance in reducing shoplifting: A survey in Sweden,
Norway and Finland 2011
Loebbecke, C. and Palmer, J.
A Real-World Pilot of RFID along the Fashion Industry:
Kaufhof and Gerry Weber in Germany. 2006
Longmore-Etheridge, A. The evolution of EAS 1998
Lottes, S. What's in Store with EAS 1992
Masuda, B
Reduction of Employee Theft in a Retail Environment:
Displacement vs Diffusion of Benefits 1997
Patton, J.
RFID as electronic article surveillance: Feasibility
assessment 2008
Sensormatic
Electronic Article Surveillance: A Technology
Comparison Unknown
Retailer A, 2015 Soft tagging CDs trial 2015
Retailer B, 2015 Alcohol RF tagging 2015
Retailer C, 2015 Meat, Fish & Poultry RF Tagging 2015
Retailer D, 2015 Wallets trial 2015
Appendix 10: Narrative review of the seven studies included in Effect section
Electronic Article Surveillance: management learning in curbing theft - Bamfield
(1994)
Bamfield describes an evaluation of a pilot trial of EAS hard tags in a (predominantly)
clothing and textiles chain retailer in the North and Midlands of England. The four
treatment stores were selected on the strength of their managers’ plan for
implementing and monitoring the intervention. The (single) control store was chosen
to be similar in location, size and turnover to one of the four treatment stores. Hard
tags were implemented for six months, with security guards and detector gates
installed at the sole entrance/exit point. 90 per cent of merchandise was tagged with
hard tags (with complete coverage for each product line). Merchandise under £5 and
‘hard’ goods, such as music cassettes, were not tagged. Bamfield presents changes in
shrinkage rates alongside qualitative information on levels of in-store aggression and
violence over the intervention period, how the EAS tags were perceived by the retailer,
whether displacement occurred, and the cost-effectiveness of the tags.
The Importance of Visual Situational Cues and Difficulty of Removal in Creating
Deterrence: The Limitations of Electronic Article Surveillance Source Tagging in
the Retail Environment - Beck and Palmer (2010)
The experiment reported by Beck and Palmer concerned the effect of a retailer
switching from using ‘hard’ tags applied in store by staff (e.g. EAS) to source-applied
‘soft’ tags (acousto-magnetic technology). The U.S. retailer sold clothing, fragrance
and belts and had a countrywide presence. The study, conducted from January 2006

56
to September 2007, trialled soft tags being sewn into garments during the
manufacturing process in 355 stores of one branded outlet. Two other branded outlets,
comprising 540 stores similar in size and location, acted as the control group.
Additional staff and CCTV were provided in experimental stores deemed to be most
at risk of shrinkage. The proportion of shrinkage was compared across experimental
and control stores for six data capture points at four-month intervals. When it became
apparent that shrinkage was increasing markedly in the experimental group, the
retailer reintroduced hard tags. Beck and Palmer identified that the number of alarm
activations rose considerably in experimental stores during the trial, and staff were
less likely to respond in the wake of so many alarms being activated. Employee theft
was also believed to have increased during the trial period.
Reducing the rewards of shoplifting: An evaluation of ink tags - DiLonardo and
Clarke (1996)
The two small case studies presented by DiLonardo and Clarke evaluate the
implementation of ink tags in a large chain of women’s clothing stores with different
branded outlets. The first involved 14 newly-opened, and geographically dispersed,
stores whereby ink tags were installed as standard from opening. Physical inventories
of stock were undertaken in the first year of opening and compared against the other
stores in the chain. The second case study concerned the replacement of EAS with
ink tags in four stores with the highest shrinkage rates.
Product Protection Research Project: A3Tag – Testing the Effectivenss of the
A3Tag on Sales and Loss – Downs, Hayes and Tallman (2011).
Using data from a large department chain in the US, this study assessed changes in the
shrinkage and sales of jeans following the installation of a new type of EAS tag
known as the A3Tag. Six studies participated in this study. In two stores, a beige
version of the new A3tag was installed. In a third store a red version of the A3tag was
installed, and three stores acted as control sites in which existing EAS tags were in
place. Downs et al. report that overall there was little difference in shrinkage and sales
rates in the treatment stores compared to the control stores (both saw increases in
shrinkage). However, when examining the effectiveness of the different type of
A3Tag in isolation, it was found that the more visible red tag was associated with
reductions in shrinkage and increases in sales compared to the control store (a positive
outcome). For the beige A3tag the reverse was true (increases in shrinkage and
decreases in sales – a negative outcome, but one that mirrored the trend in control
stores, possibly due to a seasonal effect). This difference in effectiveness was mainly
attributed to the increased visibility of the red tags. Interviews with a sample of
customers and employees indicated that the new type of tag was generally well
received.
An experiment on the prevention of shoplifting – Farrington et al. (1996)
Farrington and colleagues describe an experiment to evaluate the effectiveness of
EAS tags, store redesign and security guards in a U.K. electrical and electronics
retailer, across two branded outlets. A previous study by the authors had measured
the shoplifting rates at twenty-nine stores across the U.K. with management trainees

57
performing the repeated, systematic counting of items on store shelves. The ten stores
with the highest shoplifting rates were chosen for the study; but the attrition of one
store (due to heavy snow) reduced this number to nine. Comparable stores were
assigned into four treatment groups, with three of these groups containing a control
store. The other treatment group compared tags with store redesign. Staff were
trained in the measurement technique used previously by the authors, with visits post-
treatment to check that this was effectively undertaken. Audiotapes, videotapes, films,
headphones and small domestic appliances were the product lines under scrutiny, and
these were counted for a four-day period both pre- and post-intervention. Items were
also counted at a follow-up stage, but the intervening time varied across stores.
Evaluating the Effects of EAS on Product Sales and Loss: Results of a Large-Scale
Field Experiment – Hayes and Blackwood (2006)
Hayes and Blackwood studied the effect of concealed source-tagged EAS on personal
grooming products in a retailer across several regions of the U.S. A purposeful sample
of twenty-one stores with typical shrinkage rates for the company served as the
treatment group. Two treatment conditions were tested - the proportion of goods
tagged (50 per cent or 100 per cent) and whether there were tag detection gates
installed. The outcomes investigated included item losses, shelf availability and store
sales and data were collected using multiple methods, for example; weekly item
counts; weekly sales; store shipments and store-level adjustments. Over 2,600 hours
of CCTV video data were also used to observe the staff and customer response to
EAS alarm activation.
Trial of radio-frequency tags on CDs– Retailer A (2015)
This eight-week trial to introduce soft radio-frequency tags was conducted at a
national, large U.K. retailer, who had identified that shrinkage for CDs equated to
0.91 per cent of sales. Existing safer-casing CDs (with a large transparent box around
the product) were deemed unattractive and time-consuming for staff to remove at the
point-of-sale. 20 stores were identified to receive the new ‘soft’ tags; 60 stores with
similar average yearly sales, shrinkage and product ranges were selected as the
control stores. A questionnaire was sent to the test stores – of which 14 responded –
to collect feedback on the implementation of the new tags.
Trial of radio-frequency tags on meat products – Retailer B (2015)
This trial was conducted at a national, large U.K. retailer, who had identified that
shrinkage for meat, fish and poultry products equated to 1.22 per cent of sales. Radio-
frequency (RF) source tags were introduced (in a phased manner) in 2015 for 62
specific red meat product lines. A group of similar, but untagged, products acted as
the control. Economic data on the costs of tags and the staff time to apply the tags
were presented, and the savings to the business were calculated based on projected
shrinkage rates.

58
Mechanism Moderator Implementation Economics
Study author Year Risk Reward Effort Staff/shop Offender
type
Tagging
strategy
Item
type
Police &
CJS
Staff Tagging
Strategy
Cost of
tagging
Economic
returns
Addis et al 1993a X X
Addis et al 1993b
Anon 1982 X X X
Bamfield 1997 X X X X X
Bamfield 2012 X X
Bamfield 1992 X X X X X X X
Barua et al. 2008 X X
Baumer &
Rosenbaum
1984 X X X
Beck & Palmer 2010 X X X X
Beck 2002 X X X X X X
Beck 2007 X
Beck 2008 X X X X X
Beck 2006 X X X X
Bender 1997 X X X X X X X X
Bickman et al. 1980 X X X X
Blackwood, R.
and Hayes, R.
2003 X X X X X X X
Blackwood, R.
and Hayes, R.
2006 X X
Capers, C. 2008 X X
Carmel-
Gilfilen, C.
2013 X X
ChainLink 2014 X X X
Conrad, A. 1996 X X
Dawson, S. 1993 X X
Dilonardo, R. 1996 X X X
Dilonardo & 1996 X X X

59
Clarke
DiLonardo, R. 2008 X X X
Downs, D.,
Hayes, R. and
Tallman, C.
2011 X X X
Farrington et al 1993 X X X X
Giblin, M.B.,
Grottini, K. and
Hayes, R.
2015 X X X
Gill, Bilby &
Turbin
1999 X X X X X
Gohil &Trikha 2013 X
Gorshe et al 2012
Handford, M. 1994 X X X
Hayes &
Blackwood
2006 X X X X
Hayes 1999 X
Hayes
Unkno
wn
X X X X X
Hayes &
Cordone
2006 X X
Huber 2006 X X X X X
Jones et al 2005 X X X X
Klein 1982 X X
Lindblom &
Kajalo
2011 X X
Loebbecke &
Palmer
2006 X
Longmore-
Etheridge
1998 X X X X
Lottes 1992 X X X X
Masuda 1997 X X X X X
Patton, 2008 X
Sensormatic
Unkno
wn
X X
Retailer A 2015 X X

60
Appendix 11: Summary of information relevant to Mechanisms, Moderators, Implementation and Economics reported in eligible
studies
Retailer B 2015 X X X
Retailer C 2015 X X
Retailer D 2015 X

61
ENDNOTES
i This cost included theft by employees and the cost of fraudulent suppliers, as well as shoplifting and the cost of loss prevention systems.
ii Tags are not used solely for the purposes of theft reduction, however. They are also implemented for the purposes of product authentication (to detect counterfeit items) and
as a means of assisting supply chain management. Nor is their use limited to retail environments. EAS tags are used in airports to track the movement of baggage (Mishra and
Mishra, 2010), in hospitals to track new-borns and elderly patients and in prisons to monitor inmates (Hickman et al. 2010). iii
All retail-related journals were found to be covered by the two multidisciplinary databases (SCOPUS and Web of Knowledge). iv These are Police Practice and Research: An International Journal and Policing: a Journal of Policy and Practice.
v Due to limited resources, we confined our forward and backward citation searches only to these (Effect) studies.
vi Bottle tags are also assumed to work through this mechanism. These refer to hard tags that are placed over the neck of bottled products (typically alcoholic beverages).
Failure to correctly remove the tag causes the bottle to break.