what works clearinghouse u.s. department o … · what works clearinghouse u.s. department o...
TRANSCRIPT

Check & Connect Updated May 2015 Page 1
What Works Clearinghouse™ U.S. DEPARTMENT OF EDUCATION
WWC Intervention ReportA summary of findings from a systematic review of the evidence
Dropout Prevention Updated May 2015
Check & ConnectProgram Description1
Check & Connect is an intervention to reduce dropping out of school. It is based on monitoring of school performance, mentoring, case management, and other supports. The “Check” component is designed to continually monitor student performance and progress. The “Connect” component involves program staff giving individual-ized attention to students in partnership with other school staff, family members, and community service organizations. Students enrolled in Check & Connect are assigned a “monitor” who regularly reviews information on attendance, behavior, or academic problems and intervenes when problems are identified. The monitor also advocates for students, coordinates services, provides ongoing feedback and encouragement, and emphasizes the importance of staying in school.
Research2
The What Works Clearinghouse (WWC) identified two studies of Check & Connect that both fall within the scope of the Dropout Prevention topic area and meet WWC group design standards. Two studies meet WWC group design standards without reservations. Together, these studies included 238 students who attended Min-neapolis high schools and entered the program in the beginning of ninth grade. These two studies include students that receive special education services for a learning, emotional, or behavioral disability.
The WWC considers the extent of evidence for Check & Connect on high school students with learning, behavioral, or emotional disabilities who are at risk of dropping out to be small for three outcome domains—staying in school, progressing in school, and completing school. (See the Effective-ness Summary on p. 5 for more details of effectiveness by domain.) While these two studies that meet WWC group design standards without reservations include students who receive special education services, the program struc-ture does not require that participants receive special education services.3
EffectivenessCheck & Connect was found to have positive effects on staying in school, potentially positive effects on progress-ing in school, and no discernible effects on completing school for high school students with learning, behavioral, or emotional disabilities.
Report Contents
Overview p. 1
Program Information p. 3
Research Summary p. 4
Effectiveness Summary p. 5
References p. 7
Research Details for Each Study p. 9
Outcome Measures for Each Domain p. 11
Findings Included in the Rating for Each Outcome Domain p. 12
Supplemental Findings for Each Outcome Domain p. 15
Endnotes p. 17
Rating Criteria p. 18
Glossary of Terms p. 19
This intervention report presents findings from a systematic review of Check & Connect conducted using the WWC
Procedures and Standards Handbook, version 3.0, and Dropout Prevention
review protocol, version 3.0.

Check & Connect Updated May 2015 Page 2
WWC Intervention Report
Table 1. Summary of findings4
Improvement index (percentile points)
Outcome domainRating of
effectiveness Average RangeNumber of
studiesNumber of students
Extent ofevidence
Staying in school Positive effects +25 +18 to +31 2 238 Small
Progressing in school Potentially positive effects
+30 na 1 92 Small
Completing school No discernible effects
+1 na 1 144 Small
na = not applicable

Check & Connect Updated May 2015 Page 3
Program Information
3
WWC Intervention Report
BackgroundCheck & Connect was developed by the Institute on Community Integration at the University of Minnesota. More information and additional references to research about the program can be found at http://ici.umn.edu/checkandconnect or by sending an email to [email protected].
Program detailsCheck & Connect has two main components: “Check” and “Connect.” The Check component is designed to continually monitor student performance and progress (including the student’s attendance, incidence of suspen-sions, course grades, and credits). The Connect component involves program staff giving individualized attention to students, in partnership with other school staff, family members, and community service organizations. The components are implemented by the Check & Connect “monitor,” who functions as the student’s mentor and case worker. Monitors provide basic intervention for all students on their caseload, as well as intensive intervention for students as needed. Basic interventions involve regular structured discussions between the monitor and student—at least weekly for elementary and middle school students and twice a month for high school students—about their progress in school and about how to resolve conflicts and cope with challenges. Intensive interventions are tailored to the specific circumstances of students and their families and the available resources of the school and program. Intensive interventions focus on problem solving (including mediation and social skills development), academic support (through homework assistance, schedule changes, and tutoring), and recreational and community service activities. The program also focuses on family outreach, with monitors expected to have frequent contact with family members. Monitors can be graduate students or community members with training in human services fields. Program coordinators, who supervise monitors, can be teachers or school psychologists.
Cost5
Program developers report that implementing Check & Connect in secondary schools cost about $1,400 a student per year in the 2001–02 school year. More recent cost information was not available at the time of this report.

Check & Connect Updated May 2015 Page 4
Research Summary
WWC Intervention Report
The WWC identified three eligible studies that investigated the effects of Check & Connect on staying in school, progressing in school, and completing school for students who attend middle school, junior high school, or high school, and are at risk of dropout, or who have dropped out of school. An additional 10 studies were identified but do not meet WWC eligibility criteria for review in this topic area. Citations for all 13 studies are in the References section, which begins on p. 7.
The WWC reviewed three eligible studies against group design standards. Two studies (Sinclair, Christenson, Evelo, & Hurley, 1998; Sinclair, Christenson, & Thurlow, 2005) are randomized controlled trials that meet WWC group design standards without reservations. Those two studies are summarized in this report. One study does not meet WWC group design standards.
Table 2. Scope of reviewed research
Grade 9–12
Delivery method Individual
Program type Practice
Summary of studies meeting WWC group design standards without reservationsSinclair et al. (1998) conducted a randomized controlled trial that examined the effects of Check & Connect on 94 high school students in Minneapolis with learning, emotional, or behavioral disabilities during the 1994–95 school year. Students were randomly assigned at the beginning of ninth grade, with 47 students assigned to the inter-vention group and 47 students assigned to the comparison group. In this study, both intervention and compari-son group students received Check & Connect services in seventh and eighth grade, but only intervention group students continued to receive these services in ninth grade. Student outcomes were assessed at the end of ninth grade for the entire baseline sample of 94 students.6
Sinclair et al. (2005) conducted a randomized controlled trial with an analytic sample that included 144 ninth-grade students from Minneapolis public schools with emotional or behavioral disabilities, including 71 students randomly assigned to the intervention group and 73 students randomly assigned to the comparison group. In this study, intervention group students received Check & Connect services throughout high school, while the comparison group received no Check & Connect services. Student outcomes related to dropout status and high school comple-tion were assessed following the students’ fourth year in high school.
Summary of studies meeting WWC group design standards with reservationsNo studies of Check & Connect met WWC group design standards with reservations.
Check & Connect Updated May 2015 Page 5
Effectiveness Summary
WWC Intervention Report
The WWC review of Check & Connect for the Dropout Prevention topic area includes student outcomes in three domains: staying in school, progressing in school, and completing school. The two studies of Check & Connect that meet WWC group design standards reported findings in all three of these domains. The findings below present the authors’ estimates and WWC-calculated estimates of the size and statistical significance of the effects of Check & Connect on students who attend high school, have learning, behavioral, or emotional disabilities, and are at risk of dropout. For a more detailed description of the rating of effectiveness and extent of evidence criteria, see the WWC Rating Criteria on p. 18.
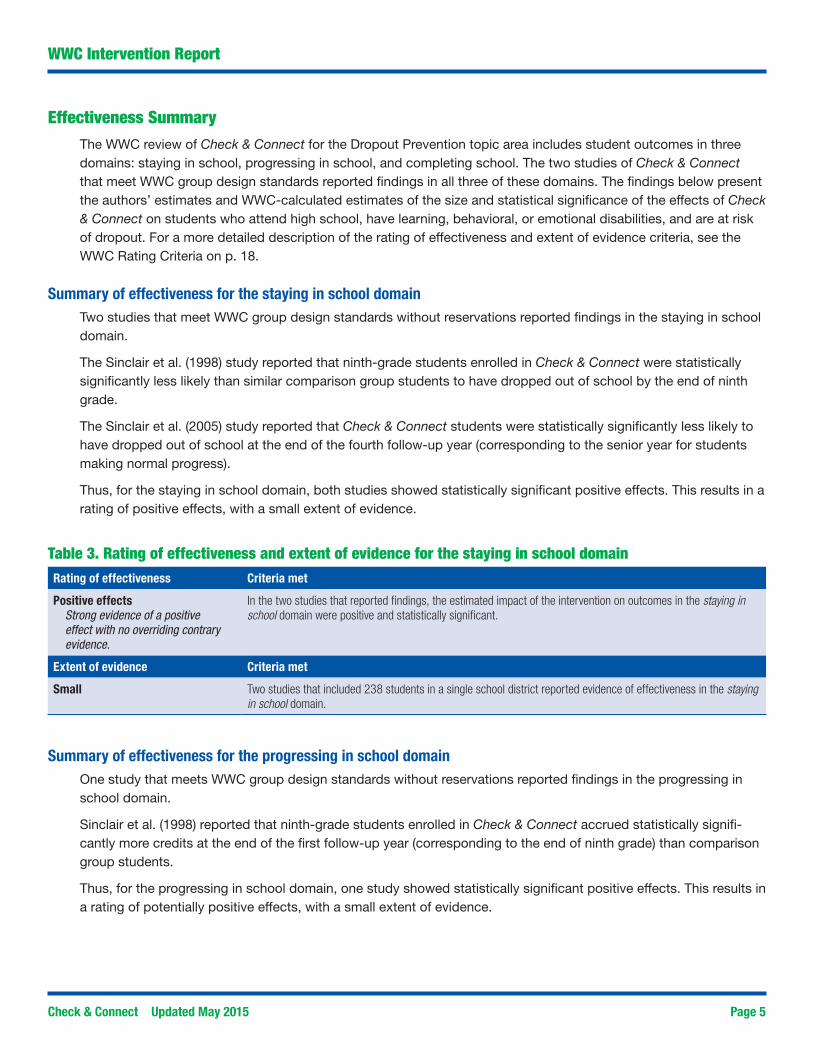
Summary of effectiveness for the staying in school domainTwo studies that meet WWC group design standards without reservations reported findings in the staying in school domain.
The Sinclair et al. (1998) study reported that ninth-grade students enrolled in Check & Connect were statistically significantly less likely than similar comparison group students to have dropped out of school by the end of ninth grade.
The Sinclair et al. (2005) study reported that Check & Connect students were statistically significantly less likely tohave dropped out of school at the end of the fourth follow-up year (corresponding to the senior year for students making normal progress).
Thus, for the staying in school domain, both studies showed statistically significant positive effects. This results in a rating of positive effects, with a small extent of evidence.
Table 3. Rating of effectiveness and extent of evidence for the staying in school domainRating of effectiveness Criteria met
Positive effectsStrong evidence of a positive effect with no overriding contrary evidence.
In the two studies that reported findings, the estimated impact of the intervention on outcomes in the staying in school domain were positive and statistically significant.
Extent of evidence Criteria met
Small Two studies that included 238 students in a single school district reported evidence of effectiveness in the staying in school domain.
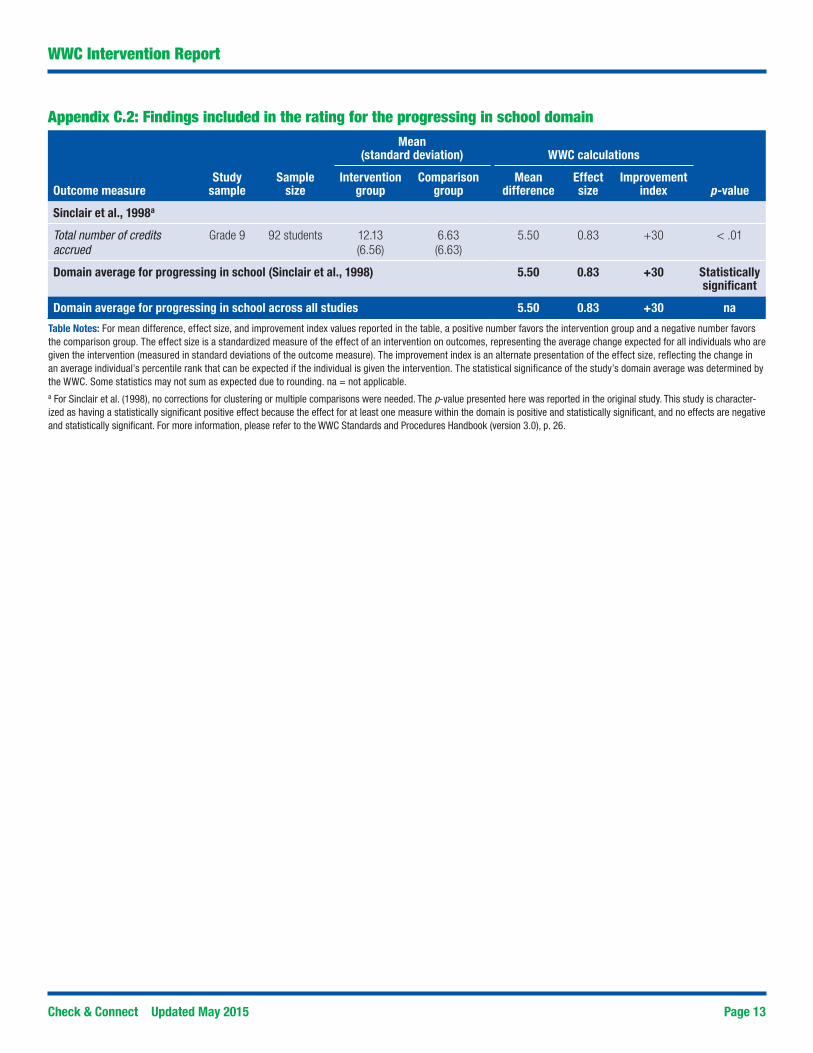
Summary of effectiveness for the progressing in school domainOne study that meets WWC group design standards without reservations reported findings in the progressing in school domain.
Sinclair et al. (1998) reported that ninth-grade students enrolled in Check & Connect accrued statistically signifi-cantly more credits at the end of the first follow-up year (corresponding to the end of ninth grade) than comparison group students.
Thus, for the progressing in school domain, one study showed statistically significant positive effects. This results in a rating of potentially positive effects, with a small extent of evidence.

Check & Connect Updated May 2015 Page 6
WWC Intervention Report
Table 4. Rating of effectiveness and extent of evidence for the progressing in school domainRating of effectiveness Criteria met
Potentially positive effectsEvidence of a positive effect with no overriding contrary evidence.
In the one study that reported findings, the estimated impact of the intervention on outcomes in the progressing in school domain was positive and statistically significant.
Extent of evidence Criteria met
Small One study that included 92 students in a single school district reported evidence of effectiveness in the progressing in school domain.
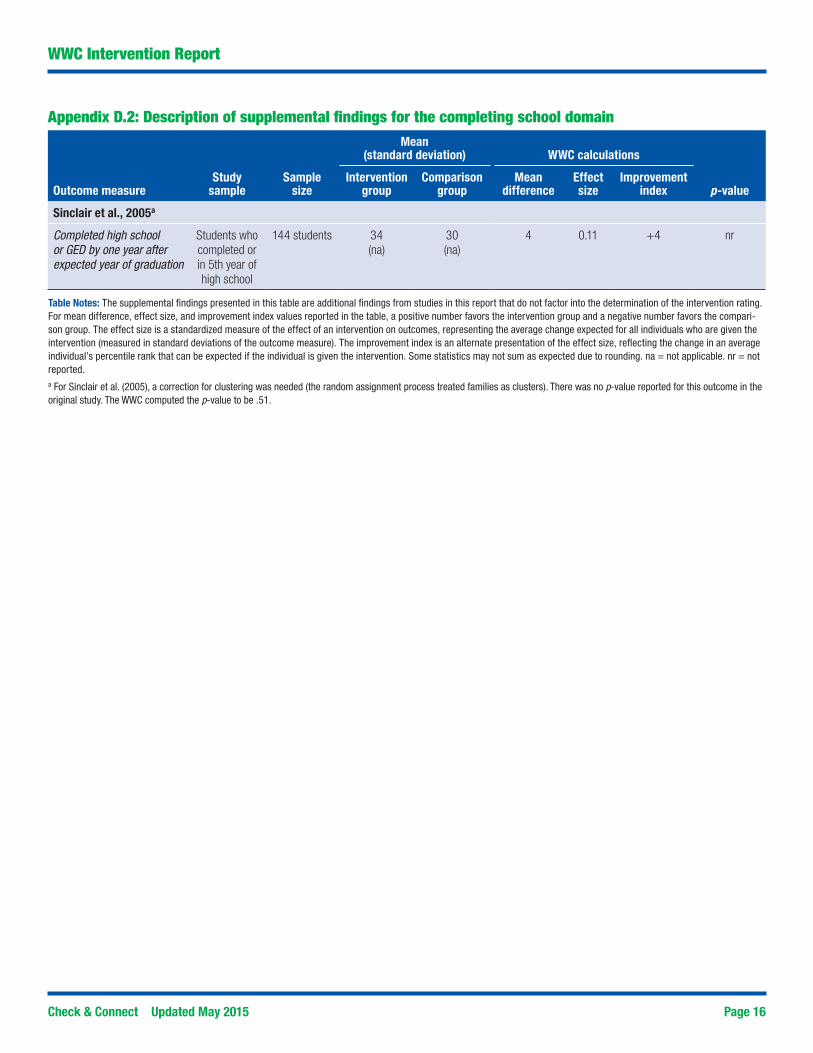
Summary of effectiveness for the completing school domainOne study that meets WWC group design standards without reservations reported findings in the completing school domain.
Sinclair et al. (2005) examined Check & Connect’s effect on whether students completed school on time (within 4 years of entering the ninth grade). The study indicated that there was no statistically significant or substantially important effect on on-time high school completion.
Thus, for the completing school domain, one study showed no discernible effects. This results in a rating of no discernible effects, with a small extent of evidence.
Table 5. Rating of effectiveness and extent of evidence for the completing school domainRating of effectiveness Criteria met
No discernible effectsNone of the studies show statistically significant or substantively important effects, either positive or negative.
In the one study that reported findings, the estimated impact of the intervention on outcomes in the completing school domain was neither statistically significant nor large enough to be substantively important.
Extent of evidence Criteria met
Small One study that included 144 students in a single school district reported evidence of effectiveness in the completing school domain.

Check & Connect Updated May 2015 Page 7
WWC Intervention Report
References
Studies that meet WWC group design standards without reservationsSinclair, M. F., Christenson, S. L., Evelo, D. L., & Hurley, C. M. (1998). Dropout prevention for youth with disabilities:
Efficacy of a sustained school engagement procedure. Exceptional Children, 65(1), 7–21.Additional sources: Christenson, S. L., Sinclair, M. F., Thurlow, M. L., & Evelo, D. (1999). Promoting student engagement with
school using the Check & Connect model. Australian Journal of Guidance and Counseling, 9(1), 169–184.Sinclair, M. F., Christenson, S. L., Lehr, C. A., & Anderson, A. R. (2003). Facilitating student engagement:
Lessons learned from Check & Connect longitudinal studies. The California School Psychologist, 8(1), 29–42.
Sinclair, M. F., Christenson, S. L., & Thurlow, M. L. (2005). Promoting school completion of urban secondary youth with emotional or behavioral disabilities. Exceptional Children, 71(4), 465–482. Additional source:Sinclair, M. F., Christenson, S. L., Evelo, D. L., Hurley, C. M., Kau, M. Y., Logan, D. T., … Westberry, D. (2001).
Persistence Plus: Using Check & Connect procedures to improve service delivery and positive post-school outcomes for secondary students with serious emotional disturbance (CDFA No. 84.237H). Minneapolis, MN: University of Minnesota, Institute on Community Integration.
Studies that meet WWC group design standards with reservationsNone.
Study that does not meet WWC group design standardsThorton, H. E. (Ed.) (1995). Staying in school: A technical report of three dropout prevention projects for middle
school students with learning and emotional disabilities. Technical report 1990–1995. ABC Dropout Preven-tion and Intervention series. Washington, DC: U.S. Department of Education. The study does not meet WWC group design standards because the measures of effectiveness cannot be attributed solely to the intervention.
Studies that are ineligible for review using the Dropout Prevention Evidence Review ProtocolAnderson, A. R., Christenson, S. L., Sinclair, M. F., & Lehr, C. A. (2004). Check & Connect: The importance of
relationships for promoting engagement with school. Journal of School Psychology, 42, 95–113. The study is ineligible for review because it does not use an eligible design.
Christenson, S. L., & Carroll, E. B. (1999). Strengthening the family-school partnership through Check & Connect. In E. Frydenberg (Ed.), Learning to cope: Developing as a person in complex societies (pp. 248–273). New York: Oxford University Press. The study is ineligible for review because it does not use an eligible design.
Kortering, L. J., & Christenson, S. (2009). Engaging students in school and learning: The real deal for school com-pletion. Exceptionality, 17, 5–15. doi:10.1080/09362830802590102 The study is ineligible for review because it does not use an eligible design.
Lehr, C. A., Hansen, A., Sinclair, M. F., & Christenson, S. L. (2003). Moving beyond dropout towards school comple-tion: An integrative review of data-based interventions. School Psychology Review, 32(3), 342–364. The study is ineligible for review because it does not use an eligible design.
Lehr, C. A., Sinclair, M. F., & Christenson, S. L. (2004). Addressing student engagement and truancy prevention during the elementary school years: A replication study of the Check & Connect model. Journal of Education for Students Placed at Risk, 9(3), 279–301. The study is ineligible for review because it does not use a sample aligned with the protocol.

Check & Connect Updated May 2015 Page 8
WWC Intervention Report
Additional sources:Sinclair, M. F., & Lehr, C. A. (2000). Dakota County: Elementary Check & Connect programs. Annual summative
program evaluation report. Minneapolis: University of Minnesota, Institute on Community Integration.Sinclair, M. F., & Lehr, C. A. (2001). Dakota County: Elementary Check & Connect programs. Program evaluation
2001 summary report. Minneapolis: University of Minnesota, Institute on Community Integration.Riccomini, P. J., Zhang, D., & Katsiyannis, A. (2005). Promising school-based interventions for reducing aggres-
sive behavior and student dropout. Journal of At-Risk Issues, 11(2), 11–16. The study is ineligible for review because it does not use an eligible design.
REL Central. (2011). Dropout prevention intervention strategies. Denver, CO: Author. The study is ineligible for review because it does not use an eligible design.
Seaton, A. T. (2010). The effects of Check & Connect on the school-related violent behaviors of African American females (Unpublished doctoral dissertation). Johns Hopkins University, Baltimore, MD. The study is ineligible for review because it is out of the scope of the protocol.
Sinclair, M. F. (2000). Check & Connect: Replication of a data-based student engagement/school completion model. New Orleans, LA: American Educational Research Association. The study is ineligible for review because it does not use an eligible design.
Sinclair, M. F., & Kaibel, C. (2002). Dakota County: Secondary Check & Connect programs. Program evaluation 2002 final summary report. Minneapolis: University of Minnesota, Institute on Community Integration. The study is ineligible for review because it does not use an eligible design.

Check & Connect Updated May 2015 Page 9
WWC Intervention Report
Appendix A.1: Research details for Sinclair et al. (1998)
Sinclair, M. F., Christenson, S. L., Evelo, D. L., & Hurley, C. M. (1998). Dropout prevention for youth with disabilities: Efficacy of a sustained school engagement procedure. Exceptional Children, 65(1), 7–21.
Table A1. Summary of findings Meets WWC group design standards without reservationsStudy findings
Outcome domain Sample sizeAverage improvement index
(percentile points) Statistically significant
Staying in school 94 students +31 Yes
Progressing in school 92 students +30 Yes
Setting The study was conducted in Minneapolis public high schools.
Study sample Participating students were enrolled in ninth grade during the 1994–95 school year and were classified with a learning, emotional, or behavioral disability. Learning disabilities were the most common classification, with 75% of participants having this classification. A little more than 40% of participants were classified as having a severe disability. Most participants were African American (59%), most were males (68%), and most participated in the free or reduced-price lunch program (71%). Students were 15-years-old, on average, when they entered ninth grade.
Intervention group
The intervention group received Check & Connect services in the seventh and eighth grades and, after being assigned to the intervention group, continued to receive the program in ninth grade. Students had their level of engagement with school (including attendance, academic performance, and disciplinary actions) recorded on a daily basis by a monitor. This person worked with the same students across several years, following them to different schools as needed. Monitors had regular interactions with all students on at least a monthly basis to discuss their educational progress, the importance of staying in school, and problem solv-ing strategies. If a monitor observed increased signs of risk, they delivered more intensive strategies tailored to the student’s needs. In this study, monitors worked 20 hours a week and maintained an average caseload of 25 students.
Comparison group
Comparison group students received Check & Connect in seventh and eighth grades but, after assignment to the comparison group, did not continue to receive these services when they entered high school. Comparison group students attended the same set of high schools attended by intervention group students.
Outcomes and measurement
The two outcomes from this study that are eligible under the WWC Dropout Prevention Pro-tocol, version 3.0 are (a) the percentage of students who had dropped out at the end of ninth grade, and (b) the number of credits earned during ninth grade. For a more detailed descrip-tion of these outcome measures, see Appendix B.
Support for implementation
Information about implementation of Check & Connect is limited in this study and focuses primarily on characteristics of the monitors and resources used to deliver the program.

Check & Connect Updated May 2015 Page 10
WWC Intervention Report
Appendix A.2: Research details for Sinclair et al. (2005)
Sinclair, M. F., Christenson, S. L., & Thurlow, M. L. (2005). Promoting school completion of urban secondary youth with emotional or behavioral disabilities. Exceptional Children, 71(4), 465–482.
Table A2. Summary of findings Meets WWC group design standards without reservationsStudy findings
Outcome domain Sample sizeAverage improvement index
(percentile points) Statistically significant
Staying in school 144 students +18 Yes
Completing school 144 students +1 No
Setting The study was conducted with eligible students in seven Minneapolis public high schools.
Study sample This replication of the Check & Connect intervention included special education students who entered ninth grade in 1996 (cohort 1) and 1997 (cohort 2). To be eligible for the intervention, partici-pants had to be classified as having an emotional or behavioral disorder. Of the 206 eligible students across the two cohorts, 164 (80%) received permission to participate in the study. Most students were African American (64%), most were males (84%), and most participated in the free or reduced-price lunch program (70%). Students were 14.5-years-old, on average, when they entered ninth grade. Within each cohort, students who were eligible and who had permission to participate in the study were randomly assigned to receive Check & Connect or to serve as a comparison group.7
Intervention group
The intervention group participated in Check & Connect for 4 years, starting in ninth grade. Of the 85 students who were assigned to the Check & Connect condition and had parental consent to participate, 71 students participated in the intervention and completed the study. Students had their attendance, behavior, and academic performance observed on a daily basis by their monitor, who also functioned as a mentor and case worker. The monitor stayed with the student even if the student transferred to another school within the district. Monitors met with students at least twice a month and more often when acute attendance, performance, or behavior problems arose.
Comparison group
Comparison group students attended the same schools as intervention students but did not receive Check & Connect.
Outcomes and measurement
The outcomes from this study that are eligible under the WWC Dropout Prevention Protocol, version 3.0 are the percentage of students who had dropped out of school at the end of the fourth year following random assignment and the percentage of students who either com-pleted high school or their GED by the end of the fourth year.8 For a more detailed description of these outcome measures, see Appendix B.
Support for implementation
Information about implementation of Check & Connect focuses primarily on the training and support provided to monitors. Monitors were overseen by a project coordinator, who was a school psychologist and former Check & Connect monitor. Monitors participated in an initial orientation workshop. They also attended weekly or biweekly staff meetings and periodic staff development sessions. Each monitor received instructions on how to complete the monitor-ing sheet to ensure consistency across monitors and settings. Monitors submitted printouts of attendance records with their monitoring sheets for verification purposes.

Check & Connect Updated May 2015 Page 11
WWC Intervention Report
Appendix B: Outcome measures for each domainStaying in school
Dropped out of school at end of first year following random assignment
Students’ dropout status at the end of the first academic year following random assignment (i.e., end of the ninth grade, because students were randomly assigned at the beginning of high school) was verified through a tracking system established for the study and drawn from various sources, including project and school staff, social workers, and probation officers, as well as the school district’s on-line database (as cited in Sinclair et al., 1998).
Dropped out of school at end of fourth year following random assignment
Students’ dropout status at the end of the fourth academic year following random assignment (i.e., senior year for those making normal progress toward graduation) was verified through a tracking system established for the study and drawn from online school records and attendance clerks (teachers, parents, and students were also consulted to verify contradictory or missing information). This measure reflects whether students had not completed high school or a GED. The authors counted students as enrolled (and thus, having not dropped out) if they transferred to another school district, a nonpublic school, or a state-approved education program, or if they were in a correctional institution (as cited in Sinclair et al., 2005).
Still enrolled in school at end of fourth year following random assignment
Similar to students’ dropout status at the end of the fourth year following random assignment, this measure reflects whether students were still enrolled in high school at the end of the fourth academic year following random assignment (i.e., senior year for those making normal progress toward graduation). If a student was still enrolled, it meant that they had not completed high school or a GED, but they also had not dropped out of school (as cited in Sinclair et al., 2005). Because this outcome represents the remainder of the students not contained in the two more commonly reported outcomes (i.e., dropped out and completed high school), and that this measure is within the same domain as the measure of student dropout (staying in school), this outcome is considered a supplemental finding and is presented in Appendix D.
Progressing in school
Total number of credits accrued during school year
Accrual of credits was collected through the district’s database. Students needed to earn an average of 15 credits per year to earn the 60 credits required for graduation (as cited in Sinclair et al., 1998).
Completing school
Completed high school diploma or GED Students’ graduation with a standard diploma or a GED certificate (as cited in Sinclair et al., 2005) was deter-mined at end of the fourth academic year after random assignment (i.e., senior year for those making normal progress toward graduation). High school diploma receipt was verified through school district records. GED completion was verified independently by the State Department of Education.
Check & Connect Updated May 2015 Page 12
WWC Intervention Report
Appendix C.1: Findings included in the rating for the staying in school domain
Mean(standard deviation) WWC calculations
Outcome measureStudy
sampleSample
sizeIntervention
groupComparison
groupMean
differenceEffect size
Improvement index p-value
Sinclair et al., 1998a
Percentage dropped out at the end of the first year after random assignment
Grade 9 94 students 9 (29)
30 (46)
21 0.89 +31 < .01
Domain average for staying in school (Sinclair et al., 1998) 21 0.89 +31 Statistically significant
Sinclair et al., 2005b
Percentage dropped out at the end of the fourth year after random assignment
Grade 12 144 students 39(49)
58(49)
19 0.47 +18 < .01
Domain average for staying in school (Sinclair et al., 2005) 19 0.47 +18 Statistically significant
Domain average for staying in school across all studies 20 0.68 +25 na
Table Notes: For mean difference, effect size, and improvement index values reported in the table, a positive number favors the intervention group and a negative number favors the comparison group. The effect size is a standardized measure of the effect of an intervention on outcomes, representing the average change expected for all individuals who are given the intervention (measured in standard deviations of the outcome measure). The improvement index is an alternate presentation of the effect size, reflecting the change in an average individual’s percentile rank that can be expected if the individual is given the intervention. The WWC-computed average effect size is a simple average rounded to two decimal places; the average improvement index is calculated from the average effect size. The statistical significance of each study’s domain average was determined by the WWC. Some statistics may not sum as expected due to rounding. na = not applicable.a For Sinclair et al. (1998), no corrections for clustering or multiple comparisons were needed. The p-value presented here was reported in the original study. For the percentage of students that dropped out of school at the end of ninth grade, the WWC presents the mean difference of 21 percentage points as a positive number, so that this impact represents a favorable result for the intervention condition (since the intervention group had a lower percentage of students who dropped out relative to the comparison group).This study is characterized as having a statistically significant positive effect because the effect for at least one measure within the domain is positive and statistically significant, and no effects are negative and statistically significant. For more information, please refer to the WWC Standards and Procedures Handbook (version 3.0), p. 26.b For Sinclair et al. (2005), a correction for clustering was needed (the random assignment process treated families as clusters) but did not affect whether any of the contrasts were found to be statistically significant. The p-value presented here was reported in the original study. For the percentage of students that dropped out of school at the end of the fourth year after random assignment, the WWC presents the mean difference of 19 percentage points as a positive number, so that this impact represents a favorable result for the interven-tion condition (since the intervention group had a lower percentage of students who dropped out relative to the comparison group). This study is characterized as having a statistically significant positive effect because the effect for at least one measure within the domain is positive and statistically significant, and no effects are negative and statistically significant. For more information, please refer to the WWC Standards and Procedures Handbook (version 3.0), p. 26.
Check & Connect Updated May 2015 Page 13
WWC Intervention Report
Appendix C.2: Findings included in the rating for the progressing in school domain
Mean(standard deviation) WWC calculations
Outcome measureStudy
sampleSample
sizeIntervention
groupComparison
groupMean
differenceEffect size
Improvement index p-value
Sinclair et al., 1998a
Total number of credits accrued
Grade 9 92 students 12.13 (6.56)
6.63(6.63)
5.50 0.83 +30 < .01
Domain average for progressing in school (Sinclair et al., 1998) 5.50 0.83 +30 Statistically significant
Domain average for progressing in school across all studies 5.50 0.83 +30 na
Table Notes: For mean difference, effect size, and improvement index values reported in the table, a positive number favors the intervention group and a negative number favors the comparison group. The effect size is a standardized measure of the effect of an intervention on outcomes, representing the average change expected for all individuals who are given the intervention (measured in standard deviations of the outcome measure). The improvement index is an alternate presentation of the effect size, reflecting the change in an average individual’s percentile rank that can be expected if the individual is given the intervention. The statistical significance of the study’s domain average was determined by the WWC. Some statistics may not sum as expected due to rounding. na = not applicable.a For Sinclair et al. (1998), no corrections for clustering or multiple comparisons were needed. The p-value presented here was reported in the original study. This study is character-ized as having a statistically significant positive effect because the effect for at least one measure within the domain is positive and statistically significant, and no effects are negative and statistically significant. For more information, please refer to the WWC Standards and Procedures Handbook (version 3.0), p. 26.

Check & Connect Updated May 2015 Page 14
WWC Intervention Report
Appendix C.3 Findings included in the rating for the completing school domain
Mean(standard deviation) WWC calculations
Outcome measureStudy
sampleSample
sizeIntervention
groupComparison
groupMean
differenceEffect size
Improvement index p-value
Sinclair et al., 2005a
Completed high school or GED on time
Grade 12 144 students 30 (46)
29(45)
1 0.03 +1 > .05
Domain average for completing school (Sinclair et al., 2005) 1 0.03 +1 Notstatistically significant
Domain average for completing school across all studies 1 0.03 +1 na
Table Notes: For mean difference, effect size, and improvement index values reported in the table, a positive number favors the intervention group and a negative number favors the comparison group. The effect size is a standardized measure of the effect of an intervention on outcomes, representing the average change expected for all individuals who are given the intervention (measured in standard deviations of the outcome measure). The improvement index is an alternate presentation of the effect size, reflecting the change in an average individual’s percentile rank that can be expected if the individual is given the intervention. The statistical significance of the study’s domain average was determined by the WWC. Some statistics may not sum as expected due to rounding. na = not applicable.a For Sinclair et al. (2005), a correction for clustering was needed (the random assignment process treated families as clusters) but did not affect whether the contrasts were found to be statistically significant. The p-value presented here was reported in the original study. This study is characterized as having an indeterminate effect because the mean effect is neither statistically significant nor substantively important. For more information, please refer to the WWC Standards and Procedures Handbook (version 3.0), p. 26.

Check & Connect Updated May 2015 Page 15
WWC Intervention Report
Appendix D.1: Description of supplemental findings for the staying in school domain
Mean(standard deviation) WWC calculations
Outcome measureStudy
sampleSample
sizeIntervention
groupComparison
groupMean
differenceEffect size
Improvement index p-value
Sinclair et al., 2005a
Percentage still enrolled at the end of the fourth year after random assignment
Grade 12 144 students 31 (46)
14(35)
17 0.62 +23 nr
Table Notes: The supplemental findings presented in this table are additional findings from studies in this report that do not factor into the determination of the intervention rating. For mean difference, effect size, and improvement index values reported in the table, a positive number favors the intervention group and a negative number favors the compari-son group. The effect size is a standardized measure of the effect of an intervention on outcomes, representing the average change expected for all individuals who are given the intervention (measured in standard deviations of the outcome measure). The improvement index is an alternate presentation of the effect size, reflecting the change in an average individual’s percentile rank that can be expected if the individual is given the intervention. Some statistics may not sum as expected due to rounding. nr = not reported. a For Sinclair et al. (2005), a correction for clustering was needed (the random assignment process treated families as clusters). There was no p-value reported for this outcome in the original study. The WWC computed to the p-value to be < .001.
Check & Connect Updated May 2015 Page 16
WWC Intervention Report
Appendix D.2: Description of supplemental findings for the completing school domain
Mean(standard deviation) WWC calculations
Outcome measureStudy
sampleSample
sizeIntervention
groupComparison
groupMean
differenceEffect size
Improvement index p-value
Sinclair et al., 2005a
Completed high school or GED by one year after expected year of graduation
Students who completed or in 5th year of high school
144 students 34 (na)
30(na)
4 0.11 +4 nr
Table Notes: The supplemental findings presented in this table are additional findings from studies in this report that do not factor into the determination of the intervention rating. For mean difference, effect size, and improvement index values reported in the table, a positive number favors the intervention group and a negative number favors the compari-son group. The effect size is a standardized measure of the effect of an intervention on outcomes, representing the average change expected for all individuals who are given the intervention (measured in standard deviations of the outcome measure). The improvement index is an alternate presentation of the effect size, reflecting the change in an average individual’s percentile rank that can be expected if the individual is given the intervention. Some statistics may not sum as expected due to rounding. na = not applicable. nr = not reported.a For Sinclair et al. (2005), a correction for clustering was needed (the random assignment process treated families as clusters). There was no p-value reported for this outcome in the original study. The WWC computed the p-value to be .51.

Check & Connect Updated May 2015 Page 17
Endnotes
WWC Intervention Report
1 The descriptive information for this program was obtained from a publicly available source: the program’s website (http://ici.umn.edu/checkandconnect, downloaded September 2014). The WWC requests developers review the program description sections for accuracy from their perspective. The program description was provided to the developer in September 2014, and the WWC incorpo-rated feedback from the developer. Further verification of the accuracy of the descriptive information for this program is beyond the scope of this review. 2 The literature search reflects documents publicly available by March 2014. The previous report was released in September 2006. This report has been updated to include reviews of three studies that have been released since 2006 and four studies that were released prior to 2006 but were not included in the earlier report. Of the additional studies, seven were not within the scope of the review proto-col for Dropout Prevention. A complete list and disposition of all studies reviewed are provided in the references.
The report includes reviews of all previous studies that met WWC group design standards with or without reservations and resulted in a revised disposition of the Sinclair et al. (2005) study. The study received a disposition in this report of meets WWC group design standards without reservations, where it had previously received the rating of meets WWC evidence standards with reservations. This revised disposition is due to a change in the WWC group design standards. In particular, the attrition boundaries have changed since version 1.0 of the WWC Procedures and Standards Handbook, and the level of overall attrition for this study now falls within the acceptable threshold.
The studies in this report were reviewed using the Standards from the WWC Procedures and Standards Handbook (version 3.0), along with those described in the Dropout Prevention review protocol (version 3.0). The evidence presented in this report is based on avail-able research. Findings and conclusions may change as new research becomes available.
3 The Check & Connect model indicates that it is designed for “students showing early warning signs of disengagement from school or at risk of dropping out.” It does not require that participating students receive special education services. However, the original stud-ies of Check & Connect by the University of Minnesota were funded by the U.S. Office of Special Education and focused on students receiving special education services. 4 For criteria used in the determination of the rating of effectiveness and extent of evidence, see the WWC Rating Criteria on p. 18. These improvement index numbers show the average and range of student-level improvement indices for all findings across the studies.5 Sinclair, M., & Kaibel, C. (2002). Dakota County: School success Check and Connect program evaluation, 2002 final summary report. Minneapolis: University of Minnesota, Institute on Community Integration.6 Students’ enrollment status was available for all 94 students. However, data on credits accrued in ninth grade were not available for two students in the comparison group, resulting in an analytic sample of 92 students for this outcome.7 The study was designed as a randomized controlled trial. Random assignment was conducted at the family level. Siblings were assigned either to the intervention or comparison group. This assignment procedure created a correlation between siblings and required a statistical adjustment.8 In addition, the study also reported on two outcomes that did not factor into the determination of the intervention rating. First, the study reported on the number of students still enrolled in high school at the end of the fourth year. Because this group represents the remainder of the students not contained in the two more commonly reported outcomes (i.e., dropped out and completed high school), and that this measure is within the same domain as the measure of student dropout (staying in school), a decision was made to present it as a supplementary finding (Appendix D.1). Second, the study reported on completion rates at the end of the fifth year among a subsample of students in the first cohort who remained active participants in the study. For this outcome, the WWC constructed a measure of the high school completion rates by the end of the fifth year by combining this fifth year completion rate with the results for on-time graduation; these results are presented in Appendix D.2 as a supplemental finding.
Recommended CitationU.S. Department of Education, Institute of Education Sciences, What Works Clearinghouse. (2015, May).
Dropout Prevention intervention report: Check & Connect. Retrieved from http://whatworks.ed.gov

Check & Connect Updated May 2015 Page 18
WWC Intervention Report
WWC Rating Criteria
Criteria used to determine the rating of a studyStudy rating Criteria
Meets WWC group design standards without reservations
A study that provides strong evidence for an intervention’s effectiveness, such as a well-implemented RCT.
Meets WWC group design standards with reservations
A study that provides weaker evidence for an intervention’s effectiveness, such as a QED or an RCT with high
attrition that has established equivalence of the analytic samples.
Criteria used to determine the rating of effectiveness for an interventionRating of effectiveness Criteria
Positive effects Two or more studies show statistically significant positive effects, at least one of which met WWC evidence standards for a strong design, ANDNo studies show statistically significant or substantively important negative effects.
Potentially positive effects At least one study shows a statistically significant or substantively important positive effect, ANDNo studies show a statistically significant or substantively important negative effect AND fewer or the same number of studies show indeterminate effects than show statistically significant or substantively important positive effects.
Mixed effects At least one study shows a statistically significant or substantively important positive effect AND at least one study shows a statistically significant or substantively important negative effect, but no more such studies than the number showing a statistically significant or substantively important positive effect, OR
At least one study shows a statistically significant or substantively important effect AND more studies show an indeterminate effect than show a statistically significant or substantively important effect.
Potentially negative effects One study shows a statistically significant or substantively important negative effect and no studies show a statistically significant or substantively important positive effect, ORTwo or more studies show statistically significant or substantively important negative effects, at least one study shows a statistically significant or substantively important positive effect, and more studies show statistically significant or substantively important negative effects than show statistically significant or substantively important positive effects.
Negative effects Two or more studies show statistically significant negative effects, at least one of which met WWC evidence standards for a strong design, ANDNo studies show statistically significant or substantively important positive effects.
No discernible effects None of the studies shows a statistically significant or substantively important effect, either positive or negative.
Criteria used to determine the extent of evidence for an interventionExtent of evidence Criteria
Medium to large The domain includes more than one study, ANDThe domain includes more than one school, ANDThe domain findings are based on a total sample size of at least 350 students, OR, assuming 25 students in a class, a total of at least 14 classrooms across studies.
Small The domain includes only one study, ORThe domain includes only one school,The domain findings are based on a total sample size of fewer than 350 students, AND, assuming 25 students
OR
in a class, a total of fewer than 14 classrooms across studies.
Check & Connect Updated May 2015 Page 19
WWC Intervention Report
Glossary of Terms
Attrition Attrition occurs when an outcome variable is not available for all participants initially assigned to the intervention and comparison groups. The WWC considers the total attrition rate and the difference in attrition rates across groups within a study.
Clustering adjustment If intervention assignment is made at a cluster level and the analysis is conducted at the student level, the WWC will adjust the statistical significance to account for this mismatch, if necessary.
Confounding factor A confounding factor is a component of a study that is completely aligned with one of the study conditions, making it impossible to separate how much of the observed effect was due to the intervention and how much was due to the factor.
Design The design of a study is the method by which intervention and comparison groups were assigned.
Domain A domain is a group of closely related outcomes.
Effect size The effect size is a measure of the magnitude of an effect. The WWC uses a standardized measure to facilitate comparisons across studies and outcomes.
Eligibility A study is eligible for review and inclusion in this report if it falls within the scope of the review protocol and uses either an experimental or matched comparison group design.
Equivalence A demonstration that the analytic sample groups are similar on observed characteristics defined in the review area protocol.
Extent of evidence An indication of how much evidence supports the findings. The criteria for the extent of evidence levels are given in the WWC Rating Criteria on p. 18.
Improvement index Along a percentile distribution of individuals, the improvement index represents the gain or loss of the average individual due to the intervention. As the average individual starts at the 50th percentile, the measure ranges from –50 to +50.
Intervention An educational program, product, practice, or policy aimed at improving student outcomes.
Intervention report A summary of the findings of the highest-quality research on a given program, product, practice, or policy in education. The WWC searches for all research studies on an interven-tion, reviews each against design standards, and summarizes the findings of those that meet WWC design standards.
Multiple comparison adjustment
When a study includes multiple outcomes or comparison groups, the WWC will adjust the statistical significance to account for the multiple comparisons, if necessary.
Quasi-experimental design (QED)
A quasi-experimental design (QED) is a research design in which study participants are assigned to intervention and comparison groups through a process that is not random.
Randomized controlledtrial (RCT)
A randomized controlled trial (RCT) is an experiment in which eligible study participants are randomly assigned to intervention and comparison groups.
Rating of effectiveness The WWC rates the effects of an intervention in each domain based on the quality of the research design and the magnitude, statistical significance, and consistency in findings. The criteria for the ratings of effectiveness are given in the WWC Rating Criteria on p. 18.
Single-case design A research approach in which an outcome variable is measured repeatedly within and across different conditions that are defined by the presence or absence of an intervention.
Check & Connect Updated May 2015 Page 20
WWC Intervention Report
Glossary of Terms
Standard deviation The standard deviation of a measure shows how much variation exists across observations in the sample. A low standard deviation indicates that the observations in the sample tend to be very close to the mean; a high standard deviation indicates that the observations in the sample tend to be spread out over a large range of values.
Statistical significance Statistical significance is the probability that the difference between groups is a result of chance rather than a real difference between the groups. The WWC labels a finding statistically significant if the likelihood that the difference is due to chance is less than 5% ( p < .05).
Substantively important A substantively important finding is one that has an effect size of 0.25 or greater, regardless of statistical significance.
Systematic review A review of existing literature on a topic that is identified and reviewed using explicit meth-ods. A WWC systematic review has five steps: 1) developing a review protocol; 2) searching the literature; 3) reviewing studies, including screening studies for eligibility, reviewing the methodological quality of each study, and reporting on high quality studies and their find-ings; 4) combining findings within and across studies; and, 5) summarizing the review.
Please see the WWC Procedures and Standards Handbook (version 3.0) for additional details.

Check & Connect Updated May 2015 Page 21
WWC Intervention Report
Intervention Report
Practice Guide
Quick Review
Single Study Review
An intervention report summarizes the findings of high-quality research on a given program, practice, or policy in education. The WWC searches for all research studies on an intervention, reviews each against evidence standards, and summarizes the findings of those that meet standards.